

The 3D Elevation Program—Supporting Maine’s Economy
Links
- Document: Report (1.15 MB pdf) , HTML , XML
- Download citation as: RIS | Dublin Core
Introduction
Inland flooding, sea-level rise, and pollution pose challenges for Maine’s infrastructure and natural resources. A highly detailed, three-dimensional (3D) model of the Earth’s surface is allowing the State of Maine to address these challenges and opportunities in an increasingly comprehensive and timely manner. In addition, highly accurate elevation data facilitate land development, forest management, agricultural practices, and wildlife conservation, all of which are key pillars of Maine’s economy.
The Maine Library of Geographic Information (2019, p. 10), in its annual report for 2018, states that “elevation data are having a transformative effect on land development costs for private and public sectors in Maine’s economy.” Critical applications that meet the State’s management needs depend on light detection and ranging (lidar) data that provide a highly detailed 3D model of the Earth’s surface and aboveground features.
The 3D Elevation Program (3DEP; see sidebar) is managed by the U.S. Geological Survey (USGS) in partnership with Federal, State, Tribal, U.S. territorial, and local agencies to acquire consistent lidar coverage at quality level 2 or better (table 1) to meet the many needs of the Nation and Maine. The status of available and in-progress 3DEP baseline lidar data in Maine is shown in figure 1. 3DEP baseline lidar data include quality level 2 or better, 1-meter or better digital elevation models, and lidar point clouds, and must meet the Lidar Base Specification version 1.2 (https://www.usgs.gov/3dep/lidarspec) or newer requirements. The National Enhanced Elevation Assessment (Dewberry, 2012) identified user requirements and conservatively estimated that availability of lidar data would result in at least $4.7 million in new benefits annually to the State. The top eight Maine business uses for 3D elevation data, which are based on the estimated annual conservative benefits of 3DEP, are shown in table 2.
Table 1.
Data quality levels, pulse spacing, and pulse density. Quality level 2 or better lidar data meet 3DEP requirements.[Specifications for quality level 0 (QL0) are from Heidemann (2012, p. 3 and table 1); for quality levels 1 and 2, specifications are from Sugarbaker and others (2014, table 1). In the quality level column, QL0 represents the highest level of quality. RMSEz, root mean square error in the elevation (z) dimension; cm, centimeter; m, meter; pls/m2, first return pulses per square meter; ≤, less than or equal to; ≥, greater than or equal to]
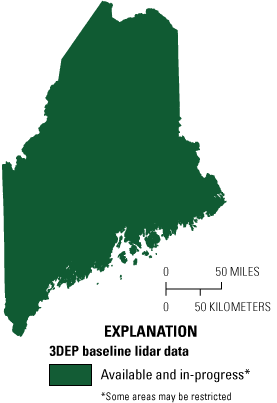
Map of Maine showing status of 3D Elevation Program (3DEP) baseline lidar data as of August 2022. Visit https://usgs.gov/NationalMap/LidarExplorer to find and download currently available data.
Flood Risk Management
Many documented business uses benefit from increasing the availability of and access to highly accurate lidar data in Maine. For example, the Maine Floodplain Management Program works with individuals, communities, and flood-plain management professionals to reduce the risk of flooding by directing development outside of flood zones. More than 9,000 flood insurance policies are in effect in Maine, with coverage totaling over $1.9 billion for property deemed at risk (Maine Department of Agriculture, Conservation, and Forestry, 2021). Accurate lidar data could improve community flood maps (fig. 2), enable a better assessment of properties at risk, and possibly reduce insurance rates.
Table 2.
Conservative benefits estimates for the top eight Maine business uses of the proposed 3DEP data identified in the National Enhanced Elevation Assessment (Dewberry, 2012).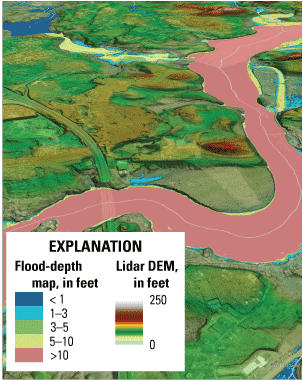
Flood-depth map combined with a digital elevation model (DEM) of the landscape. Opaque colors represent areal extent and depth of flooding of the main river and tributaries, while transparent colors on the DEM represent elevation of the land surface. Gray line in the river is the centerline. This kind of map can be used to support the development of new community flood-zone maps. Graphic by Luke Sturtevant, U.S. Geological Survey.
Natural Resources Conservation
Forty-eight percent of the water consumed by the public in Maine comes from surface-water utilities (Maine Division of Environmental and Community Health, 2023). Organizations responsible for the quantity and quality of the State’s water supply have the potential to make better watershed delineations and decisions using lidar data. Accurate watershed delineation is required for estimating stormwater runoff in small urban watersheds and for defining and managing point and non-point sources of pollution. Lidar increases Maine’s ability to protect natural resources and to steward related recreational opportunities.
Coastal Zone Management
The fishing industry in Maine is reliant on long-term coastal zone management. Mapping intertidal zone elevations, sea-floor bathymetry, and upland topography, coupled with a seamless integration of these data, is vital for effective management of the coastal zone. In 2017 the lobster industry supply chain contributed $1 billion to the State’s economy, and the total value of landed lobsters was $433 million (Island Institute, 2018). Lidar has the potential to improve coastal hazards modeling, identification and analysis of impervious surfaces, and development of resiliency plans and storm response plans, all of which protect Maine’s shoreline and the fishing industry.
Forest Resources Management
The forest products industry is a direct beneficiary of the widespread availability of public lidar data. A 2016 Maine Forest Products Council report (Crandall and Anderson, 2016) estimated the statewide annual economic impact of the forest products industry to be $8.5 billion in sales output and $1.8 billion in labor income, with 33,538 supported full- or part-time positions. Three-dimensional lidar point clouds are used by foresters to calculate biomass, differentiate tree types, and map terrain suitable for wildlife habitats, such as deer wintering areas. Management of forest activities also requires change detection in aboveground vegetation and wet-area mapping, which are greatly enhanced with accurate digital elevation models and classified lidar point clouds.
3D Elevation Program (3DEP)
The 3D Elevation Program is managed by the U.S. Geological Survey (USGS) on behalf of the community of Federal, State, Tribal, local, and other partners and users of elevation data. In response to growing needs for high-quality elevation data, the goal of 3DEP is to complete acquisition of nationwide light detection and ranging (lidar) data (interferometric synthetic aperture radar [IfSAR] data in Alaska) to provide the first-ever national baseline of consistent, high-resolution topographic elevation data—both bare-earth digital elevation models and 3D point clouds.
Benefits
-
• Economies of scale by acquiring data for larger areas.
-
• Predictable and flexible Federal investments that reduce costs and allow better planning.
-
• Consistent national coverage that provides data for applications that span project, jurisdictional, and watershed boundaries.
-
• Simplified data acquisition that provides contracts, project management, quality assurance, and published data specifications.
-
• National benefits of $690 million per year conservatively, with the potential to generate $13 billion per year in additional benefits through applications that span the economy (Dewberry, 2012).
High-Quality Data and Products
3DEP lidar data provide coverage with a minimum of two points per square meter and a vertical error not to exceed 10 centimeters, measured as root mean square error in the elevation (z) dimension (RMSEz) (see table 1). 3DEP baseline lidar data products include all data points collected (point clouds) and bare-earth digital elevation models with a 1-meter or better resolution. The USGS integrates the elevation data into The National Map. Data are available free of charge and without use restrictions. To download 3DEP products visit https://apps.nationalmap.gov/downloader/.
Ways to Participate
Participation in 3DEP is open to Federal, State, Tribal, U.S. territorial, and local government partners, as well as private sector partners, and offers the option to acquire higher quality data. Partners may contribute funds toward projects managed by the USGS, or they may receive cooperative funds to manage their own projects. An annual Broad Agency Announcement is the mechanism used to establish partner agreements. Organizations and the private sector may contribute existing data that meet 3DEP requirements. For more information refer to the 3DEP website at https://usgs.gov/3DEP/collaborate/.
References Cited
Crandall, M., and Anderson, J.L., III, 2016, Economic contribution of Maine’s forest products industry, 2014 and 2016 (estimated): University of Maine, School of Forest Resources, report, 11 p., June 30, 2016, accessed August 11, 2021, at https://digitalcommons.library.umaine.edu/sfr_facpub/3/.
Dewberry, 2012, Final report of the National Enhanced Elevation Assessment (revised March 29, 2012): Fairfax, Va., Dewberry, 84 p. plus appendixes, accessed August 11, 2021, at https://www.dewberry.com/services/geospatial/national-enhanced-elevation-assessment.
Heidemann, H.K., 2012, Lidar base specification (ver. 1.2, November 2014): U.S. Geological Survey Techniques and Methods, book 11, chap. B4, 67 p. with appendixes, accessed August 11, 2021, at https://doi.org/10.3133/tm11B4.
Island Institute, 2018, Waypoints—Community indicators: Livelihoods on Maine’s coast and islands: Rockland, Maine, Island Institute, July 2018, 20 p., accessed August 31, 2023, at https://www.islandinstitute.org/waypoints/.
Maine Department of Agriculture, Conservation, and Forestry, 2021, Floodplain Management Program: Maine Department of Agriculture, Conservation, and Forestry web page, accessed August 31, 2023, at https://www.maine.gov/dacf/flood/.
Maine Division of Environmental and Community Health, 2023, Surface water sources: Maine Department of Health and Human Services web page, accessed February 22, 2023, at https://www.maine.gov/dhhs/mecdc/environmental-health/dwp/sitemap/surfaceWater.shtml.
Maine Library of Geographic Information, 2019, FY 2018 annual report: Maine Library of Geographic Information, 26 p., accessed August 12, 2021, at https://www.maine.gov/geolib/reports/2018-GeoLibraryAnnualReport-FINAL.PDF.
Sugarbaker, L.J., Constance, E.W., Heidemann, H.K., Jason, A.L., Lukas, V., Saghy, D.L., and Stoker, J.M., 2014, The 3D Elevation Program initiative—A call for action: U.S. Geological Survey Circular 1399, 35 p., accessed August 12, 2021, at https://doi.org/10.3133/cir1399.
For Further Information:
Director, National Geospatial Program
U.S. Geological Survey, MS 511
12201 Sunrise Valley Drive
Reston, VA 20192
Email: 3DEP@usgs.gov
USGS National Map Liaison:
Rena Kalmon; Email: rkalmon@usgs.gov
Disclaimers
Any use of trade, firm, or product names is for descriptive purposes only and does not imply endorsement by the U.S. Government.
Although this information product, for the most part, is in the public domain, it also may contain copyrighted materials as noted in the text. Permission to reproduce copyrighted items must be secured from the copyright owner.
Suggested Citation
Walters, D.H., 2023, The 3D Elevation Program—Supporting Maine’s economy: U.S. Geological Survey Fact Sheet 2023–3036, 2 p., https://doi.org/10.3133/fs20233036
ISSN: 2327-6932 (online)
Study Area
| Publication type | Report |
|---|---|
| Publication Subtype | USGS Numbered Series |
| Title | The 3D Elevation Program—Supporting Maine’s economy |
| Series title | Fact Sheet |
| Series number | 2023-3036 |
| DOI | 10.3133/fs20233036 |
| Publication Date | November 03, 2023 |
| Year Published | 2023 |
| Language | English |
| Publisher | U.S. Geological Survey |
| Publisher location | Reston, VA |
| Contributing office(s) | National Geospatial Program |
| Description | 2 p. |
| Country | United States |
| State | Maine |
| Online Only (Y/N) | Y |
| Additional Online Files (Y/N) | N |