

Spatial Distribution of Elevation Change Monitoring in Coastal Wetlands Across Protected Lands of the Lower 48 United States
Links
- Document: Report (1.55 MB pdf) , HTML , XML
- NGMDB Index Page: National Geologic Map Database Index Page (html)
- Download citation as: RIS | Dublin Core
Introduction
Tidally influenced coastal wetlands, both saline and fresh, appear where terrestrial and marine environments meet and are considered important ecosystems for identifying the impacts of climate change. Coastal wetlands provide valuable benefits to society and the environment in the form of flood protection, water-quality improvements, and shoreline erosion reduction, making them one of the most important ecosystems in the world (Barbier, 2013). Historically, these ecosystems have vertically adjusted to match rising sea levels through biologic and physical processes (Kirwan and Guntenspergen, 2012), but they are increasingly vulnerable to submergence as sea-level rise accelerates (Saintilan and others, 2022). Measuring vertical change on lands protected from human influence allows scientists to understand how vulnerable coastal wetlands are to submergence. But to fully understand this vulnerability, scientists must identify where vertical change in coastal wetlands is being measured across the lower 48 United States, a task that has not yet been undertaken. In this Fact Sheet, we document the spatial distribution of vertical change measurements in coastal wetlands to inform where gaps may still be in the Surface Elevation Table–Marker Horizon (SET-MH) coverage within protected lands across the lower 48 United States.
How Is Elevation Change in Coastal Wetlands Measured?
The SET-MH method is a global standard that provides a nondestructive way to make highly accurate and precise measurements of sediment elevation of coastal wetlands over long periods of time relative to a fixed point (U.S. Geological Survey, 2018; fig. 1). Marker horizons, deposited layers of clay distinct from the wetland soil (fig. 1A, 1B), are used to measure how much sediment and organic matter have accumulated on the marsh surface between measurements. Combining such measurements with those taken with a rod surface elevation table (fig. 1A, 1C) quantifies surface elevation change by measuring the processes that control wetland soil elevation.
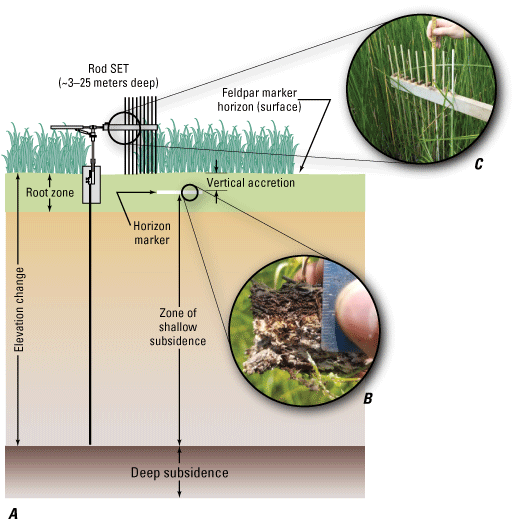
A, Diagram showing an example of a Surface Elevation Table–Marker Horizon station, which can be used to make high precision measurements of elevation change, biologic and sedimentologic accretion, and subsidence in coastal wetlands (modified from U.S. Geological Survey, 2018). B, Photograph showing accretion above feldspar marker horizon. C, Photograph showing Surface Elevation Table (SET) being used to measure elevation change via the nine pins on the SET arm, averaged over the arm and four different directions the arm can face. Photographs by Celina Balderas Guzmán, University of Washington.
It is estimated that thousands of SET-MH stations have been installed along the coastline of the lower 48 United States, but the distribution of the stations, especially across protected and managed lands, has not been synthesized across management agencies. SET-MH installations are managed by many different organizations, making a single map of SET-MH station locations difficult to obtain, if not impossible. This Fact Sheet is an attempt to better document the location of SET-MH stations situated on lands protected from human development across the lower 48 United States. We do this by synthesizing location data from previously published peer review literature articles (Feher and others, 2022; Moon and others, 2022; Saintilan and others, 2022; Moorman and others, 2023) and combining them with publicly available data on protected lands (U.S. Geological Survey, 2022).
What Are Protected Lands?
The Protected Areas Database for the United States (PAD-US) is the official inventory of marine and terrestrial protected areas, “dedicated to the preservation of biological diversity and other natural, recreation and cultural uses [including extraction], managed for these purposes through legal or other effective means” (U.S. Geological Survey, 2022). This inventory lists lands protected by Federal, State, and non-profit organizations, and other management entities. Some of the protected areas within it are U.S. National Wildlife Refuges, National Parks, National Estuarine Research Reserves, or State and local parks and preserves. The PAD-US database was used as a tool to determine how many SET-MH stations from a nationwide database fell within protected lands by overlaying the SET-MH station locations onto the protected land locations.
How Many Protected Lands Are Measuring Coastal Wetland Elevation Change?
A first step in understanding a protected wetland’s risk of submergence as sea-level rise accelerates is through spatial understanding of where coastal wetland elevation change is being measured. The U.S. Geological Survey and its collaborators at the National Park Service, National Estuarine Research Reserves, and U.S. Fish and Wildlife Service have installed SET-MH stations and have been monitoring wetland elevation change for many years. The stations documented here are a subset of 980 SET-MH stations (Feher and others, 2022; Moon and others, 2022; Saintilan and others, 2022; Moorman and others, 2023) that
-
(1) have on average been measured for 9 years, but span 3–30 years,
-
(2) measure elevation change in tidal freshwater forested wetlands, salt marshes, or mangrove forests, and
-
(3) have not been experimentally manipulated.
Because of our selection criteria for SET-MH stations, the number of SET-MH installations listed in our database that are situated on protected lands across the United States is conservative. It is, however, important to have these criteria for selection because many SET-MH stations have been installed for experimental purposes, are too young to provide reliable trends, or may be in coastal areas outside of the influence of tides.
Of the 980 SET-MH stations within our database, 646 of them are on protected lands (fig. 2) but are managed by different organizations (fig. 3). Within the dataset, most stations (380) are on lands under Federal jurisdiction, followed by State managed areas (117) and areas managed by multiple groups (112). Of these 646 protected SET-MH stations, 55 percent of them are sited in saltmarshes according to data from the National Wetlands Inventory (U.S Fish and Wildlife Service, 2019; fig. 4). SET-MH stations sited in subtidal habitats, or habitats below the lowest tidal limit, make up another 18 percent (fig. 4). Freshwater forested wetlands and freshwater marshes together make up 13 percent of protected wetlands, while mangroves and tidal flats make up 6 and 3 percent, respectively. Five percent of SET-MH stations on protected lands fall into the “other” category (fig. 4).
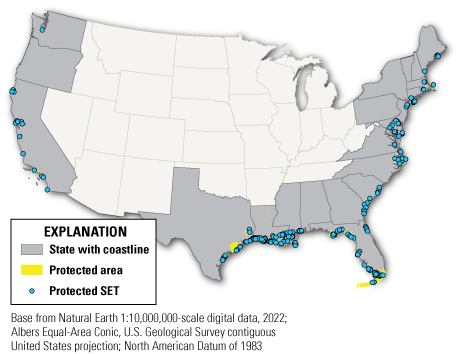
Map showing the relative density of protected Surface Elevation Tables (SETs) across the lower 48 United States. The map shows the relative density of protected SET-MH stations across each coast and is a subset of the 980 stations from the larger, nationwide database comprised of data from Moorman and others (2023), Feher and others (2022), Moon and others (2022), and Saintilan and others (2022).
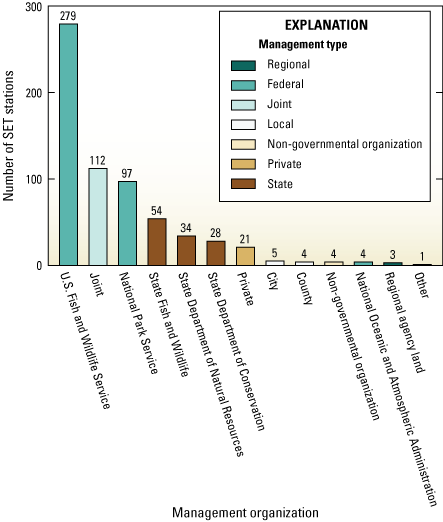
Bar graph showing how Surface Elevation Table (SET) stations on protected lands are distributed across 13 management entities.
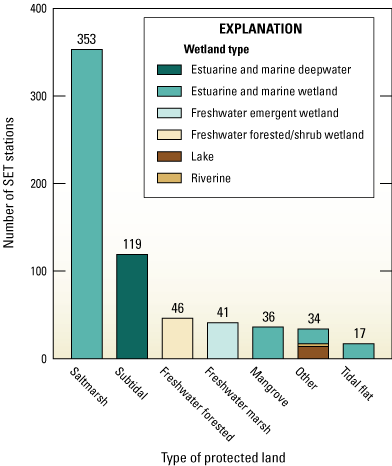
Bar graph organizing Surface Elevation Table (SET) stations on protected lands (x-axis) by wetland type (legend shading) described by the National Wetland Inventory Type (U.S. Fish and Wildlife Service, 2019).
Benefits of SET-MH Stations Being on Protected Lands
Long-term records of elevation change across protected areas have the ability to influence management decisions as coastal wetlands across the United States become increasingly susceptible to loss by submergence. An understanding of which protected lands are losing elevation fastest enables identification of high priority management areas for intervention or actions. By documenting the widespread distribution of these SET-MH stations across protected areas, we may be taking a first step in facilitating the formation of networks of collaborators monitoring elevation change across broader scales. Assessments of the distribution of SET-MH stations across ecologically relevant abiotic gradients can inform managers, where monitoring is missing along these different gradients.
References Cited
Barbier, E. B., 2013, Valuing ecosystem services for coastal wetland protection and restoration—Progress and challenges: Resources, v. 2, no. 3 (special issue), p. 213–230, accessed May 2023, at https://doi.org/10.3390/resources2030213.
Feher, L.C., Osland, M.J., McKee, K.L., Whelan, K.R.T., Coronado-Molina, C., Sklar, F.H., Krauss, K.W., Howard, R.J., Cahoon, D.R., Lynch, J.C., Lamb-Wotton, L., Troxler, T.G., Conrad, J.R., Anderson, G.H., Vervaeke, W.C., Smith, T.J., Cormier, N., From, A.S., and Allain, L., 2022, Soil elevation change in mangrove forests and marshes of the Greater Everglades—A regional synthesis of Surface Elevation Table-Marker Horizon (SET-MH) Data: Estuaries and Coasts, accessed June 2023 at https://doi.org/10.1007/s12237-022-01141-2.
Kirwan, M.L., and Guntenspergen, G.R., 2012, Feedbacks between inundation, root production, and shoot growth in a rapidly submerging brackish marsh: Journal of Ecology, v. 100, no. 3, p. 764–770, accessed June 2023, at https://doi.org/10.1111/j.1365-2745.2012.01957.x.
Moon, J. A., Feher, L.C., Lane, T.C., Vervaeke, W.C., Osland, M.J., Head, D.M., Chivoiu, B.C., Stewart, D.R., Johnson, D.J., Grace, J.B., Metzger, K.L., and Rankin, N.M., 2022, Surface elevation change dynamics in coastal marshes along the northwestern Gulf of Mexico—Anticipating effects of rising sea-level and intensifying hurricanes: Wetlands, v. 42, no. 49, 17 p., accessed June 2023 at https://doi.org/10.1007/s13157-022-01565-3.
Moorman, M.C., Ladin, Z.S., Tsai, E.L., Smith, A., Bessler, A., Richter, J., Harrison, R., van Druten, B., Stanton, W., Hayes, C., Harris, B.W., Hoff, M., Sasser, C., Wells, D.M., Tupacz, J., and Rankin, N., 2023, Will they stay or will they go—Understanding South Atlantic coastal wetland transformation in response to sea-level rise: Estuaries and Coasts, accessed June 2023 at https://doi.org/10.1007/s12237-023-01225-7.
Saintilan, N., Kovalenko, K.E., Guntenspergen, G., Rogers, K., Lynch, J.C., Cahoon, D.R., Lovelock, C.E., Friess, D.A., Ashe, E., Krauss, K.W., Cormier, N., Spencer, T., Adams, J., Raw, J., Ibanez, C., Scarton, F., Temmerman, S., Meire, P., Maris, T., Thorne, K., Brazner, J., Chmura, G.L., Bowron, T., Gamage, V.P., Cressman, K., Endris, C., Marconi, C., Marcum, P., St. Laurent, K., Reay, W., Raposa, K.B., Garwood, J.A., and Khan, N., 2022, Constraints on the adjustment of tidal marshes to accelerating sea level rise: Science, v. 377, no. 6605, p. 523–527, accessed June 2023, at https://doi.org/10.1126/science.abo7872.
U.S. Fish and Wildlife Service, 2019, National Wetlands Inventory Wetlands Classification Codes: U.S. Fish & Wildlife webpage, accessed June 2023, at https://www.fws.gov/program/national-wetlands-inventory/classification-codes.
U.S. Geological Survey, 2018, The Surface Elevation Table and Marker Horizon technique—A protocol for monitoring wetland elevation dynamics: U.S. Geological Survey website, accessed June 2023, at https://www.usgs.gov/centers/eesc/science/surface-elevation-table.
U.S. Geological Survey, 2022, PAD-US data overview: U.S. Geological Survey webpage, accessed June 2023, at https://www.usgs.gov/programs/gap-analysis-project/science/pad-us-data-overview.
For more information, contact
Director, Eastern Ecological Science Center
11649 Leetown Road
Kearneysville, WV 25430
Disclaimers
Any use of trade, firm, or product names is for descriptive purposes only and does not imply endorsement by the U.S. Government.
Although this information product, for the most part, is in the public domain, it also may contain copyrighted materials as noted in the text. Permission to reproduce copyrighted items must be secured from the copyright owner.
Suggested Citation
Neville, J.A., and Gutenspergen, G.R., 2023, Spatial Distribution of Elevation Change Monitoring in Coastal Wetlands Across Protected Lands of the Lower 48 United States: U.S. Geological Survey Fact Sheet 2023–3029, 4 p., https://doi.org/10.3133/fs20233039.
ISSN: 2327-6932 (online)
ISSN: 2327-6916 (print)
Study Area
| Publication type | Report |
|---|---|
| Publication Subtype | USGS Numbered Series |
| Title | Spatial distribution of elevation change monitoring in coastal wetlands across protected lands of the lower 48 United States |
| Series title | Fact Sheet |
| Series number | 2023-3039 |
| DOI | 10.3133/fs20233039 |
| Publication Date | September 20, 2023 |
| Year Published | 2023 |
| Language | English |
| Publisher | U.S. Geological Survey |
| Publisher location | Reston, VA |
| Contributing office(s) | Patuxent Wildlife Research Center, Eastern Ecological Science Center |
| Description | 4 p. |
| Country | United States |
| Online Only (Y/N) | N |
| Additional Online Files (Y/N) | N |