

Characterizing Urban Heat Islands Across 50 Major Cities in the United States
Links
- Document: Report (8.59 pdf) , HTML , XML
- Data Release: USGS data release - Land surface thermal feature change monitoring in urban and non-urban interface from 1985 to present (ver. 5.0, December 2023)
- NGMDB Index Page: National Geologic Map Database Index Page (html)
- Download citation as: RIS | Dublin Core
Background
Urban development and associated land-cover and land-use change alters the environment. The continued increase of developed land changes the Earth’s ecosystems and affects the resources provided to society. During the last 40 years, urban population in the United States has increased by more than 6.3 percent, and more than 80 percent of the U.S. population resides in urban areas (U.S. Census, 2020). One of the changes associated with urbanization is the change of landscape features to structures such as buildings, roads, and other infrastructure that absorb and re-emit the heat of the sun more than natural landscapes such as forests and water bodies. This land-cover transition can result in an urban surface temperature that is higher than in a non-urban area, which is defined as a surface urban heat island (SUHI). A SUHI has a profound effect on the lives of urban residents and can exacerbate the risk of heat-related mortality associated with global climate change (U.S. Environmental Protection Agency [EPA], 2023a). The change of urban landscapes and climate conditions can affect the SUHI intensity. As urban development continues, many cities face long-term risks like increasing temperatures and changes in extreme weather events such as heat waves. Many cities in the United States have experienced an increasing frequency of hot days and extreme high temperatures (U.S. Global Change Research Program [USGCRP], 2023). Heat waves are also more intense, and the heat wave season is becoming longer as a consequence of a warming climate. These trends and the effects of extreme heat could continue and intensify in the future.
Increasing temperatures can lead not only to physical discomfort but also to higher rates of illness and death. Increased exposure to heat waves can have a substantial effect on human and ecosystem health and energy demand, and exacerbates the risk of heat-related mortality (Zhao and others, 2018; Keith and others, 2021). As the climate of the Earth warms, hotter-than-usual days and nights are becoming more common. The SUHI effect is expected to strengthen in the future as the structural and spatial extent and population density of urban areas change and grow (Manoli and others, 2019). Measures of SUHI intensity and trends in urban temperature are important indicators to examine the effects of changing climate conditions over time (Manoli and others, 2019; EPA, 2023a; USGCRP, 2023). Monitoring and tracking the long-term trends of SUHI can help determine where and when heat-related hazards may happen and better protect vulnerable populations and underserved communities. The information can be used to develop strategies to mitigate and manage the hazards of extreme heat at national, regional, and local scales.
Methods and Data
The SUHI is affected by various factors that differ depending on the metropolitan area and its background climate. Thermal infrared remote sensing, however, can provide a wide range of spatial and temporal coverages in estimating surface temperature (ST). ST derived from remote sensing is commonly used to better understand the thermal environment difference between urban and rural areas and heat transfer within the surface-atmosphere system. To determine SUHI intensity and trend, long-term Landsat time series ST data from all available records were first processed to produce annual mean ST datasets at 30-meter resolution for 50 major cities in the United States (Xian and others, 2022b). Two major land-cover datasets, the National Land Cover Database and Land Change Monitoring, Assessment, and Projection annual land change products were then used to outline annual land cover and land changes for 50 cities that include a diverse set of urban areas in the conterminous United States. Metropolitan extents from the U.S. Census Bureau (https://www.census.gov/) were also used to create core urban extents for urban centers. Furthermore, the 5-kilometer buffers were extended from each urban center boundary to include surrounding non-urban areas. The pixel-level SUHI intensity was determined by the magnitude of ST difference between an urban pixel and a mean ST of the surrounding rural buffer (Xian and others, 2022b).
An innovative data processing and analysis approach was implemented at the U.S. Geological Survey (USGS) to quantify long-term changes in SUHI intensity in the 50 cities. Importantly, within urban areas, a person’s experience of heat can differ substantially from one block to another, or from a park bench under a shady tree compared to one in full sun. The temperature in some locations may be persistently higher than surrounding areas, creating “hotspots.” Thus, we also identified and estimated these city hotspots where annual mean ST is higher than in the surrounding areas that have the same urban land-cover type and high ST that repeated more than 50 percent of the time during 1985–2020.
Results and Products
The geographic distribution and the annual average SUHI intensities for each of the 50 cities (1985–2020) are shown in figure 1. The data indicate that the mean of SUHI intensity is 2.88 degrees Celsius (°C) (5.19 degrees Fahrenheit [°F]), and 47 of the 50 cities have positive or warming in the SUHI. Figure 2 shows maps of the changes in SUHI intensity and extents between 1985 and 2020 for Washington, D.C. (fig. 2A, B) and Los Angeles (fig. 2C, D). The temporal trends (1985–2020) of mean SUHI intensities in the 50 cities are shown in figure 3A. The average SUHI intensity trend is about 0.32 °C per decade (0.58 °F per decade), and only three cities have negative trends. The changes (1985–2020) of mean SUHI intensity in the Washington, D.C. (fig. 3B), Raleigh-Durham (fig. 3C), Seattle (fig. 3D), and Los Angeles (fig. 3E) areas are also included. Mean trends of these four cities reach 0.29 °C per decade (0.52 °F per decade) in Washington D.C., 0.56 °C per decade (1.01 °F per decade) in Raleigh-Durham, 0.38 °C per decade (0.68 °F per decade) in Seattle, and 0.51 °C per decade (0.92 °F per decade) in Los Angeles. To highlight the change of SUHI intensity and spatial distributions of hotspots, SUHI intensities in 1985 and 2020, 2020 high-resolution images from the National Agriculture Imagery Program, and SUHI hotspots in the Washington, D.C. area are shown in figure 4. SUHI intensity change and hotspots distributions associated with different urban structures are observed.
The primary product from this effort is a documented and operational dataset that includes geographic information system layers and trend analyses documenting changing conditions in the 50 cities as a USGS data release (Xian and others, 2022a). The SUHI data for the 50 cities are also available in Xian and others (2022a). The dataset is also intended to be made available for inclusion in Federal climate data resources such as the USGCRP Indicators Platform (USGCRP, 2023) and EPA climate change indicators (EPA, 2023b).
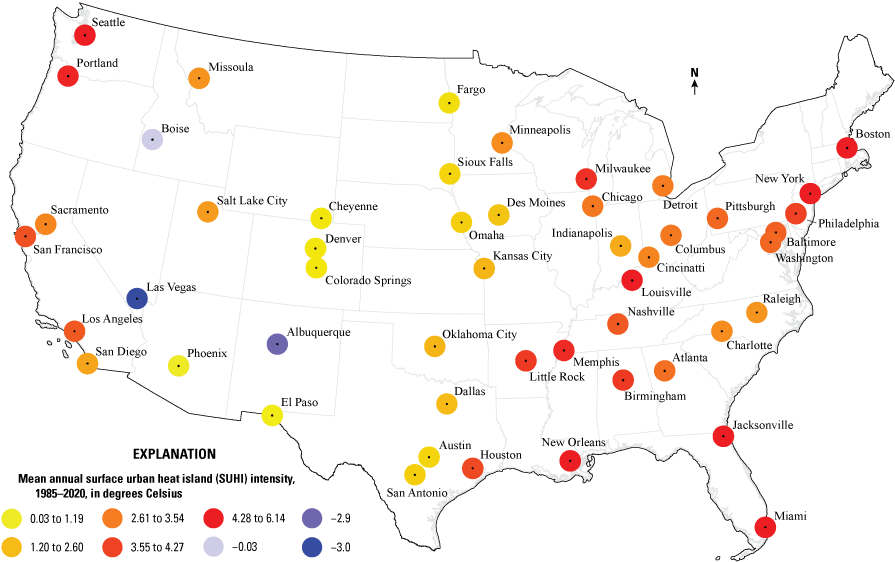
Mean surface urban heat island intensities in 50 cities across the conterminous United States.
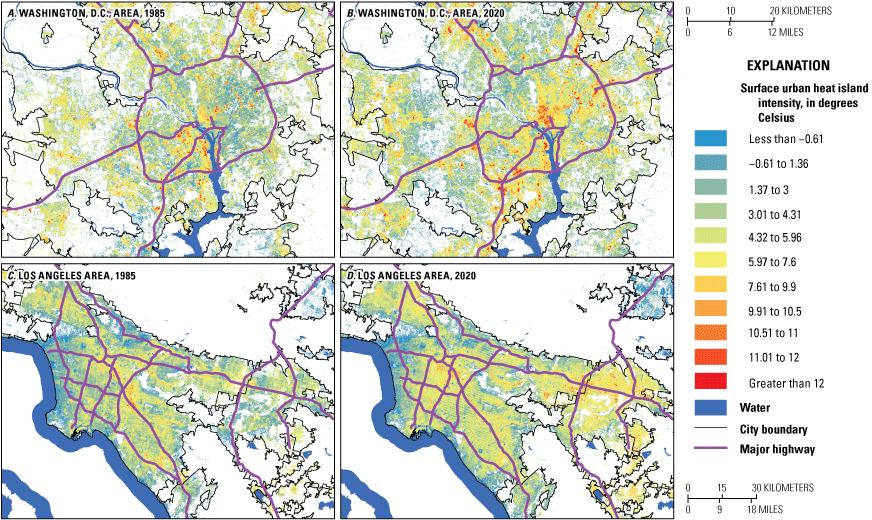
Surface urban heat island intensities in 1985 and 2020. A, Washington, D.C. area, 1985. B, Washington, D.C. area, 2020. C, Los Angeles area, 1985. D, Los Angeles area, 2020.
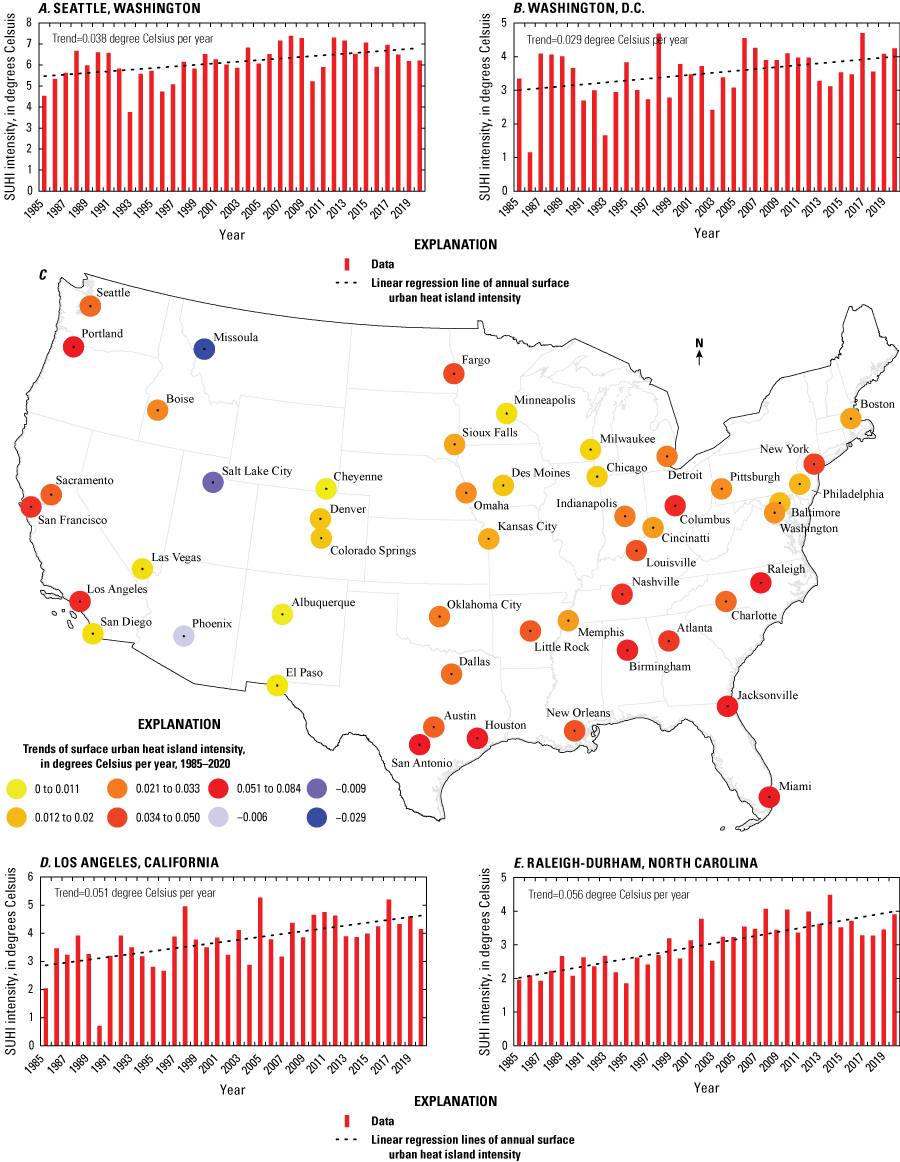
Trends of surface urban heat island (SUHI) intensity (degrees Celsius per year) between 1985 and 2020.. A, Mean SUHI intensity changes, Seattle. B, Mean SUHI intensity changes, Washington, D.C. C, Temporal trends of SUHI intensity in 50 cities across the conterminous United States. D, Mean SUHI intensity changes, Los Angeles. E, Mean SUHI intensity changes, Raleigh-Durham.
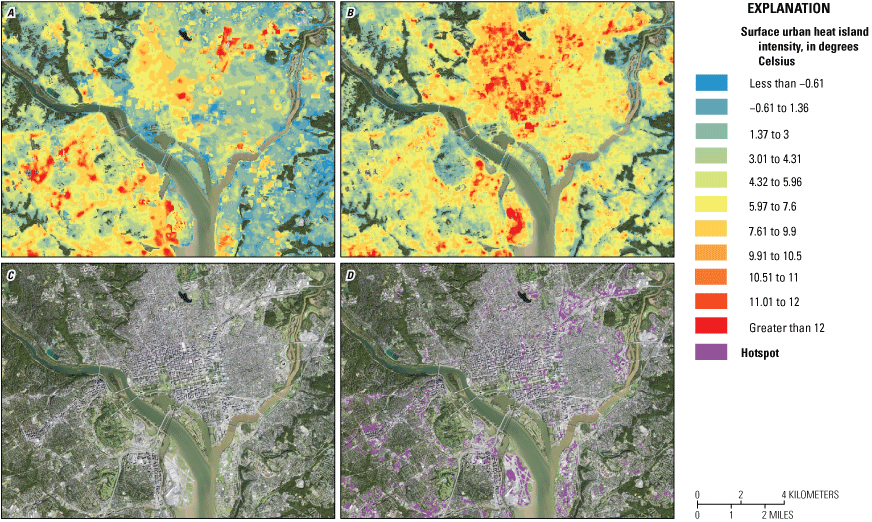
Surface urban heat island (SUHI) intensity, hotspots, location, and year in Washington, D.C., area. A, SUHI intensity in 1985 in area shown in figure 2. B, SUHI intensity in 2020 in area shown in figure 2. C, High-resolution National Agriculture Imagery Program image, 2020. D, High-resolution National Agriculture Imagery Program image, 2020, including hotspots.
References Cited
Keith, L., Meerow, S., Hondula, D.M., Turner, V.K., and Arnott, J.C., 2021, Deploy heat officers, policies and metrics: Nature, v. 598, no. 7879, p. 29–31. [Also available at https://doi.org/10.1038/d41586-021-02677-2.]
Manoli, G., Fatichi, S., Schläpfer, M., Yu, K., Crowther, T.W., Meili, N., Burlando, P., Katul, G.G., and Bou-Zeid, E., 2019, Magnitude of urban heat islands largely explained by climate and population: Nature, v. 573, no. 7772, p. 55–60. [Also available at https://doi.org/10.1038/s41586-019-1512-9.]
U.S. Census, 2020, Urban and rural: U.S. Census Agency web page, accessed August 2, 2023, at https://www.census.gov/programs-surveys/geography/guidance/geo-areas/urban-rural.html.
U.S. Environmental Protection Agency [EPA], 2023a, Heat island effect: U.S. Environmental Protection Agency web page, accessed August 2, 2023, at https://www.epa.gov/heatislands.
U.S. Environmental Protection Agency [EPA], 2023b, Climate change indicators in the United States: U.S. Environmental Protection Agency web page, accessed August 2, 2023, at https://www.epa.gov/climate-indicators.
U.S. Global Change Research Program [USGCRP], 2023, USGCRP indicator platform: U.S. Global Change Research Program web page, accessed August 2, 2023, at https://www.globalchange.gov/browse/indicators/catalog.
Xian, G.Z., Shi, H., Mueller, C.W., Hussain, R.A., Arab, S., Sayler, K.L., and Howard, D., 2022a, Land surface thermal feature change monitoring in urban and non-urban interface from 1985 to present (ver. 5.0, December 2023): U.S. Geological Survey data release, https://doi.org/10.5066/P9H6E1FZ.
Xian, G., Shi, H., Zhou, Q., Auch, R., Gallo, K., Wu, Z., and Kolian, M., 2022b, Monitoring and characterizing multi-decadal variations of urban thermal condition using time-series thermal remote sensing and dynamic land cover data: Remote Sensing of Environment, v. 269, 112803. [Also available at https://doi.org/10.1016/j.rse.2021.112803.]
Zhao, L., Oppenheimer, M., Zhu, Q., Baldwin, J.W., Ebi, K.L., Bou-Zeid, E., Guan, K., and Liu, X., 2018, Interactions between urban heat islands and heat waves: Environmental Research Letters, v. 13, no. 3, 034003. [Also available at https://doi.org/10.1088/1748-9326/aa9f73.]
For more information about this publication, contact:
Director, USGS Earth Resources Observation and Science Center
47914 252nd Street
Sioux Falls, SD 57198
605–594–6151
Or
U.S. Environmental Protection Agency
Office of Atmospheric Protection
Climate Change Division
Washington, D.C.
Disclaimers
Any use of trade, firm, or product names is for descriptive purposes only and does not imply endorsement by the U.S. Government.
Although this information product, for the most part, is in the public domain, it also may contain copyrighted materials as noted in the text. Permission to reproduce copyrighted items must be secured from the copyright owner.
Suggested Citation
Xian, G.Z., 2023, Characterizing urban heat islands across 50 major cities in the United States: U.S. Geological Survey Fact Sheet 2023–3048, 4 p., https://doi.org/10.3133/fs20233048.
ISSN: 2327-6932 (online)
Study Area
| Publication type | Report |
|---|---|
| Publication Subtype | USGS Numbered Series |
| Title | Characterizing urban heat islands across 50 major cities in the United States |
| Series title | Fact Sheet |
| Series number | 2023-3048 |
| DOI | 10.3133/fs20233048 |
| Publication Date | December 12, 2023 |
| Year Published | 2023 |
| Language | English |
| Publisher | U.S. Geological Survey |
| Publisher location | Reston, VA |
| Contributing office(s) | Earth Resources Observation and Science (EROS) Center |
| Description | Report: 4 p.; Data Release |
| Country | United States |
| Online Only (Y/N) | Y |
| Additional Online Files (Y/N) | N |