

Connecting Conservation Practices to Local Stream Health in the Chesapeake Bay Watershed
Links
-
Documents:
- Report (8.62 MB pdf) , HTML , XML
- Report (13.0 MB pdf) - Printer-friendly version
- NGMDB Index Page: National Geologic Map Database Index Page (html)
- Download citation as: RIS | Dublin Core
Introduction
The Chesapeake Bay Partnership is implementing conservation practices (CPs) throughout the Chesapeake Bay watershed to reduce nutrient and sediment delivery to the Bay. This study intends to provide an integrated and detailed understanding of how local streams respond to these CP-driven management efforts (fig. 1).
-
Key issue: To what extent do CPs positively affect the health of local streams in the nontidal watershed (cobenefits)?
-
Critical unknown: How do CPs change water quality and the stressors that affect stream aquatic life? Which CPs improve stream health more effectively?
Critical knowledge to be delivered to stakeholders includes—
-
● the effects of CPs on local water-quality conditions,
-
● the degree to which these same CPs also provide local stream-ecosystem benefits, and
-
● a deeper understanding of local stream-ecosystems, including stressors and CPs, to guide the selection of management efforts that enhance both water quality and overall stream-ecosystem health.
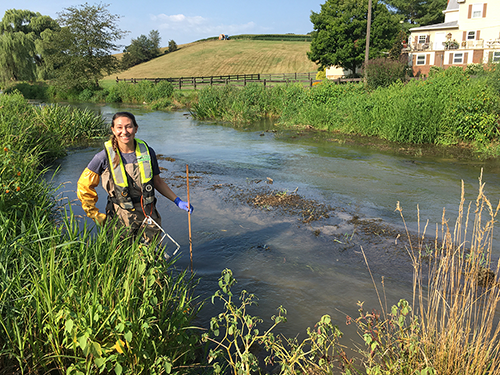
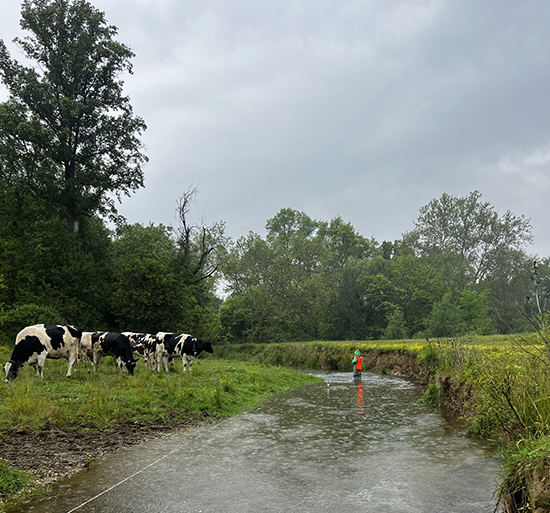
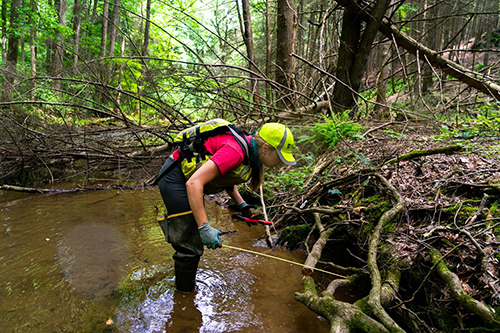
U.S. Geological Survey scientist measuring stream habitat. Photograph by Leah Staub, U.S. Geological Survey.
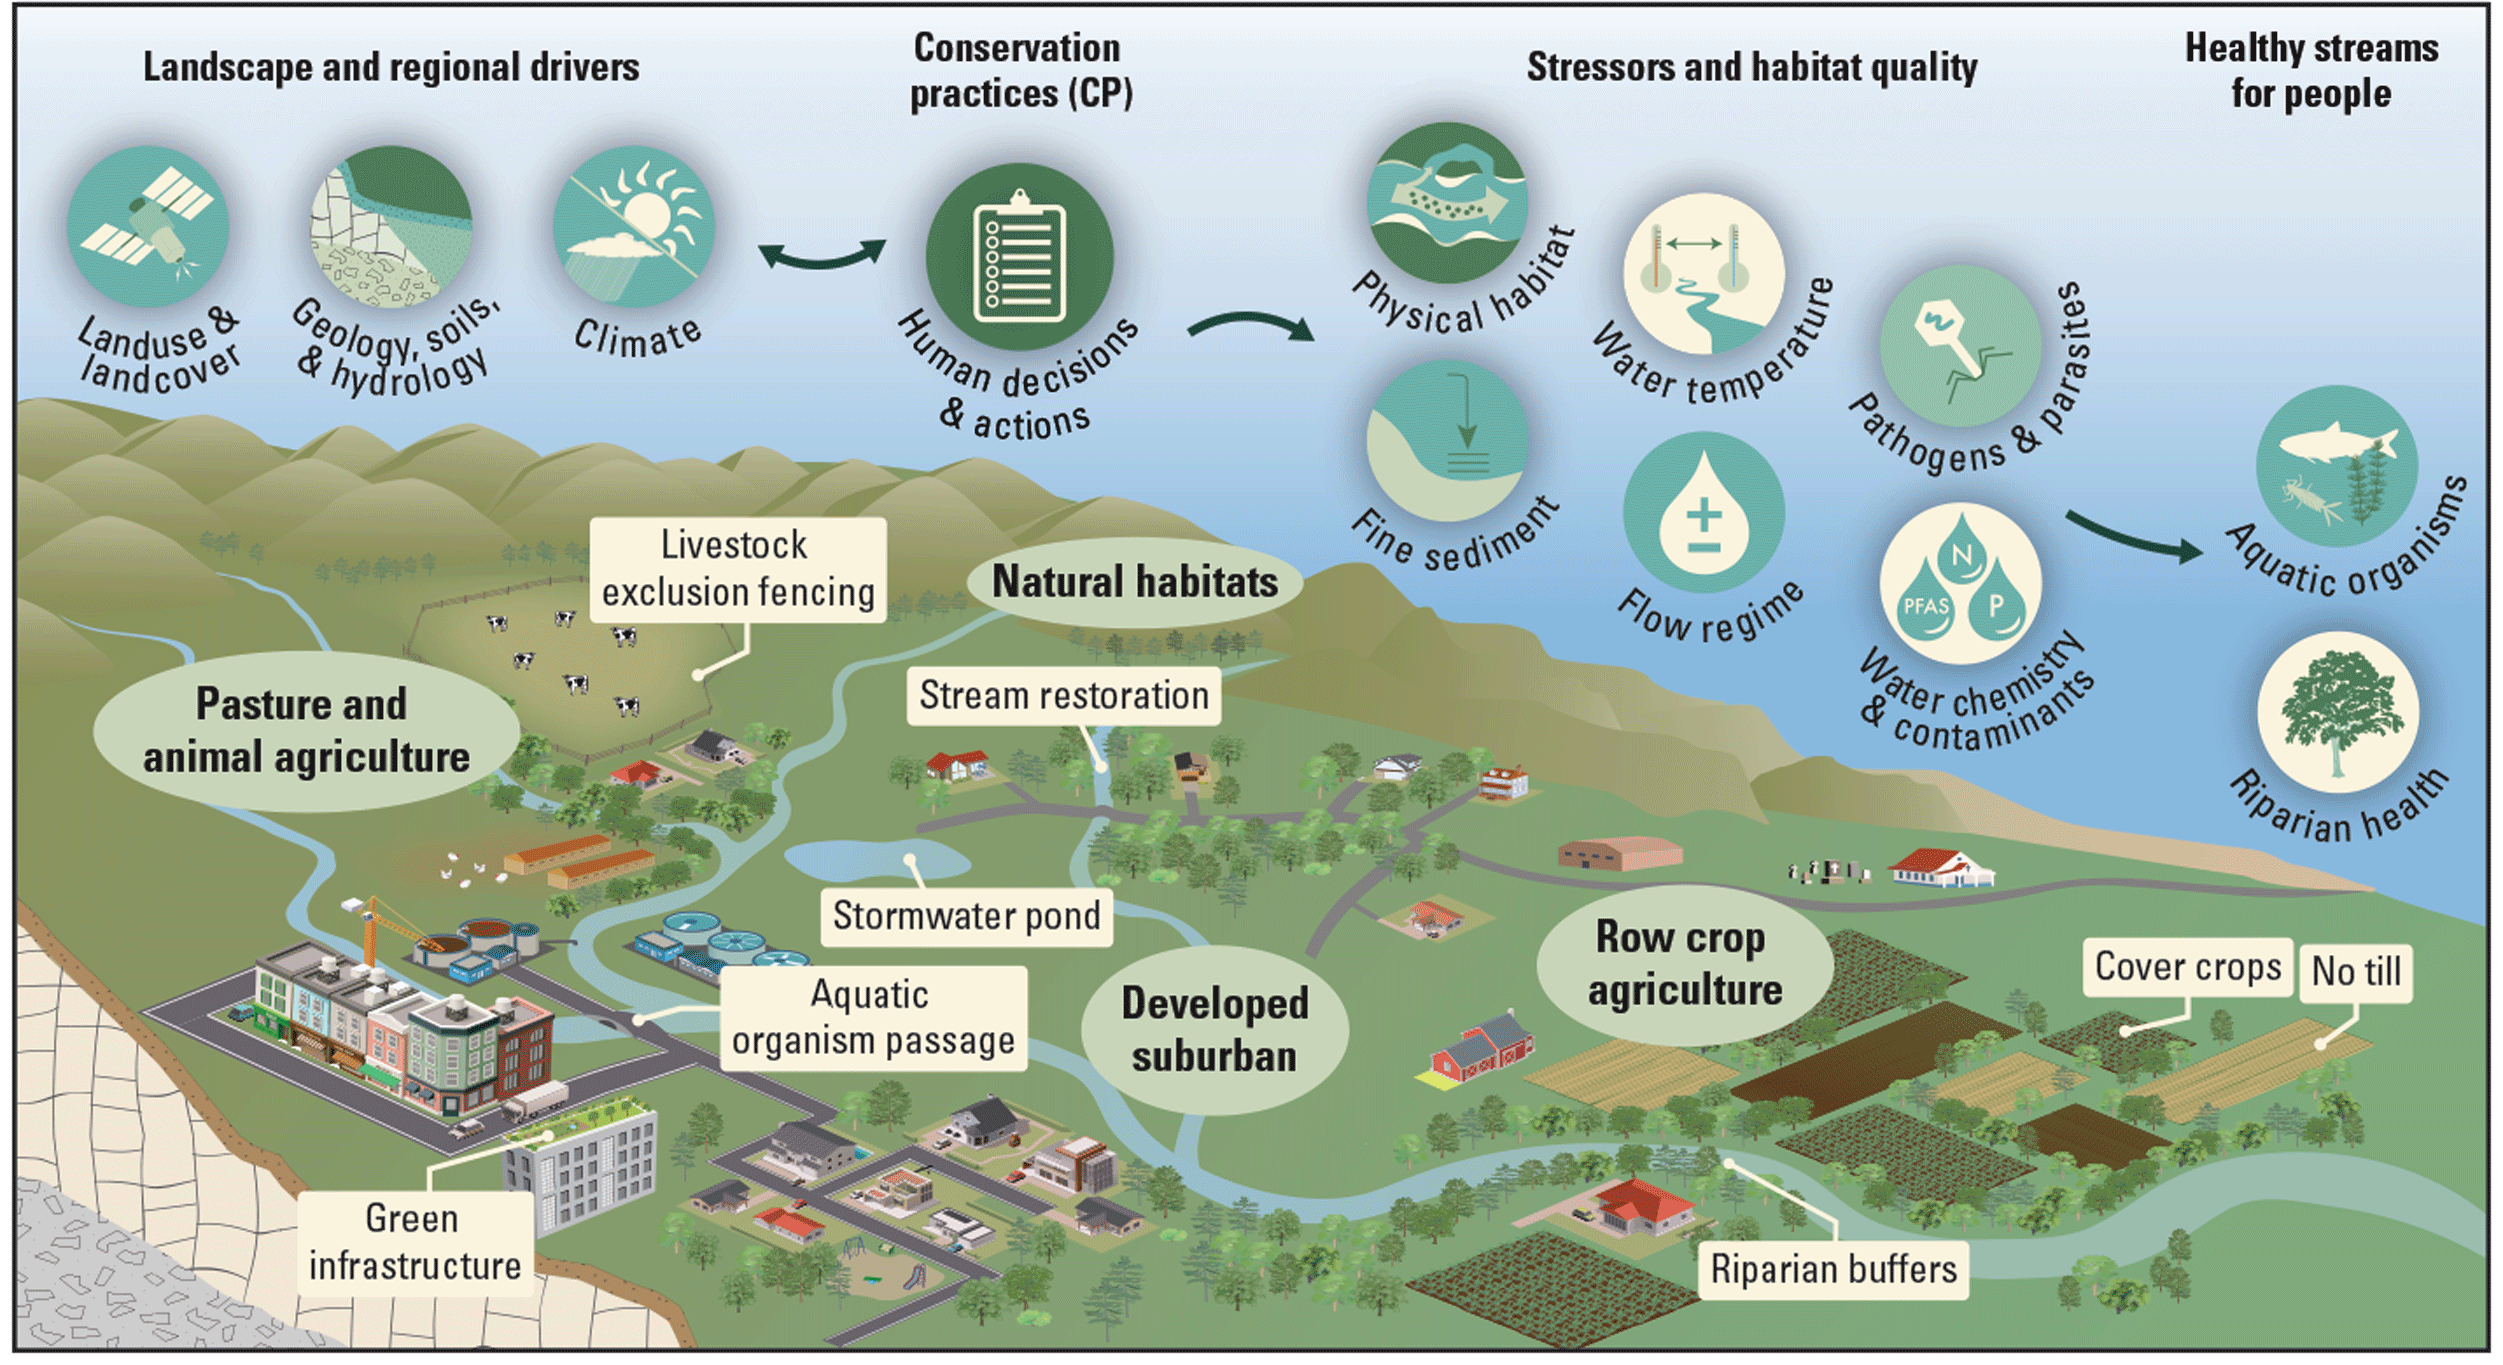
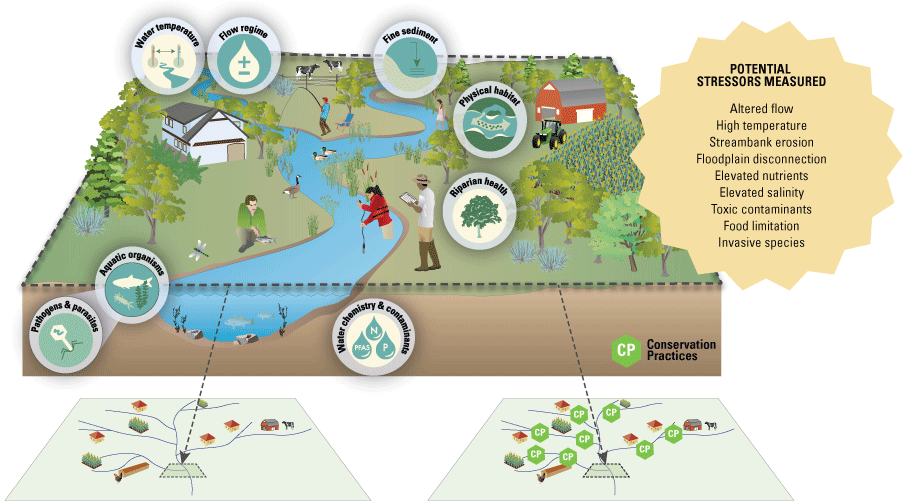
A diagram showing how streams are influenced by conservation practices (CP) and other management efforts that modify how different land uses generate the stressors that affect stream health. This research in the Chesapeake Bay watershed is evaluating whether or not CPs improve stream aquatic and riparian ecosystem-health.
A Holistic Approach to Investigating the Influence of Conservation Practices
Management actions in the Chesapeake Bay watershed primarily focus on landscapes experiencing high nutrient and sediment loads and other forms of ecosystem degradation. These landscapes are targeted for CP implementation. This U.S. Geological Survey (USGS) study focuses on the following important Chesapeake Bay watershed landscapes for year-long assessments: pasture in the Shenandoah Valley, row crops in the Delmarva Peninsula, mixed agriculture in the Pennsylvania and Maryland Piedmont, and the developed Maryland-District of Columbia-Virginia corridor (fig. 2).
In each of these landscapes, 30 streams were selected that represent gradients of land-use and the intensity of CP implementation in the upstream watershed. The expectation is that stream responses to CPs depend on the specific characteristics of agriculture and development around the Chesapeake Bay watershed and the stream’s drainage area.
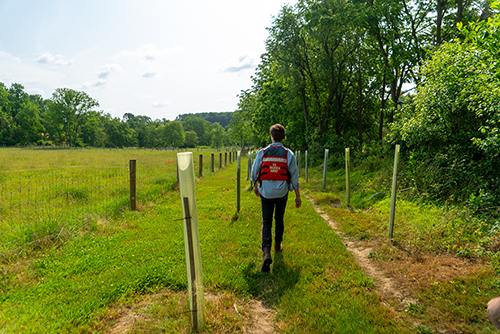
Fencing and riparian forest-buffer planting are essential tools for managers and provide numerous benefits to streams. Photograph by David Fisher, U.S. Geological Survey.
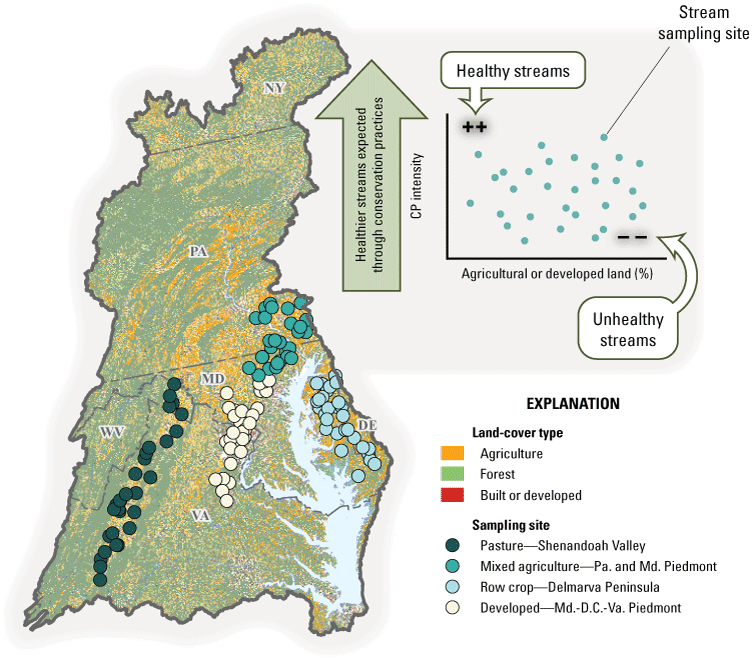
Map of sampling locations (left) and a graph plotting stream-health expectations across gradients of conservation practices and land use (top right). The map shows locations of streams measured in agricultural and developed landscapes. In the plot, the streams (each shown as a blue dot) expected to be the healthiest are shown in the top left of the graph, streams expected to be the most-degraded are shown in the bottom right of the graph, and streams expected to be healthier due to conservation practices across the land-use gradient are shown in the top half of the graph. CP, conservation practice; D.C., District of Columbia; Md., Maryland; Pa., Pennsylvania; %, percent; Va., Virginia.
A holistic ecosystem approach is used, measuring the upstream drivers (characteristics of the upstream drainage area, including land use), stressors within the stream, and the ecosystem biotic responses (aquatic and riparian) (fig. 3). This information can show how CPs and land use affect stream ecosystem health, as well as why streams responded, through the identification of stressor responses.
This research can test the expectation as to whether streams with high rates of CP implementation and less-intensive land use in their upstream drainage area have the healthiest streams, if streams with low rates of CP implementation and substantial intensive land use have the least healthy streams, and, in general, if streams with more CP implementation are healthier than streams with less management.
Chesapeake streams are embedded in human landscapes, including agricultural and developed lands. Photograph by Sergio Sabat-Bonilla, Virginia Tech, used with permission.
Conceptual diagram showing how this study assesses stream health, stressors, and landscapes in Chesapeake Bay watershed streams with varied conservation practices and land use. This study measures many aspects of stream ecosystem health, including stressors to stream life and landscape characteristics, in many Chesapeake Bay watershed streams with contrasting amounts of upstream conservation practices and intensive land use.
Moving Forward: Analyses and Engagement
Analyses of data collected annually for each of the Chesapeake landscapes studied can determine how much CPs affect local stream-ecosystem health, which stressors negatively affect streams, and which landscape characteristics are associated with better or worse conditions in local streams.
The results of the study can be communicated to stakeholders and landowners through several approaches:
-
● creating a website to map and display measurements in each stream compared with the other streams in each Chesapeake landscape,
-
● engaging in discussions with local, State, and Federal government agencies, nonprofit organizations, and landowners to share findings and provide insights on connections between CP adoption and stream health, and
-
● the publication of findings about the Chesapeake Bay watershed CPs so that conservation managers in other regions of the country can study and apply them.
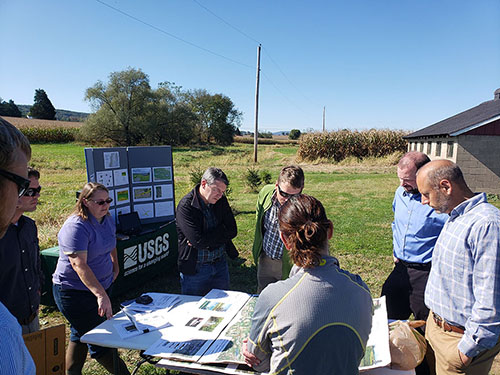
The U.S. Geological Survey works with stakeholders to understand their needs and to share how our findings can inform their management decisions. Photograph by John Clune, USGS.
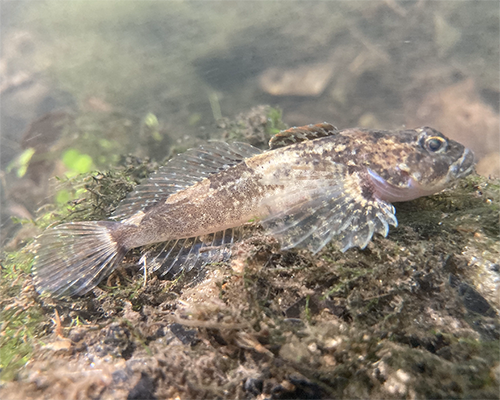
Scientists collect data on the abundance and health of fish in streams. Photograph by Hunter Greenway, Virginia Tech, used with permission.
Scientists assess the health of the riparian land adjacent to the stream to determine its impact on aquatic stream health. Photograph by David Fisher, U.S. Geological Survey.
Science and Communication and Synthesis Teams
The stream team principal investigators for this study are Greg Noe (lead), Paul Angermeier, Larry Barber, Matthew Cashman, Olivia Devereux, Sally Entrekin, Rosemary Fanelli, Than Hitt, Jeramy Jasmann, Kelly Maloney, Kelly Smalling, and Ty Wagner.
The communication and synthesis team for this fact sheet are Greg Noe, John Wolf, and Ken Hyer of the USGS, along with Lili Badri, Vanessa Vargas-Nguyen, and Bill Dennison of the University of Maryland Center for Environmental Science.
Acknowledgments
This study would not have been possible without the generous support of private, nonprofit, and public landowners, who granted scientists access so that they could study the streams and riparian areas. We are sincerely grateful for their generosity. Numerous stakeholders charged with implementing conservation practices helped us connect with these landowners and better understand local stream issues and their information needs to better manage their watersheds. Finally, we thank the many scientists who dedicated their expertise to this study. U.S. Geological Survey (USGS) Chesapeake Bay Activities supports this work and is a partnership between scientists from the USGS and Virginia Tech.
For more information about U.S. Geological Survey Chesapeake Bay science, please visit: https://usgs.gov/centers/cba.
Disclaimers
Any use of trade, firm, or product names is for descriptive purposes only and does not imply endorsement by the U.S. Government.
Although this information product, for the most part, is in the public domain, it also may contain copyrighted materials as noted in the text. Permission to reproduce copyrighted items must be secured from the copyright owner.
Suggested Citation
Noe, G., Angermeier, P.L., Barber, L.B., Buckwalter, J., Cashman, M.J., Devereux, O., Doody, T.R., Entrekin, S., Fanelli, R.M., Hitt, N., Huber, M.E., Jasmann, J.R., Maloney, K.O., Mohs, T.G., Sabat-Bonilla, S., Smalling, K., Wagner, T., Wolf, J.C., and Hyer, K.E., 2024, Connecting conservation practices to local stream health in the Chesapeake Bay watershed: U.S. Geological Survey Fact Sheet 2024–3030, 4 p., https://doi.org/10.3133/fs20243030.
ISSN: 2327-6932 (online)
ISSN: 2327-6916 (print)
Study Area
| Publication type | Report |
|---|---|
| Publication Subtype | USGS Numbered Series |
| Title | Connecting conservation practices to local stream health in the Chesapeake Bay watershed |
| Series title | Fact Sheet |
| Series number | 2024-3030 |
| DOI | 10.3133/fs20243030 |
| Publication Date | July 19, 2024 |
| Year Published | 2024 |
| Language | English |
| Publisher | U.S. Geological Survey |
| Publisher location | Reston, VA |
| Contributing office(s) | Florence Bascom Geoscience Center |
| Description | 4 p. |
| Country | United States |
| Other Geospatial | Chesapeake Bay watershed |
| Online Only (Y/N) | N |
| Additional Online Files (Y/N) | N |