

The Solar Cycle, Geology, and Geoelectric Hazards for Power Grids
Links
- Document: Report (2.5 MB pdf) , HTML , XML
- Version History: Version History (8.0 KB txt)
- Download citation as: RIS | Dublin Core
Introduction
The Sun’s variability is notably seen in the waxing and waning of the number and size of sunspots over the approximately 11-year period of a solar cycle. Sunspots are concentrations of tangled magnetic-field lines. With their occasional and abrupt rearrangement, concentrations of superheated and electrically conducting plasma (electrons, protons, and ions) can be ejected from the Sun. If one of these “coronal-mass ejections” happens to be directed toward the Earth, it can cause a “magnetic storm”—a global disturbance of the geomagnetic field that can last a day or two.
During a storm, electromagnetic disturbance descends from the near-Earth space environment to the Earth’s surface, and into its interior. The strength of the electromagnetic fields in the Earth, and the depth of their penetration, depend on the rate at which the field varies in time and the electrical conductivity of the underlying geologic structures. For example, 10-second-period field variation can penetrate a kilometer or so into wet sedimentary rock (a relatively good conductor), but 100 kilometers or so into dry metamorphic or igneous rock (which are usually electrically resistive). Longer-period variation can penetrate even deeper—hundreds of kilometers or more. Geoelectric fields generated at Earth’s surface are generally of low amplitude over sedimentary basins and of high amplitude over metamorphic provinces. For some storms, more than 10 volts per kilometer (V/km) can be induced over electrically resistive parts of the Earth (Love and others, 2022).
Consider a power-transmission line that happens to be deployed across a metamorphic province. Storm-induced electric currents will meet resistance in flowing through the poorly conducting rock, and this is where the power grid offers an alternative path—one of less resistance. For a power line of 100 km in length, the integration of 10 V/km adds up to 1,000 V. Such voltages can drive currents through grounding points at high-voltage transformer substations and into the power grid. They are not the tightly managed alternating currents that power grids are designed to carry. Magnetic-storm-induced currents can interfere with grid operation and even damage or destroy transformers.
This long chain of physical effects, stretching from the Sun to the Earth to the power grid, can be especially consequential for the most intense magnetic storms that are produced by the strongest coronal-mass ejections. A very intense magnetic superstorm could, potentially, result in prolonged and widespread blackouts, possibly spanning international boundaries. Such an event is more probable around the time of sunspot “solar maximum,” when spots are relatively numerous.
History of Sunspots and Storms
For hundreds of years, astronomers have observed and counted sunspots. Since the middle of the 19th century, geophysicists have regularly measured geomagnetic disturbance at ground-based stations. The combination of these two types of data provides a long history of solar-terrestrial activity. Figure 1 shows time series representing sunspot number (R) from 1843 to 2024 (Clette and Lefèvre, 2016; WDC-SILSO, 2024) and geomagnetic disturbance (aa) from 1868 to 2024 (Lockwood and others, 2018; Mayaud and others, 2023). The semiregular solar cycle is clearly seen in the sunspot data. Intense magnetic storms tend to occur when sunspot numbers are high, and they are rare when sunspot numbers are low.
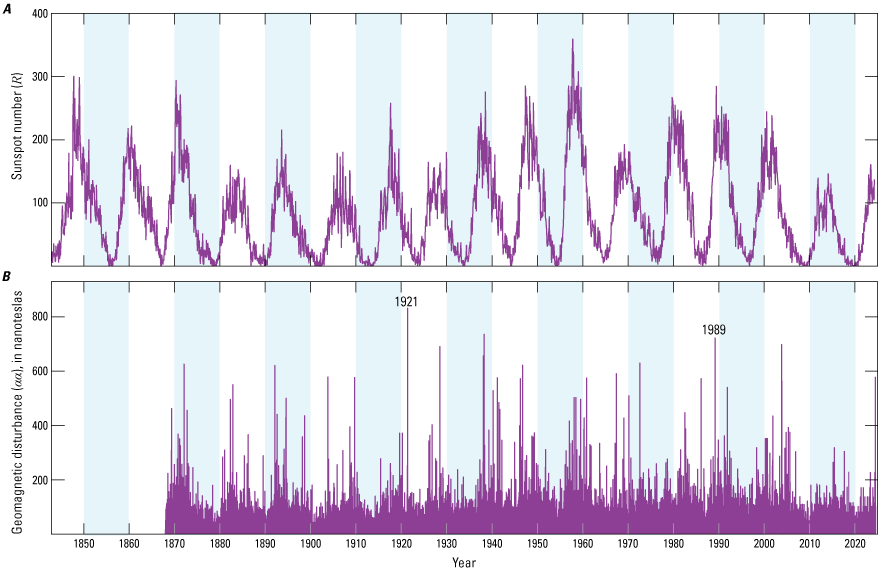
A, Variation in sunspot number (R), 1843–2024; B, variation in geomagnetic disturbance (αα), in nanoteslas, 1868–2024. Note the 11-year modulation in both time series and their correlation. The 1921 and 1989 magnetic storms are labeled.
The magnetic storm of March 1989 happened during the ascending phase of the solar cycle, just before sunspot maximum in November 1989. This storm damaged satellites and disrupted geophysical surveys and radio communication. Geomagnetically induced currents led to the complete collapse of the Hydro-Québec electric power grid in Canada (Allen and others, 1989; Bolduc, 2002), caused substantial interference in U.S. power grids (North American Electric Reliability Corporation, 1990), and damaged a high-voltage transformer at a nuclear power plant in New Jersey (Rossi, 1990; Barnes and others, 1991).
Looking further back in time, the great magnetic storm of May 1921 occurred during the declining phase of the solar cycle, following sunspot maximum in August 1917. This storm, one of the most intense ever recorded, caused worldwide disruption of telegraph and telephone systems—which, in those days, relied on long-grounded networks of wires (like power grids of today). In New York State and City, the storm caused fires in telegraph stations used by railroad companies (for example, Hapgood, 2019; Love and others, 2019).
In September 1859, an astronomer named Richard Carrington was looking at sunspots through a telescope when he saw a very bright solar flare. Seventeen hours later, one of history’s greatest magnetic storms transpired. The storm was so intense it overwhelmed magnetometer systems used at most observatories at the time. The Carrington storm disrupted telegraph systems and caused fires at numerous telegraph stations around the world.
With the rise of the global economy and humanity’s ever-increasing reliance on electricity-based technology, a recurrence of a storm like that of March 1989 could carry a worldwide economic impact of $2.4 trillion to $3.4 trillion, equivalent to a global loss in gross productivity of 3.9 to 5.6 percent (Schulte in den Bäumen and others, 2014). The future occurrence of a Carrington-class magnetic storm might carry an economic cost for the United States alone of $0.6 trillion to $2.6 trillion (for example, National Research Council, 2008; Lloyd’s of London, 2013).
Geoelectric Hazard Maps
As part of an interagency Federal Government project to improve national preparedness for space-weather hazards, U.S. Geological Survey (USGS) Geomagnetism Program scientists have performed research on magnetic-storm-induced geoelectric fields. This work relies on two important and very different datasets: (1) multidecadal records of magnetic storms acquired at ground-based monitoring stations operated by the USGS (for example, Love and Finn, 2011; Love and Lewis, 2021) and Natural Resources Canada (for example, Newitt and Coles, 2007), and (2) measurements of the electromagnetic properties of the Earth acquired through national-scale surveys supported by the National Science Foundation (NSF), the National Aeronautics and Space Administration (NASA), and the USGS (for example, Schultz, 2010; Kelbert and others, 2018).
The combination of these datasets permits retrospective mapping of time-dependent geoelectric fields across the contiguous United States (CONUS). The USGS and the National Oceanic and Atmospheric Administration (NOAA) also collaborate on the presentation of real-time geoelectric field maps.
Figure 2 shows a map of the amplitudes of geoelectric fields induced across CONUS during the March 1989 magnetic storm. The same figure also shows a map of the locations of reported instances of power-grid interference during that storm (Love and others, 2022). Notably, geoelectric amplitudes were high in the Upper Midwest and in the Eastern United States. These are regions of electrically resistive metamorphic and igneous rock (Kelbert and others, 2019). Conversely, geoelectric amplitudes were low over more electrically conductive sedimentary basins, such as in Michigan and Illinois. During the March 1989 storm, operational interference for U.S. power grids was greatest where geoelectric amplitudes were high, occurring in power grids serving many of the largest cities in the United States: Boston, Massachusetts; New York City, New York; Philadelphia, Pennsylvania; Baltimore, Maryland; and Washington, District of Columbia—a combined megalopolis of more than 50 million people.
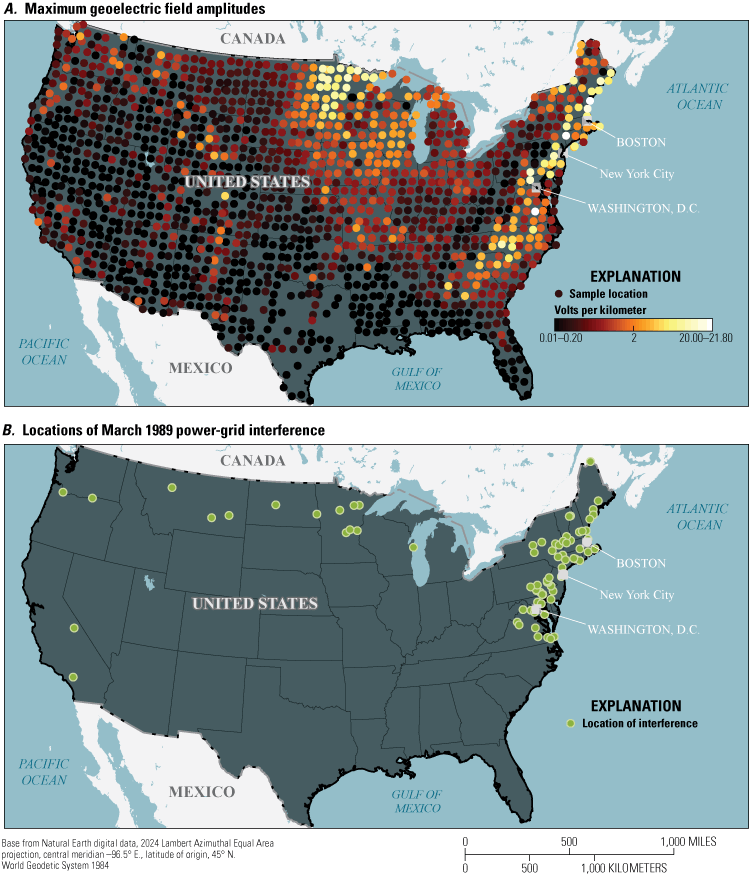
A, Map of geoelectric field amplitudes realized during the March 1989 magnetic storm. B, Map of the locations of power-grid interference realized during the March 1989 magnetic storm.
Retrospective mapping of storm-time geoelectric fields, such as for the March 1989 storm, shows where utility companies might concentrate their efforts to improve the resilience of the Nation’s electric-power grids to the deleterious impacts of magnetic storms. It also shows where utility companies could be especially vigilant in operating power transmission systems during a magnetic storm to help ensure operational continuity.
References Cited
Allen, J., Sauer, H., Frank, L., and Reiff, P., 1989, Effects of the March 1989 solar activity: Eos, Transactions, American Geophysical Union, v. 70, no. 46, p. 1479, 1486–1488, accessed June 2024 at https://doi.org/10.1029/89EO00409.
Barnes, P.R., Rizy, D.T., McConnell, B.W., Tesche, F.M., and Taylor, E.R., Jr., 1991, Electric utility industry experience with geomagnetic disturbances: Oak Ridge National Laboratory, report ORNL–6665, prepared by Oak Ridge National Laboratory, Power Systems Technology Program, 78 p., accessed June 2024 at https://doi.org/10.2172/10108452.
Bolduc, L., 2002, GIC observations and studies in the Hydro-Québec power system: Journal of Atmospheric and Solar-Terrestrial Physics, v. 64, no. 16, p. 1793–1802, accessed June 2024 at https://doi.org/10.1016/S1364-6826(02)00128-1.
Clette, F., and Lefèvre, L., 2016, The new sunspot number—Assembling all corrections: Solar Physics, v. 291, p. 2629–2651, accessed June 2024 at https://doi.org/10.1007/s11207-016-1014-y.
Hapgood, M., 2019, The great storm of May 1921—An exemplar of a dangerous space weather event: Space Weather, v. 17, no. 7, p. 950–975, accessed June 2024 at https://doi.org/10.1029/2019SW002195.
Kelbert, A., Bedrosian, P.A., and Murphy, B.S., 2019, The first 3D conductivity model of the contiguous United States—Reflections on geologic structure and application to induction hazards, chap. 8 of Gannon, J.L., Swidinsky, A., and Xu, Z., eds., Geomagnetically induced currents from the sun to the power grid, v. 244 of Geophysical Monograph: Washington, D.C., American Geophysical Union, p. 127–151, accessed June 2024 at https://doi.org/10.1002/9781119434412.ch8.
Kelbert, A., Erofeeva, S., Trabant, C., Karstens, R., and Van Fossen, M., 2018, Taking magnetotelluric data out of the drawer: Eos, Transactions, American Geophysical Union, v. 99, accessed June 2024 at https://doi.org/10.1029/2018EO112859.
Lockwood, M., Chambodut, A., Barnard, L.A., Owens, M.J., Clarke, E., and Mendel, V., 2018, A homogeneous aa index—1. Secular variation: Journal of Space Weather and Space Climate, v. 8, article A53, 27 p., accessed June 2024 at https://doi.org/10.1051/swsc/2018038.
Love, J.J., and Finn, C.A., 2011, The USGS Geomagnetism Program and its role in space weather monitoring: Space Weather, v. 9, no. 7, article S07001, 5 p., accessed June 2024 at https://doi.org/10.1029/2011SW000684.
Love, J.J., Hayakawa, H., and Cliver, E.W., 2019, Intensity and impact of the New York Railroad Superstorm of May 1921: Space Weather, v. 17, no. 8, p. 1281–1292, accessed June 2024 at https://doi.org/10.1029/2019SW002250.
Love, J.J., and Lewis, K.A., 2021, Geomagnetic monitoring in the mid-Atlantic United States: U.S. Geological Survey Fact Sheet 2021–3001, 2 p., accessed June 2024 at https://doi.org/10.3133/fs20213001.
Love, J.J., Lucas, G.M., Rigler, E.J., Murphy, B.S., Kelbert, A., and Bedrosian, P.A., 2022, Mapping a magnetic superstorm—March 1989 geoelectric hazards and impacts on United States power systems: Space Weather, v. 20, no. 5, article e2021SW003030, 27 p., accessed June 2024 at https://doi.org/10.1029/2021SW003030.
Mayaud, P.-N., Menvielle, M., and Chambodut, A., 2023, aa geomagnetic index: École et Observatoire des Sciences de la Terre [dataset time range 1868–2024], accessed June 2024 at https://doi.org/10.25577/9z05-v751.
National Research Council, 2008, Severe space weather events—Understanding societal and economic impacts—A workshop report: Washington, D.C., National Academies Press, 144 p., accessed June 2024 at https://doi.org/10.17226/12507.
Newitt, L.R., and Coles, R., 2007, Observatories in Canada, in Gubbins, D., and Herrero-Bervera, E., eds., Encyclopedia of geomagnetism and paleomagnetism: Dordrecht, Netherlands, Springer, p. 726–727, accessed August 4, 2024, at https://doi.org/10.1007/978-1-4020-4423-6_234.
Schulte in den Bäumen, H., Moran, D., Lenzen, M., Cairns, I., and Steenge, A., 2014, How severe space weather can disrupt global supply chains: Natural Hazards and Earth System Sciences, v. 14, no. 10, p. 2749–2759, accessed June 2024 at https://doi.org/10.5194/nhess-14-2749-2014.
Schultz, A., 2010, EMScope—A continental scale magnetotelluric observatory and data discovery resource: Data Science Journal, v. 8, published online October 24, 2009, p. IGY6–IGY20, accessed June 2024 at https://doi.org/10.2481/dsj.SS_IGY-009.
WDC-SILSO, 2024, Sunspot number catalogue—1843–2024: Brussels, Royal Observatory of Belgium, accessed June 2024 at https://www.sidc.be/SILSO/home.
For additional information, visit
Disclaimers
Any use of trade, firm, or product names is for descriptive purposes only and does not imply endorsement by the U.S. Government.
Although this information product, for the most part, is in the public domain, it also may contain copyrighted materials as noted in the text. Permission to reproduce copyrighted items must be secured from the copyright owner.
Suggested Citation
Love, J.J., Sobieszczyk, S., Rigler, E.J., Kelbert, A., and Lewis, K.A., 2024, The solar cycle, geology, and geoelectric hazards for power grids (ver. 1.1, October 2024): U.S. Geological Survey Fact Sheet 2024–3036, 4 p., https://doi.org/10.3133/fs20243036.
ISSN: 2327-6932 (online)
Study Area
| Publication type | Report |
|---|---|
| Publication Subtype | USGS Numbered Series |
| Title | The solar cycle, geology, and geoelectric hazards for power grids |
| Series title | Fact Sheet |
| Series number | 2024-3036 |
| DOI | 10.3133/fs20243036 |
| Edition | Version 1.1: October 16, 2024; Version 1.0: October 16, 2024 |
| Publication Date | October 16, 2024 |
| Year Published | 2024 |
| Language | English |
| Publisher | U.S. Geological Survey |
| Publisher location | Reston, VA |
| Contributing office(s) | Geologic Hazards Science Center - Seismology / Geomagnetism |
| Description | 4 p. |
| Country | United States |
| Online Only (Y/N) | Y |
| Additional Online Files (Y/N) | N |