

Annual NLCD (National Land Cover Database)—The Next Generation of Land Cover Mapping
Links
- Document: Report (16.3 MB pdf) , HTML , XML
- Data Release: USGS data release - Annual NLCD Collection 1 Science Products
- NGMDB Index Page: National Geologic Map Database Index Page (html)
- Download citation as: RIS | Dublin Core
Introduction
The widely used National Land Cover Database (NLCD) has long been the foundational land cover source for scientists, resource managers, and decision makers across the United States (U.S. Geological Survey, 2003).
In 2024, a reinvention as Annual NLCD added the key improvement of annual time steps to show decades of change at a higher frequency than the intervals of 2–3 years used in the legacy NLCD. Annual NLCD was derived primarily from the long Landsat satellite data record, and it includes data from other sources (U.S. Geological Survey, 2024).
The first release in 2024 of the Annual NLCD provides Collection 1.0 of products encompassing land cover and land change from 1985 through 2023 for the conterminous United States (CONUS). The Annual NLCD Collection 1.0 consists of six operational products that map the unique characteristics of land cover. A map created from Annual NLCD shows 16 land cover classes for the CONUS in 2023 (fig. 1).
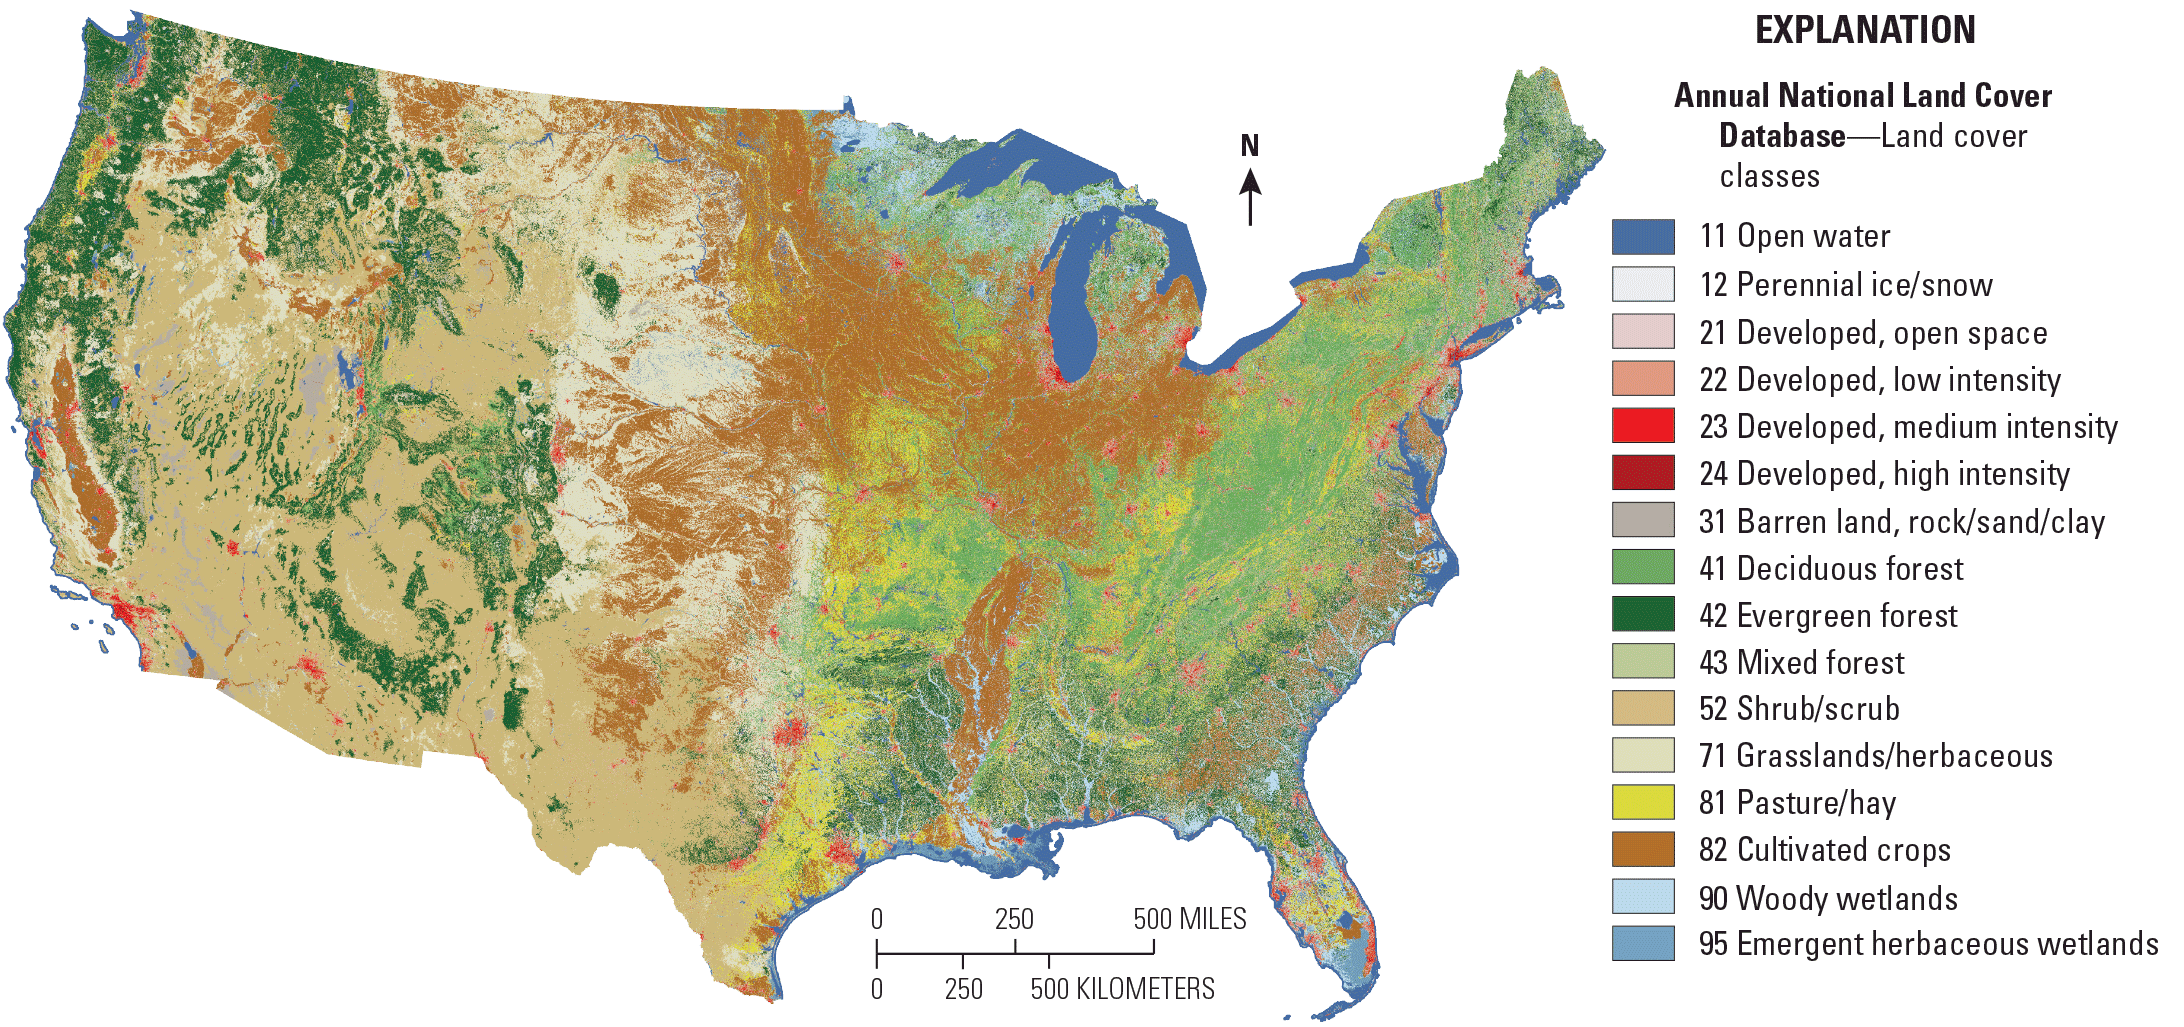
Map showing land cover classes for the conterminous United States in 2023. The map was generated using Collection 1.0 of the Annual National Land Cover Database. The land cover classes are based on a modified Anderson Level II classification system (Anderson and others, 1976).
Why do we need Annual NLCD?
Annual NLCD uses a modernized, integrated approach to map, monitor, synthesize, and understand the complexities of changes in land use, cover, and condition. The Annual NLCD Collection 1.0 can help meet the growing demands described below. Planned annual updates could provide more timely information than the legacy NLCD. An example of land cover changes for 1985 through 2023 is shown in figure 2.
Mapping, monitoring, and understanding both sudden and long-term changes in landscapes ranging from urban to rural and forested to coastal are vital for human, economic, and ecosystem well-being.
We need to know more about the basic drivers of change, identify potential consequences of change, and understand the effects of management decisions, natural hazards, and climate variability. We need land cover and land change products that span larger geographic areas over longer time periods at higher spatial resolutions. To meet these demands, we need a new generation of monitoring data and information.
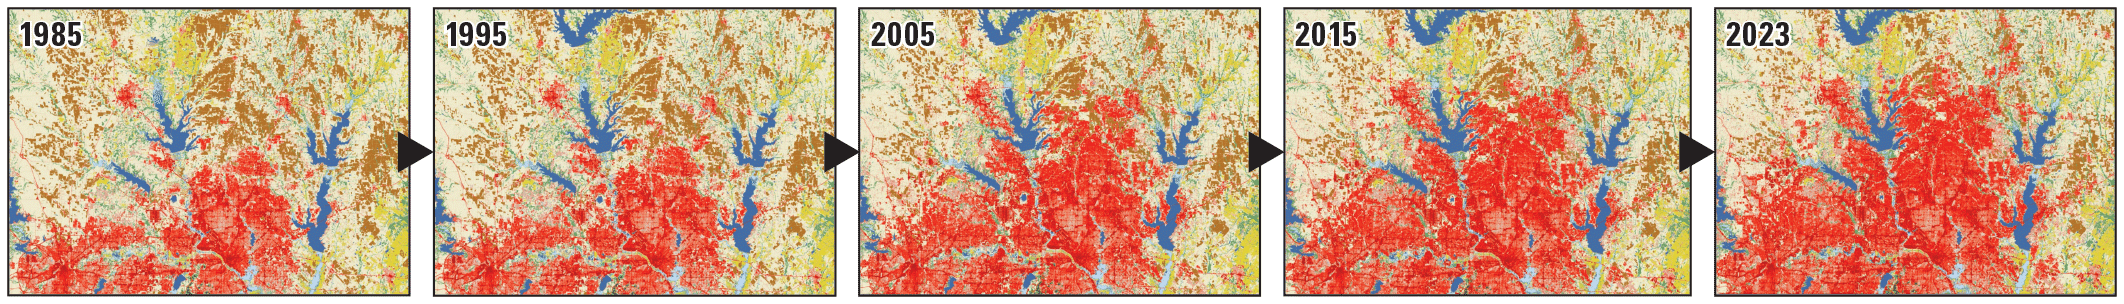
A series of images from the Annual National Land Cover Database for 1985, 1995, 2005, 2015, and 2023 showing land cover changes and the progression of growth of urban areas (in red) in the northern Dallas-Fort Worth, Texas, metropolitan area. The series also records the appearance of Ray Roberts Lake (blue V-shaped object at top center of the last four images) after the 1987 completion of the Ray Roberts Dam.
What are the foundational elements of Annual NLCD?
Annual NLCD represents a blending of the strengths of the legacy NLCD and the Land Change Monitoring, Assessment, and Projection (LCMAP) project. Both used Landsat data (fig. 3). The Earth Resources Observation and Science (EROS) Center of the U.S. Geological Survey (USGS) produced LCMAP and led the effort to create the legacy NLCD. The higher number of land cover classes in NLCD complements the year-to-year time series approach of LCMAP.
These elements provided the basis for the Annual NLCD, which is produced with a specially developed geospatial artificial intelligence (AI) technique and the following types of data:
-
• Landsat Collection 2 U.S. Analysis Ready Data (ARD): land surface satellite imagery processed to the highest standards and having a resolution of 30 meters (about 98 feet).
-
• Land surface change and land cover data.
-
• Independent reference data for validating the satellite-derived land cover classes and for estimating area.
-
• Scenario-driven projections of future land use and land cover extents and patterns.
-
• Assessments focused on land change processes, characteristics, and consequences.
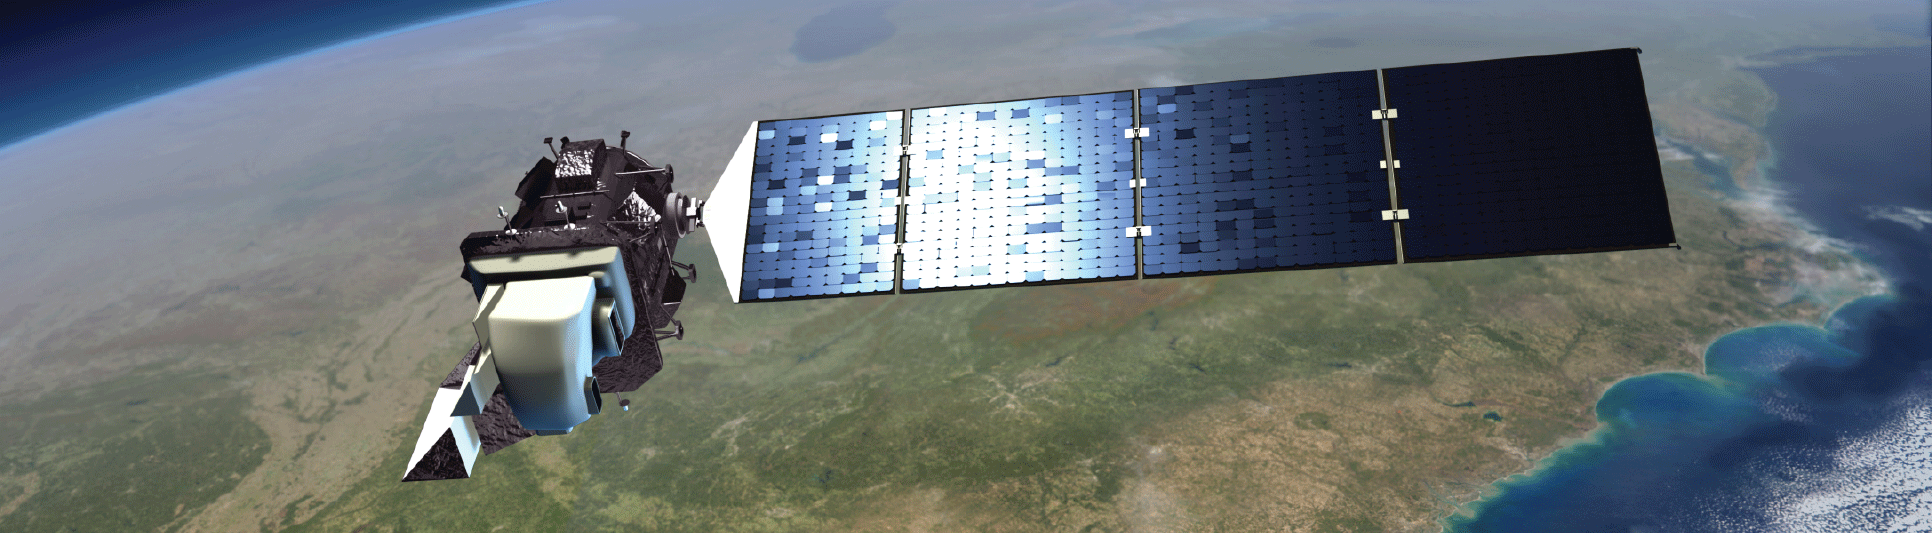
Illustration of a satellite based on Landsat 8 and 9, which is depicted above Earth. Solar panels on one side capture sunlight to power the spacecraft. Landsat satellites have provided imagery of the Earth’s surface since 1972. The image is from the Earth Resources Observation and Science (EROS) Center of the U.S. Geological Survey.
Who produces Annual NLCD?
The USGS leads the work to produce Annual NLCD through an initiative at its EROS Center. It is produced in coordination with the Multi-Resolution Land Characteristics (MRLC) consortium, which is a group of Federal agencies that coordinate and generate consistent and relevant land cover information at the national scale (https://www.mrlc.gov/).
What does Annual NLCD provide?
The Annual NLCD consists of six integrated products for a time series with yearly time steps (sidebar 1). The specific timeframe and geographic region are unique to each collection. Collection 1.0 encompasses the conterminous United States. Future releases could include data for other U.S. geographic regions.
Subsequent annual updates could extend the product series. Newer releases are planned to partially replace previous collections and include an update for the most recent year in the timeframe. Legacy NLCD data will continue to be available in the USGS repository ScienceBase (https://www.sciencebase.gov/catalog/item/6345b637d34e342aee0863aa).
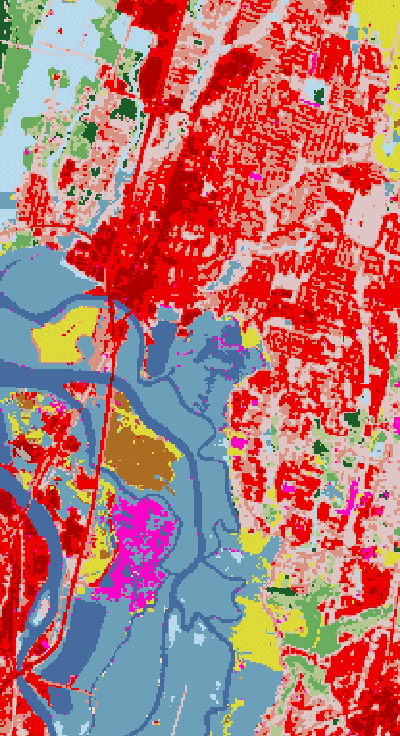
Sidebar 1. Product Suite for the Annual National Land Cover Database
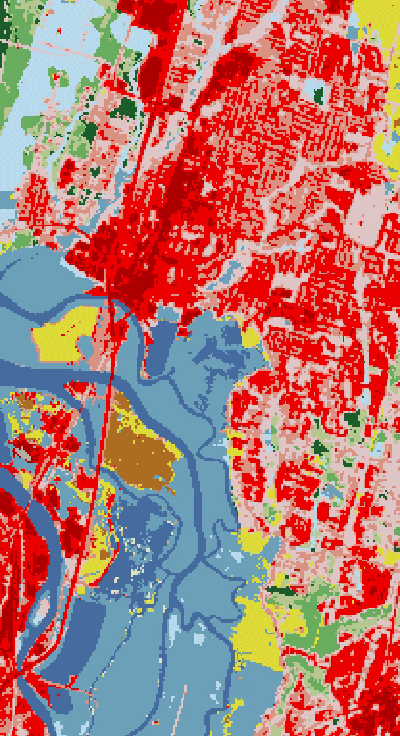
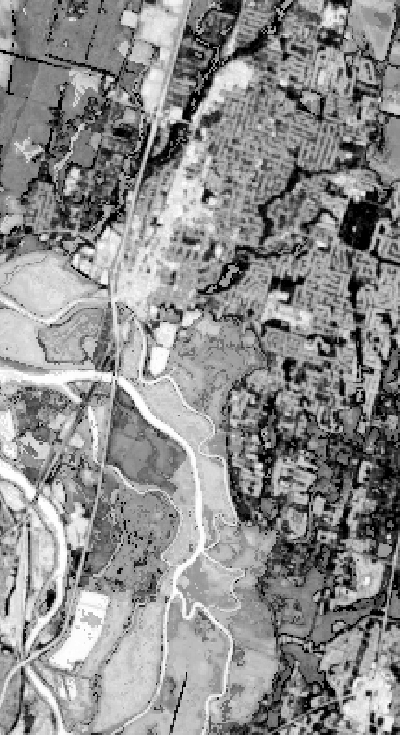
Six land cover and land use images shown below are examples of products provided in Collection 1.0 of the Annual National Land Cover Database (NLCD). The first image shows the land cover classification in the Marysville, Washington, area near Seattle. The following images depict other products related to the same location. The second image uses pink to show a change in land cover from an earlier year. That particular area in pink, Smith Island, underwent a restoration from grassland to its natural tidal marsh estuary state to provide habitat for salmon, including the Chinook salmon (Oncorhynchus tshawytscha).
Land Cover
The land cover product represents the predominant state of the land surface within the mapping year with respect to 16 broad categories of artificial or natural cover. It is based on a modified Anderson Level II classification system (Anderson and others, 1976).
Land Cover Change
The land cover change product represents the nature of landscape change from one product year to the next. This shows the specific characteristics of land cover change on an annual basis.
Land Cover Confidence
The land cover confidence is the measure of confidence that the land cover label matches the deep learning training data.
Fractional Impervious Surface
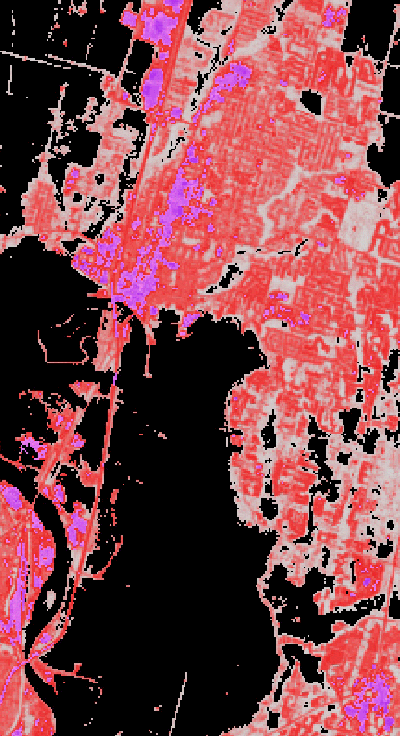
The impervious surface product provides the fractional, or percentage, surface area of a map pixel that represents the amount of developed impervious surface in an area 30×30 meters (about 98×98 feet). This categorization is a summary of pavement, concrete, and rooftops that shed water and create runoff. This metric provides foundational-level data for understanding things like surface runoff, flooding events, and urban heat island effects.
Impervious Descriptor
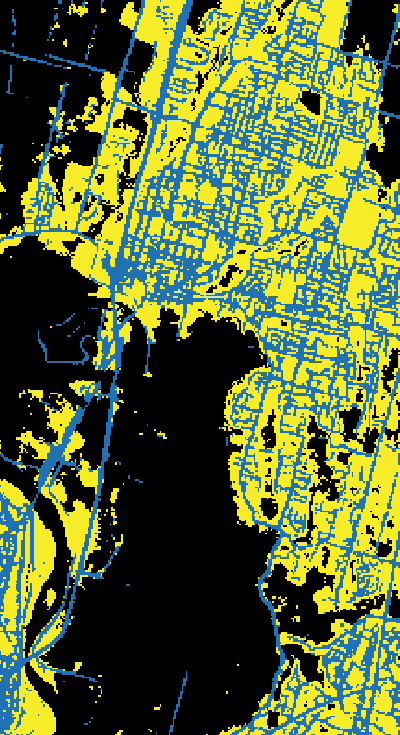
The impervious descriptor product provides a map of road networks within impervious areas and distinguishes roads from other built surfaces. This product can be especially useful in distinguishing developed usage in agricultural areas where there may be highly developed amounts that are made up almost entirely of roads.
Spectral Change Day of Year
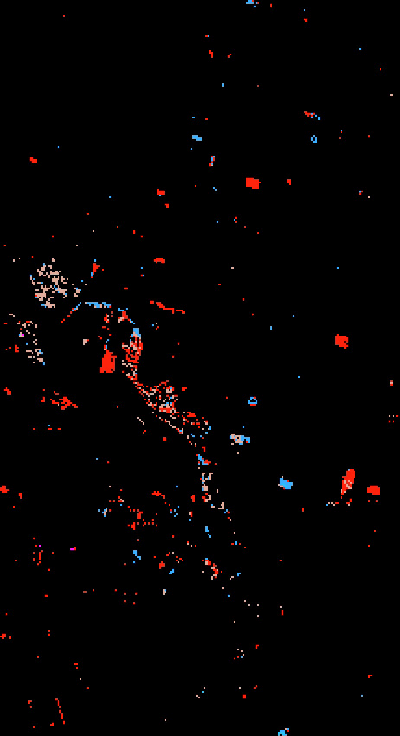
The spectral change product provides the day-of-year (DOY) on which any significant change in surface reflectance was detected in Landsat data within the calendar year of the map product. Black represents no change, and here the colors are used to illustrate the depth of the product variability and represent the Julian day of year when a change was detected. Spectral changes represent abrupt changes in the land surface that may lead to a change in land cover class.
What are some examples of NLCD’s usefulness?
Work began on the legacy NLCD in 1992. NLCD’s data releases have supported thousands of applications in the private, public, and academic sectors (fig. 4). NLCD has been used to assess ecosystem status and health, understand spatial patterns of biodiversity, understand climate change, and develop land management policy.
NLCD is a critical data layer in wildfire monitoring and modeling and national assessments of surface-water and groundwater quality, urban heat risk (fig. 5), biological carbon sequestration, biodiversity conservation efforts, and much more.
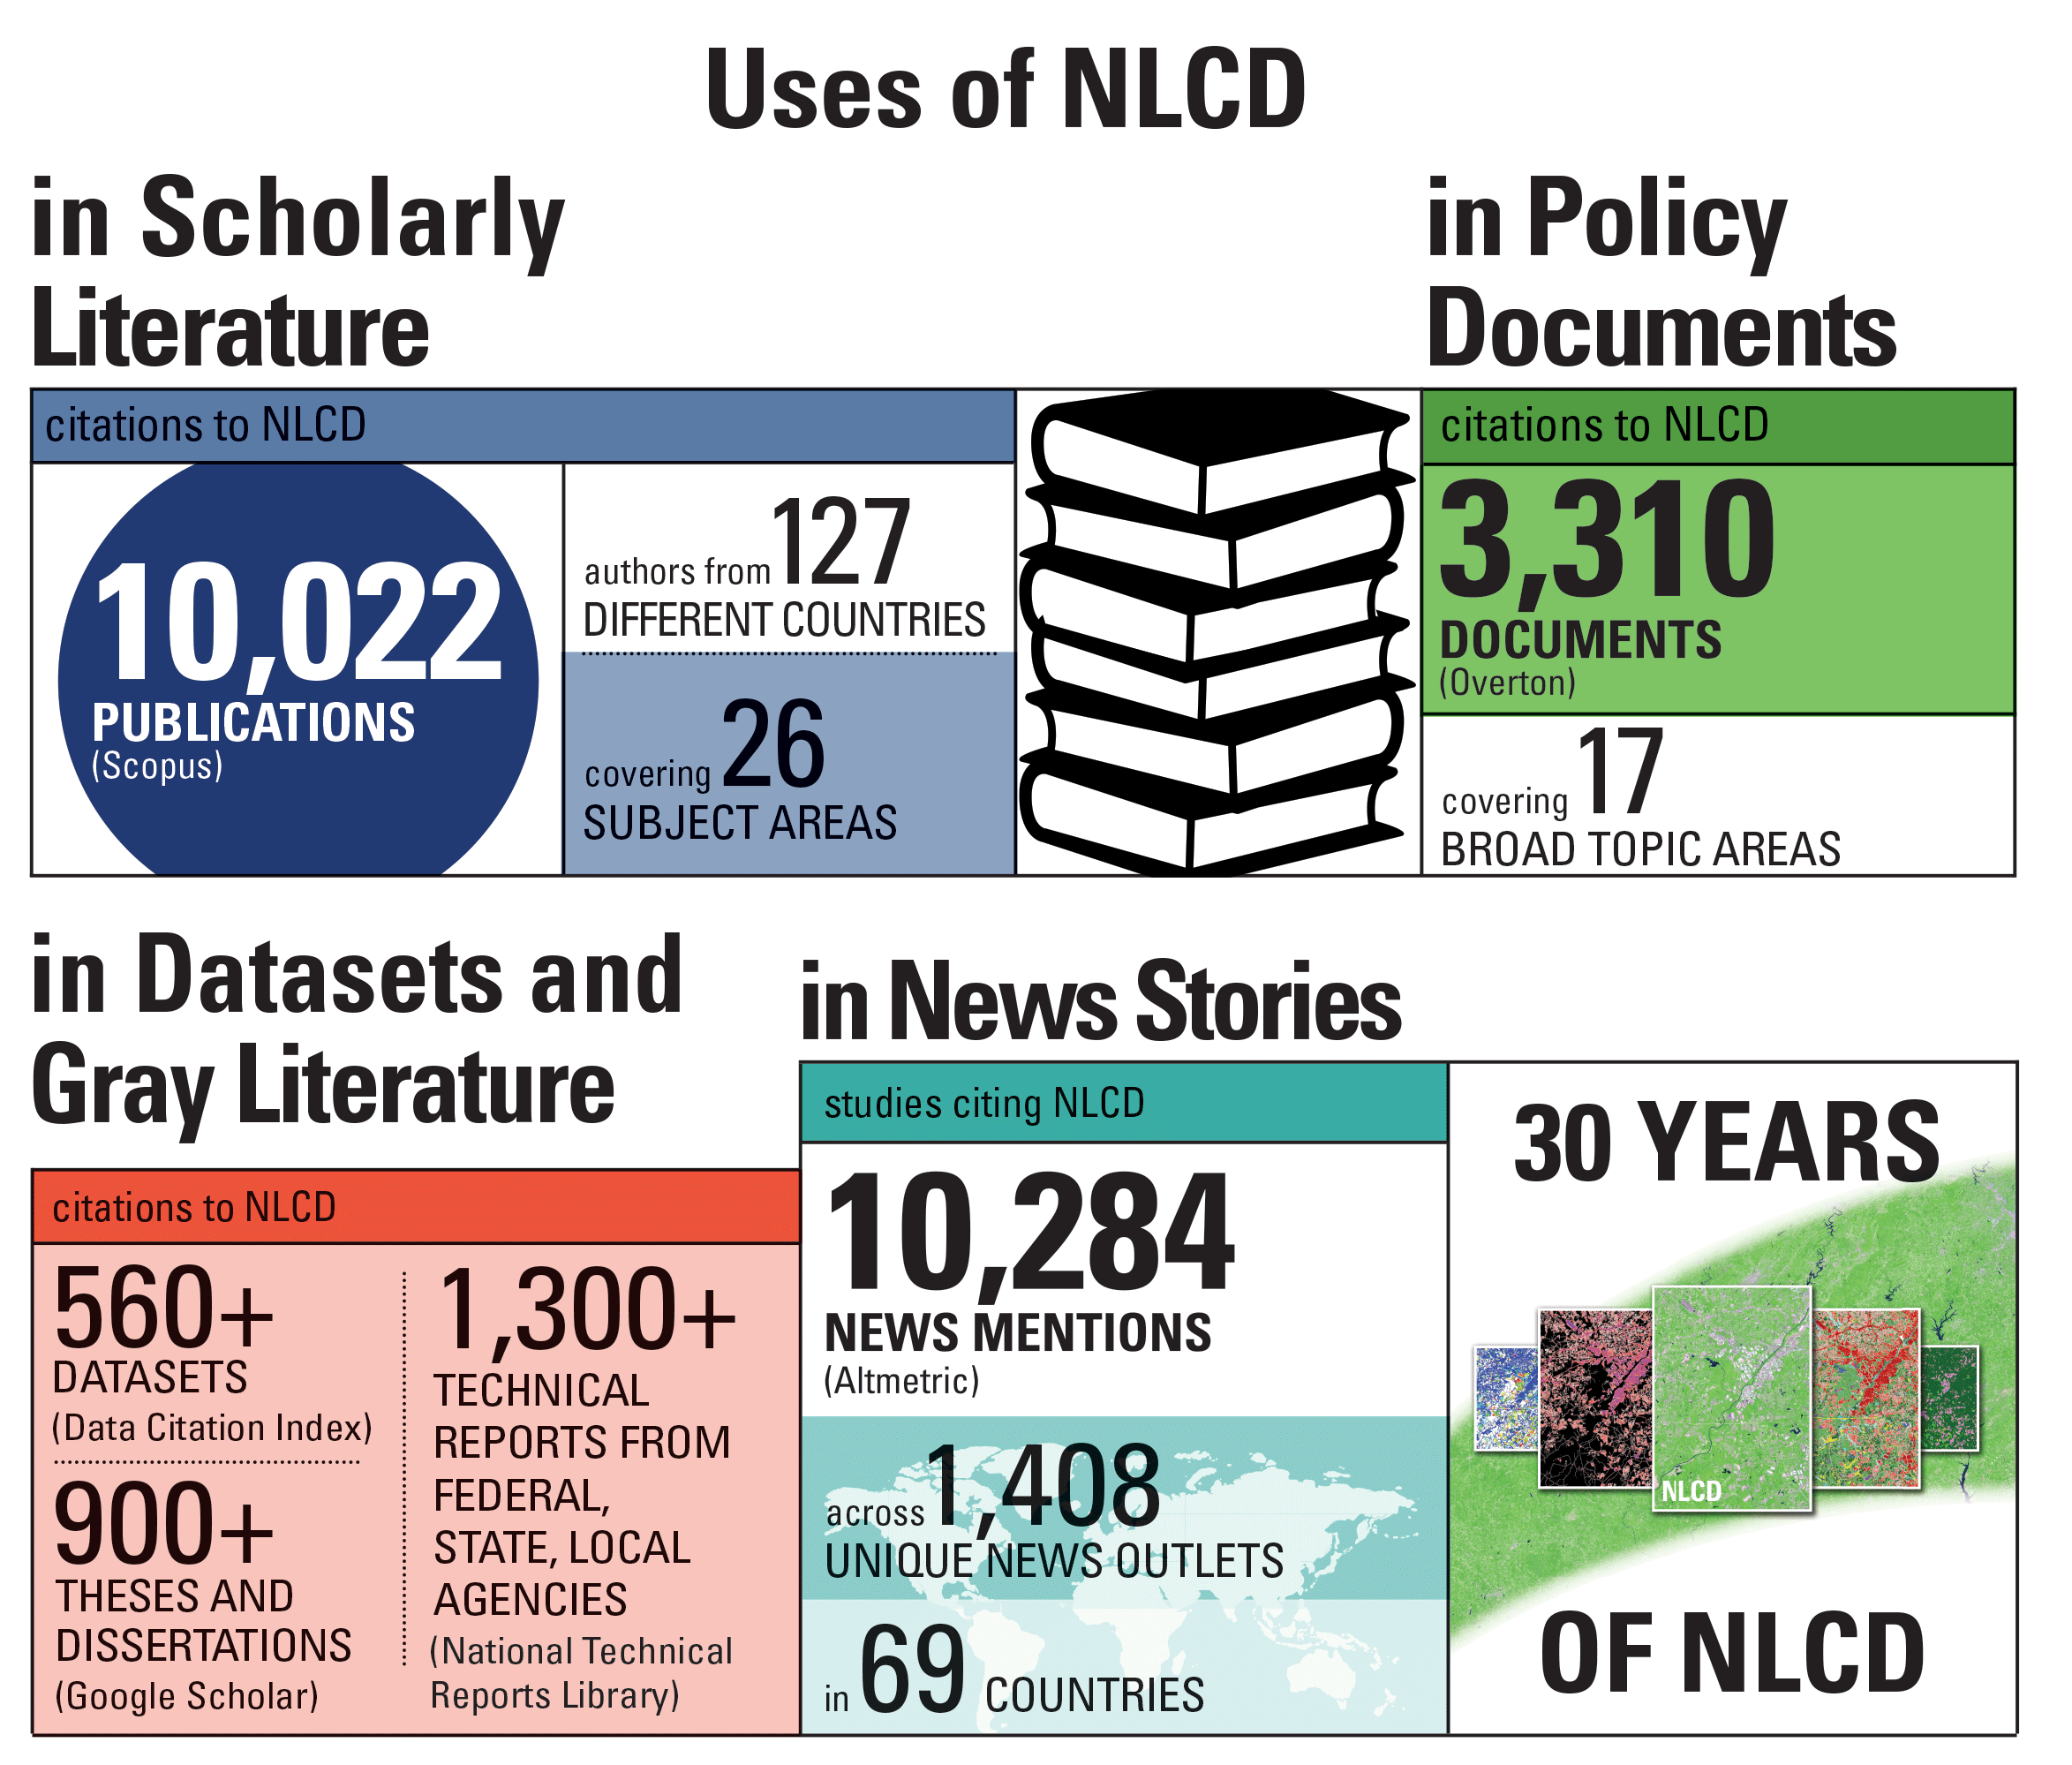
Graphic illustrating the breadth of use of the legacy National Land Cover Database (NLCD) through the years since 1992. Graphic created by the Earth Resources Observation and Science (EROS) Center of the U.S. Geological Survey.
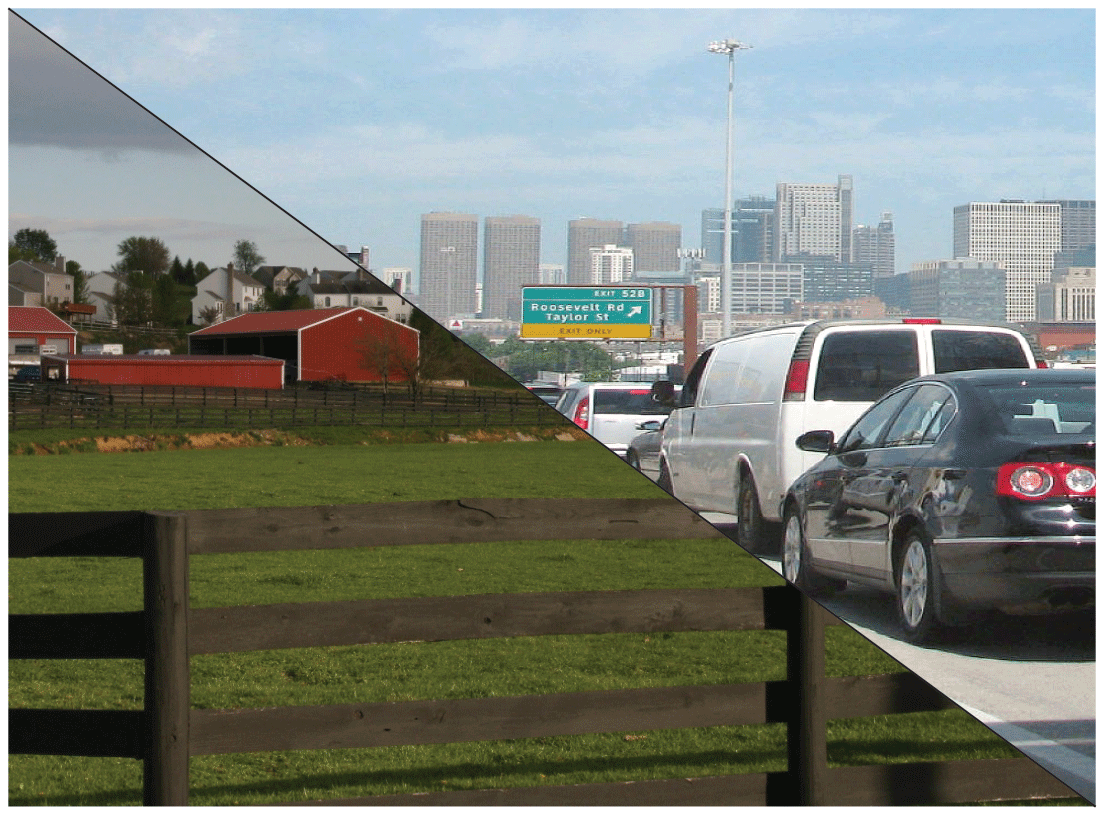
The Annual National Land Cover Database has land cover classes indicating the amount of impervious, or artificial, surfaces, which affect surface runoff and urban heat risks. Farmlands bordering housing developments, as in Frederick County, Maryland (left photograph by Roger Auch of the U.S. Geological Survey), have lower levels of imperviousness than centers of cities such as Chicago (right photograph by Eileen Hornbaker of the U.S. Fish and Wildlife Service).
How is accuracy determined for Annual NLCD?
To assess the accuracy of the Annual NLCD Collection 1.0, a team of image interpreters reviews Landsat imagery, high-resolution aerial photography, and other supporting data to make annual land cover classifications for thousands of plots measuring 30×30 meters (about 98×98 feet) for the full 1985–2023 time series. The assessment is done in two phases. Phase 1 for the Collection 1.0 reference dataset includes 5,000 randomly distributed plots (fig. 6). Phase 2 involves a stratified sample of up to 5,000 additional plots that capture annual changes over time and rare land cover types in the dataset.
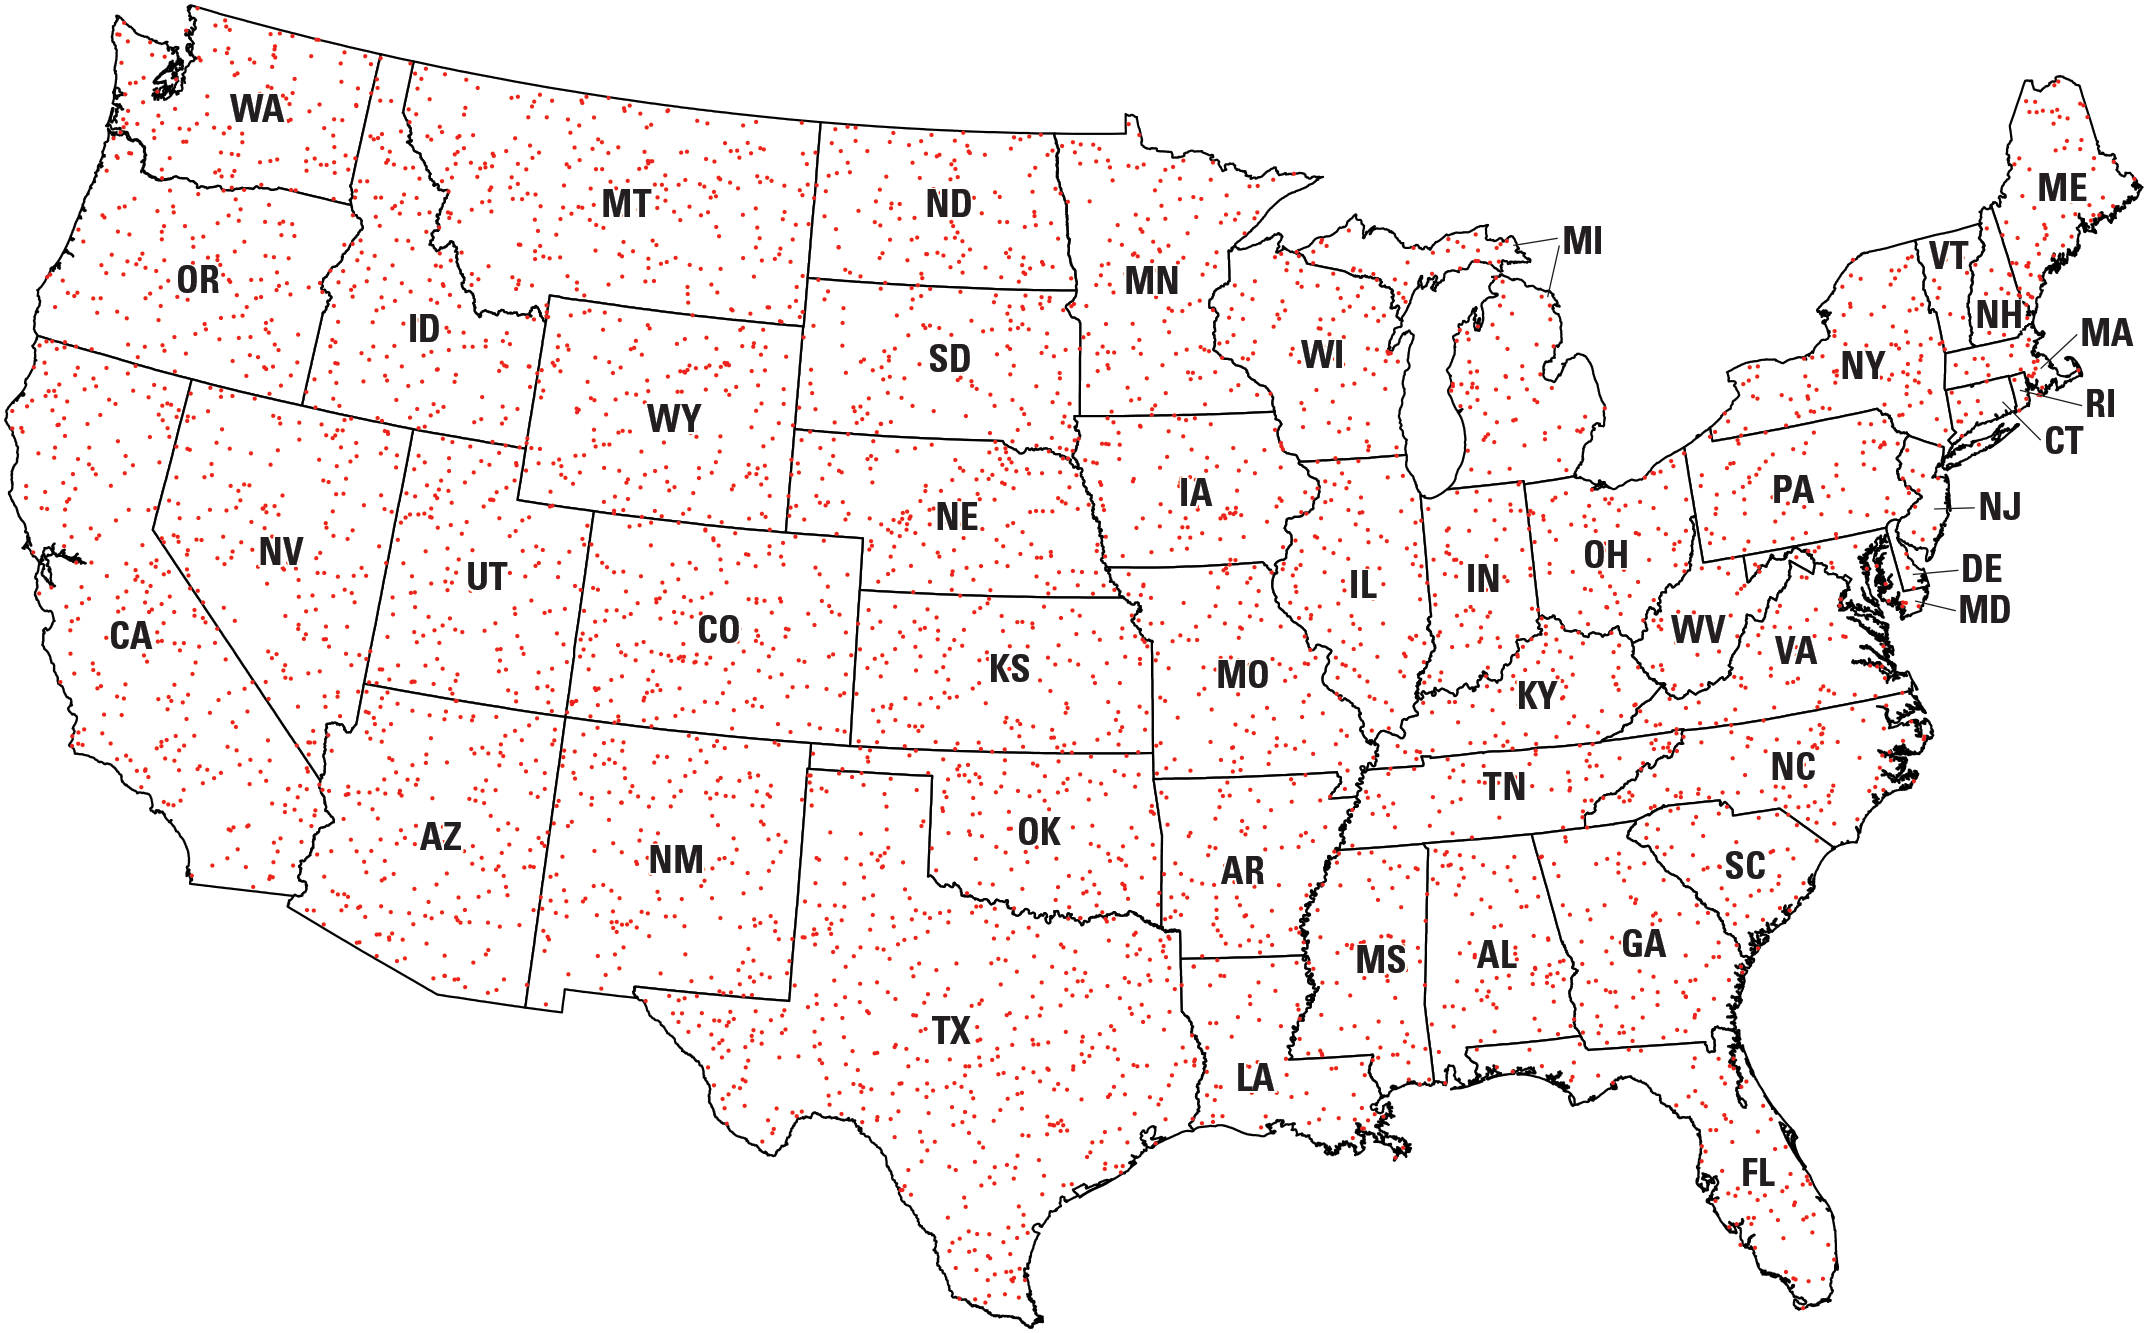
Map of the continental United States showing the 5,000 plots used in phase 1 of assessing the accuracy of map products from the Annual National Land Cover Database. Map created by the Earth Resources Observation and Science (EROS) Center of the U.S. Geological Survey.
What’s different from the legacy NLCD?
Annual NLCD (containing data through 2023 and released in 2024) and the legacy NLCD (containing data through 2021 and released in 2023), are significantly different. Table 1 compares selected features of the two databases. The descriptions for the legacy NLCD are from Dewitz (2023) and those for Annual NLCD are from U.S. Geological Survey (2024).
Table 1.
Comparison of features in two versions of the National Land Cover Database (NLCD).[Terms: LCC, Land Cover Change; MRLC, Multi-Resolution Land Characteristics (MRLC) consortium; MRLC EVA tool, MRLC Enhanced Visualization and Analysis tool]
| Feature | Annual NLCD with data through 2023 (from U.S. Geological Survey, 2024) |
Legacy NLCD with data through 2021 (from Dewitz, 2023) |
|---|---|---|
| Release frequency | Yearly | Every 2–3 years |
| Number of land cover classes | 16 | 16, plus 4 additional for Alaska |
| Years included | Yearly, from 1985 to the year preceding a new release | 2001, 2004, 2006, 2008, 2011, 2013, 2016, 2019, 2021 |
| Products | • Land Cover • Land Cover Change • Land Cover Confidence • Fractional Impervious Surface • Impervious Descriptor • Spectral Change Day of Year |
• Land Cover • LCC Index • Urban Imperviousness • Urban Impervious Descriptor • Science Products, including LCC Disturbance Date, Forest Disturbance Date, LCC Count, and Land Cover with Additional Forest Transition Classes such as Tree Canopy Cover |
| Remote sensing source | Landsat | Landsat |
| Data access | • MRLC website • MRLC NLCD Viewer • MRLC EVA Tool • ScienceBase • EarthExplorer • Cloud |
• MRLC website • MRLC NLCD Viewer • MRLC EVA Tool • ScienceBase • The National Map • Amazon Web Services |
| Production method | Involves three types of deep learning models integrated into a novel geospatial artificial intelligence (AI) solution to process, encode, and map land cover using Landsat timeseries imagery and curated sets of land cover training data | Integration of MRLC partner data, shape and context analysis for each cover type, land cover succession and trajectory analysis through time; and change detection techniques fused into evidence analysis via artificial intelligence and machine learning (AI/ML) |
For more information
Science products and associated interfaces for the Annual National Land Cover Database (NLCD) are supported by User Services staff at the USGS Earth Resources Observation and Science (EROS) Center. Questions or comments regarding Annual NLCD science products or interfaces are welcome. Email can be sent to EROS User Services with the topic indicated in the subject line. User support is available Monday through Friday from 8:00 a.m. to 4:00 p.m. Central Time. Inquiries received outside of those hours are addressed the next business day.
-
Telephone: 605–594–6151 or 1–800–252–4547
-
Email: custserv@usgs.gov
Get the data: NLCD products produced by the USGS are available for download at no charge from a variety of sources. Among these are cloud services, which are also available for processing; they may include data egress fees. Visit the “Annual NLCD Data Access” web page (https://www.usgs.gov/centers/eros/science/data-access) to discover how to search and download Annual NLCD products from data portals.
Get the latest news about Annual NLCD: To keep up with the latest news, publications, and data releases, visit Annual NLCD on the web: usgs.gov/annualnlcd.
References Cited
Anderson, J.R., Hardy, E.E., Roach, J.T., and Witmer, R.E., 1976, A land use and land cover classification system for use with remote sensor data: U.S. Geological Survey Professional Paper 964, 28 p., accessed October 1, 2024, at https://doi.org/10.3133/pp964.
Dewitz, J., 2023, National Land Cover Database (NLCD) 2021 products: U.S. Geological Survey data release, accessed October 1, 2024, at https://doi.org/10.5066/P9JZ7AO3.
U.S. Geological Survey, 2003, National Land Cover Database (NLCD) 2001 Land Cover Conterminous United States (ver. 2.0, July 2024): U.S. Geological Survey data release, accessed October 1, 2024, at https://doi.org/10.5066/P9MZGHLF.
U.S. Geological Survey, 2024, Annual NLCD Collection 1 Science Products: U.S. Geological Survey data release, accessed October 28, 2024, at https://doi.org/10.5066/P94UXNTS.
Disclaimers
Any use of trade, firm, or product names is for descriptive purposes only and does not imply endorsement by the U.S. Government.
Although this information product, for the most part, is in the public domain, it also may contain copyrighted materials as noted in the text. Permission to reproduce copyrighted items must be secured from the copyright owner.
Suggested Citation
U.S. Geological Survey, 2025, Annual NLCD (National Land Cover Database)—The next generation of land cover mapping: U.S. Geological Survey Fact Sheet 2025–3001, 4 p., https://doi.org/10.3133/fs20253001.
ISSN: 2327-6932 (online)
ISSN: 2327-6916 (print)
Study Area
| Publication type | Report |
|---|---|
| Publication Subtype | USGS Numbered Series |
| Title | Annual NLCD (National Land Cover Database)—The next generation of land cover mapping |
| Series title | Fact Sheet |
| Series number | 2025-3001 |
| DOI | 10.3133/fs20253001 |
| Publication Date | January 17, 2025 |
| Year Published | 2025 |
| Language | English |
| Publisher | U.S. Geological Survey |
| Publisher location | Reston, VA |
| Contributing office(s) | Earth Resources Observation and Science (EROS) Center |
| Description | Report: 4 p.; Data Release |
| Country | United States |
| Other Geospatial | conterminous United States |
| Online Only (Y/N) | N |
| Additional Online Files (Y/N) | N |