

Fiber-Optic Distributed Temperature Sensing of Hydrologic Processes—Diverse Deployments and New Applications by the U.S. Geological Survey
Links
- Document: Report (17.1 MB pdf) , HTML , XML
- Download citation as: RIS | Dublin Core
What Is Fiber-Optic Distributed Temperature Sensing, and How Has It Been Used by the U.S. Geological Survey?
Fiber-optic distributed temperature sensing (FO–DTS) instruments, sometimes referred to as “kilometer thermometers,” harness the temperature-dependent properties of glass to measure temperature continuously along optical fibers by using precise pulses of laser light. Hydrologic processes can create distinct thermal signals, particularly processes that occur at the interface between groundwater and surface water (GW/SW) and in the shallow subsurface. Coupled GW/SW systems are highly dynamic in time and space, however, which often makes discrete temperature measurements inadequate for capturing data from these systems. Unlike remotely sensed thermal infrared data, FO–DTS measurements are made on site and represent the temperature of glass fiber of about 0.25 to 2 meters, continuously over kilometers of armored cable (fig. 1). FO–DTS data are therefore well suited for identifying focused, or preferential, zones of hydrologic exchange that are unevenly distributed in space across surface-water systems. Data are typically collected over days to weeks at timesteps ranging from seconds to hours. Unlike data collected by many temperature-sensing instruments, the precision of data from FO–DTS instruments is partly user defined: precision increases from about 0.2 degree Celsius to 0.01 degree Celsius as the integration length of each measurement and total measurement time are increased. The user makes measurement configuration tradeoffs between the desired spatiotemporal resolution and the scale in time and space of the dynamic hydrologic processes of interest. FO–DTS data can also be averaged over time in postprocessing to increase temperature measurement precision.
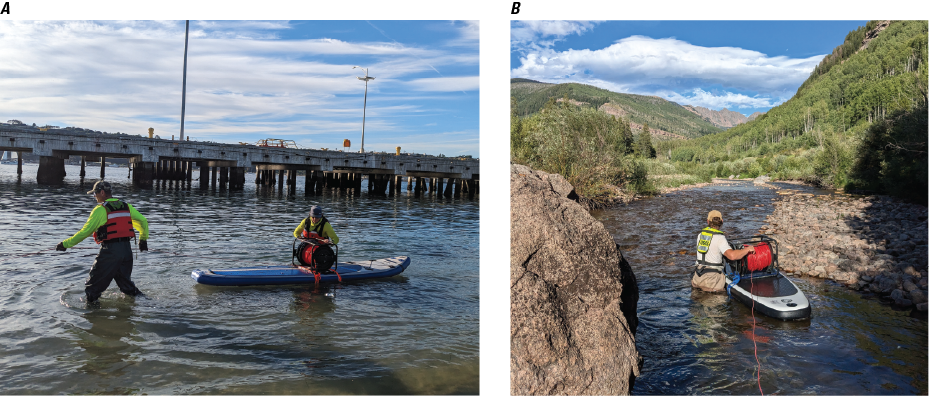
U.S. Geological Survey employees and collaborators installing armored fiber-optic distributed temperature sensing cables along A, a tidal zone in southern California, and B, a mountain streambed in Colorado, both with the purpose of mapping areas of preferential groundwater discharge to guide tracer injection and the deployment of streambed instrumentation to measure groundwater/surface-water exchange flux patterns. Photographs by Martin A. Briggs, U.S. Geological Survey.
Examples of FO–DTS Applied to Diverse Hydrologic Monitoring
When FO–DTS instruments came onto the commercial market in the mid-2000s, it became easier to measure hydrologic processes such as snowpack-air exchange, GW/SW exchange, and lake-water stratification (Selker and others, 2006; Tyler and others, 2009). Lane and others (2008) aptly summarized FO–DTS technology as providing “a new opportunity to observe and monitor a wide range of hydrologic processes with application to other disciplines including hazards, climate-change, and ecosystem monitoring.”
The U.S. Geological Survey (USGS) initially tested the method in locations including the Shenandoah River in Virginia; Fish Creek near Jackson Hole, Wyoming; and Waquoit Bay in coastal Falmouth, Massachusetts. Cables deployed down the center of the channel and near the bank of the Shenandoah River clearly defined streambed groundwater discharge patterns in a karst system. FO–DTS data collected along Fish Creek over about 24 hours highlighted the importance of complementary data types for verifying and quantifying discharge dynamics, because processes such as shading and pooling in a stream can have thermal signatures similar to those of groundwater discharge. The Waquoit Bay application demonstrated the novel use of FO–DTS data collected in a gridded layout to track the influence of temporal patterns in tidal pumping on nearshore submarine groundwater discharge (Henderson and others, 2009). Lessons from these early demonstrations resulted in improved methods for deployment of FO–DTS instruments and analysis of FO–DTS data that are used widely across the hydrologic heat tracing community today.
FO–DTS instruments measure temperature over linear increments of fiber-optic cable, but the spatial resolution is determined by how the cables are deployed. For example, thin cables can be wrapped at a consistent pitch around vertical pipes to convert meter-scale linear measurements into realized centimeter-scale measurements along the wrapped sections. The USGS applied this wrapped-fiber approach to build high-resolution vertical temperature profilers that were used in New York to track a groundwater discharge plume in two dimensions where it entered into the Delaware River at a location coinciding with niche Prolasmidonta heterodon (dwarf wedgemussel) habitat (Briggs and others, 2013). Furthermore, natural temperature signals are muted in strong groundwater discharge zones, limiting the usefulness of ambient heat tracing methods. For a USGS study on Salvelinus fontinalis (brook trout) habitat along the groundwater-dominated Quashnet River on Cape Cod, Mass., high-resolution temperature profilers were actively heated to induce temperature signals to estimate high discharge flux rates (fig. 2; Briggs and others, 2016). In 2019, the USGS published a graphical user interface to enable efficient postprocessing, visualization, and spatial referencing of raw FO–DTS data (Domanski and others, 2020) that complements additional publicly available software from the Center for Transformative Environmental Monitoring Programs (https://ctemps.org/data-processing).
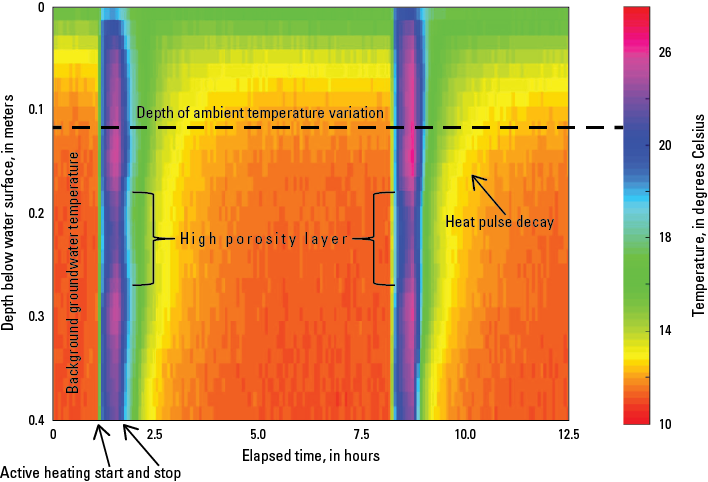
Riverbed temperatures collected over time along a vertical profile at a groundwater discharge site along the Quashnet River, Cape Cod, Massachusetts. Active heating of wrapped vertical fiber-optic distributed temperature sensing instruments allows heat tracing at centimeter-scale resolution below the depth of ambient temperature variation in strong groundwater discharge zones (modified from Briggs and others, 2016).
Recent applications of USGS FO–DTS to research and site-characterization projects resulted in high spatial precision mapping of contaminated groundwater discharge in highly complex hydrogeological settings. For example, at the Bremerton Naval Complex on the shore of Puget Sound in Washington, sediments are contaminated with polychlorinated biphenyls and mercury (Conn and others, 2024). An FO–DTS system was deployed along the western unwalled shoreline of the Naval Complex from July 30 to August 7, 2020 (fig. 3). Data were collected during daytime low tides coincident with high air temperatures (as much as 28 degrees Celsius on August 4, 2020), which maximized temperature differences between cold discharging groundwater and warm receiving marine surface water and helped identify locations for chemical sampling (fig. 3).
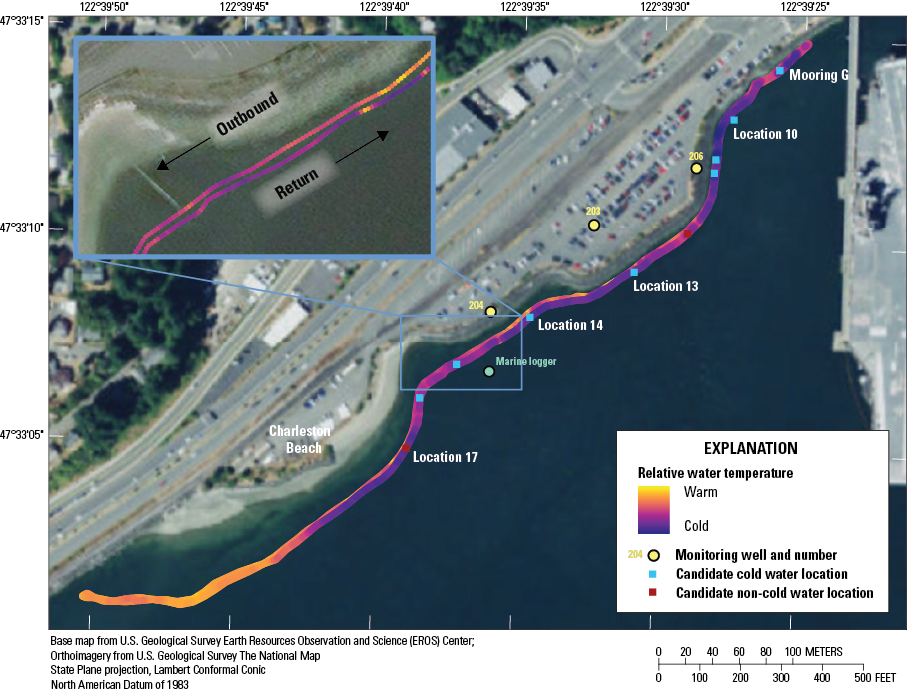
Near-bed thermal surveys along the western unwalled shoreline of the Bremerton Naval Complex in Washington (data shown are from August 4, 2020) to locate points of terrestrial groundwater discharge (from Conn and others, 2024).
Another recent example is from Cement Creek, a high-elevation headwater stream north of Silverton, Colorado, that is substantially affected by acid mine drainage and natural weathering of sulfides. Despite decades of detailed hydrologic study, questions remained about the spatial distribution and rates of acid mine drainage to the stream. A FO–DTS system was deployed over several days during summer 2019, revealing multiscale areas of groundwater discharge to the stream and surface inflow from hillslope mine shaft drainage. However, data interpretation was complicated by storm events and the short duration of the deployment. To better understand groundwater exchanges at the site, a solar-powered FO–DTS system was deployed for several months in 2023. Measurement drift calibration points were defined in deep, well-mixed pools of the stream instead of in streambank water baths, which require periodic maintenance and can run dry (fig. 4). Data from the long-term FO–DTS deployment were used in conjunction with vertical temperature profilers placed in acid mine drainage seepage zones to identify zones of groundwater discharge and to quantify discharge rates from two groundwater systems. These systems were identified by using environmental tracers and stable isotopes, and the ongoing analysis of the FO–DTS data continues to aid in the holistic understanding of this complex, impaired watershed.
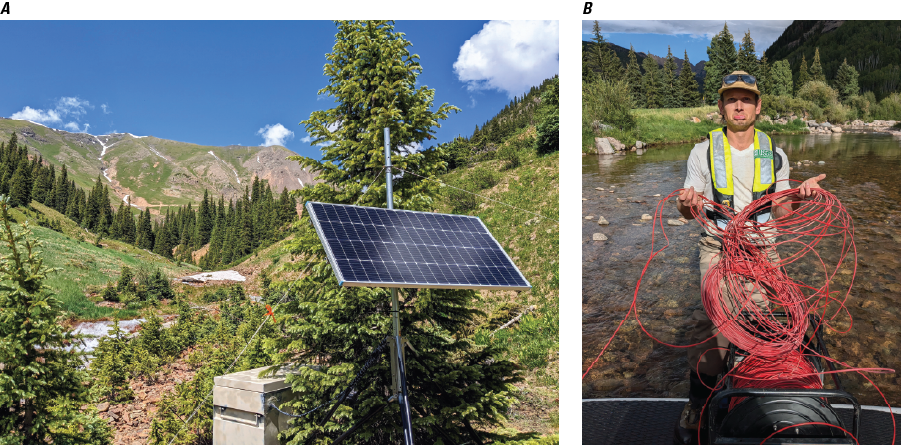
A fiber-optic distributed temperature sensing (FO–DTS) monitoring system along an acid mine drainage stream in Silverton, Colorado. A, Constant solar-powered FO–DTS system was installed for several months of remote data collection. B, Practical complications in the field deployment of FO–DTS, such as tangled cables and broken fibers, are generally manageable with planning and patience but tend to preclude broad use of the monitoring method. Photographs by Martin A. Briggs, U.S. Geological Survey.
Application to U.S. Geological Survey Hydrologic Monitoring Technology Testbeds
The Next Generation Water Observing System (NGWOS) program tests new hydrologic monitoring technology at scales ranging from very small stream basins (as much as 1 square kilometer) to medium-sized river basins (hundreds of square kilometers). As of 2024, testing has been conducted at stream reach-scale monitoring locations that have both experimental and commonly used monitoring technology. These monitoring locations, known as testbeds, were developed to study water processes of high regional interest. In 2019, the first NGWOS testbed was established in the upper Delaware River Basin (USGS sites 01434498 and 01435000) to monitor the resilience of stream base-flow (groundwater-derived) sources from point to watershed scales. FO–DTS was applied when establishing the testbed to identify groundwater discharge from multiple aquifer zones (for example, shallow hillslope, deep alluvium, and fractured bedrock) and to help develop a conceptual model of stream base-flow generation, guiding additional long-term instrumentation testing.
In 2024, research on how GW/SW exchange affects the fate and transport of nitrate contamination was conducted by the NGWOS program across the Illinois River Basin. The Mason Tazewell Drainage Ditch in Mason County, Illinois (USGS site 05568705), and Kankakee River at Davis, Indiana (USGS site 5515500), serve as NGWOS technology testbed sites in areas of nutrient loading to surface water via groundwater discharge. Each site had multiple wells screened at different depths (well depths ranging from 8 to 33 feet). These wells were instrumented to measure dissolved oxygen, specific conductance, water temperature, and nitrate concentrations. Additionally, groundwater-level and groundwater-flow (velocity and direction) data were collected. These data were supplemented with discrete water quality sampling data that described groundwater transit times and isotopes of nitrogen and water. FO–DTS was used at these sites to precisely map discharge points across the streambed and generate a holistic understanding of shallow, lateral groundwater flow processes. Vertical temperature profiles were collected with FO–DTS to monitor groundwater discharge over time in the shallow streambed.
Opportunities for Broader Implementation of FO–DTS Monitoring
By measuring temperature over time using armored kilometer-scale glass fibers, FO–DTS has revealed unprecedented details about preferential flow processes in systems with GW/SW exchange. However, the method is labor intensive (see fig. 4B) and requires specific training, and those considerations have resulted in limited use by the applied science community. In addition to evaluating groundwater discharge to streams, hydrologic FO–DTS has been deployed vertically in shallow monitoring wells to identify preferential flow zones in aquifers, an application that is currently gaining greater interest. Conceivably, FO–DTS can be combined with fiber-optic distributed acoustic sensing to generate new hydrologic insights from paired temperature and vibration data along monitoring-well intervals. Methods have been developed for using actively heated FO–DTS to map soil moisture on site at the submeter scale that could be applied to agricultural plots, such as vineyards and orchards, which are highly susceptible to climate change and extreme weather events. Finally, there is a need for long-term FO–DTS stream deployments to track niche cold-water fish habitat characteristics (Mejia and others, 2023). These are just a few of the novel research and applied projects where FO–DTS can add value.
Acknowledgments
We thank John Lane and Fred Day-Lewis for their early adoption of FO–DTS technology and creative testing for the monitoring of groundwater/surface-water exchange processes. Jake Kurzweil, Kelli Palko, and Jackson Sharp assisted with the Cement Creek FO–DTS data collection. Finally, the authors thank many other U.S. Geological Survey colleagues and external collaborators who provided additional field data collection and data processing for the projects summarized in this fact sheet.
References Cited
Briggs, M.A., Buckley, S.F., Bagtzoglou, A.C., Werkema, D.D., and Lane, J.W., Jr., 2016, Actively heated high-resolution fiber-optic-distributed temperature sensing to quantify streambed flow dynamics in zones of strong groundwater upwelling: Water Resources Research, v. 52, no. 7, p. 5179–5194, accessed March 3, 2024, at https://doi.org/10.1002/2015WR018219.
Briggs, M.A., Voytek, E.B., Day-Lewis, F.D., Rosenberry, D.O., and Lane, J.W., 2013, Understanding water column and streambed thermal refugia for endangered mussels in the Delaware River: Environmental Science & Technology, v. 47, no. 20, p. 11423–11431, accessed March 3, 2024, at https://doi.org/10.1021/es4018893.
Conn, K.E., Janssen, S.E., Opatz, C.C., and Bright, V.A.L., 2024, A conceptual site model of contaminant transport pathways from the Bremerton Naval Complex to Sinclair Inlet, Washington, 2011–21: U.S. Geological Survey Scientific Investigations Report 2024–5011, 111 p., accessed June 1, 2024, at https://doi.org/10.3133/sir20245011.
Domanski, M., Quinn, D., Day-Lewis, F.D., Briggs, M.A., Werkema, D., and Lane, J.W., Jr., 2020, DTSGUI—A Python program to process and visualize fiber-optic distributed temperature sensing data: Groundwater, v. 58, no. 5, p. 799–804, accessed March 03, 2024, at https://doi.org/10.1111/gwat.12974.
Henderson, R.D., Day-Lewis, F.D., and Harvey, C.F., 2009, Investigation of aquifer-estuary interaction using wavelet analysis of fiber-optic temperature data: Geophysical Research Letters, v. 36, article L06403, 6 p., accessed March 3, 2024, at https://doi.org/10.1029/2008GL036926.
Lane, J.W., Day-Lewis, F.D., Johnson, C.D., Dawson, C.B., Nelms, D.L., Eddy-Miller, C.A., Wheeler, J.D., Harvey, C.F., and Karam, H., 2008, Fiber-optic distributed temperature sensing—A new tool for assessment and monitoring of hydrologic processes, in Kaufmann, R., ed., 21st Symposium on the Application of Geophysics to Engineering and Environmental Problems, Philadelphia, Pa., April 6–10, 2008: Environmental and Engineering Geophysical Society, p. 318–26, accessed March 3, 2024, at https://doi.org/10.4133/1.2963272
Mejia, F.H., Ouellet, V., Briggs, M.A., Carlson, S.M., Casas-Mulet, R., Chapman, M., Collins, M.J., Dugdale, S.J., Ebersole, J.L., Frechette, D.M., Fullerton, A.H., Gillis, C.-A., Johnson, Z.C., Kelleher, C., Kurylyk, B.L., Lave, R., Letcher, B.H., Myrvold, K.M., Nadeau, T.-L., Neville, H., Piégay, H., Smith, K.A., Tonolla, D., and Torgersen, C.E., 2023, Closing the gap between science and management of cold-water refuges in rivers and streams: Global Change Biology, v. 29, no. 19, p. 5482–5508, accessed March 3, 2024, at https://doi.org/10.1111/gcb.16844.
Selker, J.S., Thevenaz, L., Huwald, H., Mallet, A., Luxemburg, W., van de Giesen, N., Stejskal, M., Zerman, J., Westhoff, M., and Parlange, M.B., 2006, Distributed fiber-optic temperature sensing for hydrologic systems: Water Resources Research, v. 42, no. 12, article 2006WR005326, 8 p., accessed March 3, 2024, at https://doi.org/10.1029/2006WR005326.
Tyler, S.W., Selker, J.S., Hausner, M.B., Hatch, C.E., Torgersen, T., Thodal, C.E., and Schladow, S.G., 2009, Environmental temperature sensing using Raman spectra DTS fiber-optic methods: Water Resources Research, v. 45, no. 4, article W00D23, 11 p., accessed March 3, 2024, at https://doi.org/10.1029/2008WR007052.
For more information, contact:
The Water Mission Area Next Generation Observing System Program
Publishing support provided by the Pembroke Publishing Service Center
Disclaimers
Any use of trade, firm, or product names is for descriptive purposes only and does not imply endorsement by the U.S. Government.
Although this information product, for the most part, is in the public domain, it also may contain copyrighted materials as noted in the text. Permission to reproduce copyrighted items must be secured from the copyright owner.
Suggested Citation
Briggs, M.A., Rey, D.M., Opatz, C.C., Terry, N.C., Newman, C.P., Gruhn, L.R., and Johnson, C.D., 2025, Fiber-optic distributed temperature sensing of hydrologic processes—Diverse deployments and new applications by the U.S. Geological Survey: U.S. Geological Survey Fact Sheet 2025–3006, 6 p., https://doi.org/10.3133/fs20253006.
ISSN: 2327-6932 (online)
ISSN: 2327-6916 (print)
| Publication type | Report |
|---|---|
| Publication Subtype | USGS Numbered Series |
| Title | Fiber-optic distributed temperature sensing of hydrologic processes—Diverse deployments and new applications by the U.S. Geological Survey |
| Series title | Fact Sheet |
| Series number | 2025-3006 |
| DOI | 10.3133/fs20253006 |
| Publication Date | March 24, 2025 |
| Year Published | 2025 |
| Language | English |
| Publisher | U.S. Geological Survey |
| Publisher location | Reston, VA |
| Contributing office(s) | Colorado Water Science Center, New York Water Science Center, Washington Water Science Center, WMA - Observing Systems Division |
| Description | 6 p. |
| Online Only (Y/N) | N |
| Additional Online Files (Y/N) | N |