

Global Maps of Critical Mineral Production in 2023
Links
- Document: Report (5.77 MB pdf) , HTML , XML
- NGMDB Index Page: National Geologic Map Database Index Page (html)
- Download citation as: RIS | Dublin Core
Introduction
The global production of many mineral commodities, especially critical minerals, is concentrated in a few countries that have mineral resources and the infrastructure necessary to mine and process those resources. For this reason, the type and amount of mineral production differ by country. For example, many countries produce such metallic ores as gold and silver, whereas only a few countries produce magnesium, niobium, platinum-group metals, and rare earths (Nassar and Fortier, 2021). The concentration of mining and processing in certain countries necessitates the existence of a global supply chain.
A mineral supply chain is the sequence of mining and processing of minerals and manufacturing of products. Mineral supply chains are global in scale, complex, and dynamic. Supply chain data can be used to understand how a country’s mineral resources and various economic, technical, and environmental factors affect the complexity of global supply chains (U.S. Department of Energy, 2011).
This fact sheet summarizes the world’s leading countries (those accounting for 5 percent or more of a commodity’s global production in 2023) for production of select mineral commodities (mainly critical minerals) in the mining and processing stages. These countries and the minerals they produce are synthesized on global maps to communicate the status of, and potential risk to, mineral commodity supply chains from geographic production concentration. Trade data from United Nations Statistics Division (2025) is used to support assessments of the observed production data.
Background
According to the Energy Act of 2020 (Public Law 116–260), minerals are considered “critical” if they meet three criteria:
• The mineral must be essential to the economic or national security of the United States.
• The mineral must serve an essential function in the manufacturing of a product, the absence of which would have significant consequences for the economic or national security of the United States.
• The mineral must have a supply chain that is vulnerable to disruption, including restrictions associated with foreign political risk, abrupt demand growth, military conflict, violent unrest, anti-competitive or protectionist behaviors, and other risks through-out the supply chain.
Some examples of critical minerals include, cobalt and lithium, used in rechargeable batteries; gallium, used for integrated circuits and optical devices; graphite, used for lubricants, batteries, and fuel cells; indium, used in liquid crystal display screens; and tungsten, used to make wear-resistant metals. Also included in the list are rare-earth elements as dysprosium, neodymium, and praseodymium, used in permanent magnets (Nassar and Fortier, 2021).
The U.S. Geological Survey (USGS) is the Government agency responsible for developing the United States’ list of critical minerals (Public Law 116–260). The most recent list of critical minerals was published in 2022 and contains 50 minerals, including 7 rare-earth elements and 5 platinum-group metals (U.S. Geological Survey, 2022). The USGS is prioritizing critical minerals in its assessment of potential domestic resources and in its analysis of domestic and global production (Public Law 116–260).
Data
The USGS collects and distributes information on global mineral resources, production, and trade, and conducts supply chain assessments for mineral commodities. For this fact sheet, production data of critical minerals and some other minerals subject to increasing global demand and attention owing to their specific applications and potential supply disruption, including cadmium, copper, gold, and molybdenum, were collected. Data on each country’s mineral commodities in 2023 are from Mineral Commodity Summaries 2025 (U.S. Geological Survey, 2025). Some production data on processed commodities that were not available for 2023 are estimated based on prior-year data (Ewing, 2025; Friedline, 2025; Schulte, 2025; Tolcin, 2025). The mineral commodities for which a country’s production is equal to or greater than 5 percent of total world production were identified.
The mining and processing of minerals and manufacturing of products are various and complex. The term “mining” in this fact sheet refers to the mineral extraction of the mineral supply chain (for example, mining ores and producing concentrates through a beneficiation process) from deposits in the Earth. The term “processing” encompasses the mineral processing, refining, and smelting to obtain oxides, metals, or master alloys, such as aluminum oxide (alumina), refined bismuth, and smelted tin.
Certain raw materials and minor metals were excluded from this fact sheet because global production data from either the mining or processing stage were limited or unavailable in U.S. Geological Survey publications. This is because some raw materials (such as manganese and tungsten ores and concentrates) were processed in various forms, and the processing outputs are difficult to track and measure. Several minor metals (such as bismuth, cadmium, gallium, germanium, indium, and tellurium) were recovered as byproducts from the processing of copper and lead-zinc concentrates. Thus, production of those metals was reported only in the processing stage (U.S. Geological Survey, 2025).
Major Producing Countries
Figure 1 is a map showing the world’s leading countries in the mining stage for 29 mineral commodities. China was the top mining country in 2023 (mining 5 percent or more of the global total of 18 mineral commodities), followed by South Africa (10), Australia (8), Russia (8), the United States (8), and Brazil (7). Figure 2 is a map showing the leading countries in the processing stage for 18 mineral commodities. China was also the top processing country (processing 5 percent or more of the global total of 14 mineral commodities), followed by Japan (7), Russia (6), Canada (4), and the Republic of Korea (4).
The locations of mining output are highly influenced by the geological settings of mineral deposits (Labay and others, 2017). For example, large countries, such as Australia, Canada, China, and Russia, may have more diverse geological settings and are more likely to have high-quality deposits within their borders. Some smaller countries, such as Chile, the Democratic Republic of the Congo [Congo (Kinshasa)], and South Africa, may also have high shares of global production of certain minerals owing to localized mineral deposits.
The development of mineral-processing facilities, which requires complex engineering and technologies, is closely linked to a country’s manufacturing industry and global competitiveness. A manufacturing industry based in an economy may provide the workforce and infrastructure for the operation of processing plants, enable comprehensive recovery such as recovery of byproduct critical minerals from facilities, and secure the demand for the mineral commodities from local downstream markets. For example, China, Japan, and the Republic of Korea operate the world’s major refineries and smelters by production capacity (U.S. Geological Survey, 2025) and also play roles in the global manufacturing of products, including automotive, electronics, and rechargeable batteries; mineral commodities processed in these countries may be consumed directly in the domestic manufacturing sector or exported (Chung, 2024; DeCarlo, 2024; Moon, 2025).
Supply Chain Characteristics
The data shown in figures 1 and 2 indicate the following about the global mineral supply chain:
• Most leading mining countries, such as Australia, Brazil, Chile, Congo (Kinshasa), Peru, South Africa, and the United States, had lower shares of global processing production and processed fewer mineral commodities. In contrast, China’s share of global processing production was greater than its share of global mining production for many mineral commodities. Japan and the Republic of Korea, which were not leading mining countries, are leading processing countries. This indicates that most leading mining countries had limited processing facilities as of 2023 and shipped most of their mine production to other countries for processing, mainly to China, Japan, and the Republic of Korea. This is supported by the global trade statistics of 2023: of metal ores and concentrates, the top exporters were Australia (accounted for 33 percent of global total by value), Brazil (11 percent), Chile and Peru (9 percent each) and South Africa (5 percent). The top importers were China (64 percent), Japan (7 percent), and the Republic of Korea (5 percent) (United Nations Statistics Division, 2025).
• China’s share of global aluminum production increased from 21 percent in the mining stage to 59 percent in the processing stage, cobalt (1 percent to 80 percent), copper (8 percent to 44 percent), tin (23 percent to 50 percent), titanium (34 percent to 69 percent), and zinc (34 percent to 48 percent) (figs. 1, 2). These increases indicate that China imported large amounts of raw materials as feedstock for its processing industry, and production of these mineral commodities in the processing stage was more concentrated in China than in the mining stage.
• There is little difference in the number of commodities in the mining and processing stages for Russia (figs. 1, 2). The country largely processed its mined minerals domestically (Safirova, 2025). This observation is in line with the country’s trade data. The country accounted for 1 percent and 0.2 percent of global export and import of metal ores and concentrates, respectively, less than those of other top mineral mining and processing countries (United Nations Statistics Division, 2025).
Supply Chain Diversification
The increasing global production concentration and greater reliance on a single source have elevated the potential supply disruption of mineral commodities (Nassar and Fortier, 2021). Supply chain diversification as a short-term program could be taken to mitigate the risk of supply chain disruption. The maps (figs. 1, 2) can be used to identify potential additional capacities for improved supply chain diversity by utilizing high-quality resources in major mining countries and existing processing expertise and infrastructure in major processing countries.
Regarding potential domestic and foreign supply disruptions, long-term expanding and investing the mineral production capacity in a domestic or a foreign country may improve supply chain resilience. Such plans, however, take considerable time and capital to establish mineral facilities and to integrate with upstream and downstream industrial sectors (Alonso and others, 2025).
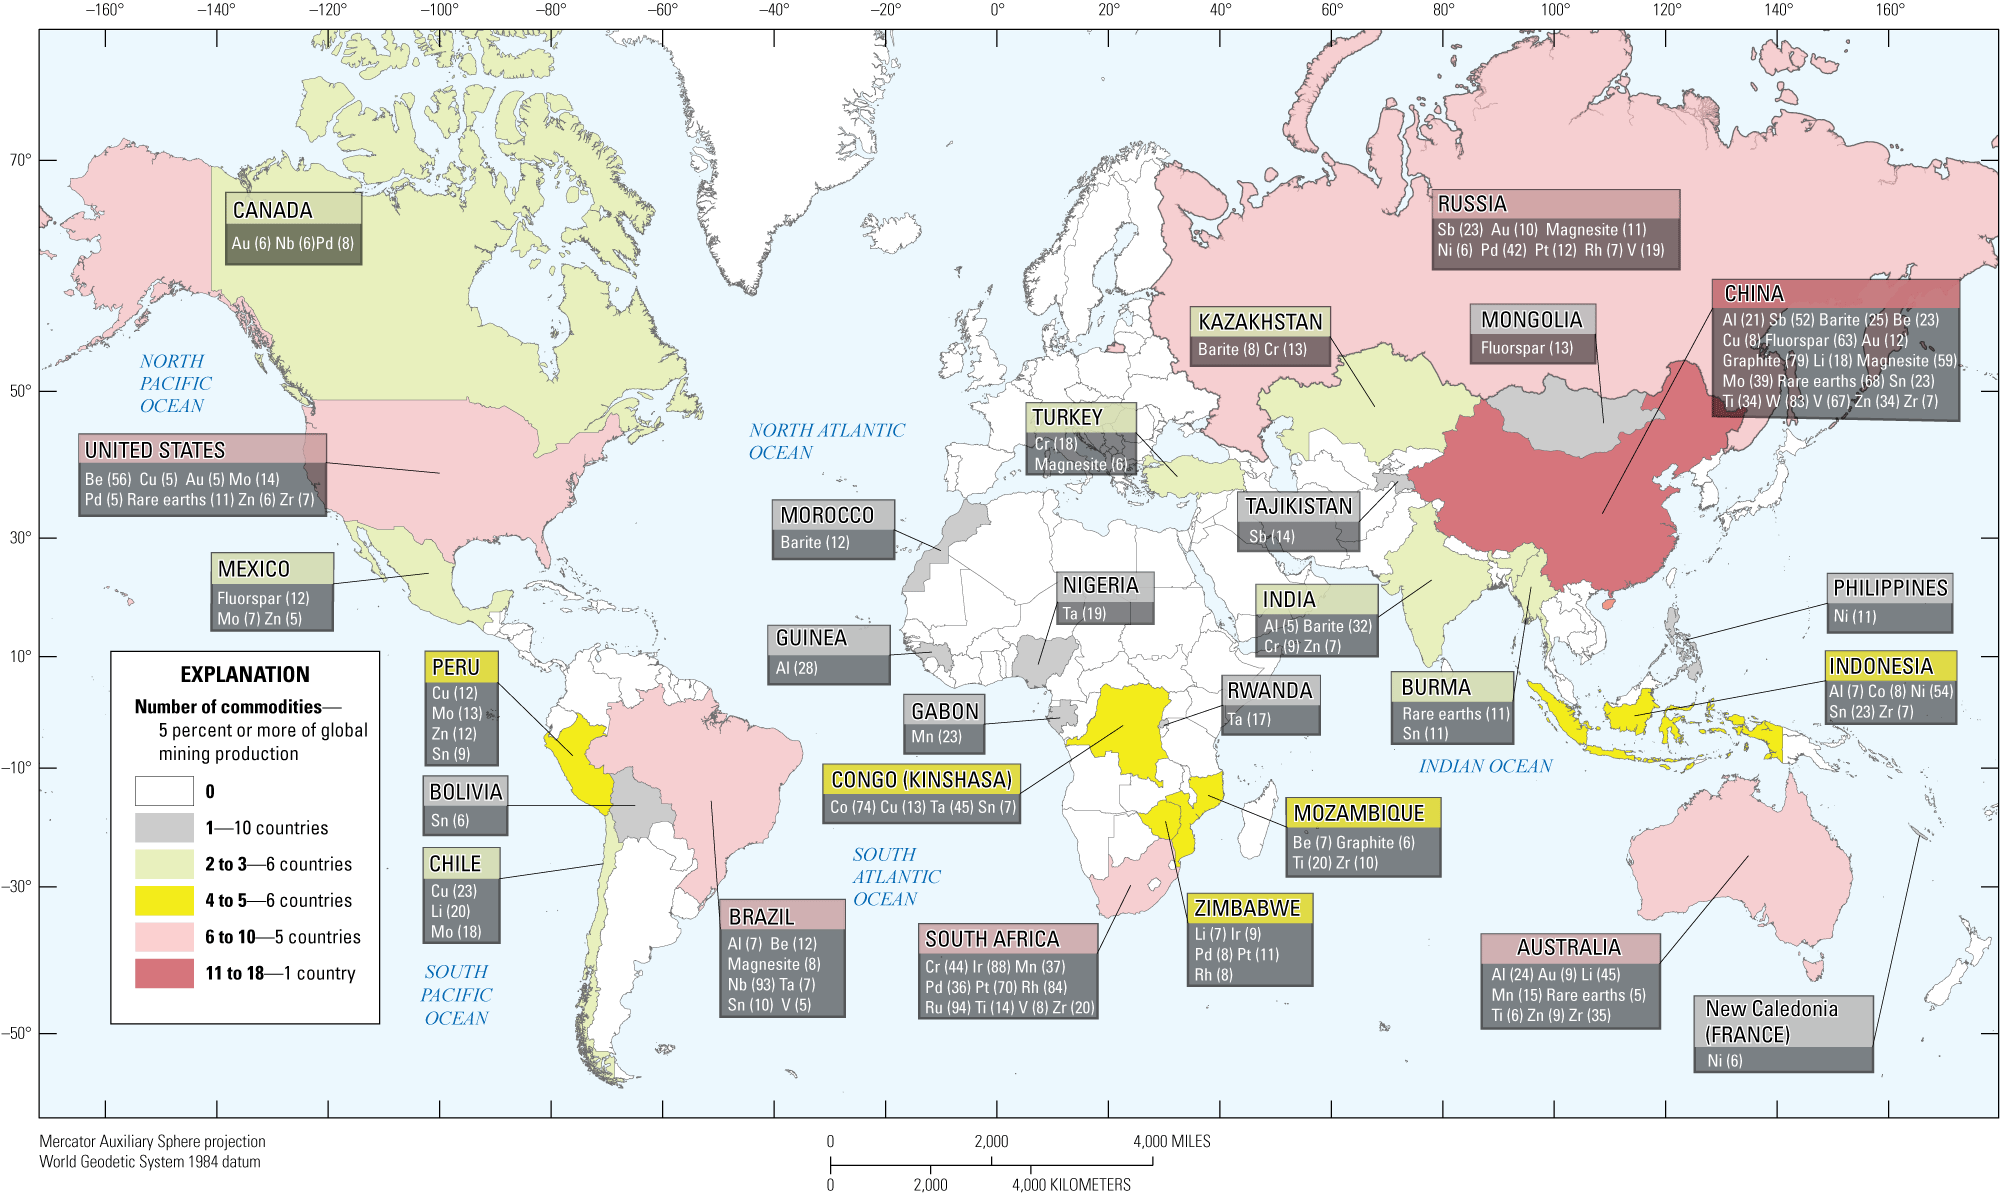
Map of the world showing each country’s share of global mining production of select mineral commodities, including critical minerals (for which data were available), copper, gold, and molybdenum. [This figure is oversized and is available to view in full screen at https://pubs.usgs.gov/fs/2025/3038/images/fs20253038_fig01.png. Al, aluminum; Au, gold; Be, beryllium; Co, cobalt; Cr, chromium; Cu, copper; Ir, iridium; Li, lithium; Mn, manganese; Mo, molybdenum; Nb, niobium; Ni, nickel; Pd, palladium; Pt, platinum; Rh, rhodium; Ru, ruthenium; Sb, antimony; Sn, tin; Ta, tantalum; Ti, titanium; V, vanadium; W, tungsten; Zn, zinc; Zr, zirconium]
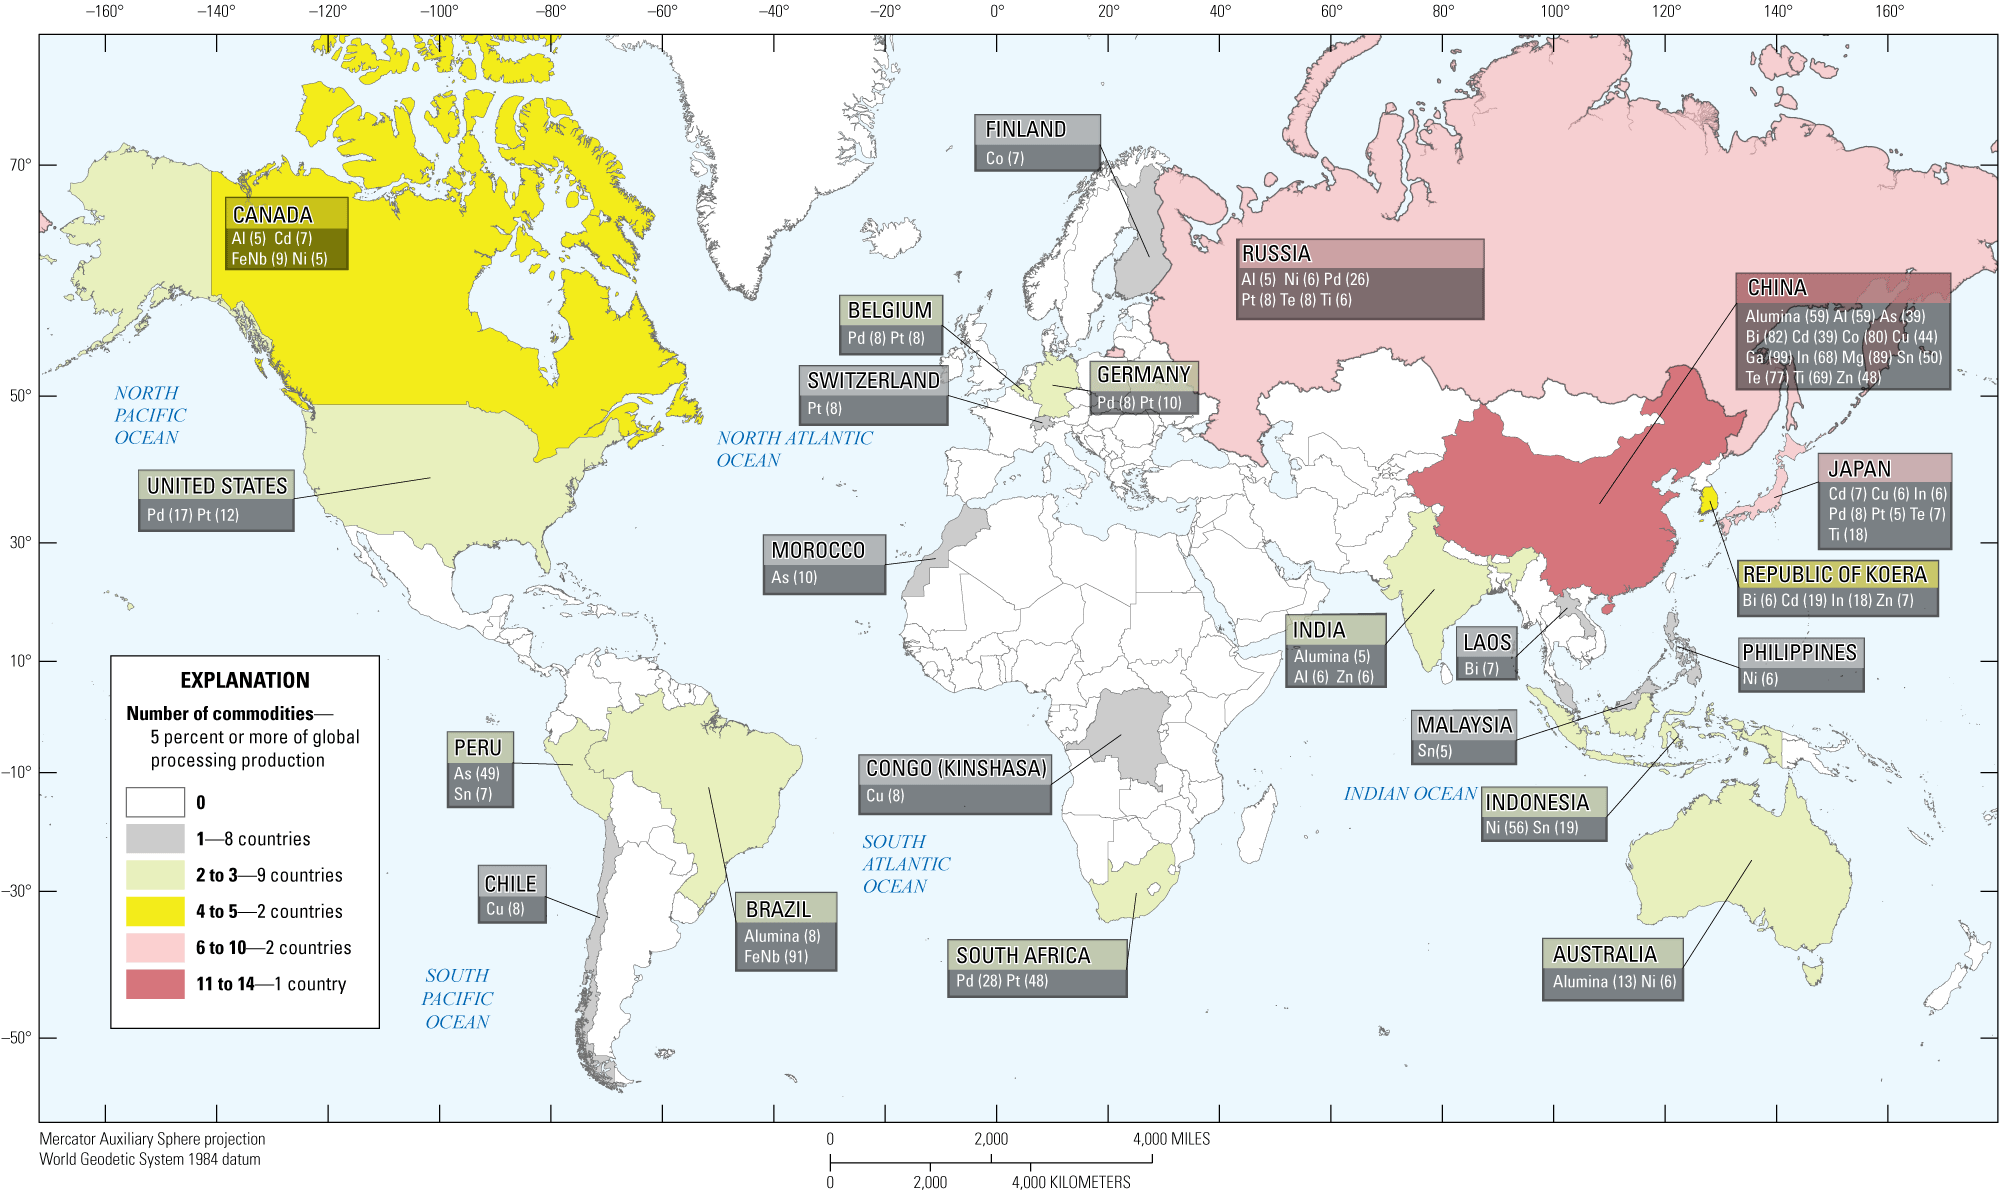
Map of the world showing each country’s share of global processing production of select mineral commodities, including critical minerals (for which data were available) and cadmium and copper sourced from imported and (or) domestically produced raw materials. [This figure is oversized and is available to view in full screen at https://pubs.usgs.gov/fs/2025/3038/images/fs20253038_fig02.png. Al, aluminum; As, arsenic; Bi, bismuth; Cd, cadmium; Co, cobalt; Cu, copper; FeNb, ferroniobium; Ga, gallium; In, indium; Mg, magnesium; Ni, nickel; Pd, palladium; Pt, platinum; Sn, tin; Te, tellurium; Ti, titanium; Zn, zinc]
References Cited
Alonso, E., Brioche, A.S., Schulte, R.F., Trimmer, L.M., Kim, J.-E., Gulley, A.L., and Pineault, D.G., 2025, World minerals outlook—Cobalt, gallium, helium, lithium, magnesium, palladium, platinum, and titanium through 2029 (ver. 1.1, March 14, 2025): U.S. Geological Survey Scientific Investigations Report 2025–5021, 19 p., accessed June 17, 2025, at https://doi.org/10.3133/sir20255021.
Chung, J., 2024, The mineral industry of the Republic of Korea, in Area reports—International—Asia and the Pacific: U.S. Geological Survey Minerals Yearbook 2020–2021, v. 3, p. 15.1–15.10, accessed June 18, 2025, at https://pubs.usgs.gov/myb/vol3/2020-21/myb3-2020-21-republic-korea.pdf.
DeCarlo, K.F., 2024, The mineral industry of Japan, in Area reports—International—Asia and the Pacific: U.S. Geological Survey Minerals Yearbook 2020–2021, v. 3, p. 13.1–13.24, accessed June 18, 2025, at https://pubs.usgs.gov/myb/vol3/2020-21/myb3-2020-21-japan.pdf.
Ewing, S.M., 2025, Cobalt, in Metals and minerals: U.S. Geological Survey Minerals Yearbook 2022, v. 1, p. 19.1–19.14, accessed July 10, 2025, at https://pubs.usgs.gov/myb/vol1/2022/myb1-2022-cobalt.pdf.
Friedline, C., 2025, Tin, in Metals and minerals: U.S. Geological Survey Minerals Yearbook 2021, v. 1, p. 78.1–78.11, accessed July 10, 2025, at https://pubs.usgs.gov/myb/vol1/2021/myb1-2021-tin.pdf.
Labay, K., Burger, M.H., Bellora, J.D., Schulz, K.J., DeYoung, J.H., Jr., Seal, R.R., II, Bradley, D.C., Mauk, J.L., and San Juan, C.A., 2017, Global distribution of selected mines, deposits, and districts of critical minerals: U.S. Geological Survey data release, accessed June 18, 2025, https://doi.org/10.5066/F7GH9GQR.
Moon, J.W., 2025, The mineral industry of China, in Area reports—International—Asia and the Pacific: U.S. Geological Survey Minerals Yearbook 2022, v. 3, p. 9.1–9.44, accessed June 18, 2025, at https://pubs.usgs.gov/myb/vol3/2022/myb3-2022-china.pdf.
Nassar, N.T., and Fortier, S.M., 2021, Methodology and technical input for the 2021 review and revision of the U.S. Critical Minerals List: U.S. Geological Survey Open-File Report 2021–1045, 31 p., accessed June 12, 2025, at https://doi.org/10.3133/ofr20211045.
Safirova, E., 2025, The mineral industry of Russia, in Area reports—International—Europe and Central Eurasia: U.S. Geological Survey Minerals Yearbook 2022, v. 3, p. 39.1–39.22, accessed June 18, 2025, at https://pubs.usgs.gov/myb/vol3/2022/myb3-2022-russia.pdf.
Schulte, R.F., 2025, Platinum-group metals, in Metals and minerals: U.S. Geological Survey Minerals Yearbook 2021, v. 1, p. 57.1–5.12, accessed July 10, 2025, at https://pubs.usgs.gov/myb/vol1/2021/myb1-2021-platinum-group.pdf.
Tolcin, A., 2025, Zinc, in Metals and minerals: U.S. Geological Survey Minerals Yearbook 2021, v. 1, p. 85.1–85.17, accessed July 10, 2025, at https://pubs.usgs.gov/myb/vol1/2021/myb1-2021-zinc.pdf.
United Nations Statistics Division, 2025, UN comtrade plus: United Nations database, accessed May 5, 2025, via https://comtradeplus.un.org/.
U.S. Department of Energy, 2011, Critical materials strategy: U.S. Department of Energy, accessed June 12, 2025, at https://www.energy.gov/sites/prod/files/DOE_CMS2011_FINAL_Full.pdf.
U.S. Geological Survey, 2022, 2022 final list of critical minerals: Federal Register, v. 87, no. 37, p. 10381–10382, July 10, 2025, at https://www.govinfo.gov/content/pkg/FR-2022-02-24/pdf/2022-04027.pdf.
U.S. Geological Survey, 2025, Mineral commodity summaries 2025 (ver. 1.2, March 2025): U.S. Geological Survey, 212 p., accessed June 3, 2025, at https://doi.org/10.3133/mcs2025.
Prepared by Jaewon Chung, Sean Xun, and Steven D. Textoris, with contributions from National Minerals Information Center staff
For more information, contact:
Director, National Minerals Information Center
U.S. Geological Survey 12201 Sunrise Valley Drive
988 National Center Reston, VA 20192
nmicrecordsmgt@usgs.gov
or visit our website at
http://minerals.usgs.gov/minerals/
Publishing support provided by the Baltimore and Reston Publishing Service Centers
Disclaimers
Any use of trade, firm, or product names is for descriptive purposes only and does not imply endorsement by the U.S. Government.
Although this information product, for the most part, is in the public domain, it also may contain copyrighted materials as noted in the text. Permission to reproduce copyrighted items must be secured from the copyright owner.
Suggested Citation
Chung, J., Xun, S., and Textoris, S.D., 2025, Global maps of critical mineral production in 2023: U.S. Geological Survey Fact Sheet 2025–3038, 5 p., https://doi.org/10.3133/fs20253038.
ISSN: 2327-6932 (online)
ISSN: 2327-6916 (print)
| Publication type | Report |
|---|---|
| Publication Subtype | USGS Numbered Series |
| Title | Global maps of critical mineral production in 2023 |
| Series title | Fact Sheet |
| Series number | 2025-3038 |
| DOI | 10.3133/fs20253038 |
| Publication Date | August 05, 2025 |
| Year Published | 2025 |
| Language | English |
| Publisher | U.S. Geological Survey |
| Publisher location | Reston, VA |
| Contributing office(s) | National Minerals Information Center |
| Description | 5 p. |
| Online Only (Y/N) | N |
| Additional Online Files (Y/N) | N |