

Uranium—Deposits, Production and Resources, Market Dynamics, and Supply Chain Risks
Links
- Document: Report (10.5 MB pdf) , HTML , XML
- NGMDB Index Page: National Geologic Map Database Index Page (html)
- Download citation as: RIS | Dublin Core
Introduction
Interest in nuclear power for the generation of electricity has risen with the increase in the need for more diverse baseload power, enhanced energy security, and the development of new technologies, such as small modular reactors (SMRs), which could provide power for remote areas, industrial applications, and artificial intelligence (AI) data centers (NEA and IAEA, 2025). In 2024, the U.S. Department of Energy (DOE) received $2.7 billion in congressional funding to bolster the domestic uranium production and nuclear fuel supply chain and address reliance on imports from foreign suppliers (EIA, 2025b). In 2025, the U.S. Government issued several Executive and Secretary’s orders aimed at revitalizing the U.S. nuclear sector. If SMRs are to be as widely deployed in the United States and worldwide as envisioned, demand for uranium (nuclear reactor fuel) will likely increase (World Nuclear Association [WNA], 2023b).
After the Fukushima nuclear accident in 2011, the market spot price of uranium began a decline, followed by a decrease in U.S. and global uranium exploration and mine development expenditures that led to a uranium supply deficit (NEA and IAEA, 2023) until 2020, when prices started to recover, prompting a resurgence in uranium exploration and development (Todorova, 2025). In January of 2024, the uranium spot price rose to a 17-year high $106 (U.S. dollars) per pound of U3O8 (triuranium oxide, commonly known as “yellowcake”), which is expected to increase uranium exploration, mine development, and uranium production domestically and worldwide (NEA and IAEA, 2025).
Uranium and Uranium Deposits
Uranium is a naturally occurring, weakly radioactive element. It is found in rock, soil, and seawater and is present in trace amounts in common vegetation (Tarakanov, 2023). It is among the more common elements found throughout Earth’s crust. Uranium radioactively decays through time by emitting alpha particles, releasing energy in the process (Tarakanov, 2023). This property makes uranium the primary source of fuel for powering nuclear fission reactors.
Concentrations of uranium are found in at least 15 geologically unique types of deposits (IAEA, 2020). Globally, the most economic and productive deposit types are (1) deposits hosted in sandstones, which are the most important domestic deposit type, (2) deposits associated with geologic unconformities, and (3) deposits associated with intrusive igneous rocks (IAEA, 2009; Potter and others, 2017; IAEA, 2020).
Uses and Applications of Uranium
Uranium is used primarily for energy production, which indirectly supports a variety of other applications (U.S. Nuclear Regulatory Commission [NRC], 2020; WNA, 2025b, c). Electricity produced by nuclear energy provides about 20 percent of domestic and 10 percent of global electricity needs. This energy is used to heat cities, desalinate seawater in water-scarce regions, produce hydrogen, propel civilian-operated nuclear-powered icebreakers and some merchant vessels, and produce radioisotopes of other chemical elements for use in medical applications. Uranium potentially will be essential for fueling SMRs, which are now being considered to power the rapidly emerging needs of artificial intelligence (AI) data centers and industrial sites and to complement renewable energy sources by adding baseload power.
Global Supply Chain
The global supply chain for nuclear reactor fuel, and hence uranium, is known as the “nuclear fuel cycle” (IAEA, 2012, 2018). Mined uranium goes through a series of stages before it can be used as nuclear reactor fuel; the stages are summarized in figure 1. The stages can be complex and vary depending on the type of nuclear reactor fuel that is fabricated and the type of reactor that the fuel will power.
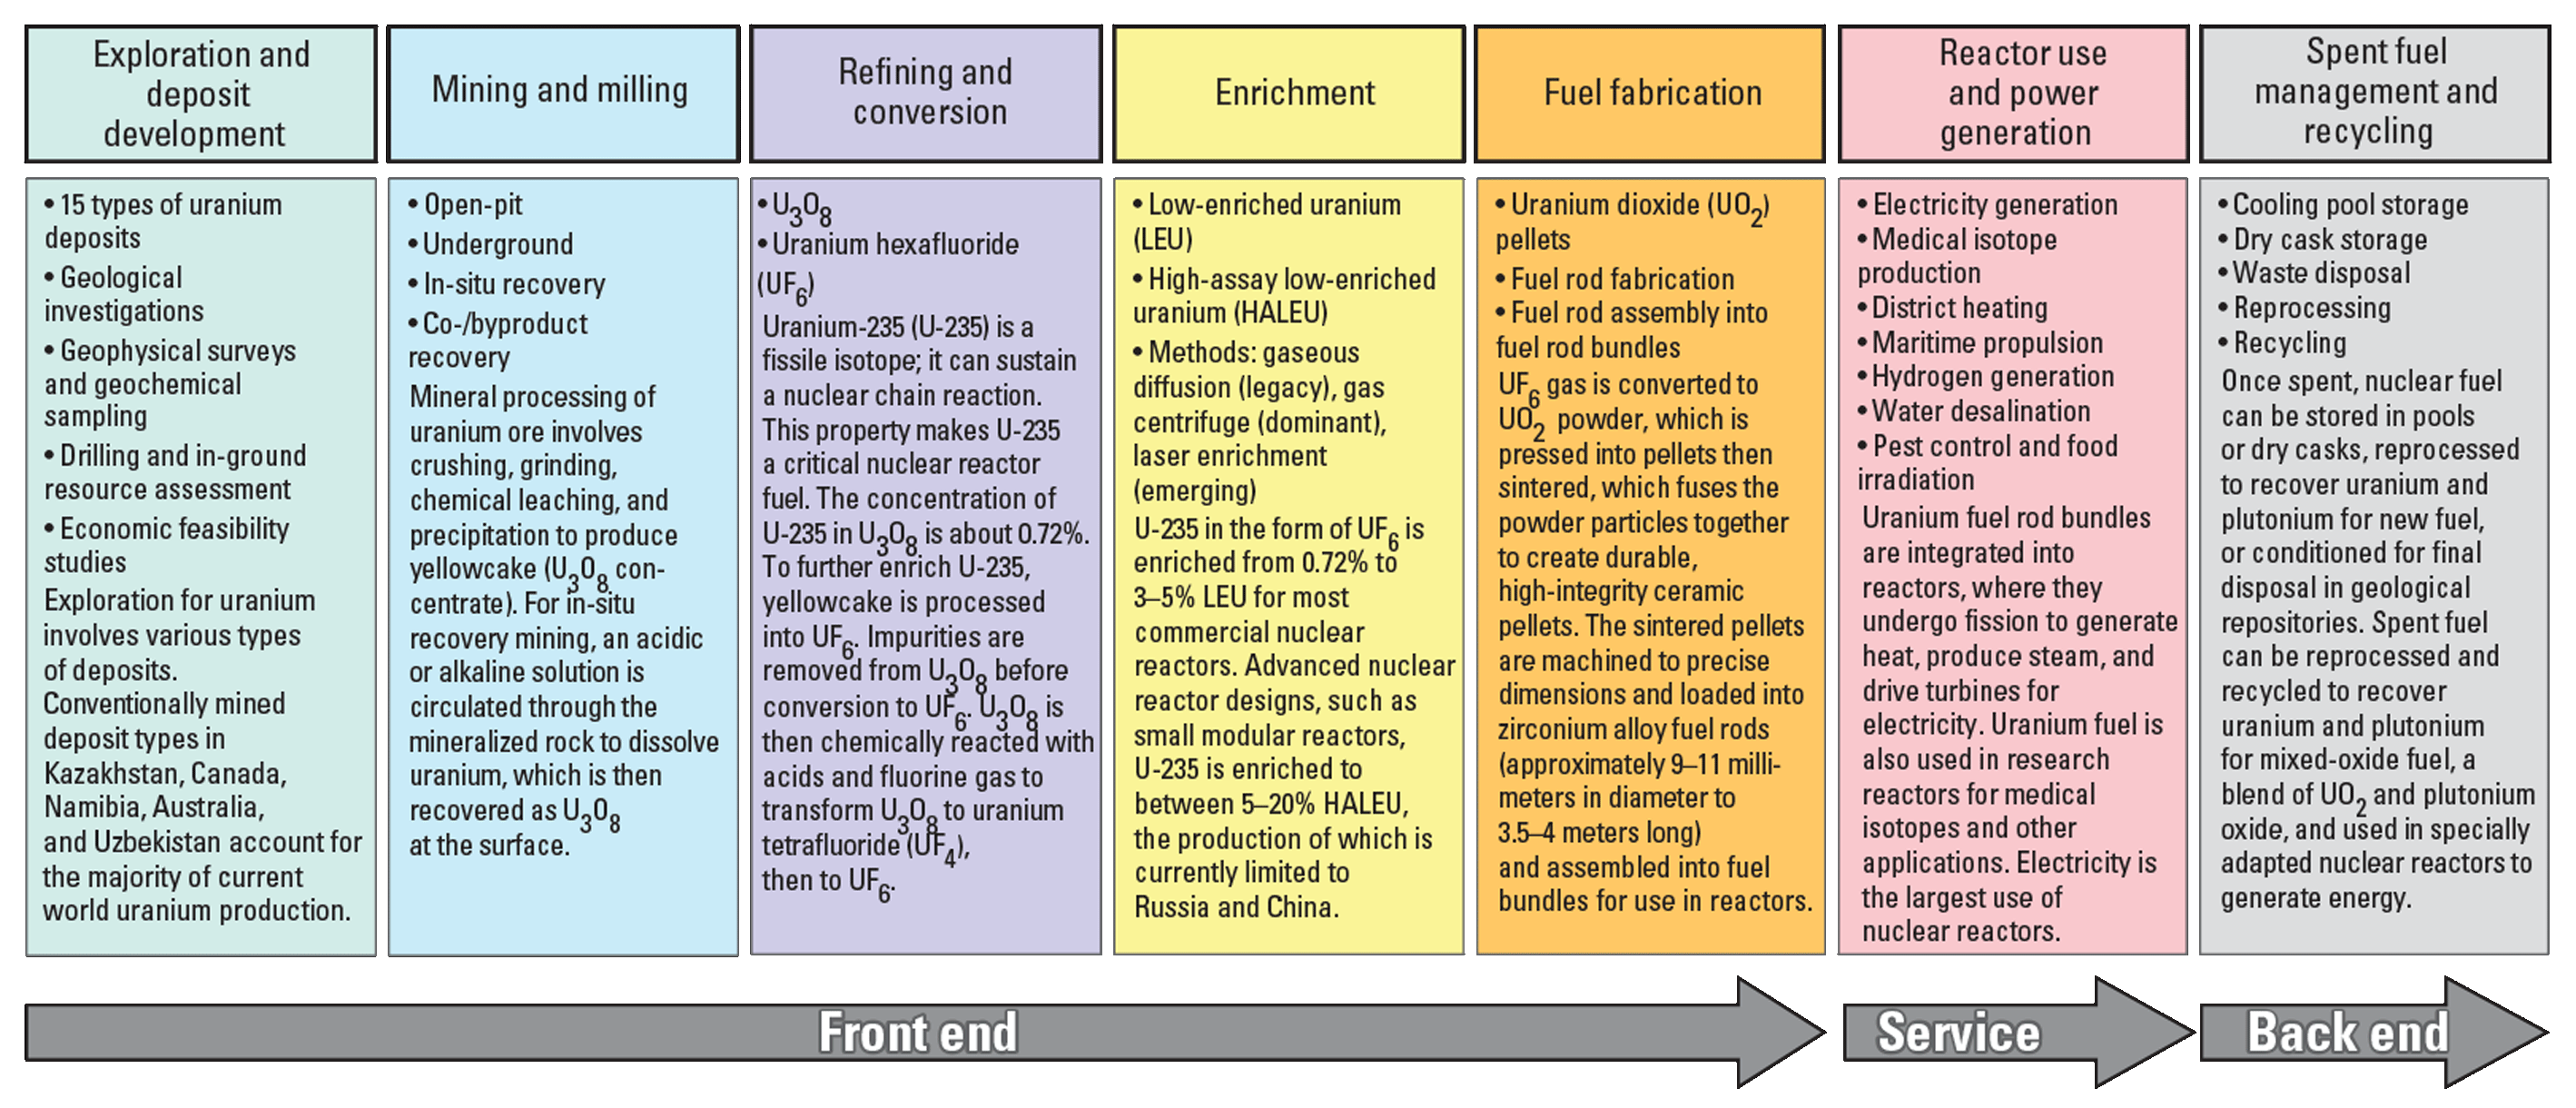
Uranium and nuclear fuel supply chain stages. Based on International Atomic Energy Agency (IAEA; 2012, 2018), Tarakanov (2023), World Nuclear Association (WNA; 2025c), and World Nuclear News (2025). (%, percent)
Stage 1, “Exploration and deposit development,” can take 15–30 years to complete, from commitment to explore for uranium, to mining, ore processing, facility decommissioning, and remediation at the end of a mine’s life (IAEA, 2023a). As of January 2023, at least 21 countries had planned and prospective mines in development, idled mines available to restart, or mine expansions (NEA and IAEA, 2025).
Stages 2–5 can be accomplished in 2–3 years (IAEA, 2025a). As of January 2023, eight countries had significant uranium mining operations (primary, coproduction, or byproduction of 2 percent or more of the global output), including (in order from highest to lowest producer) Kazakhstan, Canada, Namibia, Australia, Uzbekistan, Russia, China, and Niger (NEA and IAEA, 2025). Currently, only five uranium conversion plants are in operation worldwide, one each in Canada, China, France, Russia, and the United States (Todorova, 2025). The three main international commercial suppliers of converted uranium (serving global markets beyond domestic needs) are Rosatom (Russia), Urenco (a British-German-Dutch consortium, with a subsidiary located in the United States), and Orano (France), which, combined, account for most nondomestic low-enriched uranium (LEU) enrichment capacity (Todorova, 2025; WNA, 2025c). Commercial-scale nondomestic fuel fabrication facilities are operational in 12 countries: Canada, China, France, Germany, Japan, Kazakhstan, South Korea, Russia, Spain, Sweden, the United Kingdom, and the United States (IAEA, 2023b).
Stage 6, “Reactor use and power generation,” has a variety of applications. There are currently 416 nuclear power reactors in operation in 31 countries, and 63 are under construction in 15 countries (IAEA, 2025b).
Stage 7, “Spent fuel management and recycling,” can take 7–15 years on average. This stage primarily reflects countries with temporary storage for spent fuel from nuclear power plants and research reactors; reprocessing or recycling and permanent disposal facilities exist in far fewer nations. Reprocessing is currently (2025) operational in France, Russia, India, Japan, and China; deep geologic disposal is advancing in the United Kingdom, Sweden, France, and a few other countries and is fully operational only in Finland (Spencer and Pohle, 2025). More than 50 countries have spent nuclear fuel stored in temporary locations, typically in onsite pools, dry cask systems, or centralized interim storage facilities, awaiting reprocessing or final disposal (WNA, 2025a). It is estimated that there are more than 310 storage facilities and 36 waste disposal facilities worldwide (IAEA, 2021).
Market and Supply Dynamics
Uranium is not traded through a centralized market or exchange in the same way as commodities like oil or base metals, and uranium trades are characterized by opacity (Todorova, 2025). Long-term uranium contracts are the primary mechanism for securing uranium supply, accounting for most transactions (about 85 percent). These contracts typically last 2–10 years, with a common duration of 3–5 years (IAEA, 2025a). Primary uranium (freshly mined and processed) serves as the main resource for nuclear fuel; secondary uranium supplies, derived from existing stockpiles, recycled nuclear fuel, or material from dismantled nuclear weapons, have periodically played a significant role in meeting demand.
At the commercial seller-buyer level, uranium is typically bought by utilities and involves direct negotiations between buyers—primarily nuclear utilities (operators of power plants)—and sellers, such as mining companies and processors, and occasionally through intermediaries like brokers and traders (WNA, 2024b). Utilities then own the material and contract separately for each subsequent nuclear fuel cycle processing step as a service (fig. 1) rather than reselling the uranium.
In 2011, the Fukushima accident altered the dynamics of the uranium supply chain and reshaped global nuclear energy strategies, leading to widespread reactor closures, phaseouts, and delays in new-build projects throughout Europe and Asia (NEA and IAEA, 2014). This sudden reduction in demand created surpluses in uranium supply and inventories, which in turn depressed uranium spot prices, resulting in a downturn in geologic exploration for new primary uranium resources (NEA and IAEA, 2025).
Since 2020, the uranium market has been shaped by three major events: (1) the COVID-19 pandemic, (2) the emergence of uranium investment funds that offer shareholders (investors) indirect exposure to uranium price movements, and (3) the conflict in Ukraine (UxC, 2024). These shifts may have been further compounded in 2023 following a military coup d’état in Niger, one of the world’s leading uranium suppliers, which disrupted existing production operations and delayed new projects (NEA and IAEA, 2025). These events continue to reshape uranium supplies and procurement policies in the United States and worldwide (UxC, 2024).
Global Production and Resources
Estimates for total global production of primary (freshly mined and processed) uranium are 161.7 million pounds (lb) U3O8 for 2025, representing about 90 percent of worldwide requirements (GlobalData, 2024; WNA, 2025d, e) and approximately 153 million lb U3O8 for 2024 (UxC, 2024), representing about 87 percent of worldwide requirements for commercial nuclear reactors (fig. 2 and 3).
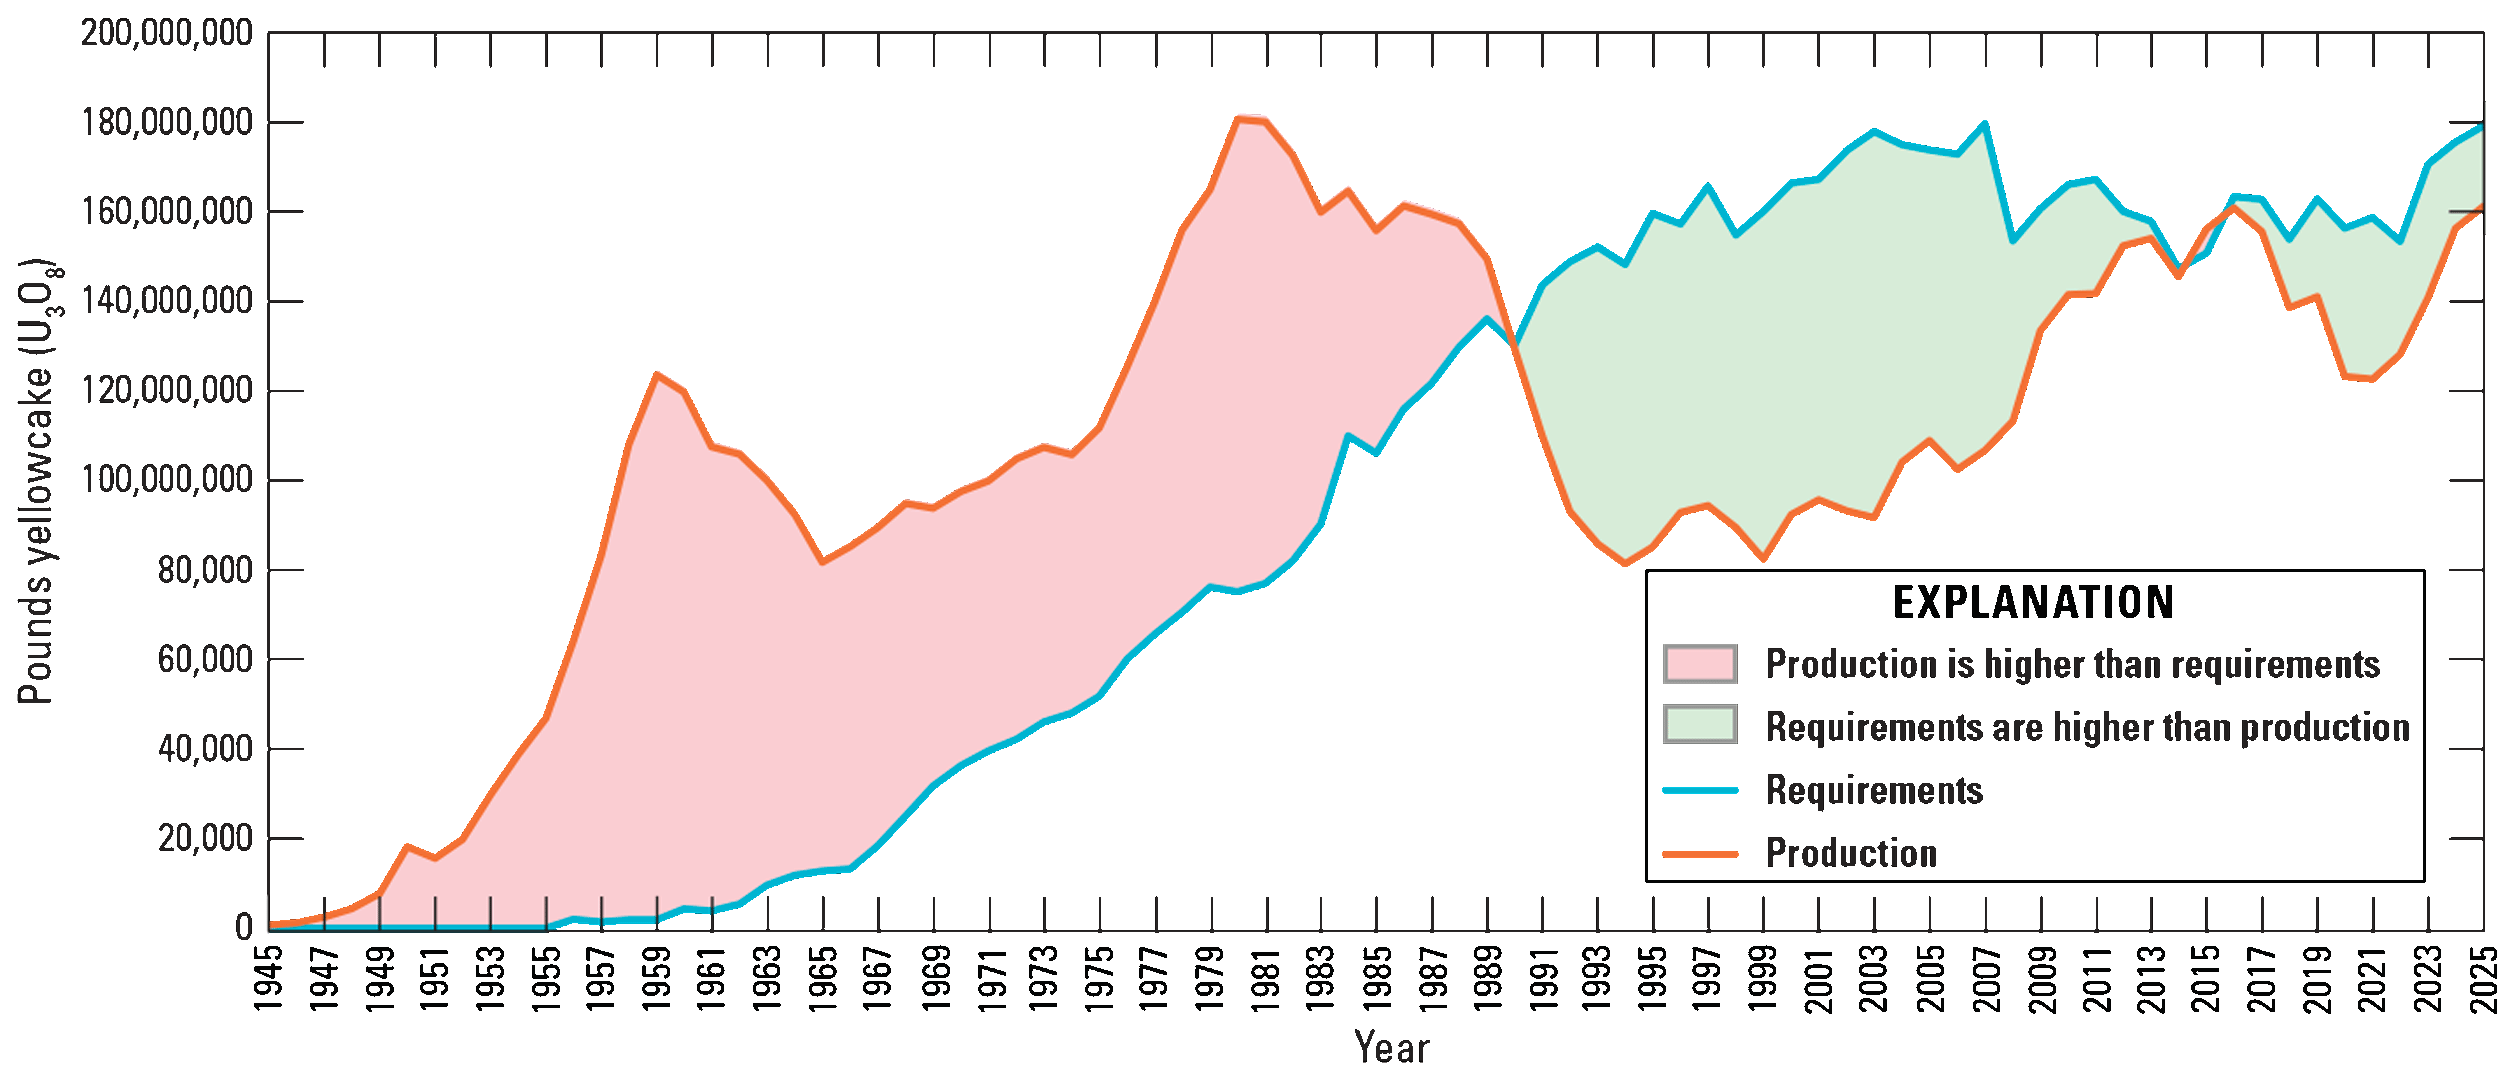
Graph showing world annual uranium production and requirements, 1945–2025. Based on Nuclear Energy Agency and International Atomic Energy Agency (NEA and IAEA, 2025). Supplemented with data for 2024 and 2025 from World Nuclear Association (WNA; 2023b, 2025d, e).
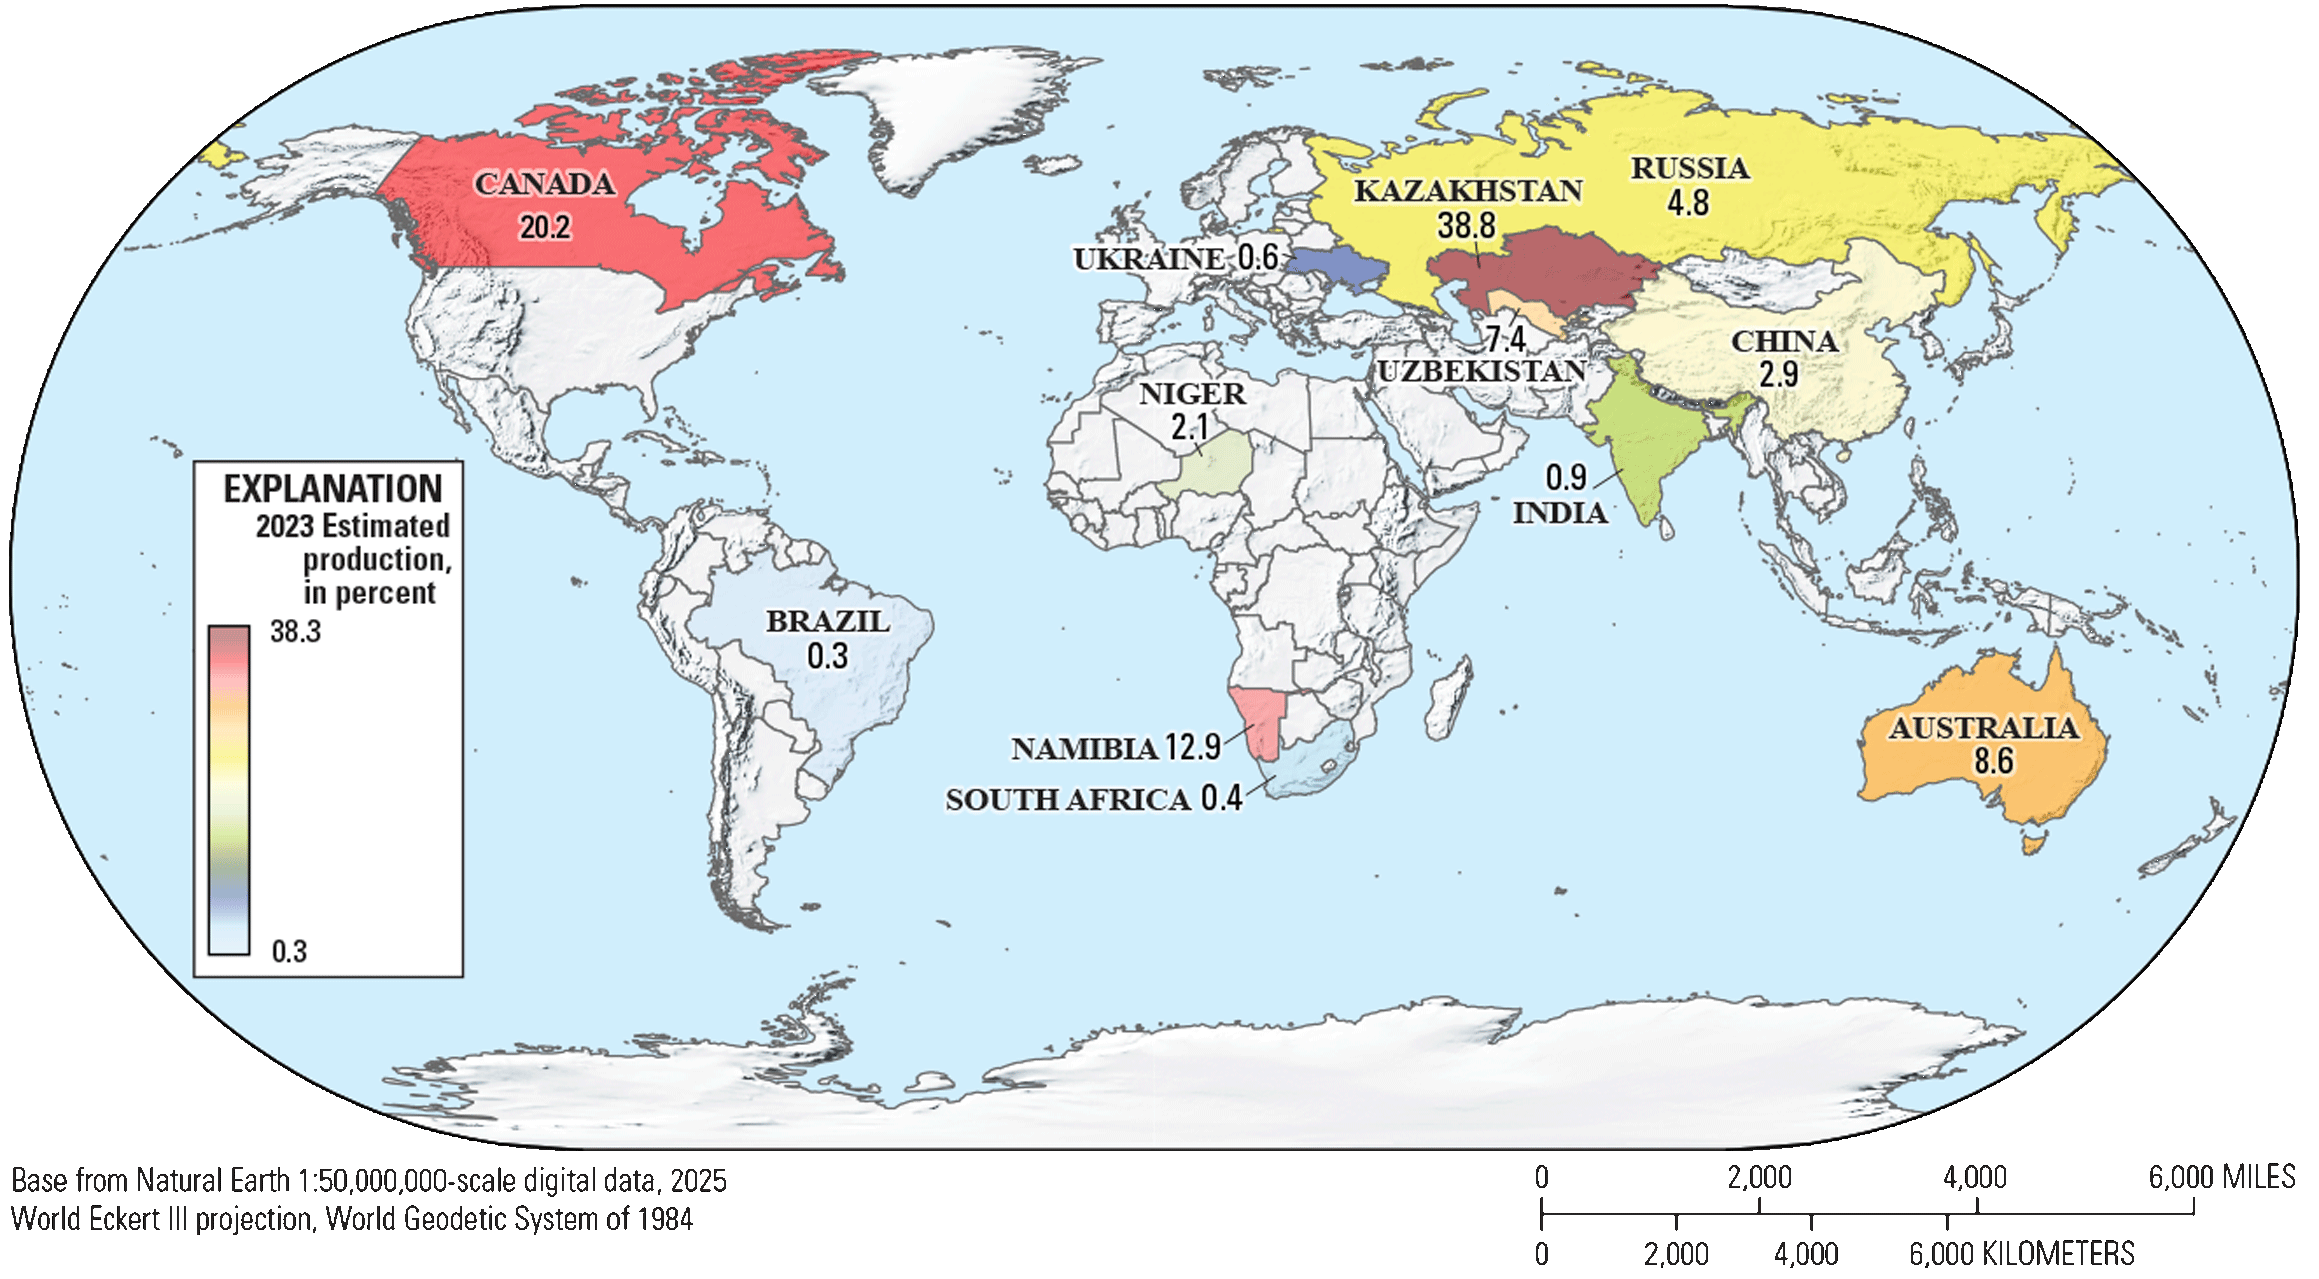
Map showing global distribution of world uranium mine production (141,200,000 pounds triuranium oxide [U3O8], commonly known as “yellowcake,” estimated for 2023). Based on Nuclear Energy Agency and International Atomic Energy Agency (NEA and IAEA, 2025). Twelve countries (labeled on the map) account for 99.8 percent of the estimated 2023 global uranium production, with 5 countries accounting for the remainder. (KZ, Kazakhstan; CA, Canada; NA, Namibia; AU, Australia; UZ, Uzbekistan; RU, Russia; CN, China; NE, Niger; IN, India; UA, Ukraine; ZA, South Africa; and BR, Brazil)
For 2023, the most recent year for which comprehensive production information was available, an estimated 141.2 million lb U3O8 was produced globally, representing approximately 83 percent of worldwide requirements (fig. 3; NEA and IAEA, 2025). Uranium was produced by 17 countries, with Kazakhstan, at approximately 39 percent, nearly exceeding the combined output of Canada, Namibia, and Australia, the second through fourth largest producers. Adding Uzbekistan and Russia as the fifth and sixth largest producers, just 6 countries accounted for more than 90 percent of the world’s estimated uranium production in 2023, and 9 countries (adding China, Niger, and India) accounted for about 99 percent (NEA and IAEA, 2025).
With respect to global uranium resources, production, and demand, the countries with the largest amount of unmined resources in the ground are not the same as those with the most production (mined) or those with the highest demand. In 2022 (NEA and IAEA, 2025), Australia had the largest estimated amount of reasonably assured and inferred unmined recoverable resources, Kazakhstan had the most production, and the United States had the highest demand. The three countries with the highest resources, production, and demand, and the associated amounts of U3O8, can vary from year to year based on uranium exploration and mining, market dynamics, and long-term purchasing contracts (refer to Mihalasky, 2022).
Domestic Production and Resources
At the global scale, the United States is a minor producer of uranium. In 2024, 7 uranium operations in 3 states (4 in situ recovery [ISR] operations in Wyoming, 2 ISR operations in Texas, and 1 ore processing mill in Utah) produced 677,000 lb of U3O8, contributing less than 0.5 percent to global output for that year and representing about 1.4 percent of uranium required for commercial nuclear reactors in the United States (fig. 3; U.S. Energy Information Administration [EIA], 2025a; WNA, 2025d). This is a significant production increase from approximately 198,000 lb of U3O8 in 2020 (NEA and IAEA, 2025); 21,000 pounds in 2021; 194,000 lb in 2022; and 50,000 lb in 2023 (EIA, 2025a). In-ground uranium resources at the end of 2024 were estimated to be 468.1 million lb of economically recoverable, reasonably assured U3O8 (EIA, 2025a). In 2024, in addition to the 7 uranium-producing operations, there were 3 in standby mode waiting to produce in Texas and Wyoming; 4 that were permitted and licensed to operate in Texas, Wyoming, and South Dakota; 1 under construction in Texas; 2 in development in Wyoming; and 1 undergoing equipment restoration in Nebraska (EIA, 2025a). By 2030, U.S. uranium production is projected to increase to more than 4 million lb U3O8, to as much as approximately 6–7 times more annually than in 2024 (UxC, 2024).
From 2020 to 2023, domestic expenditure on uranium exploration and mine development had an upward trend, reflecting a recovery in industry activity. Total expenditure increased from $72.5 million in 2020 to $160.0 million in 2023 (NEA and IAEA, 2025). This trend indicates a robust increase in investment, particularly in drilling and production, driven by rising uranium demand and market conditions (EIA, 2025a). Uranium exploration and mine development drilling in 2023 was the highest since 2013 for the number of holes and total footage drilled. In 2024, uranium exploration and mine development drilling significantly increased compared to 2023 with about a 50 percent increase in the number of holes drilled and a 20 percent increase in the footage drilled. In 2015 and 2017, the USGS carried out two modern assessments for undiscovered uranium. A mean of 220 million lb of recoverable U₃O₈ was estimated in sandstone-hosted uranium deposits of the Texas Coastal Plain (Mihalasky and others, 2015), and a mean of 40 million lb of in-place U₃O₈ was estimated in calcrete uranium deposits of the Southern High Plains region (Texas, New Mexico, and Oklahoma; Hall and others, 2017). Other assessments are planned (fig. 4; U.S. Geological Survey, 2022).
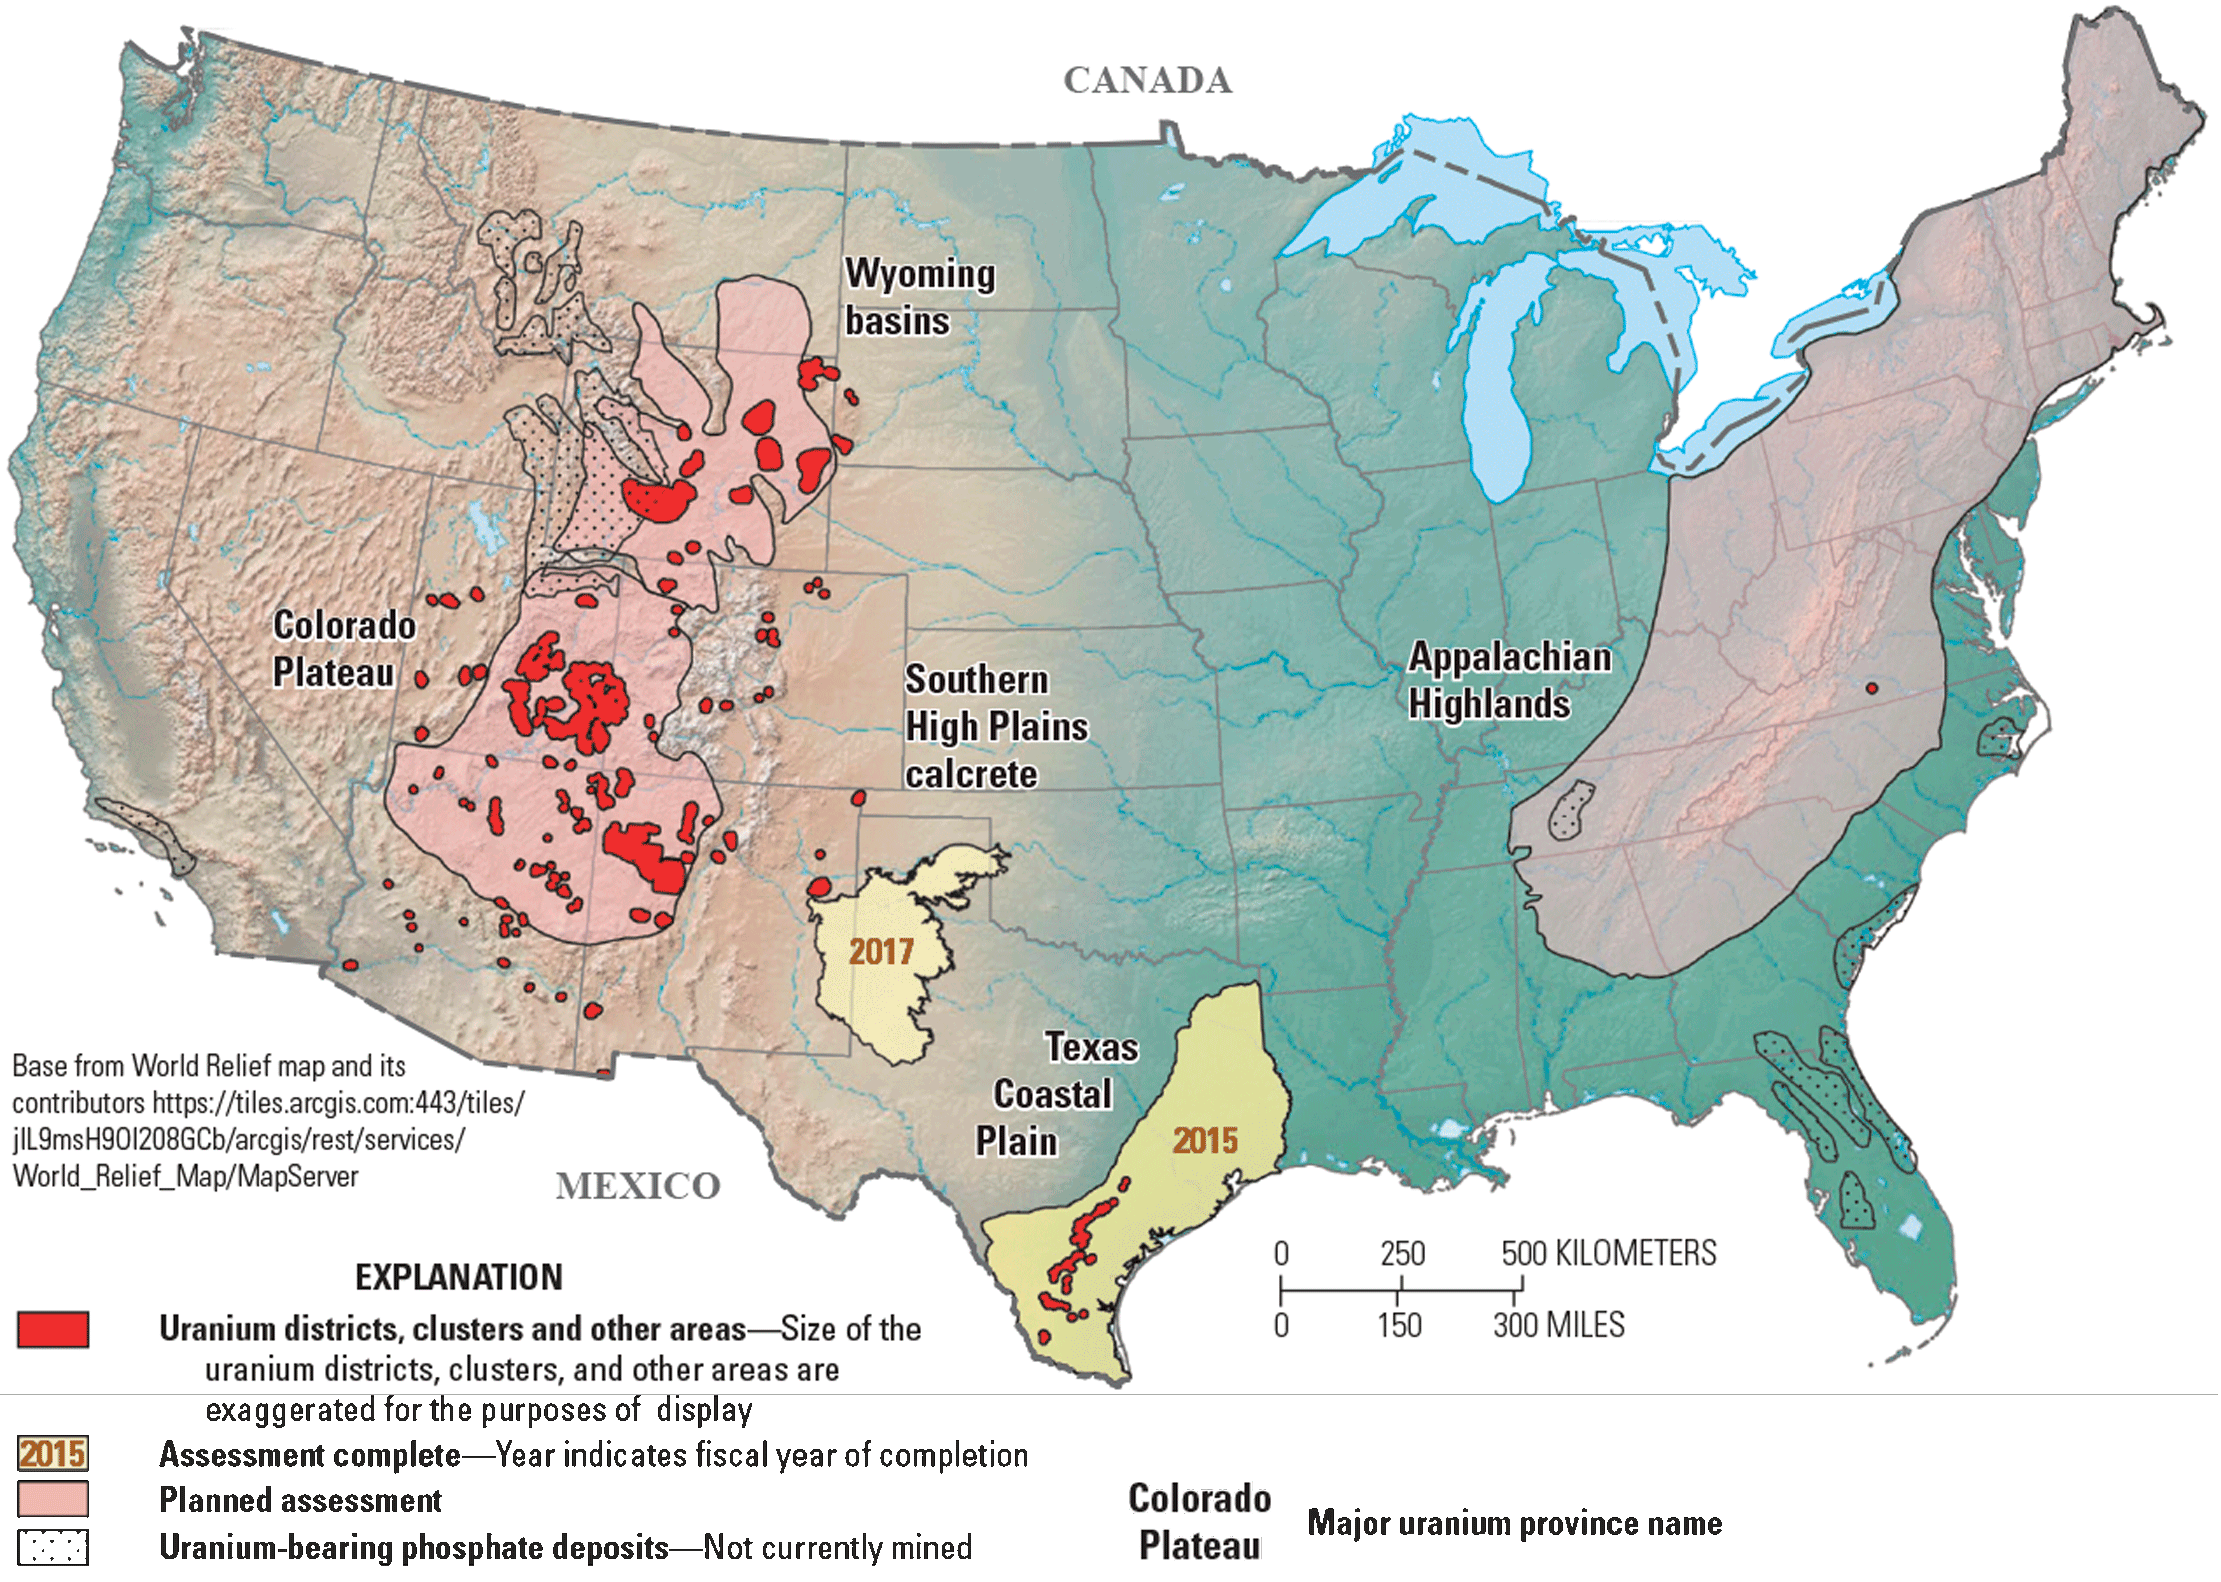
Map showing uranium resource regions and recent assessments of the United States. Two modern quantitative mineral resource assessments for undiscovered uranium have been completed (Mihalasky and others, 2015; Hall and others, 2017; U.S. Geological Survey, 2022), and additional areas have been identified for potential quantitative assessments.
Consumption, Import Reliance, and Supply Chain Risks
In 2023, 51.6 million lb of U3O8 equivalent (uranium in the form of U3O8, uranium hexafluoride [UF6], or enriched uranium) was purchased for domestic civilian nuclear power reactors, a 27 percent increase from 2022, marking the highest total since 2015 (fig. 5). Foreign suppliers led, accounting for approximately 95 percent of purchases, including Canada (25 percent), Kazakhstan and Australia (each 21 percent), Russia (12 percent), Uzbekistan (9 percent), Namibia (3 percent) and other countries (less than 5 percent). Domestically produced uranium accounted for only 5 percent of total domestic purchases (EIA, 2024), which is similar to 2022. For the next 10-year period (2025–35), it is anticipated that a total of 433 million lb U3O8 equivalent will be required to fuel commercial nuclear power reactors.
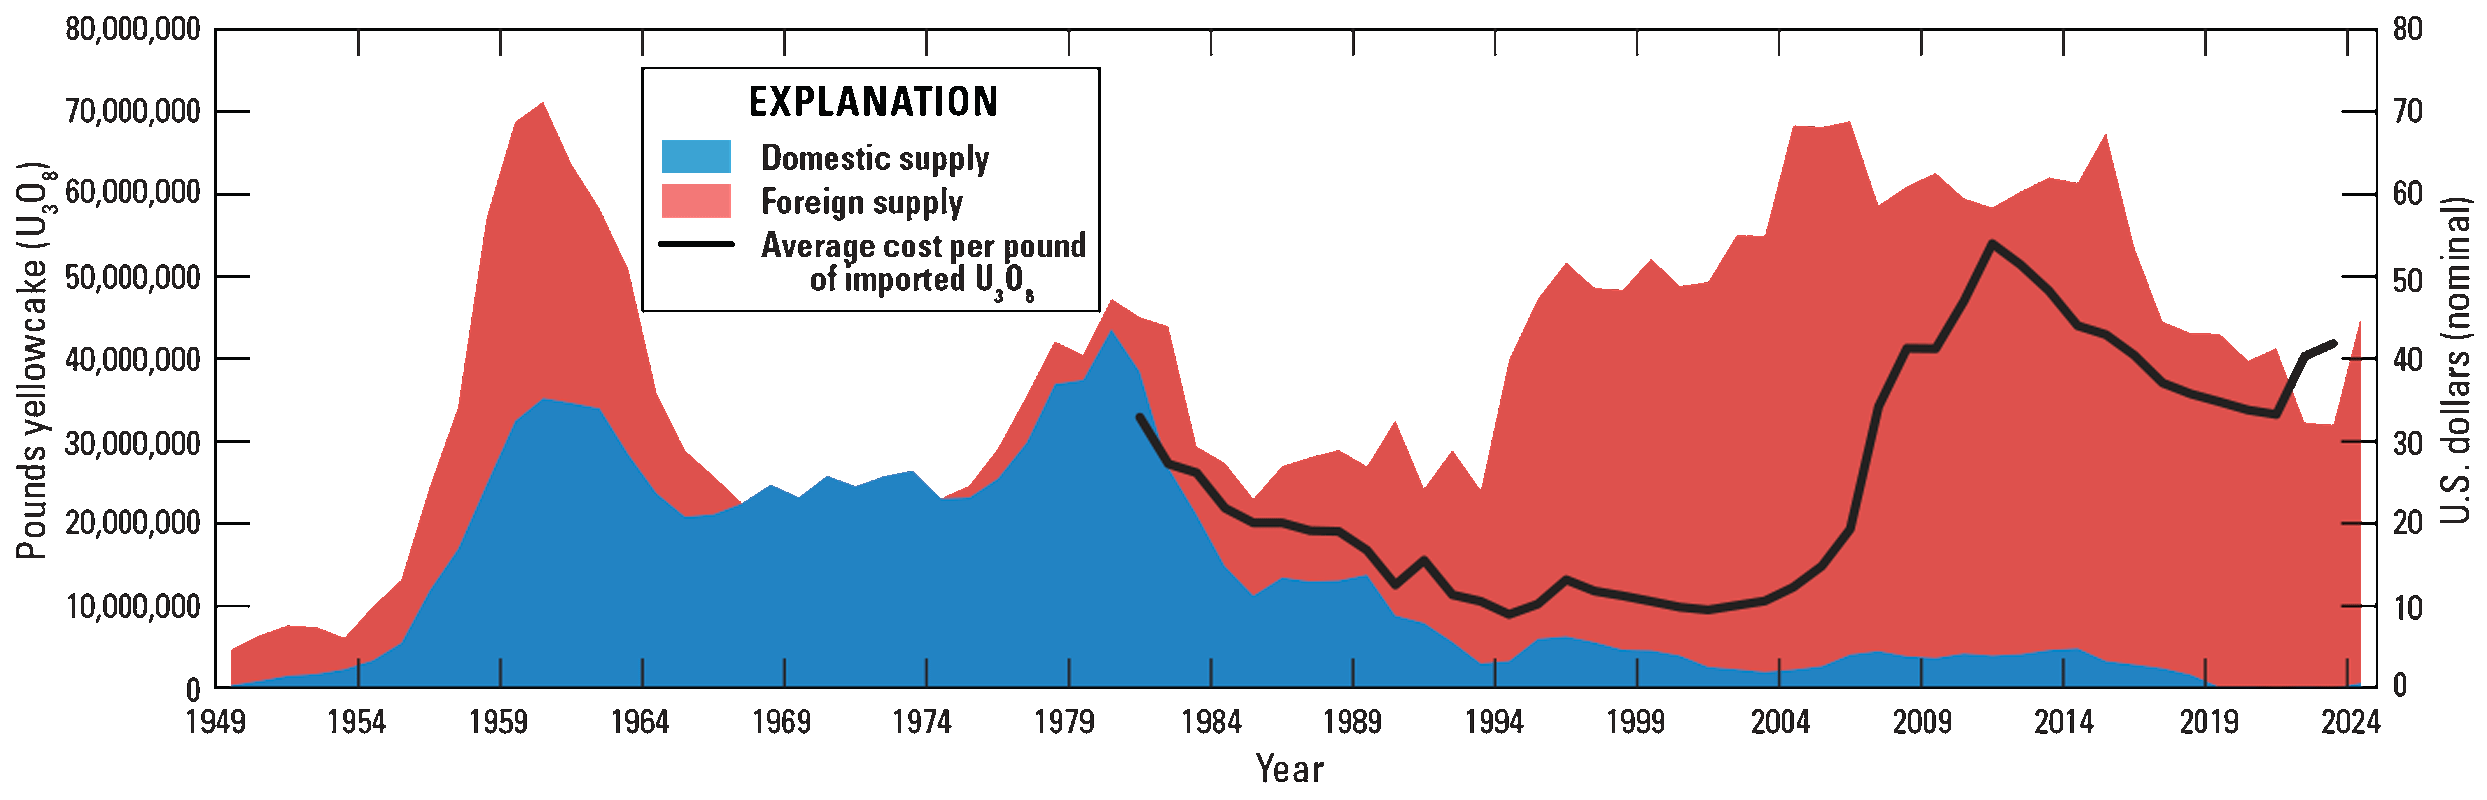
Graph showing historic domestic and foreign sources of uranium for the United States from 1949 to 2024 and value in U.S. dollars. Based on U.S. Energy Information Administration (EIA; 2025b). (U3O8, triuranium oxide, also referred to as “yellowcake”)
The uranium supply chain faces multiple categories of risk, including geopolitical, regulatory, resource base, operational and technical, product dependency, currency exchange rates and financial, and transportation of radioactive materials (UxC, 2024).
-
1. Geopolitical risks stem from political instability and international tensions.
-
2. Regulatory risks include the tightening of environmental and safety requirements.
-
3. Resource-base risks relate to the strength and longevity of resources that underpin project security.
-
4. Operational and technical risks arising from mining methods and ore processing, delayed projects and production, and project restart challenges affect uranium mining, conversion, and enrichment at critical stages in the nuclear fuel cycle.
-
5. Product dependency risk relates to uranium that is recovered mainly as a co- or byproduct and is therefore dependent on the mining of other primary products (such as gold in South Africa or copper in Australia).
-
6. Currency exchange rate fluctuations can affect project profitability and the value of a company’s uranium project.
-
7. Transportation risks emerge from extensive dependence on external shipping networks (ocean, truck, and rail), which are vulnerable to denial-of-shipment disruptions (IAEA, 2010).
There are also market risks that stem from uranium’s cyclical pricing and opaque contracting, compounded by supply-demand imbalances, including price volatility and supply-demand gaps and trade barriers, like tariffs, which can reshape supply chains by introducing uncertainty (UxC, 2024; Todorova, 2025). Overall, these factors create a complex risk environment that can disrupt uranium supply reliability.
Domestic supply-chain risks reflect a heavy reliance on foreign suppliers for uranium and its enrichment (UxC, 2024). Although domestic and global uranium exploration and production began to rebound in late 2020 after a decade of low market prices and reduced demand (NEA and IAEA, 2025), other risks pose fuel supply-chain challenges at the milling, conversion, enrichment, fuel fabrication, and spent fuel reprocessing stages, with only one or a small number of private companies owning or operating facilities involved in one or more of the various supply stages (refer to fig. 1). Single-point-of-failure, whereby only one domestic producer is identified in each mineral commodity supply chain, is one of the factors used to identify critical mineral supply-chain risks in the methodology used for the 2025 U.S. List of Critical Minerals (Nassar and others, 2025).
With respect to milling mined ore, there is only one fully licensed and operating conventional mill in the United States to process hard rock and byproduct uranium ores, and it is one of only three in North America (UxC, 2024). There is only 1 domestic facility to convert U-235 to UF6 for enrichment, and only 3 facilities to convert UF6 to UO2 for fuel fabrication, which have been operational since 1972 and 2010 (IAEA, 2023b). The U.S. U-235 to UF6 conversion facility is 1 of 5 in operation worldwide, but more than 99 percent of the world’s uranium enrichment capacity is controlled by the other 4: China National Nuclear Corporation, Rosatom (Russia), Urenco (U.K.-Germany-Netherlands), and Orano (France; Todorova, 2025). There is also only one uranium enrichment facility producing LEU in operation in the United States (IAEA, 2023b), and it is controlled by a European-owned corporation (Sprott, 2025).
There are no commercial-scale enrichment facilities in operation in the United States for high-assay low-enriched uranium (HALEU), a type of nuclear fuel that will be used by advanced nuclear reactor designs that are being developed worldwide, such as SMRs. Production is currently (2025) limited to Russia and China, but a domestic producer is in development with the support of the U.S. Department of Energy (WNA, 2023a; DOE, 2025). There are only three fabrication facilities that produce fuel for use in commercial nuclear reactors (NRC, 2025) and no spent fuel reprocessing (recycling) facilities in the United States (WNA, 2024a), although there are plans to develop a pilot plant (World Nuclear News, 2024).
Summary
As the primary fuel for nuclear fission, uranium is used for electric power generation (about 20 percent domestically and 10 percent globally), desalination, hydrogen production, and emerging small modular reactors (SMRs) for remote sites, industrial applications, and data centers and artificial intelligence (AI) infrastructure. Uranium production is led by six countries—Kazakhstan, Canada, Namibia, Australia, Uzbekistan, and Russia—that, in 2023, accounted for roughly 90 percent of global production. The United States, the world’s largest uranium consumer, produces less than 1 percent of its own commercial uranium requirements. The dependency on production from a small number of countries and mines creates a supply risk. In addition, global geopolitical instability, regulatory and financial uncertainties, small enrichment and fuel fabrication capacity, and logistical challenges in transporting radioactive materials add to these vulnerabilities for the United States. These factors establish uranium as an important mineral for national security, energy resilience, and technological leadership. The U.S. Government has responded with a commitment of $2.7 billion dollars in investments and policy directives to rebuild domestic capacity.
References Cited
GlobalData, 2024, Uranium mining market analysis by reserves, production, assets, demand drivers and forecast to 2030: GlobalData, 49 p., accessed December 31, 2024, at https://www.globaldata.com/store/report/uranium-mining-market-analysis/.
Hall, S.M., Mihalasky, M.J., and Van Gosen, B.S., 2017, Assessment of undiscovered resources in calcrete uranium deposits, Southern High Plains region of Texas, New Mexico, and Oklahoma, 2017: U.S. Geological Survey Fact Sheet 2017–3078, 2 p., accessed September 30, 2025, at https://doi.org/10.3133/fs20173078.
International Atomic Energy Agency [IAEA], 2009, World distribution of uranium deposits (UDEPO) with uranium deposit classification: Vienna, Austria, IAEA, 128 p., accessed September 30, 2025, at https://www.iaea.org/publications/8175/world-distribution-of-uranium-deposits-udepo-with-uranium-deposit-classification.
International Atomic Energy Agency [IAEA], 2010, The handbook for addressing instances of denials/delays of shipment of radioactive material: Vienna, Austria, IAEA, 33 p., accessed September 30, 2025, at https://nucleus.iaea.org/sites/committees/Before%202023%20Archive/ISCDOS/General/DenialsHandbook.doc.
International Atomic Energy Agency [IAEA], 2012, Getting to the core of the nuclear fuel cycle: Vienna, Austria, IAEA, 12 p., accessed September 30, 2025, at https://www.iaea.org/sites/default/files/18/10/nuclearfuelcycle.pdf.
International Atomic Energy Agency [IAEA], 2018, The nuclear fuel cycle: Vienna, Austria, IAEA, 24 p., accessed September 30, 2025, at https://www.iaea.org/sites/default/files/19/02/the-nuclear-fuel-cycle.pdf.
International Atomic Energy Agency [IAEA], 2020, Descriptive uranium deposit and mineral system models: Vienna, Austria, IAEA, 313 p., accessed September 30, 2025, at https://www.iaea.org/publications/14663/descriptive-uranium-deposit-and-mineral-system-models.
International Atomic Energy Agency [IAEA], 2021, Welcome to SRIS: IAEA website, accessed September 30, 2025, at https://sris.iaea.org/.
International Atomic Energy Agency [IAEA], 2023a, Milestones in the development of national infrastructure for the uranium production cycle: Vienna, Austria, IAEA, 163 p., accessed September 30, 2025, at https://www.iaea.org/publications/15010/milestones-in-the-development-of-national-infrastructure-for-the-uranium-production-cycle.
International Atomic Energy Agency [IAEA], 2023b, Nuclear fuel cycle facilities database: IAEA web site, accessed September 30, 2025, at https://infcis.iaea.org/NFCFDB/.
International Atomic Energy Agency [IAEA], 2025a, Global status of front end nuclear fuel cycle inventories in 2023: Vienna, Austria, IAEA, 114 p., accessed September 30, 2025, at https://www.iaea.org/publications/15871/global-status-of-front-end-nuclear-fuel-cycle-inventories-in-2023.
International Atomic Energy Agency [IAEA], 2025b, Nuclear power reactors in the world: Vienna, Austria, IAEA, 92 p., accessed September 30, 2025, at https://www.iaea.org/publications/15943/nuclear-power-reactors-in-the-world; https://pris.iaea.org/pris/home.aspx.
Mihalasky, M.J., 2022, How much naturally occurring uranium is there in the world?: IAEA Connect, 1 sheet infographic, accessed September 30, 2025, at https://nucleus.iaea.org/sites/connect/UPCpublic/SitePages/Infographics.aspx.
Mihalasky, M.J., Hall, S.M., Hammarstrom, J.M., Tureck, K.R., Hannon, M.T., Breit, G.N., Zielinski, R.A., and Elliott, B., 2015, Assessment of undiscovered sandstone-hosted uranium resources in the Texas Coastal Plain, 2015: U.S. Geological Survey Fact Sheet 2015–3069, 4 p., accessed September 30, 2025, at https://doi.org/10.3133/fs20153069.
Nassar, N.T., Pineault, D., Allen, S.M., McCaffrey, D.M., Padilla, A.J., Brainard, J.L., Bayani, M., Shojaeddini, E., Ryter, J.W., Lincoln, S., and Alonso, E., 2025, Methodology and technical input for the 2025 U.S. List of Critical Minerals—Assessing the potential effects of mineral commodity supply chain disruptions on the U.S. economy: U.S. Geological Survey Open-File Report 2025–1047, 32 p., accessed September 30, 2025, at https://doi.org/10.3133/ofr20251047.
Organisation for Economic Co-operation and Development [OECD] Nuclear Energy Agency [NEA] and International Atomic Energy Agency [IAEA], 2014, Uranium 2014—Resources, production and demand: Paris, France, OECD Publishing, no. 7209, 504 p., accessed September 30, 2025, at https://www.oecd-nea.org/jcms/pl_14916/uranium-2014-resources-production-and-demand?details=true.
Organisation for Economic Co-operation and Development [OECD] Nuclear Energy Agency [NEA] and International Atomic Energy Agency [IAEA], 2023, Uranium 2022—Resources, production and demand: Paris, France, OECD Publishing, no. 7634, 561 p., accessed September 30, 2025, at https://www.oecd-nea.org/jcms/pl_79960/uranium-2022-resources-production-and-demand?details=true.
Organisation for Economic Co-operation and Development [OECD] Nuclear Energy Agency [NEA] and International Atomic Energy Agency [IAEA], 2025, Uranium 2024—Resources, production and demand: Paris, France, OECD Publishing, no. 7683, 604 p., accessed September 30, 2025, at https://www.oecd-nea.org/jcms/pl_103179/uranium-2024-resources-production-and-demand.
Potter, E.G., Cuney, M., and Kyser, K., 2017, Geology and geochemistry of uranium and thorium deposits: Mineralium Deposita, v. 52, no. 1, p. 133–134, accessed September 30, 2025, at https://doi.org/10.1007/s00126-016-0681-9.
Spencer, B., and Pohle, R., 2025, Secrets of the deep, deep tunnels where nuclear waste is buried: The Times of London web page, accessed September 30, 2025, at https://www.thetimes.com/uk/environment/article/nuclear-power-waste-finland-bkq8sq0lj.
Sprott, 2025, Uranium’s bull market reawakens: Kitco News web page, accessed September 30, 2025, at https://www.kitco.com/opinion/2025-06-16/uraniums-bull-market-reawakens.
Tarakanov, V., 2023, What is uranium?: International Atomic Energy Agency web site, accessed September 30, 2025, at https://www.iaea.org/newscenter/news/what-is-uranium.
Todorova, N., 2025, Uranium sector sensitivity to financial and geopolitical risks: Economics Letters, v. 255, 5 p., accessed September 30, 2025, at https://doi.org/10.1016/j.econlet.2025.112475.
U.S. Department of Energy [DOE], 2025, Centrus reaches 900 kilogram mark for HALEU production: U.S. Department of Energy web page, accessed September 30, 2025, at https://www.energy.gov/ne/articles/centrus-reaches-900-kilogram-mark-haleu-production.
U.S. Energy Information Administration [EIA], 2024, Uranium marketing annual report: U.S. Energy Information Administration web page, accessed September 30, 2025, at https://www.eia.gov/uranium/marketing/.
U.S. Energy Information Administration [EIA], 2025a, Domestic uranium production report—Annual: U.S. Energy Information Administration web page, accessed September 30, 2025, at https://www.eia.gov/uranium/production/annual/.
U.S. Energy Information Administration [EIA], 2025b, U.S. nuclear generators import nearly all the uranium concentrate they use: U.S. Energy Information Administration web page, accessed September 30, 2025, at https://www.eia.gov/todayinenergy/detail.php?id=64444.
U.S. Geological Survey, 2022, Uranium mineral systems: U.S. Geological Survey web page, accessed September 30, 2025, at https://www.usgs.gov/centers/central-energy-resources-science-center/science/uranium-mineral-systems.
U.S. Nuclear Regulatory Commission [NRC], 2020, Industrial uses of nuclear materials: U.S. NRC web page, accessed September 30, 2025, at https://www.nrc.gov/materials/miau/industrial.
U.S. Nuclear Regulatory Commission [NRC], 2025, Locations of fuel cycle facilities: U.S. NRC web page, accessed September 30, 2025, at https://www.nrc.gov/info-finder/fc/index.
UxC, 2024, Uranium suppliers annual: Roswell, Georgia, UxC, LLC, 571 p., accessed September 30, 2025, at https://www.uxc.com/p/product/report/usa.
World Nuclear Association [WNA], 2023a, High-assay low-enriched uranium (HALEU): WNA web page, accessed September 30, 2025, at https://world-nuclear.org/information-library/nuclear-fuel-cycle/conversion-enrichment-and-fabrication/high-assay-low-enriched-uranium-haleu.
World Nuclear Association [WNA], 2023b, Nuclear fuel report, global scenarios for demand and supply availability 2023–2040: WNA web page, 258 p., accessed September 30, 2025, at https://world-nuclear.org/news-and-media/press-statements/nuclear-fuel-report-2023-decarbonization-energy-s.
World Nuclear Association [WNA], 2024a, Processing of used nuclear fuel: WNA web page, accessed September 30, 2025, at https://world-nuclear.org/information-library/nuclear-fuel-cycle/fuel-recycling/processing-of-used-nuclear-fuel.
World Nuclear Association [WNA], 2024b, Uranium markets: WNA web page, accessed September 30, 2025, at https://world-nuclear.org/information-library/nuclear-fuel-cycle/uranium-resources/uranium-markets.
World Nuclear Association [WNA], 2025a, International nuclear waste disposal concepts: WNA web page, accessed September 30, 2025, at https://world-nuclear.org/information-library/nuclear-fuel-cycle/nuclear-waste/international-nuclear-waste-disposal-concepts.
World Nuclear Association [WNA], 2025b, The many uses of nuclear technology: WNA web page, accessed September 30, 2025, at https://world-nuclear.org/information-library/non-power-nuclear-applications/overview/the-many-uses-of-nuclear-technology.
World Nuclear Association [WNA], 2025c, Uranium enrichment: WNA web page, accessed September 30, 2025, at https://world-nuclear.org/information-library/nuclear-fuel-cycle/conversion-enrichment-and-fabrication/uranium-enrichment.
World Nuclear Association [WNA], 2025d, World nuclear fuel report—Global scenarios for demand and supply availability 2025–2040: WNA web page, accessed September 30, 2025, at https://world-nuclear.org/our-association/publications/global-trends-reports/world-nuclear-fuel-report-2025.
World Nuclear Association [WNA], 2025e, World nuclear power reactors and uranium requirements: WNA web page, accessed September 30, 2025, at https://world-nuclear.org/information-library/facts-and-figures/world-nuclear-power-reactors-and-uranium-requireme.
World Nuclear News, 2024, Plans announced for pilot U.S. nuclear fuel recycling plant: World Nuclear News web page, accessed September 30, 2025, at https://www.world-nuclear-news.org/Articles/Plans-announced-for-pilot-US-nuclear-fuel-recyclin.
World Nuclear News, 2025, A guide—Uranium and the nuclear fuel cycle: World Nuclear News web page, accessed September 30, 2025, at https://www.world-nuclear-news.org/articles/the-nuclear-fuel-cycle-a-guide.
For More Information
Assessment results are also available at the US. Geological Survey Energy Resources Program website, https://www.usgs.gov/programs/energy-resources-program.
Disclaimers
Any use of trade, firm, or product names is for descriptive purposes only and does not imply endorsement by the U.S. Government.
Although this information product, for the most part, is in the public domain, it also may contain copyrighted materials as noted in the text. Permission to reproduce copyrighted items must be secured from the copyright owner.
Suggested Citation
Mihalasky, M.J., 2026, Uranium—Deposits, production and resources, market dynamics, and supply chain risks: U.S. Geological Survey Fact Sheet 2025-3057, 6 p., https://doi.org/10.3133/fs20253057.
ISSN: 2327-6932 (online)
ISSN: 2327-6916 (print)
Study Area
| Publication type | Report |
|---|---|
| Publication Subtype | USGS Numbered Series |
| Title | Uranium—Deposits, production and resources, market dynamics, and supply chain risks |
| Series title | Fact Sheet |
| Series number | 2025-3057 |
| DOI | 10.3133/fs20253057 |
| Publication Date | April 23, 2026 |
| Year Published | 2026 |
| Language | English |
| Publisher | U.S. Geological Survey |
| Publisher location | Reston VA |
| Contributing office(s) | Geology, Minerals, Energy, and Geophysics Science Center |
| Description | 6 p. |
| Online Only (Y/N) | N |