System Characterization Report on Vision-1
Links
- Document: Report (1.5 MB pdf) , HTML , XML
- Larger Work: This publication is Chapter Q of System characterization of Earth observation sensors
- Download citation as: RIS | Dublin Core
Executive Summary
This report addresses system characterization of the Airbus Vision-1 satellite and is part of a series of system characterization reports produced and delivered by the U.S. Geological Survey Earth Resources Observation and Science Cal/Val Center of Excellence. These reports present and detail the methodology and procedures for characterization; present technical and operational information about the specific sensing system being evaluated; and provide a summary of test measurements, data retention practices, data analysis results, and conclusions.
Vision-1 is a high-resolution Earth observation satellite launched in September 2018 as a collaborative effort between Airbus and Surrey Satellite Technology Ltd. It features a Newtonian telescope with a refractive relay, capturing images in panchromatic and multispectral bands. Operating in a Sun-synchronous orbit at an altitude of 583 kilometers, Vision-1 ensures consistent illumination conditions during image acquisition. It has a revisit time of 1 to 8 days depending on latitude and viewing angle, and it features an off-pointing agility of plus or minus 45 degrees, allowing for multiple target captures in a single pass using spot, strip, and mosaic imaging modes. The panchromatic band offers a resolution of 0.87 meter (m), whereas the multispectral bands (blue, green, red, and near infrared) provide a resolution of 3.48 m. These capabilities support a variety of applications including urban planning, agricultural monitoring, land classification, natural resource management, and disaster response. More information on the Vision-1 satellite and sensors is available in the “2022 Joint Agency Commercial Imagery Evaluation—Remote Sensing Satellite Compendium” (Ramaseri Chandra and others, 2022).
The Earth Resources Observation and Science Cal/Val Center of Excellence system characterization team completed data analyses to characterize the geometric (interior and exterior), radiometric, and spatial performances. Results of these analyses indicate that the Vision-1 satellite has an interior geometric performance in the range of 0 to 0.02 m in easting and −0.01 to 0.03 m in northing in band-to-band registration, an exterior geometric performance of 1.7 to 2.2 m in easting and −1.1 to −0.7 m in northing offset with a 90-percent circular error of 3.4 to 3.7 m, a radiometric performance in the range of −0.029 to 0.017 in offset and 0.884 to 0.984 in slope, and a spatial performance in the range of 0.992 to 1.092 pixels for multispectral full width at half maximum and 1.895 pixels for the panchromatic band full width at half maximum, with a modulation transfer function at a Nyquist frequency in the range of 0.29 to 0.36 for the multispectral bands and 0.05 for the panchromatic band.
Reference Cited
Ramaseri Chandra, S.N., Christopherson, J.B., Casey, K.A., Lawson, J., and Sampath, A., 2022, 2022 Joint Agency Commercial Imagery Evaluation—Remote sensing satellite compendium: U.S. Geological Survey Circular 1500, 279 p. [Also available at https://doi.org/10.3133/cir1500.] [Supersedes USGS Circular 1468.]
Introduction
Vision-1 is a high-resolution Earth observation satellite launched in September 2018. It is a collaboration between Airbus and Surrey Satellite Technology Ltd. The satellite is equipped with a Newtonian telescope and a refractive relay, capturing images in panchromatic (PAN) and multispectral bands. Vision-1’s PAN band offers 0.87-meter (m) resolution, whereas its multispectral bands (blue, green, red, and near infrared) provide a resolution of 3.48 m. The intended applications of this imagery are urban planning, agricultural monitoring, land classification, natural resource management, and disaster response.
Vision-1 operates in a Sun-synchronous orbit at an altitude of 583 kilometers (km) with an expectation of consistent illumination conditions during image acquisition. The satellite can revisit the same location on Earth within 1 to 8 days, depending on latitude and viewing angle. The satellite also has an off-pointing agility of plus or minus 45 degrees, enabling it to capture multiple targets in a single pass using spot, strip, and mosaic imaging modes (Ramaseri Chandra and others, 2022).
The satellite’s data are delivered in various formats, including JPEG2000 and GeoTIFF, and can be provided as scaled radiance or an orthorectified product. Airbus offers these data through its OneAtlas platform, making it accessible to a wide range of users and applications. Vision-1 has an expected mission lifetime of more than 7 years (Linfield and Haskell, 2020).
The data analysis results provided within this report have been derived from approved Joint Agency Commercial Imagery Evaluation (JACIE) processes and procedures. JACIE was formed to leverage resources from several Federal agencies for the characterization of remote sensing data and to share those results across the remote sensing community. More information about JACIE is available at https://www.usgs.gov/core-science-systems/eros/calval/jacie.
Purpose and Scope
The purpose of this report is to describe the specific sensor or sensing system, test its performance in three categories, complete related data analyses to quantify these performances, and report the results in a standardized document. In this chapter, the Vision-1 sensor is described. This report presents the evaluation results of the system in terms of its geometric, radiometric, and spatial quality. The scope of the geometric assessment is limited to testing the interior alignments of spectral bands relative to one another and its geolocation accuracy with reference to ground surveyed checkpoints and higher accuracy orthophotography.
The U.S. Geological Survey (USGS) Earth Resources Observation and Science Cal/Val Center of Excellence (ECCOE) project, and the associated system characterization process used for this assessment, follows the USGS Fundamental Science Practices, which include maintaining data, information, and documentation needed to reproduce and validate the scientific analysis documented in this report. Additional information and guidance about Fundamental Science Practices and related resource information of interest to the public are available at https://www.usgs.gov/office-of-science-quality-and-integrity/fundamental-science-practices. For additional information related to this report, please contact the ECCOE at eccoe@usgs.gov.
System Description
This section describes the satellite and operational details and provides information about the Vision-1 sensor.
Satellite and Operational Details
The satellite and operational details for Vision-1 are listed in table 1.
Table 1.
Satellite and operational details for Vision-1.[TOA, Top of Atmosphere; SSTL, Surrey Satellite Technology Ltd.; kg, kilogram; VNIR, visible and near infrared; +, plus; km, kilometer; °, degree; m, meter]
Sensor Information
The imaging sensor details for Vision-1 are listed in table 2. The spectral responses for Vision-1 sensor are shown in figure 1.
Table 2.
Imaging sensor details for Vision-1.[µm, micrometer; m, meter; NIR, near infrared; PAN, panchromatic]
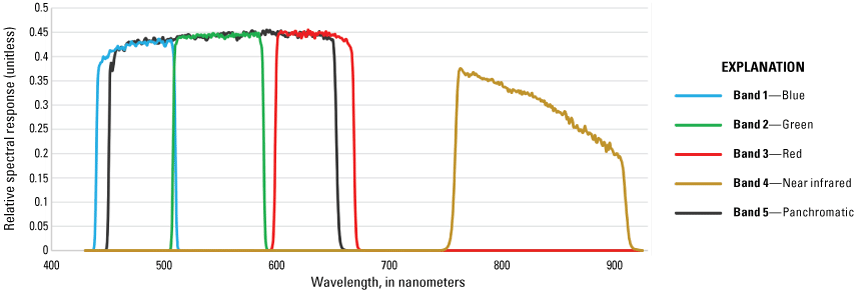
Vision-1 visible and near-infrared spectral response (Ramaseri Chandra and others, 2022).
Procedures
ECCOE has established standard processes to identify Earth observing systems of interest and to assess the geometric, radiometric, and spatial qualities of data products from these systems.
The assessment steps are as follows:
-
• system identification and investigation to learn the general specifications of the satellite and its sensor(s);
-
• data receipt and initial inspection to understand the characteristics and any overt flaws in the data product so that it may be further analyzed;
-
• geometry characterization, including interior geometric orientation measuring the relative alignment of spectral bands and exterior geometric orientation measuring how well the georeferenced pixels within the image are aligned to a known reference;
-
• radiometry characterization, including assessing how well the data products correlate with a known reference and, when possible, assessing the signal-to-noise ratio; and
-
• spatial characterization, assessing the two-dimensional fidelity of the image pixels to their projected ground sample distance.
Measurements
The observed USGS measurements are listed in table 3. Physical error, in meters, is calculated by the ground sample distance multiplied by the pixel error. Details about the methodologies used are outlined in the “Analysis” section.
Table 3.
U.S. Geological Survey measurement results.[m, meter; RMSE, root mean square error; CE90, 90-percent circular error; L8, Landsat 8; OLI, Operational Land Imager; FWHM, full width at half maximum; MTF, modulation transfer function; USGS, U.S. Geological Survey] ;
Analysis
This section of the report describes the geometric, radiometric, and spatial performance of Vision-1.
Geometric Performance
The geometric performance for Vision-1 is characterized in terms of the interior (band-to-band alignment) and exterior (geometric location accuracy) geometric analysis results.
Interior (Band to Band)
The interior or band-to-band alignment analysis was completed on two images from the U.S. Railroad Valley Playa, Nevada, site (images VIS1_MS4_20200626175249_ORT_102842_1378.tif and VIS1_MS4_20200609175017_ORT_102840_127c.tif). Band combinations were registered against the blue band for both the images to determine the mean error and root mean square error, as listed in table 4.
Table 4.
Band-to-band registration error (in meters).[RMSE, root mean square error; NIR, near infrared]
In figure 2, the histograms are presented from the measurements. The Gaussian nature of the measurements around zero mean indicate that the bands are well aligned to each other.
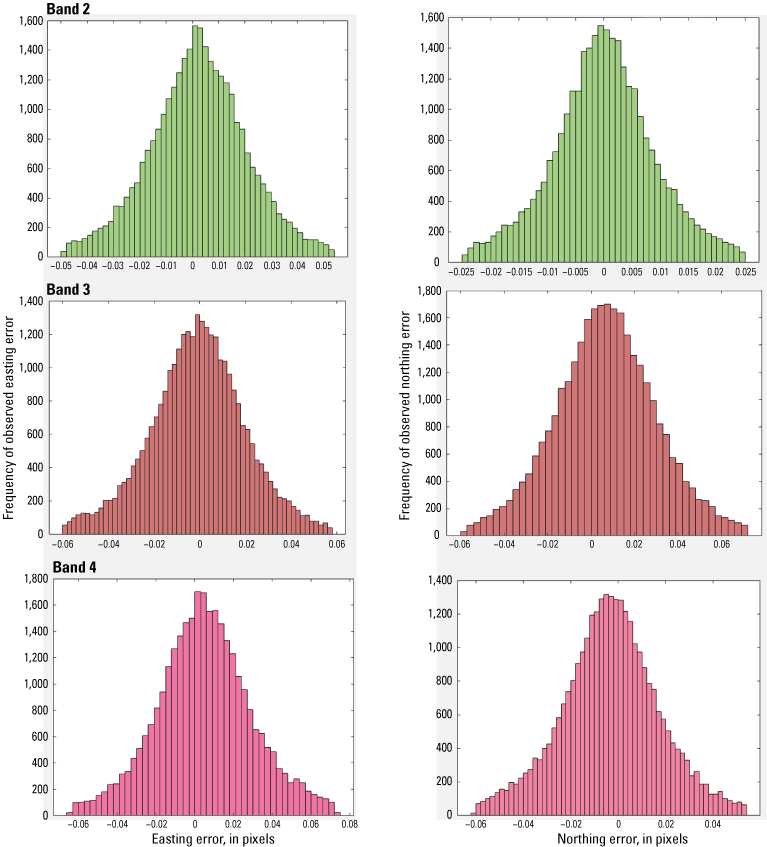
Band 2 (green), band 3 (red), and band 4 (near infrared) versus band 1 (blue) geometric error histogram for Railroad Valley Playa. The first column represents errors in the easting direction, and the second column represents the errors in northing direction. The x-axis presents the measured error, in pixels. The measurements illustrated here are for the VIS1_MS4_20200626175249_ORT_102842_1378.tif scene.
Exterior (Geometric Location Accuracy)
Two Vision-1 PAN orthorectified images, listed in table 5, were assessed for geolocation accuracy by comparing ground coordinates manually measured using QGIS (2019) to well-surveyed ground control points (GCPs) used as checkpoints over the Sioux Falls, South Dakota, test site. The images have a nominal 0.87-m ground sample distance and are stored in the GeoTIFF image format referenced to the World Geodetic System of 1984 coordinates (European Petroleum Survey Group : 4326). QGIS was used to convert the measured point coordinates in European Petroleum Survey Group :4326 to World Geodetic System-84 Universal Transverse Mercator zone 14 north ( European Petroleum Survey Group: 32614) coordinates for comparison to the checkpoints.
Table 5.
Vision-1 panchromatic orthorectified images assessed over Sioux Falls, South Dakota.[Dates shown as month/day/year]
Each set of measured horizontal coordinates was compared to the known set of horizontal coordinates of the corresponding ground-surveyed control point to determine the horizontal error for that point. Absolute error statistics for the orthorectified images are listed in table 6, and error plots are provided in figures 3 and 4. The first scene (VIS1_PAN_20230916161305_ORT_126550_45af) has an absolute 90-percent circular error (CE90) of 3.4 m with a 94.3-percent confidence bound that the true absolute CE90 is less than 3.7 m (when accounting for statistical uncertainty based on the GCP sample size within the scene). The second scene (VIS1_PAN_20231002160959_ORT_126548 462d) has an absolute CE90 of 3.7 m with a 93.4-percent confidence bound that the true absolute CE90 is less than 4.1 m (when accounting for statistical uncertainty based on the GCP sample size within the scene).
Table 6.
Absolute geolocation errors of Vision-1 panchromatic orthorectified images using checkpoints.[ID, identifier; GCP, ground control point; SDDEV, standard deviation; RMSE, root mean square error; CE90, 90-percent circular error; m, meter; ~, about; pix, pixel]
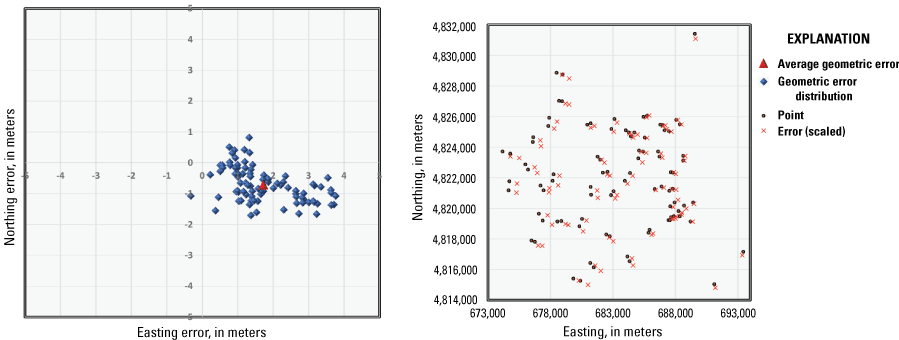
Vision-1 absolute horizontal geolocation error plots for September 16, 2023, image (Sioux Falls, South Dakota).
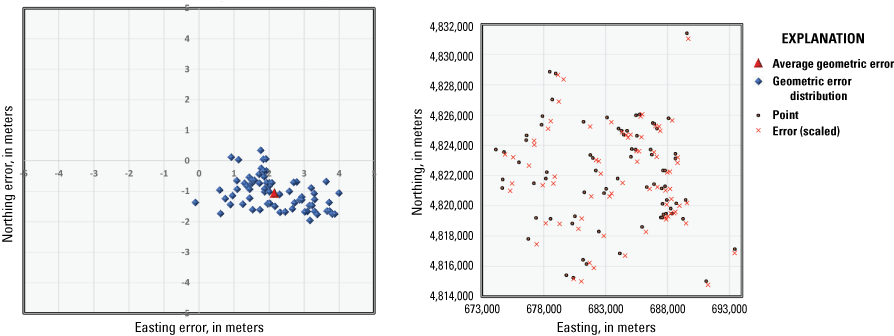
Vision-1 absolute horizontal geolocation error plots for October 2, 2023, image (Sioux Falls, South Dakota).
Relative geolocation accuracy statistics are derived from the differences in absolute horizontal errors for every checkpoint combination from the absolute accuracy analysis and are summarized in table 7. The first image has a relative CE90 of about 2.52 m with a 90.6-percent confidence bound that the true relative CE90 is less than 2.54 m. The second image has a relative CE90 of 2.33 m with a 90.7-percent confidence bound that the true relative CE90 is less than 2.37 m.
Radiometric Performance
For this analysis, cloud-free regions of interest were selected within two near-coincident Vision-1 and Sentinel-2 scene pairs. Once the relative georeferencing error between Sentinel-2 and Vision-1 has been corrected, Top of Atmosphere (TOA) reflectance values from the two sensors are extracted. The scatterplots (figs. 5 and 6) are drawn in a way that the x-axis is the reference sensor and the y-axis is the comparison sensor. The linear regression, thus, represents TOA reflectance relative to that of the reference sensor. Ideally, the slope should be near unity, and the offset should be near zero. For instance, if the slope is greater than unity, that means the comparison sensor tends to overestimate TOA reflectance compared to the reference sensor.
TOA reflectance comparison results are listed in table 8. A band-by-band graphical comparison between the Vision-1 image over Railroad Valley, Nev. (RVPN1 in table 8), when compared with the corresponding Sentinel-2 band is shown in figure 5. A band-by-band comparison for a second image over Railroad Valley, Nev. (RVPN2 in table 8), is shown in figure 6.
Table 8.
Top of Atmosphere reflectance comparison for Sentinel-2 against Vision-1.[ID, identifier; NIR, near infrared; %, percent; R2, coefficient of determination]
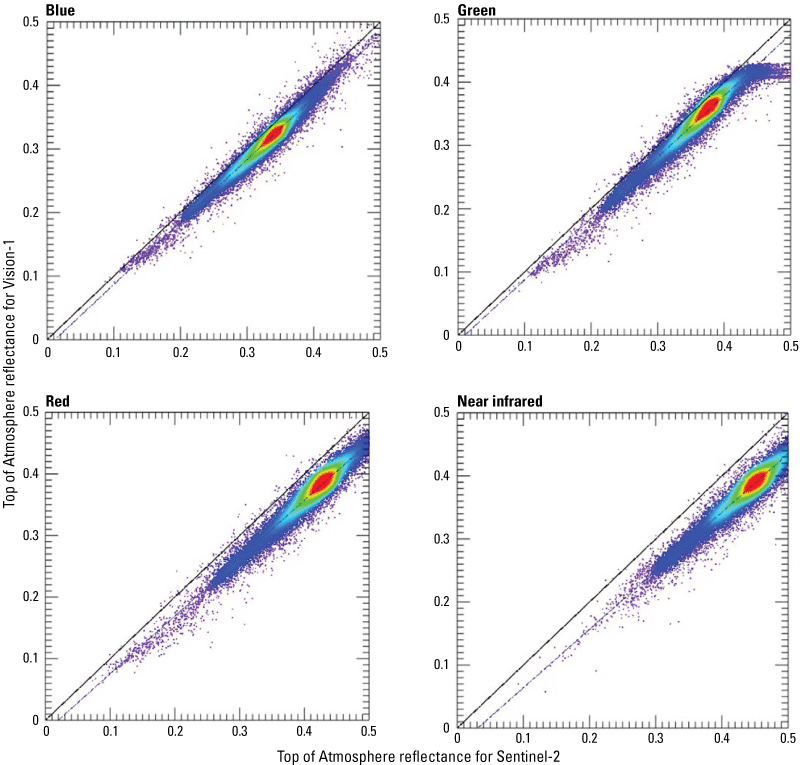
Top of Atmosphere reflectance comparison for Sentinel-2 and Vision-1, Railroad Valley, Nevada (RVPN1 in table 8).
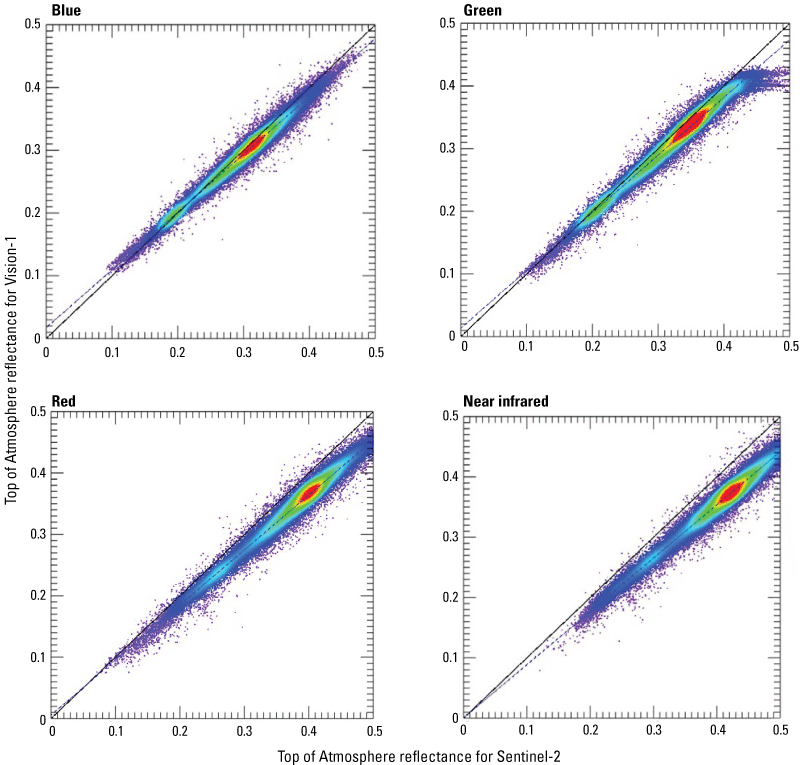
Top of Atmosphere reflectance comparison for Sentinel-2 and Vision-1, Railroad Valley, Nevada (RVPN2 in table 8).
Spatial Performance
For this analysis, edge spread and line spread functions (ESF and LSF, respectively) were calculated with resulting full width at half maximum and modulation transfer function at Nyquist frequency analysis outputs, as listed in table 9. The Vision-1 images used for the analysis are “VIS1_PAN_20231019045049_ORT_126542_46b3.tif” for the PAN band and “VIS1_MS4_20231019045049_ORT_126542_46b3.tif” for the visible and near infrared bands. The scenes are over the spatial test range in Shadnagar, India (fig. 7; U.S. Geological Survey, 2022c). The analysis was completed by manually delineating a rectangular box at the location of the edge. The LSF, ESF, full width at half maximum, and modulation transfer function values were calculated based on the variation of digital pixel values across the edge. The ESF curve in figures 8 and 9 indicates that the ground target has noise in one of the white regions. However, the relative edge response value was estimated from stable measurements (red dots along the slope of the ESF), indicating robust estimates of the quantity.
Table 9.
Spatial performance of Vision-1.[FWHM, full width at half maximum; MTF, modular transfer function; NIR, near infrared; PAN, panchromatic]
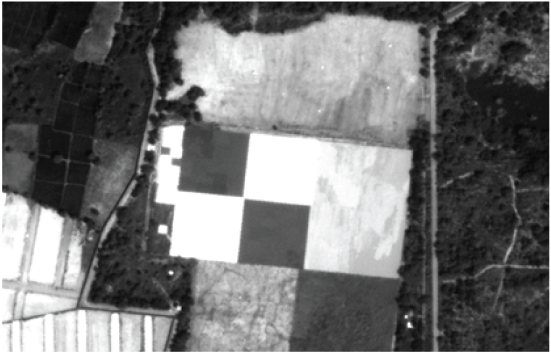
Vision-1 image of calibration site at Shadnagar, India.
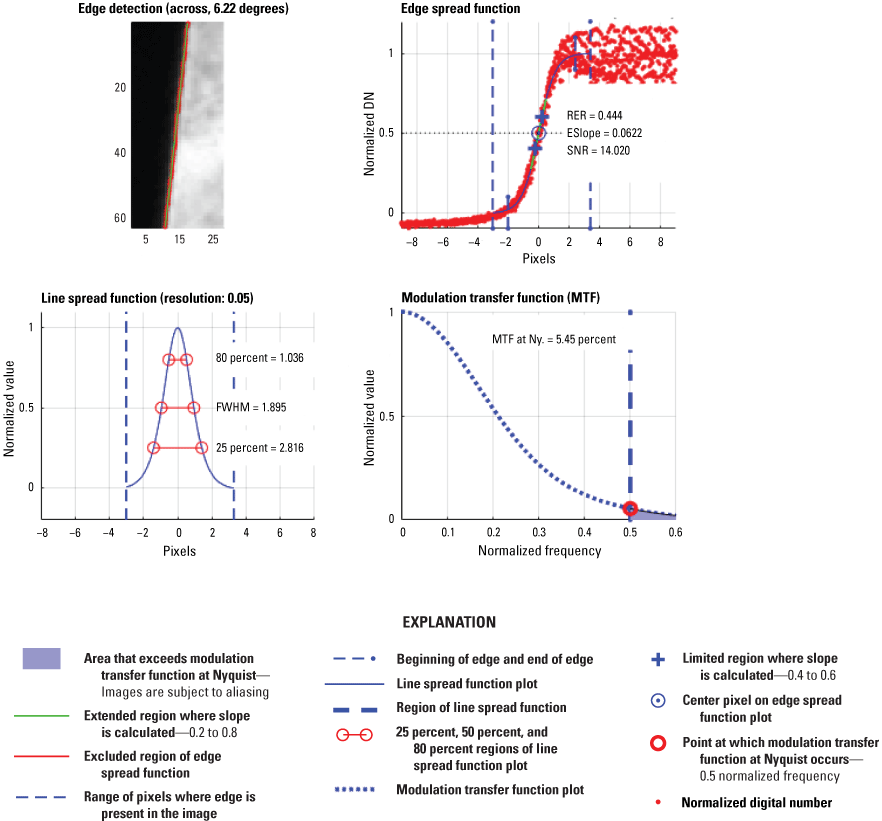
Panchromatic band orthorectified raw edge transect selected within region of interest at Shadnagar, India. [deg., degree; DN, digital number; RER, relative edge response; ESlope, slope of edge; SNR, signal-to-noise ratio; %, percent; FWHM, full width at half maximum; MTF, modular transfer function; Ny., Nyquist]
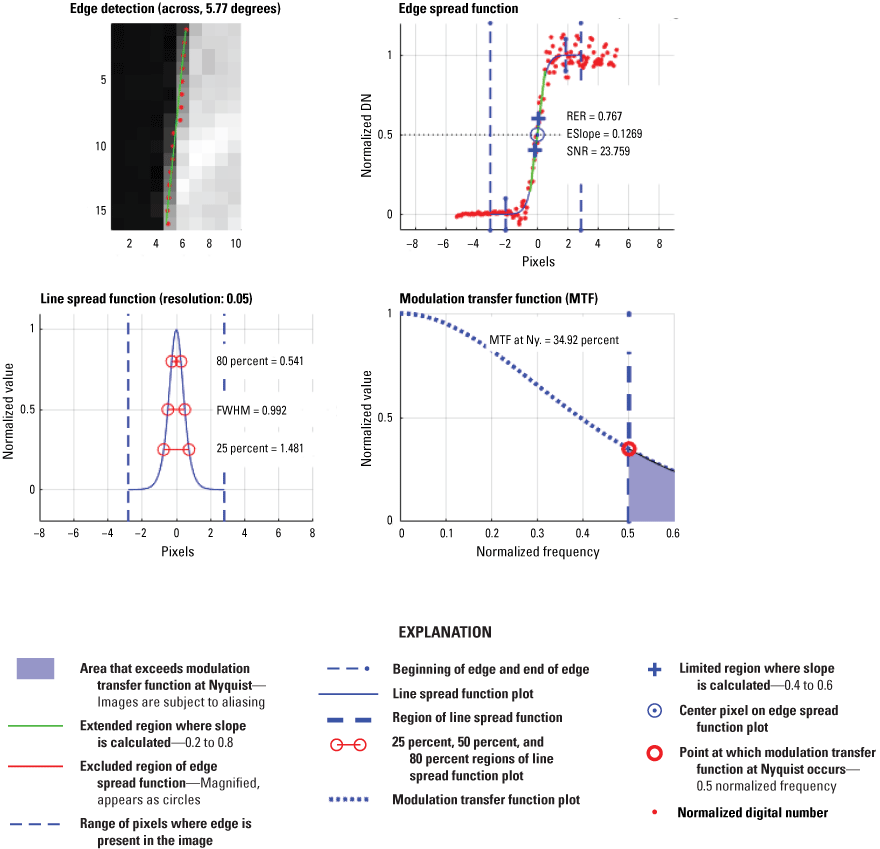
Red band raw edge transect selected within region of interest at Shadnagar, India. [deg., degree; DN, digital number; RER, relative edge response; ESlope, slope of edge; SNR, signal-to-noise ratio; %, percent; FWHM, full width at half maximum; MTF, modular transfer function; Ny., Nyquist]
Summary and Conclusions
This report analyzes the sensor performance of the Vision-1 system based on the U.S. Geological Survey Earth Resources Observation and Science Cal/Val Center of Excellence (ECCOE) system characterization process. In summary, we have determined that this sensor has an interior geometric performance in the range of 0 to 0.02 meter (m) in easting and −0.01 to 0.03 m in northing in band-to-band registration, an exterior geometric performance of 1.7 to 2.2 m in easting and −1.1 to −0.7 m northing offset with a 90-percent circular error of 3.4 to 3.7 m, a radiometric performance in the range of −0.029 to 0.017 in offset and 0.884 to 0.984 in slope, and a spatial performance in the range of 0.992 to 1.092 pixels for multispectral full width at half maximum and 1.895 pixels for the panchromatic band full width at half maximum, with a modulation transfer function at a Nyquist frequency in the range of 0.29 to 0.36 for the multispectral bands and 0.05 for the panchromatic band.
In conclusion, the team has completed an ECCOE standardized system characterization of the Airbus Vision-1 satellite sensing system. Although the team followed characterization procedures that are standardized across the many sensors and sensing systems under evaluation, these procedures are customized to fit the individual sensor as was done with Vision-1. The team has acquired the data, defined proper testing methodologies, carried out comparative tests against specific references, recorded measurements, completed data analyses, and quantified sensor performance accordingly. The team also endeavored to retain all data, measurements, and methods. This is key to ensure that all data and measurements are archived and accessible and that the performance results are reproducible.
The ECCOE project and associated Joint Agency Commercial Imagery Evaluation partners are always interested in reviewing sensor and remote sensing application assessments and would like to see and discuss information on similar data and product assessments and reviews. If you would like to discuss system characterization with the U.S. Geological Survey ECCOE and (or) the Joint Agency Commercial Imagery Evaluation team, please email us at eccoe@usgs.gov.
Selected References
Airbus, 2019, Airbus strengthens its imagery capabilities with Vision-1: Airbus Defence and Space press release, 1 p., accessed June 6, 2024, at https://www.airbus.com/sites/g/files/jlcbta136/files/b049da955312ccf95c2c8548fdbffceb_EN-Airbus-CIS-Press-Release-Vision-1-satellite.pdf.
Linfield, L., and Haskell, L., 2020, MTF variation across high-resolution Vision-1 images using airports as experimental MTF test sites: Airbus Defence and Space, 34 p., accessed June 6, 2024, at https://calval.cr.usgs.gov/apps/sites/default/files/jacie/2020-S2_LLinfield-MTF-variation-across-high-resolution-Vision-1-images.pdf.
QGIS, 2019, QGIS version 3.18 (Zurich): QGIS open source software release, accessed May 2024 at https://qgis.org/project/visual-changelogs/visualchangelog318/.
Ramaseri Chandra, S.N., Christopherson, J.B., Casey, K., Oeding, J., Ranjitkar, B., and Rusten, T., 2022, Land remote sensing satellites online compendium: U.S. Geological Survey, digital data, accessed October 10, 2024, at https://calval.cr.usgs.gov/apps/compendium.
U.S. Geological Survey, 2022a, EROS CalVal Center of Excellence (ECCOE)—JACIE: U.S. Geological Survey web page, accessed November 2022 at https://www.usgs.gov/core-science-systems/eros/calval/jacie?qt-science_support_page_related_con=3#qt-science_support_page_related_con.
U.S. Geological Survey, 2022b, Landsat missions—Glossary and acronyms: U.S. Geological Survey web page, accessed November 2022 at https://www.usgs.gov/core-science-systems/nli/landsat/glossary-and-acronyms.
U.S. Geological Survey, 2022c, EROS Cal/Val Center of Excellence (ECCOE) test sites catalog, Shadnagar: U.S. Geological Survey web page, accessed June 10, 2024, at https://calval.cr.usgs.gov/apps/shadnagar.
For more information about this publication, contact:
Director, USGS Earth Resources Observation and Science Center
47914 252nd Street
Sioux Falls, SD 57198
605–594–6151
For additional information, visit: https://www.usgs.gov/centers/eros
Publishing support provided by the
Rolla Publishing Service Center
Disclaimers
Any use of trade, firm, or product names is for descriptive purposes only and does not imply endorsement by the U.S. Government.
Although this information product, for the most part, is in the public domain, it also may contain copyrighted materials as noted in the text. Permission to reproduce copyrighted items must be secured from the copyright owner.
Suggested Citation
Vrabel, J.C., Bresnahan, P., Sampath, A., Kim, M., Park, S., and Clauson, J., 2024, System characterization report on Vision-1, chap. Q of Ramaseri Chandra, S.N., comp., System characterization of Earth observation sensors: U.S. Geological Survey Open-File Report 2021–1030, 14 p., https://doi.org/10.3133/ofr20211030Q.
ISSN: 2331-1258 (online)
| Publication type | Report |
|---|---|
| Publication Subtype | USGS Numbered Series |
| Title | System characterization report on Vision-1 |
| Series title | Open-File Report |
| Series number | 2021-1030 |
| Chapter | Q |
| DOI | 10.3133/ofr20211030Q |
| Publication Date | November 25, 2024 |
| Year Published | 2024 |
| Language | English |
| Publisher | U.S. Geological Survey |
| Publisher location | Reston, VA |
| Contributing office(s) | Earth Resources Observation and Science (EROS) Center |
| Description | iv, 14 p. |
| Online Only (Y/N) | Y |
| Additional Online Files (Y/N) | N |


