

System Characterization Report on Resourcesat-2A Linear Imaging Self Scanning-3 Sensor
Links
- Document: Report (3.2 MB pdf) , HTML , XML
- Larger Work: This publication is Chapter T of System characterization of Earth observation sensors
- Download citation as: RIS | Dublin Core
Executive Summary
This report addresses system characterization of the Indian Space Research Organisation Resourcesat-2A Linear Imaging Self Scanning-3 sensor (Indian Space Research Organisation, 2023) and is part of a series of system characterization reports produced and delivered by the U.S. Geological Survey Earth Resources Observation and Science Cal/Val Center of Excellence (U.S. Geological Survey, 2021) since 2021. These reports present and detail the methodology and procedures for characterization, present technical and operational information about the specific sensing system being evaluated, and provide a summary of test measurements, data retention practices, data analysis results, and conclusions.
Resourcesat-2A is identical to Resourcesat-2 and was launched in 2016 on the Polar Satellite Launch Vehicle-C36 for continuity of data and improved temporal resolution. The Resourcesat-2 platform (which includes Resourcesat-2A) is of Indian Remote Sensing Satellites-1C/1D–P3 heritage and was built by the Indian Space Research Organisation. Resourcesat-2 and Resourcesat-2A carry the Linear Imaging Self Scanning-3 and Linear Imaging Self Scanning-4 sensors for medium-resolution imaging. More information on Indian Space Research Organisation satellites and sensors is available in the “2022 Joint Agency Commercial Imagery Evaluation—Remote Sensing Satellite Compendium” (Ramaseri Chandra and others, 2022) and from the manufacturer at https://www.isro.gov.in/.
The Earth Resources Observation and Science Cal/Val Center of Excellence system characterization team completed data analyses to characterize the geometric (interior and exterior), radiometric, and spatial performances.
To summarize the results, we have determined that this sensor provides an interior geometric performance with mean offsets in the range of 1.75 meters (m; 0.06 pixel) to 6.83 m (0.23 pixel) in easting and −1.83 m (−0.06 pixel) to 1.81 m (0.06 pixel) in northing in band-to-band registration and a root mean square error in the range of 3.81 m (0.13 pixel) to 8.19 m (0.27 pixel) in easting and 2.21 m (0.09 pixel) to 4.72 m (0.16 pixel) in northing.
We have measured an exterior geometric error offset in the range of −21.29 to 6.88 m in easting and −7.35 to −2.63 m in northing, and the root mean square error is in the range of 7.19 to 21.43 m in easting and 3.64 to 8.19 m in northing in comparison to the Landsat 8 Operational Land Imager (Earth Resources Observation and Science Center, 2020).
The measured radiometric performance was in the range of −0.002 to 0.031 in offset and 0.701 to 0.940 in slope, and the spatial performance was in the range of 1.204 to 1.265 pixels for full width at half maximum with a modulation transfer function at a Nyquist frequency in the range of 0.251 to 0.277.
References Cited
Earth Resources Observation and Science Center, 2020, Landsat 8–9 Operational Land Imager/Thermal Infrared Sensor Level-1, Collection 2: U.S. Geological Survey digital data, accessed April 16, 2025, at https://doi.org/10.5066/P975CC9B.
Indian Space Research Organisation, 2023, Resourcesat-2A: Indian Space Research Organisation web page, accessed August 30, 2024, at https://www.isro.gov.in/RESOURCESAT_2A.html.
Ramaseri Chandra, S.N., Christopherson, J.B., Casey, K.A., Lawson, J., and Sampath, A., 2022, 2022 Joint Agency Commercial Imagery Evaluation—Remote sensing satellite compendium: U.S. Geological Survey Circular 1500, 279 p. [Also available at https://doi.org/10.3133/cir1500.] [Supersedes USGS Circular 1468.]
U.S. Geological Survey, 2021, EROS CalVal Center of Excellence (ECCOE): U.S. Geological Survey web page, accessed June 2021 at https://www.usgs.gov/core-science-systems/eros/calval.
Introduction
This report addresses system characterization of the Indian Space Research Organisation Resourcesat-2A Linear Imaging Self Scanning-3 (LISS–3) sensor (Indian Space Research Organisation, 2023) and is part of a series of system characterization reports produced and delivered by the U.S. Geological Survey (USGS) Earth Resources Observation and Science (EROS) Cal/Val Center of Excellence (ECCOE; U.S. Geological Survey, 2021a) since 2021. These reports present and detail the methodology and procedures for characterization, present technical and operational information about the specific sensing system being evaluated, and provide a summary of test measurements, data retention practices, data analysis results, and conclusions.
Resourcesat-2A is identical to Resourcesat-2 and was launched in 2016 on the Polar Satellite Launch Vehicle-C36 for continuity of data and improved temporal resolution. The Resourcesat-2 platform (which includes Resourcesat-2A) is of Indian Remote Sensing Satellites-1C/1D–P3 heritage and was built by the Indian Space Research Organisation. Resourcesat-2 and Resourcesat-2A carry the Linear Imaging Self Scanning-3 and Linear Imaging Self Scanning-4 sensors for medium-resolution imaging. More information on Indian Space Research Organisation satellites and sensors is available in the “2022 Joint Agency Commercial Imagery Evaluation—Remote Sensing Satellite Compendium” (Ramaseri Chandra and others, 2022) and from the manufacturer at https://www.isro.gov.in/.
The Resourcesat-2A LISS–3 sensor is a wide-angle medium-resolution camera consisting of four bands: green, red, near infrared, and shortwave infrared (Indian Space Research Organisation, 2023). The camera has a swath width of 141 kilometers, which enables LISS–3 to provide a 24-day repeat capability. Resourcesat-2A was launched in 2016. The primary objectives for data acquired by LISS–3 include vegetation and crop monitoring, forest mapping, land cover/land use mapping, change detection, and regional resource assessment.
The data analysis results provided in this report have been derived from approved Joint Agency Commercial Imagery Evaluation (JACIE) processes and procedures. JACIE was formed to leverage resources from several Federal agencies for the characterization of remote sensing data and to share those results across the remote sensing community. More information about JACIE is available at U.S. Geological Survey (2021b).
Purpose and Scope
The purpose of this report is to describe the specific sensor or sensing system, test its performance in three categories, complete related data analyses to quantify these performances, and report the results in a standardized document. In this chapter, the LISS–3 sensor is described. The performance of the system is limited to geometric, radiometric, and spatial analyses. The scope of the geometric assessment is limited to testing the interior alignments of spectral bands against each other and testing the exterior alignment in reference to the Landsat 8 Operational Land Imager (OLI; Earth Resources Observation and Science Center, 2020; U.S. Geological Survey, 2021c).
The ECCOE project (U.S. Geological Survey, 2021a), and the associated system characterization process used for this assessment, follows the USGS Fundamental Science Practices, which include maintaining data, information, and documentation needed to reproduce and validate the scientific analysis documented in this report. Additional information and guidance about Fundamental Science Practices and related resource information of interest to the public are available at https://www.usgs.gov/office-of-science-quality-and-integrity/fundamental-science-practices. For additional information related to the report, please contact ECCOE at eccoe@usgs.gov.
System Description
This section describes the satellite and operational details for Resourcesat-2A and provides information about the LISS–3 sensor.
Satellite and Operational Details
The satellite and operational details of Resourcesat-2A and information about the LISS–3 sensor are listed in table 1.
Table 1.
Satellite and operational details for Resourcesat-2A Linear Imaging Self Scanning-3 sensor (Indian Space Research Organisation, 2023).[kg, kilogram; NIR, near infrared; SWIR, shortwave infrared; W, watt; AH, amp hour; Ni-Cd, nickel-cadmium; Mbps, megabit per second; ~, about; km, kilometer; °, degree; min, minute; ±, plus or minus; lat., latitude; NA, not applicable; m, meter]
| Product information | Resourcesat-2A Linear Imaging Self Scanning-3 data |
|---|---|
| Product name | Level 1T |
| Satellite name | Resourcesat-2A |
| Sensor name(s) | Linear Imaging Self Scanning-3 |
| Lift-off mass | 1,235 kg |
| Instrument mass | 106 kg |
| Sensor type | Multispectral, visible, and infrared (green, red, NIR, SWIR) |
| Scanning technique | Pushbroom; 6,000 detectors array |
| Power | Solar array generating 1,250 W at end of life; two 24 AH Ni-Cd batteries |
| Data rate | 52.5 Mbps |
| Mission type | Global land-monitoring mission |
| Launch date | December 7, 2016 |
| Number of satellites | 1 |
| Expected lifetime | ~5 years |
| Operator | Indian Space Research Organisation |
| Operating orbit | Circular polar Sun synchronous |
| Orbital altitude range | 817 km |
| Sensor angle altitude | 98.7° inclination |
| Altitude and orbit control | Three-axis body stabilized using reaction wheels, magnetic torquers, and hydrazine thrusters |
| Orbit period | 101.35 min |
| Imaging time | 10:30 descending node |
| Geographic coverage | Land imaging ±81.3° lat. |
| Temporal resolution | 24 days |
| Temporal coverage | 2016 to present (2025) |
| Imaging angles | NA |
| Ground sample distance(s) | 23.5 m |
| Data licensing | NA |
| Data pricing | NA |
| Product abstract | Resourcesat-2A (https://www.isro.gov.in/) |
| Product locator | NA |
Sensor Information
The spectral characteristics and the relative spectral response of the LISS–3 sensor are listed in table 2 and shown in figure 1, respectively.
Table 2.
Imaging sensor details for Resourcesat-2A Linear Imaging Self Scanning-3 sensor (Indian Space Research Organisation, 2023).[The Resourcesat-2A Linear Imaging Self Scanning-3 (LISS–3) sensor has a swath width of 140 kilometers; μm, micrometer; m, meter; NIR, near infrared; SWIR, shortwave infrared]
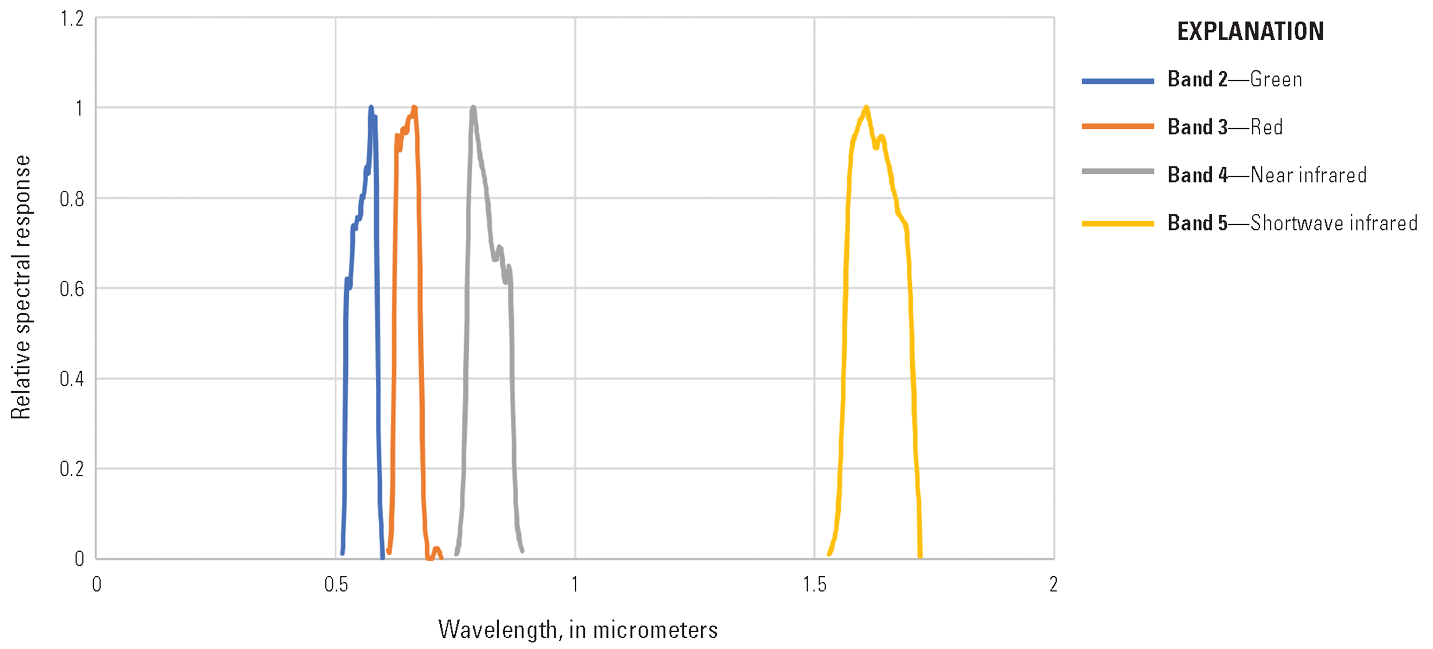
Graph showing Resourcesat-2A Linear Imaging Self Scanning-3 sensor relative spectral response (Indian Space Research Organisation, 2023).
Procedures
ECCOE has established standard processes to identify Earth observing systems of interest and to assess the geometric, radiometric, and spatial qualities of data products from these systems.
The assessment steps are as follows:
-
• system identification and investigation to learn the general specifications of the satellite and its sensor(s);
-
• data receipt and initial inspection to understand the characteristics and any overt flaws in the data product so that it may be further analyzed;
-
• geometry characterization, including interior geometric orientation measuring the relative alignment of spectral bands and exterior geometric orientation measuring how well the georeferenced pixels within the image are aligned to a known reference;
-
• radiometry characterization, including assessing how well the data product correlates with a known reference and, when possible, assessing the signal-to-noise ratio; and
-
• spatial characterization, assessing the two-dimensional fidelity of the image pixels to their projected ground sample distance (GSD).
Measurements
The observed USGS measurements are listed in table 3. The mean of interior (band-to-band) and exterior (image-to-image) mean errors and root mean square error (RMSE) values are listed in meters (pixels). These values are derived from tables 4, 5, 6, and 7 and are summarized here. The interior and exterior geometry and the radiometric values are the averages of three datasets used for (geometric and radiometric) analyses. Details about the methodologies used are outlined in the “Analysis” section.
Table 3.
U.S. Geological Survey measurement results.[RMSE, root mean square error; m, meter; NIR, near infrared; SWIR, shortwave infrared; LISS–3, Linear Imaging Self Scanning-3; L8 OLI, Landsat 8 Operational Land Imager; FWHM, full width at half maximum; MTF, modulation transfer function]
Table 4.
Band-to-band registration error of Resourcesat-2A Linear Imaging Self Scanning-3 sensor (Indian Space Research Organisation, 2023) relative to Landsat 8 Operational Land Imager (Earth Resources Observation and Science Center, 2020) in pixels at a 30-meter ground sample distance.[ID, identifier; RMSE, root mean square error]
Table 5.
Geometric error of the Resourcesat-2A Linear Imaging Self Scanning-3 sensor (Indian Space Research Organisation, 2023) relative to the Landsat 8 Operational Land Imager sensor (Earth Resources Observation and Science Center, 2020).[ID, identifier; RMSE, root mean square error]
Table 6.
Top of Atmosphere reflectance comparison of the Resourcesat-2A Linear Imaging Self Scanning-3 sensor (Indian Space Research Organisation, 2023) against the Landsat 8 Operational Land Imager sensor (Earth Resources Observation and Science Center, 2020).[ID, identifier; B, band; %, percent; R2, coefficient of determination]
Table 7.
Radiometric analyses by estimating spectral band adjustment factors between Landsats 8 and 9 Operational Land Imager sensor (Earth Resources Observation and Science Center, 2020) and the Resourcesat-2A Linear Imaging Self Scanning-3 sensor (LISS–3; Indian Space Research Organisation, 2023) using Radiometric Calibration Network (RadCalNet; Bouvet and others, 2019) data over Railroad Valley playa and Hyperion-1 (Pearlman and others, 2001) data over Libya1 and Algeria 5.[ID, identifier; NIR, near infrared; OLI, Operational Land Imager]
Analysis
This section describes the geometric, radiometric, and spatial performance of LISS–3.
Geometric Performance
The geometric performance for LISS–3 is characterized in terms of the interior (band-to-band alignment) and exterior (geometric location accuracy) geometric analysis results.
Interior (Band to Band)
The band-to-band alignment analysis was completed using the methods described in Cantrell and Christopherson (2024) on three separate images. Band combinations were registered against each other to determine the mean error and RMSE, as listed in table 4 with results represented in pixels at a 30-meter (m) GSD (the LISS–3 image was resampled to 30 m). An example of error histograms analyzed (scene identifier 239356411_R2A_L3__27-MAY-2023_100_061_GEOREF) is shown in figures 2, 3, and 4. The band-to-band alignment error within the image is indicated by the histogram and the error distribution. Together, the interior and exterior geometric analysis results, as reported in the “Interior (Band to Band)” and “Exterior (Geometric Location Accuracy)” sections, provide a comprehensive assessment of geometric accuracy.
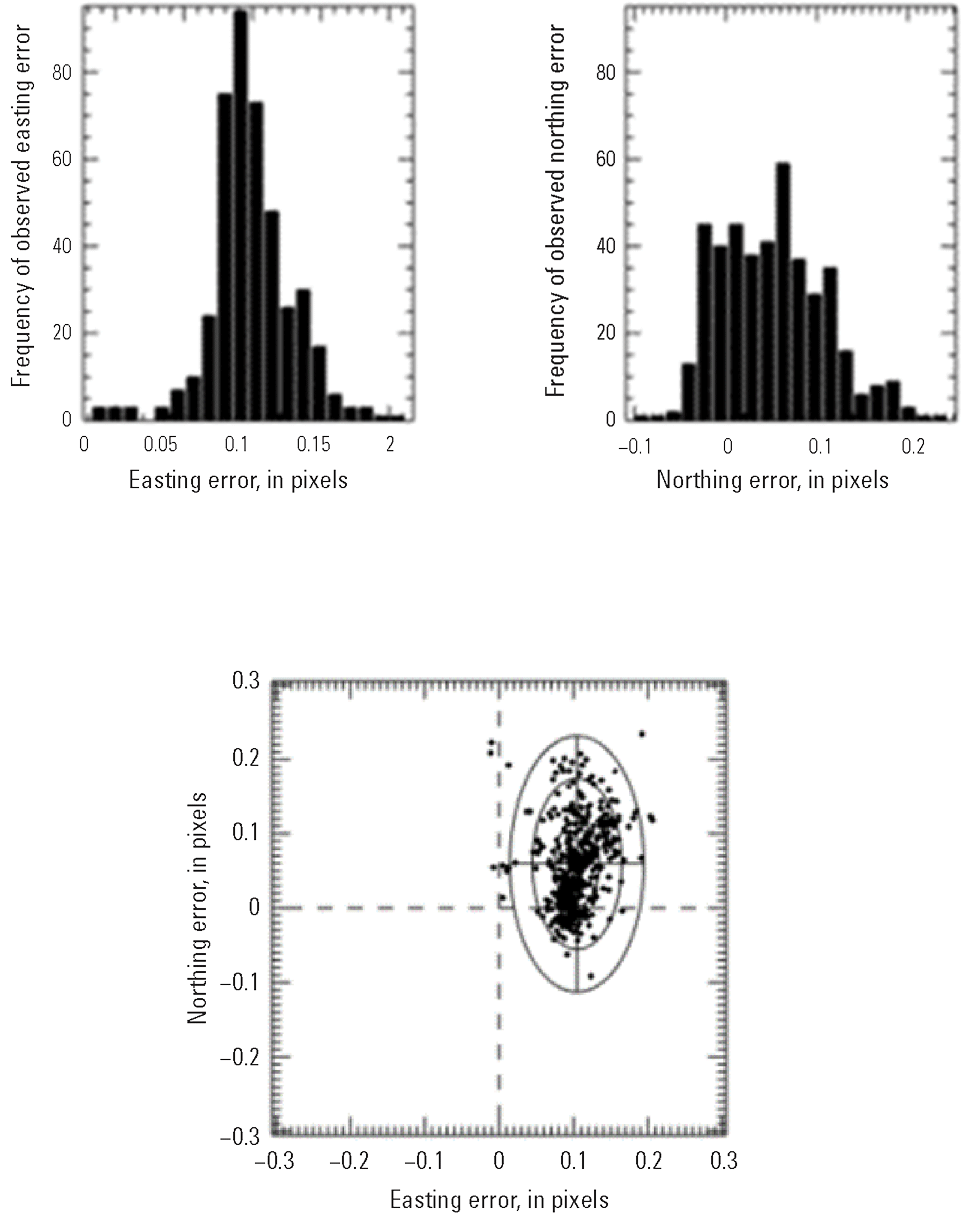
Band 2 (green) to band 3 (red) geometric error histogram (upper) and error distribution (lower) (scene identifier 239356411_R2A_L3__27-MAY-2023_100_061_GEOREF).
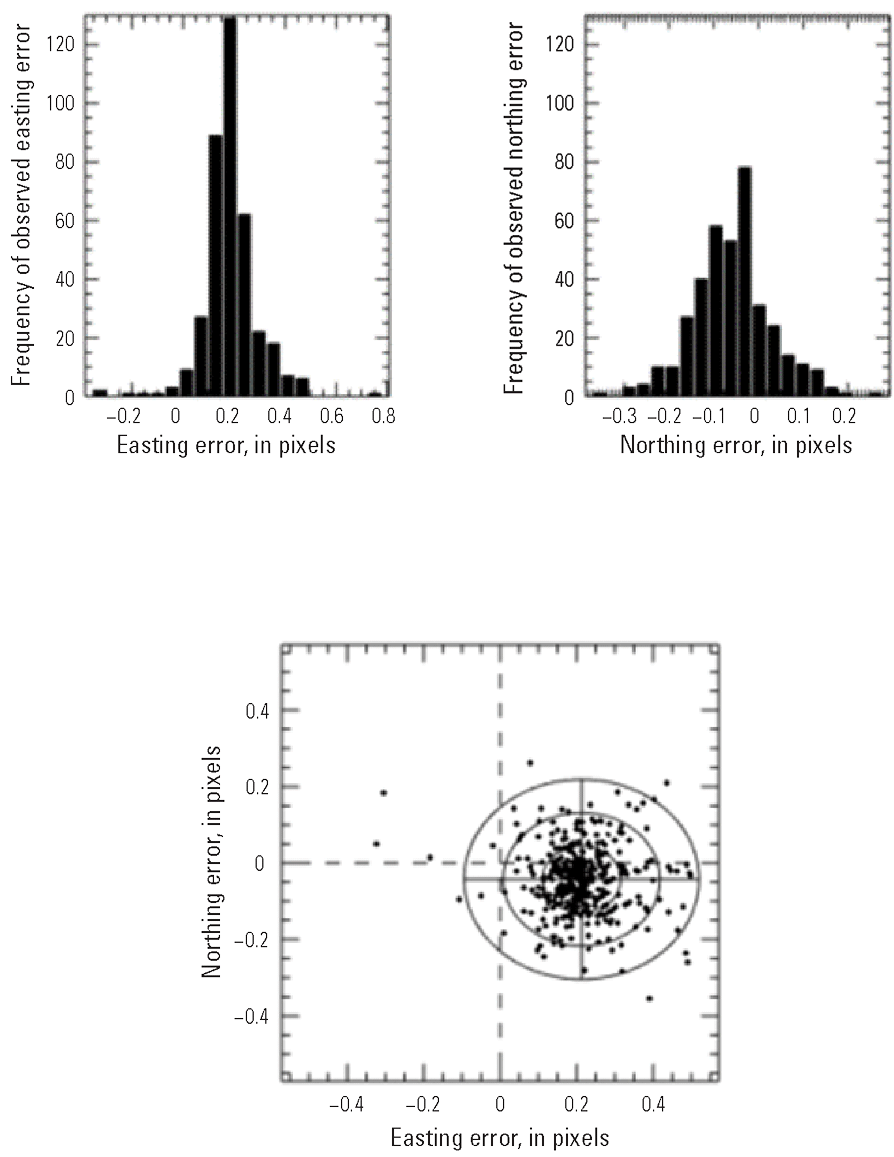
Band 3 (green) to band 4 (near infrared) geometric error histogram (upper) and error distribution (lower) (scene identifier 239356411_R2A_L3__27-MAY-2023_100_061_GEOREF).
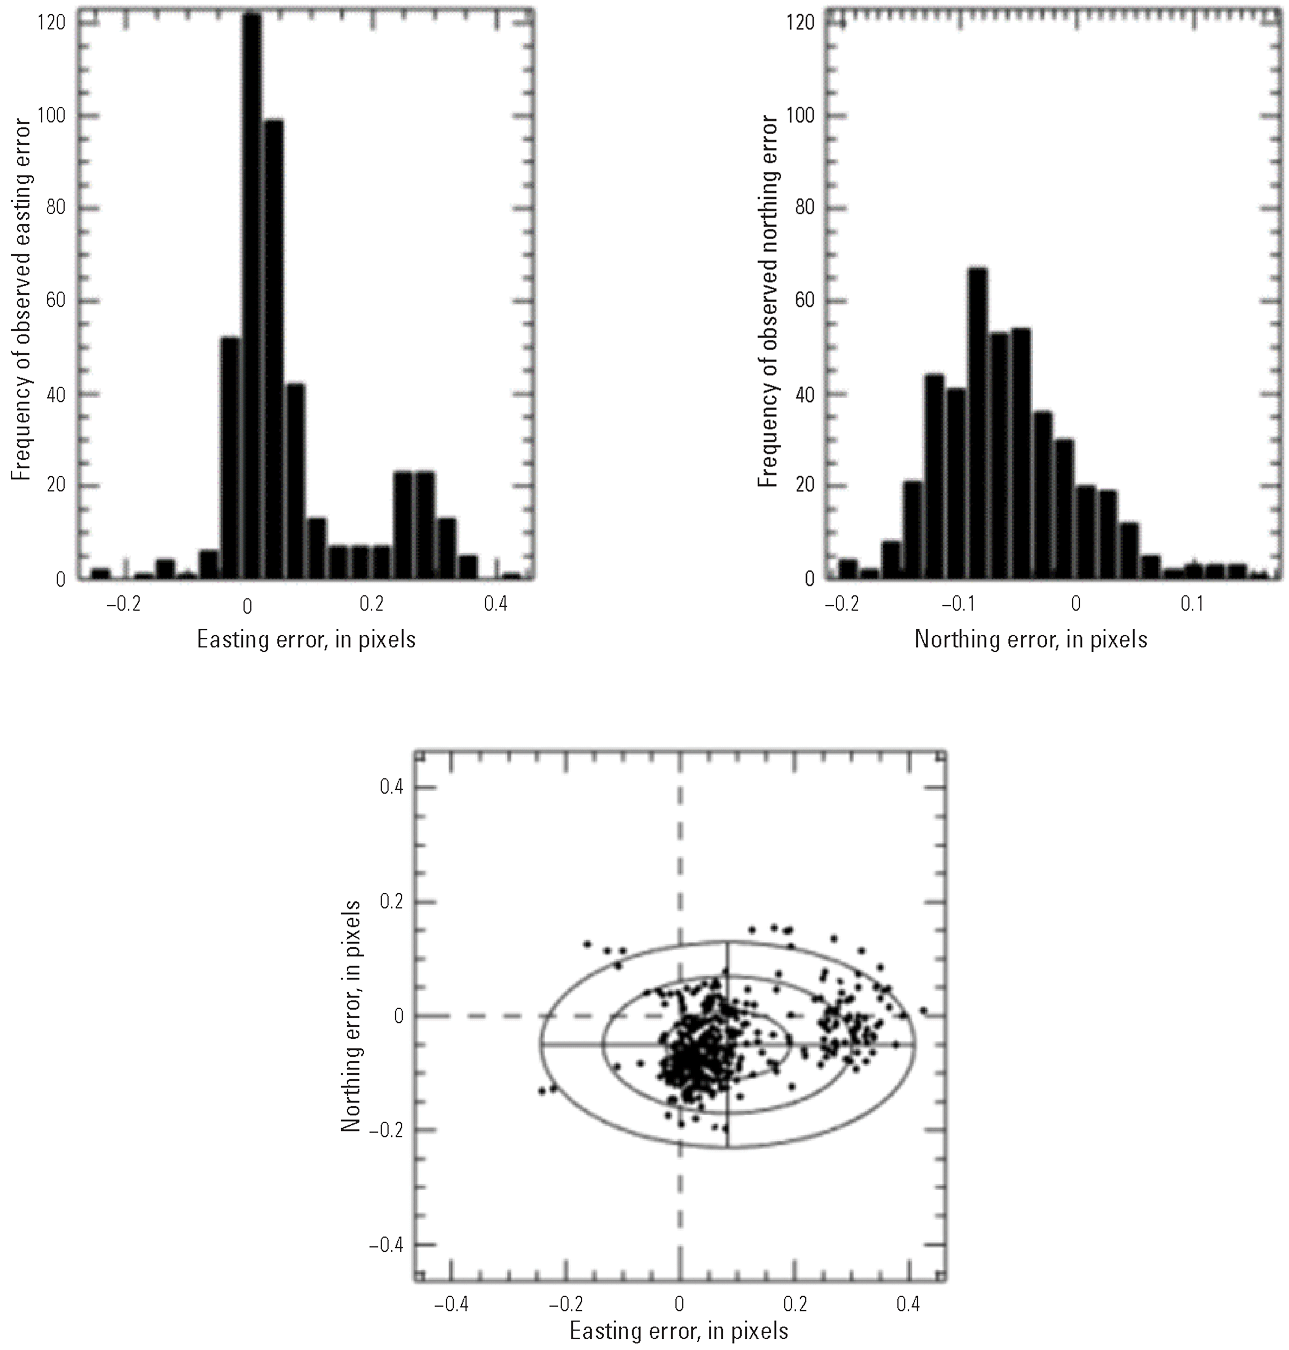
Band 3 (green) to band 5 (shortwave infrared) geometric error histogram (upper) and error distribution (lower) (scene identifier 239356411_R2A_L3__27-MAY-2023_100_061_GEOREF).
Exterior (Geometric Location Accuracy)
For this analysis, band 2 (green) of the LISS–3 data was compared against the corresponding band from the Landsat 8 OLI image over two near-coincident images using the methods described in Cantrell and Christopherson (2024). Conjugate points in the reference and search images were identified automatically and refined using similarity measures such as normalized cross-correlation metrics, and the mean error and RMSE results are listed in table 5 with results represented in meters at a 30-m GSD (OLI and LISS–3 images were resampled to 30 m). A geometric error map showing the directional shift and relative magnitude of the shift, when compared with Landsat 8 OLI, is shown in figure 5, and the corresponding histogram and error distribution are provided in figure 6 (for scene identifier 239356411_R2A_L3__27-MAY-2023_100_061_GEOREF).
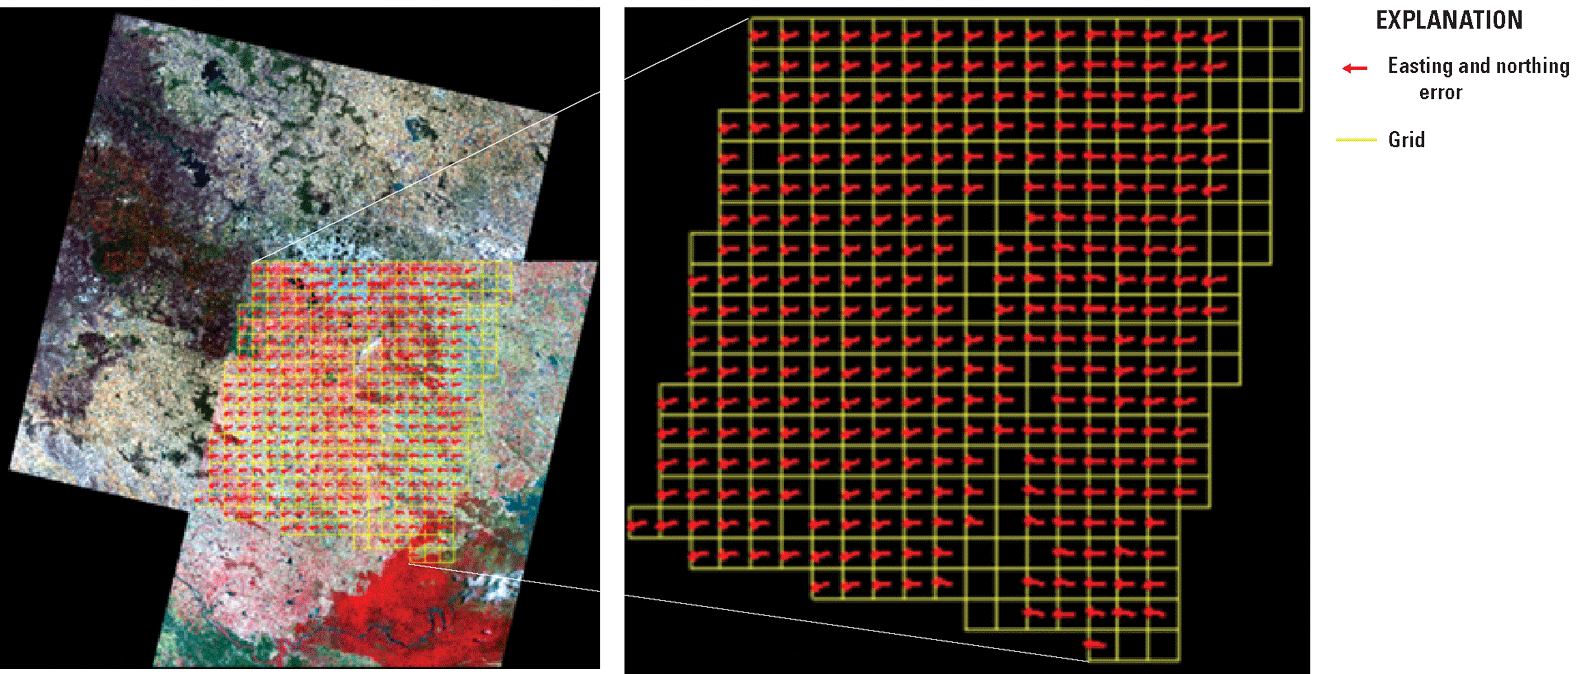
Images showing geometric error comparison for the Landsat 8 Operational Land Imager (Earth Resources Observation and Science Center, 2020) and Resourcesat-2A Linear Imaging Self Scanning-3 sensors (scene identifier 239329911_R2A_AW__11-NOV-2023_100_063_GEOREF; Indian Space Research Organisation, 2023).
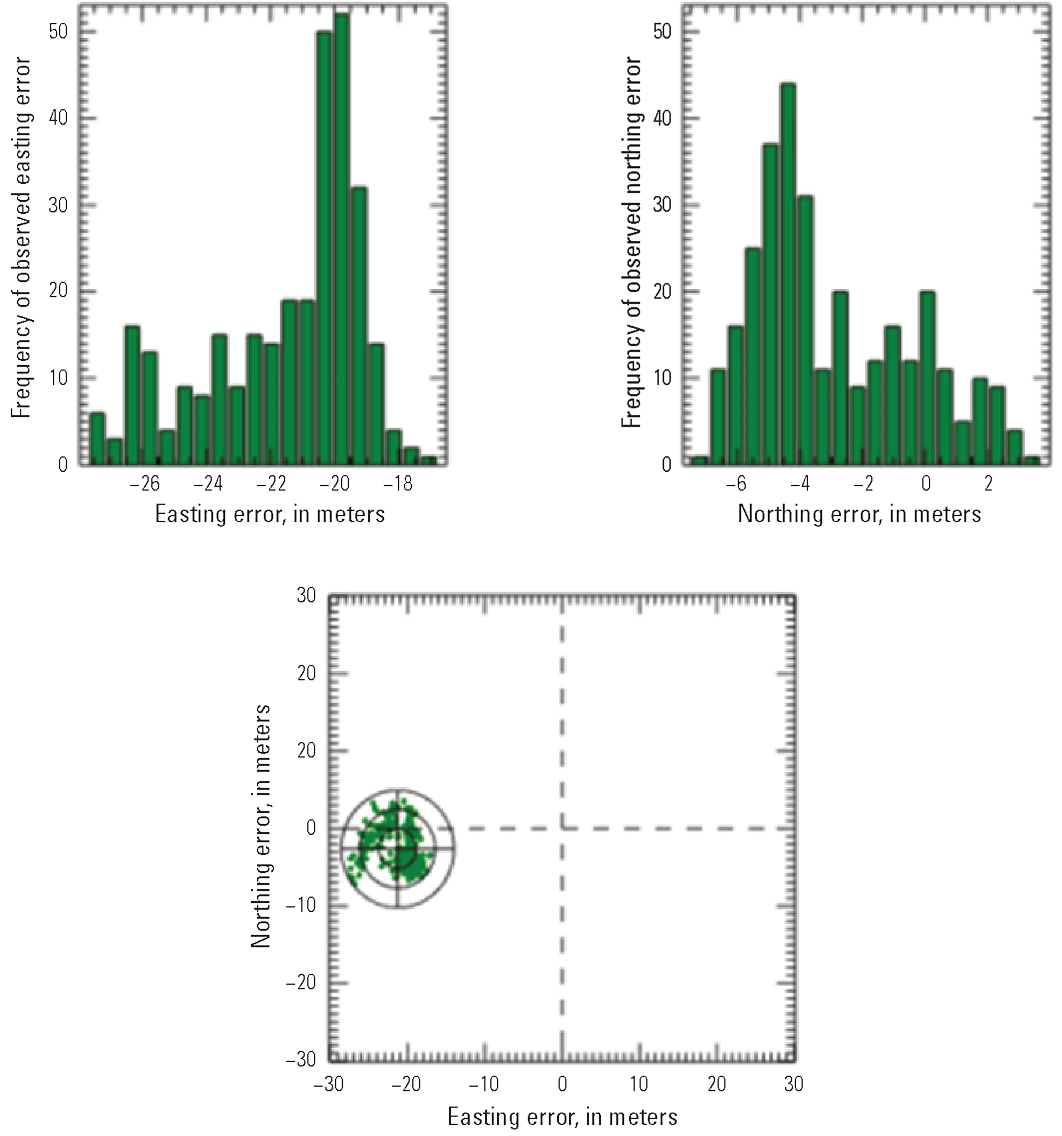
Geometric error histogram (upper) and error distribution (lower) (scene identifier 239329911_R2A_AW__11-NOV-2023_100_063_GEOREF; Indian Space Research Organisation, 2023).
Radiometric Performance
For this analysis, cloud-free regions of interest were analyzed within three LISS–3 and Landsat 8 OLI scene pairs. Raw digital number-to-radiance conversion coefficients were obtained from the Indian Space Research Organisation. The graphs in figure 7 show the reference sensor on the x-axis and the comparison sensor on the y-axis. The linear regression thus represents Top of Atmosphere (TOA) reflectance relative to that of the reference sensor. Ideally, the slope should be near unity and the offset should be near zero. For instance, if the slope is greater than unity, that means the comparison sensor tends to overestimate TOA reflectance compared to the reference sensor.
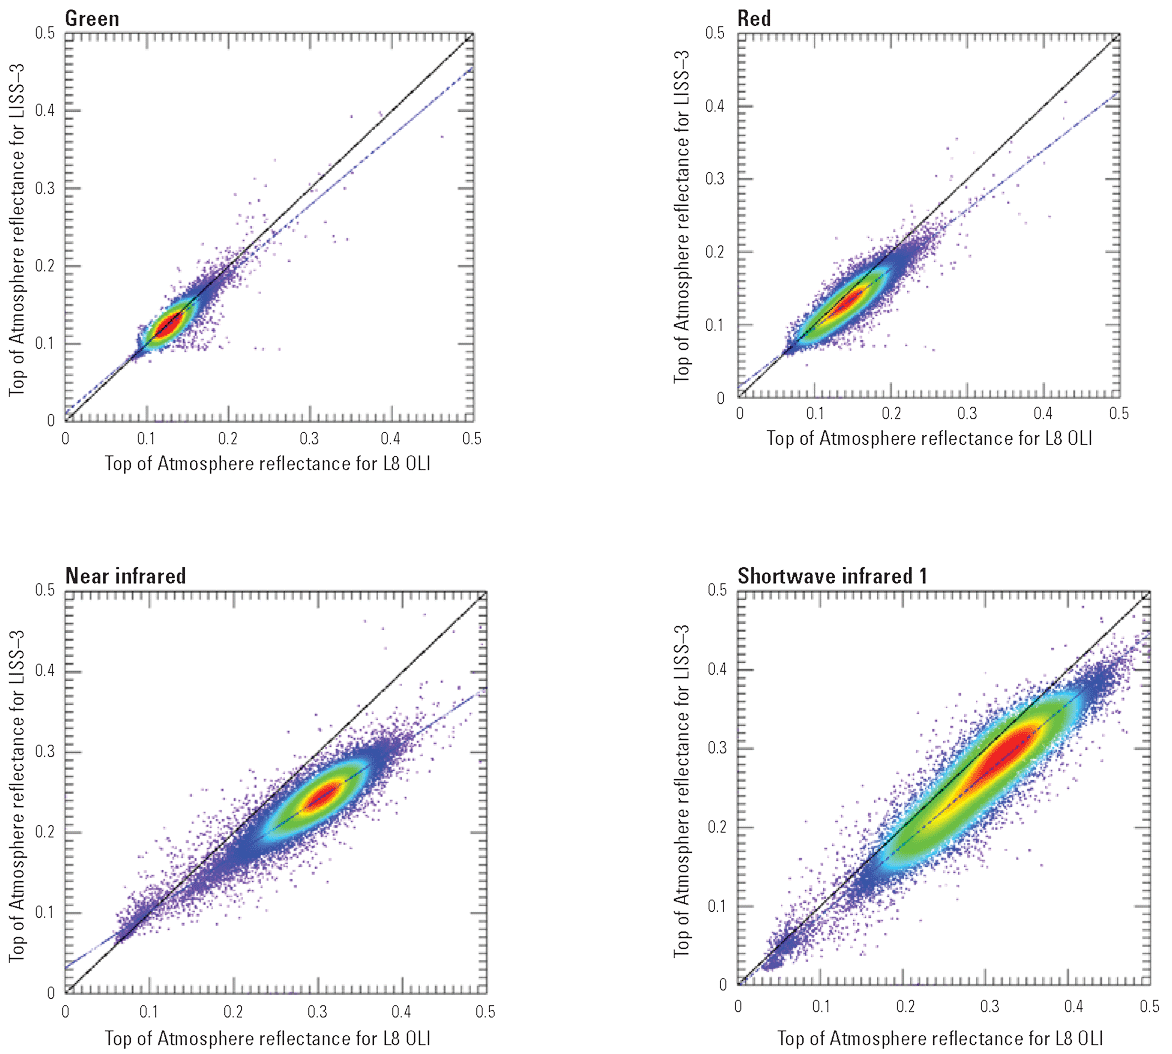
Graphs showing Top of Atmosphere reflectance comparison for the Landsat 8 Operational Land Imager (L8 OLI; Earth Resources Observation and Science Center, 2020) and Resourcesat-2A Linear Imaging Self Scanning-3 (LISS–3; Indian Space Research Organisation, 2023) sensors.
TOA reflectance comparison results are listed in table 6. A band-by-band graphical comparison between the LISS–3 image (scene identifier 239356411_R2A_L3__27-MAY-2023_100_061_GEOREF versus LC08_L1TP_144048_20230527_20230603_02_T1 of Landsat), when compared against the corresponding Landsat 8 OLI band is shown in figure 8.
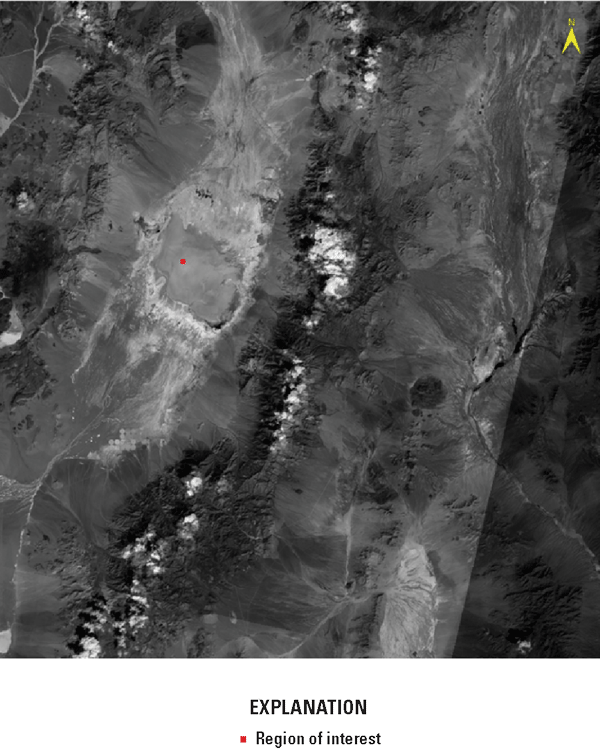
Image showing Linear Imaging Self Scanning-3 footprint over Railroad Valley playa, Nevada.
The LISS–3 radiometric quality is also assessed by comparing it with Radiometric Calibration Network (RadCalNet) coincident measurements. RadCalNet provides automated TOA reflectance, which has been used to calibrate and validate optical satellite sensors. LISS–3 is also compared with the coincident Landsat 9 OLI measurement (Earth Resources Observation and Science Center, 2020) over the RadCalNet site Railroad Valley playa, Nevada. LISS–3 and Landsat 9 OLI TOA reflectance were extracted using a 700-m x 700-m region of interest over Railroad Valley playa.
TOA reflectance comparisons among LISS–3, RadCalNet, and Landsat 9 are shown in figure 9A and B. The comparison was completed using two coincident measurements from July 29, 2023 (fig. 9A), and September 15, 2023 (fig. 9B). For radiometric comparison, RadCalNet hyperspectral TOA reflectance is used to simulate LISS–3 TOA reflectance using the LISS–3 relative spectral response. In figure 9A and B, the blue symbols represent the TOA reflectance ratio between LISS–3 and RadCalNet, whereas the green symbols represent TOA reflectance ratio between LISS–3 and Landsat 9 OLI observations. The comparison between LISS–3 and Landsat 9 OLI from July 29, 2023, is shown in figure 9A. It shows LISS–3 agrees with RadCalNet and Landsat 9 OLI within about (~) 13 percent and ~10 percent (as seen in the difference in the Y-coordinate of the green and the blue dots for the bands in the figure), respectively. In figure 9B, LISS–3 agrees with RadCalNet within ~8 percent across all the bands, whereas it agrees with Landsat 9 OLI within ~11 percent across all the bands.
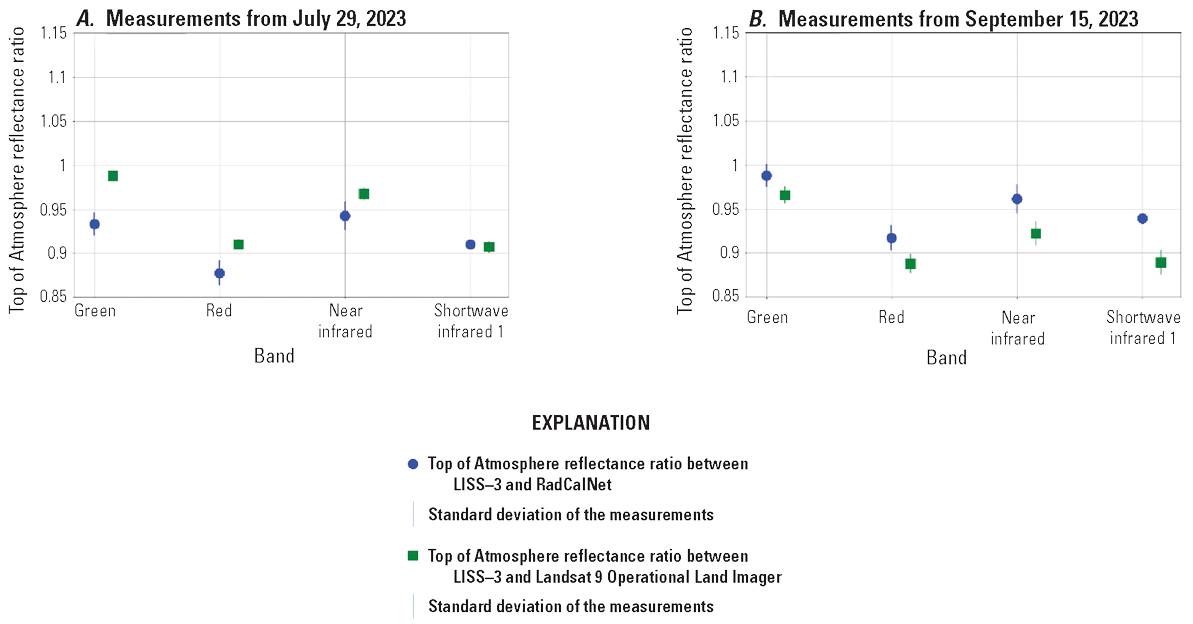
Graphs showing Linear Imaging Self Scanning-3 (LISS–3; Indian Space Research Organisation, 2023) comparison with Radiometric Calibration Network (RadCalNet; Bouvet and others, 2019) and Landsat 9 (Earth Resources Observation and Science Center, 2020) on (A) July 29, 2023, and (B) September 15, 2023.
The LISS–3 radiometric assessment is also completed by comparing LISS–3 with Landsats 8 and 9 OLI using pseudoinvariant calibration sites (PICS). TOA reflectance for LISS–3, Landsat, and Hyperion (Pearlman and others, 2001) was calculated using a common region of interest as shown in figure 10. The spectral difference between the LISS–3 and Hyperion sensors is compensated by calculating the spectral band adjustment factor for LISS–3 using Hyperion hyperspectral data.
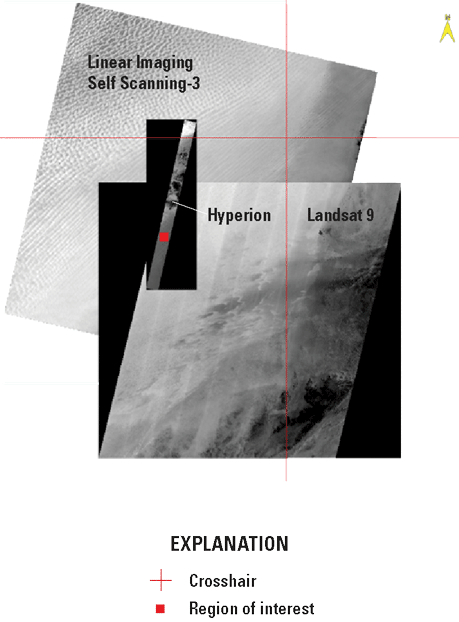
Images showing Linear Imaging Self Scanning-3 (Indian Space Research Organisation, 2023), Landsat 9 (Earth Resources Observation and Science Center, 2020), and Hyperion footprint (Pearlman and others, 2001) over Libya 1 (in the Sahara Desert in Libya).
The comparisons between LISS–3 and Landsat using PICS are shown in figure 11A and B. The mean TOA reflectance ratio between LISS–3 and Landsats 8 and 9 OLI is shown in figure 11A. LISS–3 agrees with Landsat within ~3 percent in green, near-infrared, and shortwave-infrared 1 bands but within ~10 percent in red bands. The TOA reflectance ratio using individual PICS is shown in figure 11B. The TOA reflectance ratio from Libya 1 (in the Sahara Desert in Libya) and Algeria 5 (in the Grand Erg Occidental in Algeria) shows similar agreement between sensors for green, near-infrared, and shortwave-infrared 1 bands. For the red band, the reflectance ratio from Algeria 5 and Libya 1 is within ~7 percent and ~10 percent, respectively.
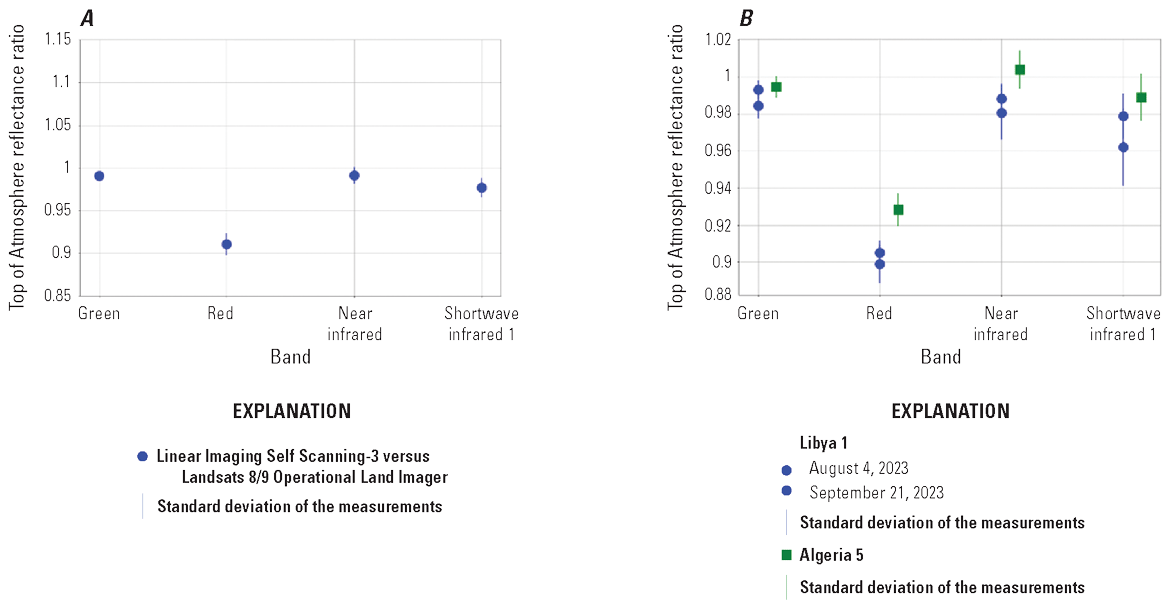
Graphs showing Linear Imaging Self Scanning-3 (LISS–3; Indian Space Research Organisation, 2023) comparison with Landsat (Earth Resources Observation and Science Center, 2020) using pseudoinvariant calibration sites for (A) mean Top of Atmosphere reflectance ratio between LISS–3 and Landsats 8/9 Operational Land Imager and (B) individual reflectance ratio from Libya 1 (in the Sahara Desert in Libya) and Algeria 5 (in the Grand Erg Occidental in Algeria) scenes.
The results of the analyses are summarized in table 7. The spectral band adjustment factor should be interpreted such that a factor of 1 indicates a perfect alignment of spectral bands and calibration between Landsat and LISS–3.
Spatial Performance
For this analysis, edge spread and line spread functions were calculated using the automated methods that extract natural edges found in rural areas with uniform surfaces on either side of the edges. The resulting relative edge response, full width at half maximum, and modulation transfer function at Nyquist frequency (Cantrell and Christopherson, 2024) are listed in table 8. The areas selected are farmlands over Germany (scene identifiers 239330621_R2A_L3__09-SEP-2023_025_032_GEOREF and 239330631_R2A_L3__10-JUN-2023_026_032_GEOREF).
Table 8.
Spatial performance of the Resourcesat-2A Linear Imaging Self Scanning-3 sensor (Indian Space Research Organisation, 2023).[RER, relative edge response; FWHM, full width at half maximum; MTF, modulation transfer function; NIR, near infrared; SWIR, shortwave infrared]
Summary and Conclusions
This report summarizes the sensor performance of the Resourcesat-2A Linear Imaging Self Scanning-3 (LISS–3) sensor system based on the U.S. Geological Survey Earth Resources Observation and Science Cal/Val Center of Excellence (ECCOE) system characterization process.
In summary, we have determined that this sensor provides an interior geometric performance with mean offsets in the range of 1.75 meters (m; 0.06 pixel) to 6.83 m (0.23 pixel) in easting and −1.83 m (−0.06 pixel) to 1.81 m (0.06 pixel) in northing in band-to-band registration and a root mean square error in the range of 3.81 m (0.13 pixel) to 8.19 m (0.27 pixel) in easting and 2.21 m (0.09 pixel) to 4.72 m (0.16 pixel) in northing.
We have measured an exterior geometric error offset in the range of −21.29 to 6.88 m in easting and −7.35 to 2.63 m in northing, and the root mean square error is in the range of 7.19 to 21.43 m in easting and 3.64 to 8.19 m in northing in comparison to the Landsat 8 Operational Land Imager.
The measured radiometric performance was in the range of −0.002 to 0.031 in offset and 0.701 to 0.940 in slope, and the spatial performance was in the range of 1.204 to 1.265 pixels for full width at half maximum with a modulation transfer function at a Nyquist frequency in the range of 0.251 to 0.277.
In conclusion, the team has completed an ECCOE standardized system characterization of the LISS–3 sensing system. Although the team followed characterization procedures that are standardized across the many sensors and sensing systems under evaluation, these procedures are customized to fit the individual sensor as was done with LISS–3. The team acquired the data, defined proper testing methodologies, carried out comparative tests against specific references, recorded measurements, completed data analyses, and quantified sensor performance accordingly. The team also retained all data, measurements, and methods to ensure that all data and measurements are archived and accessible and that the performance results are reproducible.
The ECCOE project and associated Joint Agency Commercial Imagery Evaluation partners are always interested in reviewing sensor and remote sensing application assessments and would like to review and discuss information on similar data and product assessments and reviews. If you would like to discuss system characterization with the U.S. Geological Survey ECCOE and (or) the Joint Agency Commercial Imagery Evaluation team, please email us at eccoe@usgs.gov.
References Cited
Bouvet, M., Thome, K., Berthelot, B., Bialek, A., Czapla-Myers, J., Fox, N.P., Goryl, P., Henry, P., Ma, L., Marcq, S., Meygret, A., Wenny, B.N., and Woolliams, E.R., 2019, RadCalNet—A radiometric calibration network for Earth observing imagers operating in the visible to shortwave infrared spectral range: Remote Sensing (Basel), v. 11, no. 20, 24 p., accessed March 11, 2025, at https://doi.org/10.3390/rs11202401.
Cantrell, S.J., and Christopherson, J.B., 2024, Joint Agency Commercial Imagery Evaluation (JACIE) best practices for remote sensing system evaluation and reporting: U.S. Geological Survey Open-File Report 2024–1023, 26 p., accessed April 16, 2025, at https://doi.org/10.3133/ofr20241023.
Earth Resources Observation and Science Center, 2020, Landsat 8–9 Operational Land Imager/Thermal Infrared Sensor Level-1, Collection 2: U.S. Geological Survey digital data, accessed April 16, 2025, at https://doi.org/10.5066/P975CC9B.
Indian Space Research Organisation, 2023, Resourcesat-2A: Indian Space Research Organisation web page, accessed August 30, 2024, at https://www.isro.gov.in/RESOURCESAT_2A.html.
Pearlman, J., Carman, S., Segal, C., Jarecke, P., Barry, P., and Browne, W., 2001, Overview of the Hyperion imaging spectrometer for the NASA EO-1 mission, in Proceedings of the International Geoscience and Remote Sensing Symposium 2001—Scanning the present and resolving the future: IEEE 2001, v. 7, p. 3036–3038. [Also available at https://doi.org/10.1109/IGARSS.2001.978246.]
Ramaseri Chandra, S.N., Christopherson, J.B., Casey, K.A., Lawson, J., and Sampath, A., 2022, 2022 Joint Agency Commercial Imagery Evaluation—Remote sensing satellite compendium: U.S. Geological Survey Circular 1500, 279 p. [Also available at https://doi.org/10.3133/cir1500.] [Supersedes USGS Circular 1468.]
U.S. Geological Survey, 2021a, EROS CalVal Center of Excellence (ECCOE): U.S. Geological Survey web page, accessed June 2021 at https://www.usgs.gov/core-science-systems/eros/calval.
U.S. Geological Survey, 2021b, EROS CalVal Center of Excellence (ECCOE)—JACIE: U.S. Geological Survey web page, accessed June 2021 at https://www.usgs.gov/calval/jacie?qt-science_support_page_related_con=3#qt-science_support_page_related_con.
U.S. Geological Survey, 2021c, Landsat missions—Glossary and acronyms: U.S. Geological Survey web page, accessed June 2021 at https://www.usgs.gov/core-science-systems/nli/landsat/glossary-and-acronyms.
Abbreviations
~
about
ECCOE
EROS Cal/Val Center of Excellence
EROS
Earth Resources Observation and Science
GSD
ground sample distance
JACIE
Joint Agency Commercial Imagery Evaluation
LISS–3
Linear Imaging Self Scanning-3
OLI
Operational Land Imager
PICS
pseudoinvariant calibration sites
RadCalNet
Radiometric Calibration Network
RMSE
root mean square error
TOA
Top of Atmosphere
USGS
U.S. Geological Survey
For more information about this publication, contact:
Director, USGS Earth Resources Observation and Science Center
47914 252nd Street
Sioux Falls, SD 57198
605–594–6151
For additional information, visit: https://www.usgs.gov/centers/eros
Publishing support provided by the
Rolla Publishing Service Center
Disclaimers
Any use of trade, firm, or product names is for descriptive purposes only and does not imply endorsement by the U.S. Government.
Although this information product, for the most part, is in the public domain, it also may contain copyrighted materials as noted in the text. Permission to reproduce copyrighted items must be secured from the copyright owner.
Suggested Citation
Park, S., Shrestha, M., Kim, M., Sampath, A., and Clauson, J., 2025, System characterization report on Resourcesat-2A Linear Imaging Self Scanning-3 sensor, chap. T of Ramaseri Chandra, S.N., comp., System characterization of Earth observation sensors: U.S. Geological Survey Open-File Report 2021–1030, 17 p., https://doi.org/10.3133/ofr20211030T.
ISSN: 2331-1258 (online)
| Publication type | Report |
|---|---|
| Publication Subtype | USGS Numbered Series |
| Title | System characterization report on Resourcesat-2A Linear Imaging Self Scanning-3 sensor |
| Series title | Open-File Report |
| Series number | 2021-1030 |
| Chapter | T |
| DOI | 10.3133/ofr20211030T |
| Publication Date | April 23, 2025 |
| Year Published | 2025 |
| Language | English |
| Publisher | U.S. Geological Survey |
| Publisher location | Reston, VA |
| Contributing office(s) | Earth Resources Observation and Science (EROS) Center |
| Description | v, 17 p. |
| Online Only (Y/N) | Y |
| Additional Online Files (Y/N) | N |