

Comparison of Computed Flow Through Manually Operated Water Control Structures in Florida Using Theoretical Versus Calibrated Coefficients
Links
- Document: Report (3.35 MB pdf) , HTML , XML
- Dataset: USGS National Water Information System database —USGS water data for the Nation
- Data Release: USGS data release - Data for the comparison of computed flow through manually operated water control structures in Florida using theoretical versus calibrated coefficients
- NGMDB Index Page: National Geologic Map Database Index Page (html)
- Download citation as: RIS | Dublin Core
Acknowledgments
The authors thank the data collection personnel from the U.S. Geological Survey for their help collecting and analyzing the streamflow data.
Abstract
The U.S. Geological Survey (USGS) calculated discharge at 13 water control structures in Florida using theoretical equations and uncalibrated coefficients gathered from previous studies and typical textbook values for selected flow regimes and structure types. These discharges were compared to the real-time discharges calculated and published by the USGS from October 1, 2007, to September 30, 2019, using traditional methods and coefficients verified by direct discharge measurements. The theoretical and USGS-calculated daily mean discharges were compared at each structure for different flow regimes covering the entire range of discharges that occurred over the study period except those less than 10 cubic feet per second to avoid large percentage errors for small actual differences in discharge. The discharges were also not compared if (1) any alterations were made to the USGS discharge to account for factors such as debris or construction, (2) any values were missing throughout the day, (3) the flow regime changed during the day, or (4) the USGS discharge was estimated. The structures compared include a mixture of vertical lift and radial gates with free and submerged conditions for orifice and weir flow.
The study totals showed that the average absolute difference for all structures was 18.7 percent. Average percent differences ranged from −26.5 to 28.6 percent, and 4 of the 13 structures had average differences within 10 percent.
Introduction
Water control structures, or dams, are operated by Federal, State, and local officials to manage water resources and public safety. These structures are typically built to regulate water levels near developed areas for many reasons, including flood reduction, recreation, and preservation of a healthy ecosystem. A specified discharge, or flow through the structure, may be required to maintain certain desirable conditions, such as regulated water levels, or to provide adequate flow for aquatic species to thrive. Therefore, accurate measurements and calculations of discharge through the structure are pivotal to satisfy these requirements.
Many types of structures are currently in operation, and the U.S. Geological Survey (USGS) computes real-time streamflow, or discharge, through many of these structures using available water levels, structure operation data, and discharge measurements. It is also possible to calculate the expected discharge through a structure using theoretical equations and coefficients without verification of direct discharge measurements. Discharges calculated from both methods are discussed and compared in this report for selected structures in Florida.
Purpose and Scope
This report presents a comparison of published discharge values through selected water control structures computed by the USGS to discharge values calculated using theoretical equations and coefficients. The verification of direct discharge measurements adds a level of certainty that is not possible with the theoretical equation approach. However, the personnel, time, equipment, and maintenance required to collect and analyze the data increase cost. This report compares percent differences between the two methods to help evaluate the tradeoff between quality of discharge data and cost.
Selected water control structures were limited to those (1) located in Florida; (2) where traditional calculation methods could be applied; and (3) for which the USGS published discharge values between October 1, 2007, and September 30, 2019. This period was selected for the use of instantaneous values in the discharge calculations. Previous years’ data were mainly daily values, which have traditionally been the USGS-published product.
Special-use structures, such as those with ballasts and (or) parabolic dimensions, were excluded from this comparison for simplicity. A general overview about hydraulic conditions and characteristics is provided for the structures investigated in this study. However, specific details about structure designs and operations are outside the scope of this report.
Methods
The method of discharge calculation at water control structures depends on operation, dimensions, headwater (upstream), and tail-water (downstream) water level. Typical water control structures investigated in this report contain one or more openings, or gates, that can be raised or lowered to achieve the desired flow. The equations used to calculate discharge depend on the flow regime through the gate opening and whether submergence is encountered in the tail-water conditions.
Hydraulic Equations and Conditions at Structures
The flow regimes encountered at water control structures are classified as orifice or weir flow. Orifice flow (eqs. 1, 3, or 4, table 1) occurs when water flows beneath the partially opened gate, but the gate still obstructs flow. Weir flow (eqs. 2, 6, or 7, table 1) occurs when the gate is opened to a height clear of the water, or at least two-thirds of the headwater elevation, and the water flows freely through the opening. Both flow regimes can be classified as free or submerged, depending on the tail-water elevation relative to the headwater and gate opening (Sanders and Feaster, 2004).
Table 1.
Flow regimes, hydraulic conditions, and equations for discharge calculation at water control structures.[hg, vertical gate opening, in feet; h1, static headwater elevation referenced to gate sill, in feet; h3, static tail-water elevation referenced to gate sill, in feet; Q, discharge, in cubic feet per second; C, free orifice flow coefficient; B, lateral width of structure gate, in feet; g, acceleration of gravity, in feet per second per second; Rw, value of h3/h1 (default of 0.6) above which submerged weir flow exists; Cw, free weir flow coefficient; Cgt, submerged orifice flow coefficient; Cgs, submerged orifice flow coefficient; y, slope of the regression line for the relation between h3/hg and Cgs; Cws, submerged weir flow coefficient]
Submerged orifice flow occurs when the tail-water elevation rises above the elevation of the opened gate, which obstructs the free flow of water through the gate opening. Submerged orifice flow is calculated using equation 3 or 4, both of which are similar to the free orifice equation but include the addition of a submergence coefficient, Cgt or Cgs. Equation 3 for submerged orifice flow is found in most textbooks, whereas equations 4 and 5 are used by the USGS to simplify the calibration. Submerged weir flow is calculated using equation 6 if conditions dictate that submergence affects flow through the structure. Submerged weir flow occurs when the tail-water elevation rises to a specified value of the ratio of tail-water to headwater elevation, known as the submergence ratio, Rw. Sanders and Feaster (2004) suggest using the submergence ratio default value of 0.6, which is typically used for USGS computations unless otherwise specified. Hulsing (1967) suggests a submergence ratio of 0.5–0.85, depending on the structure type, and Chow (1959) suggests a submergence ratio of 0.80 for a specific Parshall flume structure.
USGS Calculations
Headwater and tail-water levels at water control structures were collected in accordance with USGS standards (Sauer and Turnipseed, 2010a). Discharge was routinely measured by using various types of equipment, depending on depth, velocity, and environmental conditions, in accordance with USGS standards (Sauer and Turnipseed, 2010b). Discharge coefficients were computed using the relevant equations for each structure depending on hydraulic conditions.
USGS methods of discharge computation through water control structures were followed as outlined in Sanders and Feaster (2004). This publication is tailored to the setup and operation of an outdated USGS program, DAMFLO.2, but the procedures for rating structures, equations, and discharge calculations are the same and currently used to produce instantaneous and daily discharge values published by the USGS. The basic concepts are presented here, and more detailed explanations and computation options can be found in Sanders and Feaster (2004).
The flow coefficients for each flow regime observed at the structure are determined from discharge measurements. For free orifice and free weir flow regimes, a simple back calculation was performed using equation 1 or 2 to determine the flow coefficient value at a range of gate openings and headwater levels by using the measured discharges. Real-time discharge for free orifice flow was calculated using the relation of discharge coefficient to vertical gate opening. For free weir flow, the relation between discharge coefficient to headwater level was used.
Equation 3 for submerged orifice flow is found in most textbooks; however, equation 4 is used by the USGS instead, because it simplifies the development of a calibration relation. The submerged orifice coefficient used in equation 4 was computed from the additional step shown in equation 5, where Cgs is related to the submergence ratio (h3/hg) by calibration (Sanders and Feaster, 2004).
The most common submerged weir flow calculation uses equation 6, which includes the addition of a submergence discharge coefficient, Cws. This coefficient is related to the submergence ratio (h3/h1) by calibration (Sanders and Feaster, 2004) and is the method used for submerged weir flow calculation for each structure in this study unless otherwise specified. Another technique used to calculate submerged weir flow utilizes the unit fall method (Kennedy, 1984), whereby the ratio of measured discharge to the square root of fall is related to the tail-water elevation by calibration, as shown in equation 7 (Sanders and Feaster, 2004). The criteria to differentiate free weir flow from submerged weir flow varies by source, which suggests each structure should be analyzed individually after a number of submerged weir flow measurements are made. The USGS uses 0.60 for Rw by default, upon suggestion by Collins (1977), but this can be changed if more detailed knowledge of the structure is known.
The method employed by the USGS relies on recurring discharge measurements over a range of gate settings and water levels to verify the flow regimes and ratings. Some structures may only experience certain conditions, such as free weir flow or submergence, in emergency situations. Flow coefficients determined from discharge measurements conducted under these flow regimes may be different from those calculated from theoretical equations or previously used ratings, and rating adjustments may be necessary after these discharge measurements for a more accurate definition.
Theoretical Calculations
Theoretical discharges referenced in this report are those produced using selected equations shown in table 1 for each flow regime and weir shape encountered. Values for the discharge coefficients were selected from references, as shown in table 2.
Table 2.
Coefficients used in theoretical discharge calculations for each structure type and flow regime at water control structures.[USACE, U.S. Army Corps of Engineers]
| Flow regime | Flow coefficient | Reference |
|---|---|---|
| Free orifice | 0.6 for vertical lift gates; 0.7 for radial gates |
USACE (2020), Finnemore and Franzini (2002), Tillis and Swain (1998) |
| Free weir | 2.8 for broad crested; 3.6 for ogee crested; 3.2 for sharp crested |
USACE (2020), Rantz and others (1982) |
| Submerged orifice | 0.6 for vertical lift gates; 0.7 for radial gates |
USACE (2020), Finnemore and Franzini (2002), Bureau of Reclamation (2001) |
| Submerged weir | Discharge reduction factor for broad and ogee | USACE (2020), Hulsing (1967) |
Typical values for the free orifice flow coefficient, C, include the following ranges: 0.5–0.7 (U.S. Army Corps of Engineers [USACE], 2020), 0.55–0.60 (Finnemore and Franzini, 2002), and 0.57–0.71 (Tillis and Swain, 1998). The study done by Tillis and Swain (1998) included three vertical lift gate structures in south Florida under free orifice flow and produced an average free orifice flow coefficient of 0.65, with a range from 0.57 to 0.71. An average value was calculated from the range of these three sources to produce a free orifice flow coefficient of 0.60 for typical vertical lift gates in Florida. Information is limited for radial gates, and the suggested range of 0.6–0.8 is slightly larger than that suggested for vertical lift gates (USACE, 2020). Therefore, an average coefficient of 0.70 was calculated for free orifice flow through radial gates.
Submerged orifice discharge for the theoretical computations was calculated using equation 3, which incorporates the vertical gate opening to calculate the cross-sectional area of the orifice. Values of the submerged orifice flow coefficient, Cgt, are practically the same as for free orifice flow, except when water levels are less than 10 feet (ft) when referenced to the gate sill, Cgt may be slightly less (Finnemore and Franzini, 2002). The Bureau of Reclamation (2001) determined a submerged orifice coefficient for standard rectangular irrigation weirs experimentally to be 0.61 for fully contracted orifices and 0.70 for those with bottom and side contractions suppressed. Based on these two references, the same coefficients were used for submerged orifice flows as free orifice flows.
The structures investigated in this study are classified as sharp, ogee, or broad crested weirs. A free weir flow coefficient, Cw, of 3.2 is used as the default value for sharp crested weirs in USACE (2020). Using the procedures outlined in Rantz and others (1982) for thin plate weirs with a vertical gate face and sill at the streambed produced a free weir coefficient of 3.21 for weirs with side contractions. Because all sharp crested structures included in this study have side contractions, an average of the two coefficients, 3.2, was used. USACE (2020) suggests a range of coefficients of 3.2–4.1 for ogee crested weirs and 2.6–3.1 for broad crested weirs. Therefore, average values of 3.6 for ogee crested weirs and 2.8 for broad crested weirs were used for the theoretical computations for each of these weir shapes.
No sharp crested weirs experienced submerged weir flow regimes during this study. The adjustment of free weir flow for submergence, Cws, at broad crested weirs was calculated using methods presented in Hulsing (1967) for submerged paved highway embankments. This method uses the submergence ratio to determine Cws and applies no adjustment for submergence ratios below 0.80. A similar method and diagram are suggested by USACE (2020) to adjust weir flows for submergence. The only submerged weir discharge that occurred at ogee crested weirs in this study was estimated by the USGS and would not be a good comparison for the two methods, so submerged weir flow comparisons for ogee weirs were omitted.
Discharge Comparison Methodology
The theoretical discharge was calculated for the same time intervals in which they were published by the USGS, and the same criteria were used to determine the flow regime and submergence to provide a constant comparison between methods. Discharge was computed at typical time intervals of 15 minutes, 30 minutes, and 1 hour, and is herein referred to as instantaneous. The instantaneous discharge values were used to compute a daily mean discharge value, and the comparisons were done using daily mean values. USGS discharge data are available from the USGS National Water Information System database (U.S. Geological Survey, 2021). The published values include all computed discharge values at the station location and may differ from the discharge through the structure because of added flows such as those from lockages or separate channels adjacent to the structure. The discharges used for the comparison and the calculated percent differences are available in a USGS data release (Ryan and Hazelbaker, 2022).
To avoid erroneous comparisons, the discharge values from both methods were not compared if (1) headwater, tail water (if submerged), or gate opening data were missing; (2) USGS-published values were estimated; (3) discharge values were changed from rated conditions because of debris or construction; or (4) the flow regime changed during the day. Differences calculated in the comparison still occurred from structure age and weathering, the combination of flow through multiple gates, and flow that did not approach the structure at a completely perpendicular angle, all of which were not accounted for in the theoretical approach. The final comparison used the percent difference calculated from both daily mean discharges (eq. 8). To avoid large percent differences resulting from small actual differences, no comparisons were done with discharge below 10 cubic feet per second (ft3/s). The period considered for this study includes calculated discharge values between October 1, 2007, and September 30, 2019.
Histograms were constructed using a range of percent differences as a simple and meaningful way to view how well the two datasets compare. They were not constructed to show the symmetry or shape of the percent differences but to display meaningful ranges that would occur had the chosen coefficients and theoretical ratings been used instead of those used to compute USGS discharge.
Description of Discharge Water Control Structure Sites
The water control structures investigated in this study were limited to (1) structures having vertical lift and radial gate operations; (2) structures whose discharge data were computed by the USGS using conventional methods; and (3) structures located in Florida (fig. 1). Basic details about each structure, including compared flow regimes, are shown in table 3.
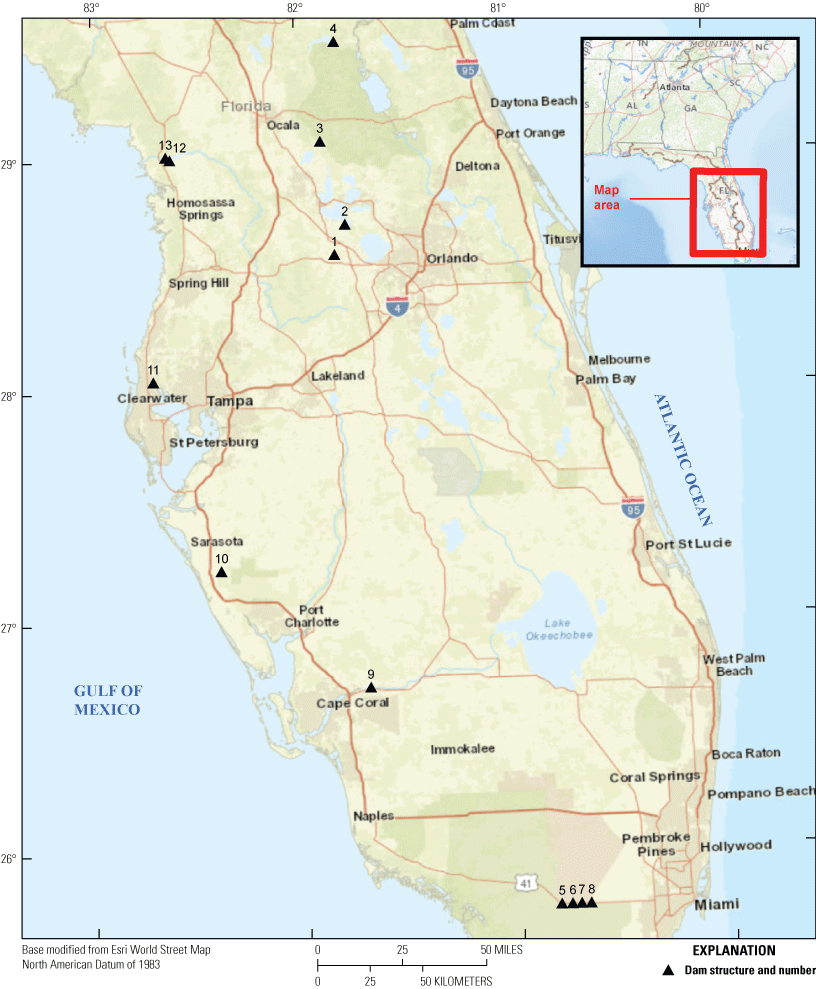
Water control structures in Florida selected for discharge comparison. Index numbers for the structures are cross referenced to U.S. Geological Survey station identifiers in table 3.
Table 3.
Details of each water control structure, U.S. Geological Survey (USGS) site number, and discharge data selected for discharge comparison.[Dates are shown as month, day, year. Not all discharge records were used for the structure discharge comparison, as detailed in manuscript. nr, near; Fla., Florida; S.O., submerged orifice flow regime; S.W., submerged weir flow regime; F.O., free orifice flow regime; --, does not apply; F.W., free weir flow regime]
Palatlakaha River at Cherry Lake Outlet Near Groveland
The Cherry Lake Outlet structure controls the water levels in a chain of lakes upstream and is located at the outlet with no approach channel. Two radial gates regulate the discharge through the structure, which is subject to submergence. Each gate has a porthole to allow minimum flow when the gates are closed and the headwater rises above this elevation. For purposes of this study, the port flow is not considered, and the comparison is done using only the flow through each gate. The weir shape is considered broad crested, and submerged weir flow at Cherry Lake Outlet is calculated by the USGS using the square root of fall method (eq. 7).
Apopka Beauclair Canal Near Astatula
Apopka Beauclair Lock and Dam is located on a diked canal both upstream and downstream and has a broad crested weir with side contractions and two radial gates. Many consecutive days of no flow through the structure occurred as low and moderate flows typically have bypassed through a nutrient reduction facility since 2009. The structure has both a navigation lock and a fixed weir capable of releasing flow, but neither were used during the time of this study. Submerged weir flow is possible at this structure, depending on the tail-water levels and lakes downstream; however, the only submerged weir flow period through the structure was estimated by the USGS and not compared in this study.
Ocklawaha River at Moss Bluff
Moss Bluff Lock and Dam is located on a straight reach of river and contains two vertical lift gates (sluice gates) with side contractions, each with a small “mini gate” within it to regulate low flows. The comparison performed in this study only focuses on the main gate discharge, as the low flow discharges are calculated by the USGS using nontraditional methods. The structure has a navigation lock but was not used to release flow during the study. Only free orifice flow conditions were encountered at the structure and compared in this study.
Ocklawaha River at Rodman Dam Near Orange Springs
Rodman Dam is located on the downstream end of a reservoir with no approach channel and operates with four vertical lift gates. Because of the number of downed trees and other vegetation in the reservoir, flow through the gate openings can be affected by debris even though the opening is below the water surface. Only free orifice flow conditions were encountered and compared at this structure during the study period.
Tamiami Canal at S–12–A, at S–12–B, Below S–12–C, and at S–12–D Near Miami
Four separate water control structures, S–12–A, S–12–B, S–12–C, and S–12–D, regulate water on a canal, each with six vertical lift gates operated under submerged conditions. The USGS computes flow through the structure based only on stage for very small gate openings less than 0.15 ft or during weir flow conditions when the gates are raised above 8 ft. Therefore, only submerged orifice flow with gate openings larger than 0.15 ft and less than 8 ft was compared in this study.
Caloosahatchee River at S–79 Near Olga
Structure S–79 regulates water flowing from Lake Okeechobee through a large, diked river by means of eight vertical lift gates. The water downstream of the structure is tidally influenced by the Gulf of Mexico. Only submerged orifice flow conditions occurred at the structure during this study. The structure has a boat lockage chamber used to release water in emergency situations. The USGS computes flow through the lock chamber using theoretical calculations and therefore, they were not compared in this study.
Cow Pen Slough at Control Near Bee Ridge
The water control structure at Cow Pen Slough regulates a canal with three radial gates. Flow conditions for the study were free orifice and free weir (broad crested) through the opened gates and free weir (sharp crested) over top of the closed gates. The canal is subject to heavy vegetation growth, which can affect the structure ratings.
Lake Tarpon Canal at S–551 Near Oldsmar
The water control structure S–551 regulates the outlet canal of a lake, and the water level downstream of the structure is influenced by tide from nearby Tampa Bay. The structure consists of four main vertical lift gates and four vertical “drop” gates attached to the top of each structure main gate. Although other flow regimes occurred, only submerged orifice flow through the main gate openings were compared in this study, as those are the only flows confirmed by the USGS discharge measurements.
Withlacoochee River at Inglis Dam Near Dunnellon
Inglis Dam regulates flow through the outlet canal of a lake by means of two vertical lift gates. Only free orifice flow conditions occurred at this structure during the study. Prior to October 2011, spring flow of 105 ft3/s was added to the USGS daily mean value to account for flow just downstream of the structure. This added discharge was not used for the comparison in this study; only flow through the structure gates was considered for the comparison.
Results
Results of the discharge calculations are presented as percent differences between the daily mean USGS discharge values and those calculated using theoretical equations and coefficients. The USGS discharge is used as the reference, and positive percent differences indicate that the theoretical discharge is lower than the USGS values. Contrarily, negative percent differences indicate that the theoretical discharge is higher than the USGS values. The magnitude is represented by the average of the absolute value of the percent differences and shows the variation of the theoretical discharge relative to the USGS discharge regardless of direction. A summary of the percent differences, mean discharge, and average differences for each structure is shown in table 4.
Table 4.
Percent difference, mean discharge, and average differences between daily mean U.S. Geological Survey (USGS) discharge and theoretical discharge at select water control structures.[max, maximum daily mean percent difference between theoretical and USGS discharge; min, minimum daily mean percent difference between theoretical and USGS discharge; avg, average of the daily mean percent differences between theoretical and USGS discharge; avg ABS, average of the absolute value of the daily mean percent differences between theoretical and USGS discharge; avg theor discharge, average of the theoretical daily mean discharges; ft3/s, cubic foot per second; avg difference, average of the differences between USGS and theoretical daily mean discharge; avg ABS difference, average of the absolute values of the differences between USGS and theoretical daily mean discharge; %, percent]
02236900 Palatlakaha River at Cherry Lake Outlet Near Groveland
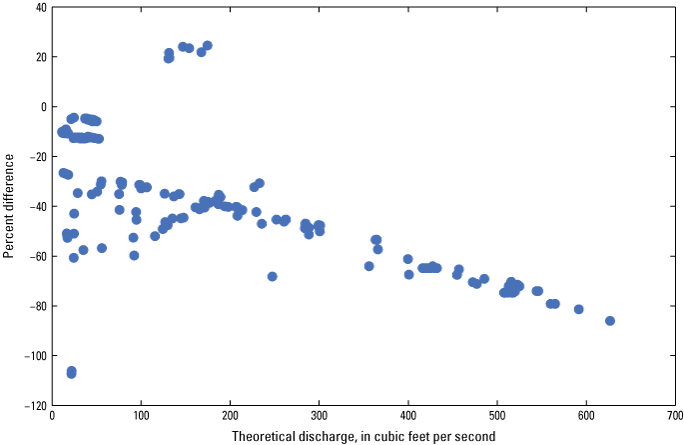
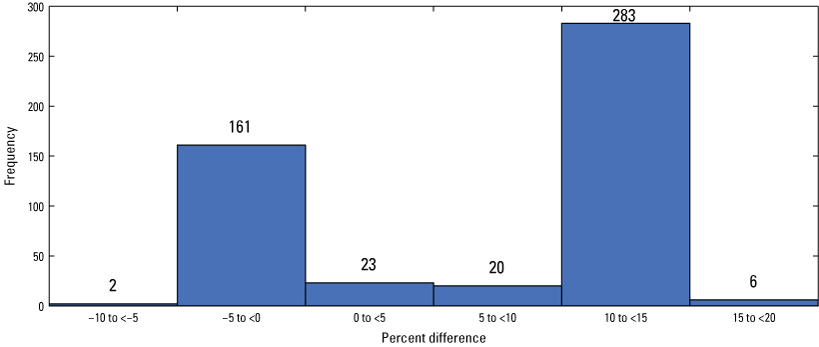
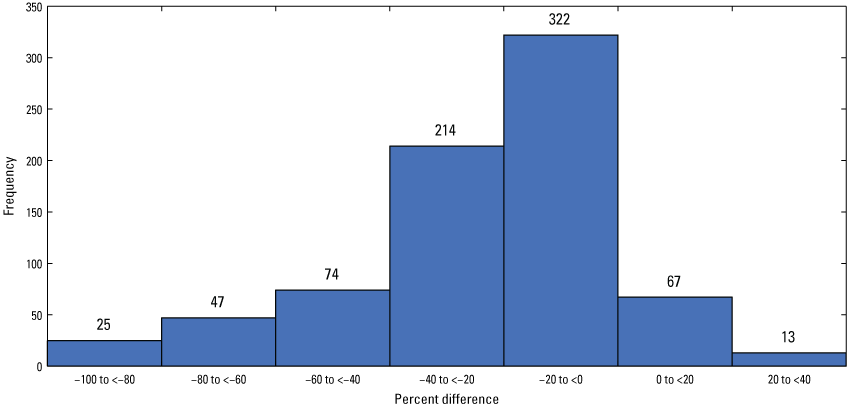
Daily mean discharge values were compared for both submerged orifice and submerged weir flow regimes at Cherry Lake Outlet. Of the 590 values compared, the theoretical discharge was an average 28.6 percent lower than the USGS daily mean discharge, and the average absolute difference was 36.4 percent. The most common range of daily percent differences was between 30 and 40 percent (fig. 2). Theoretical daily mean discharge values ranged from 14.7 to 580 ft3/s. There was a reversal of percent differences from positive to negative as theoretical discharge increased, and discharges greater than 500 ft3/s had percent differences near −50 percent (fig. 3).
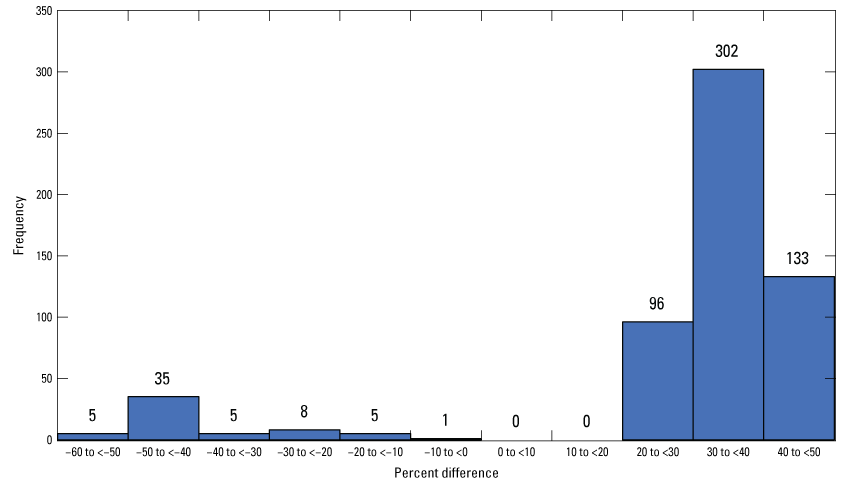
Percent differences for daily mean U.S. Geological Survey and theoretical discharge at Cherry Lake Outlet.
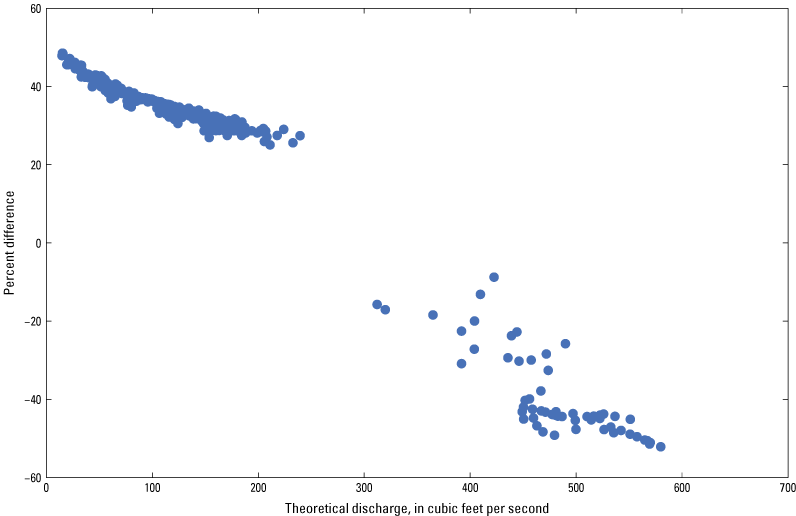
Daily mean theoretical discharge and corresponding percent differences at Cherry Lake Outlet.
02237700 Apopka Beauclair Canal Near Astatula
Discharge compared for Apopka Beauclair Canal was either free or submerged orifice flow. Some free weir flow occurred, but not enough values were available to compute and compare a daily mean theoretical discharge. The theoretical daily mean discharge ranged from 11.3 to 627 ft3/s, and the most common range of daily percent differences was between −20 and 0 percent for the 382 values compared (fig. 4). The theoretical discharge was an average 26.5 percent higher than the USGS discharge, and the average absolute difference was 27.3 percent. The percent difference increased (became more negative) as theoretical discharge increased, and percent differences larger than −50 percent occurred for theoretical discharges greater than 350 ft3/s (fig. 5).
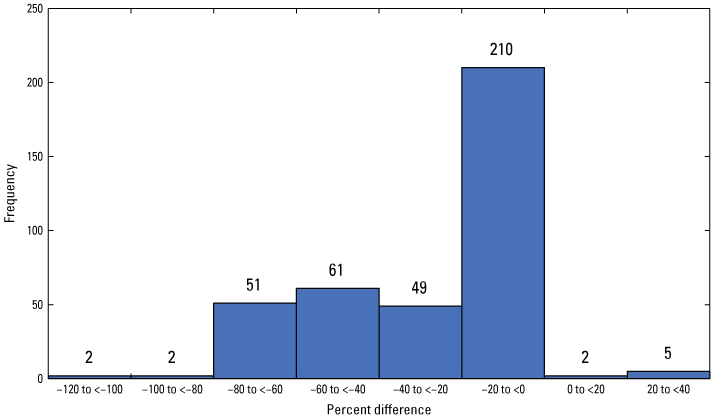
Percent differences for daily mean U.S. Geological Survey and theoretical discharge at Apopka Beauclair Canal.
Daily mean theoretical discharge and corresponding percent differences at Apopka Beauclair Canal.
02238500 Ocklawaha River at Moss Bluff
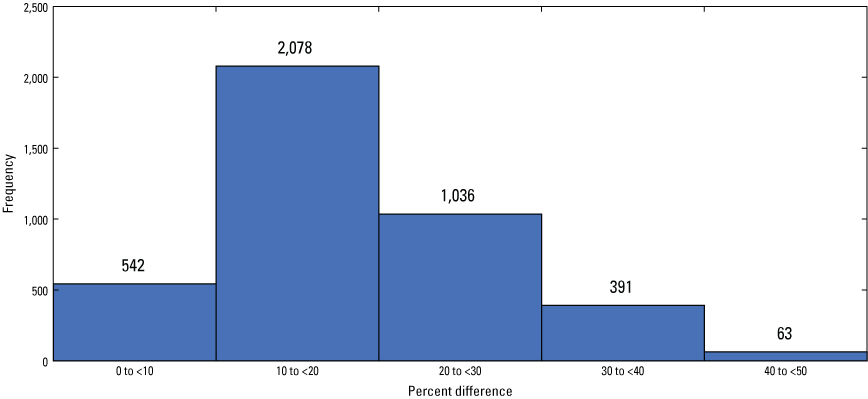
Free orifice flow through the Moss Bluff structure was compared for 495 daily mean values. The theoretical discharge ranged from 15.8 to 2,300 ft3/s, the average percent difference between theoretical and USGS discharge was 7.35 percent, and the average absolute difference was 7.49 percent. The most common range of daily percent differences was between 10 and 15 percent (fig. 6). Mostly constant percent differences, either near 0 or 12 percent, were calculated for theoretical discharges above 100 ft3/s (fig. 7). This occurred because the same theoretical rating is used to compute the USGS values, and the coefficient was later changed to fit the discharge measurements.
Percent differences for daily mean U.S. Geological Survey and theoretical discharge at Moss Bluff.
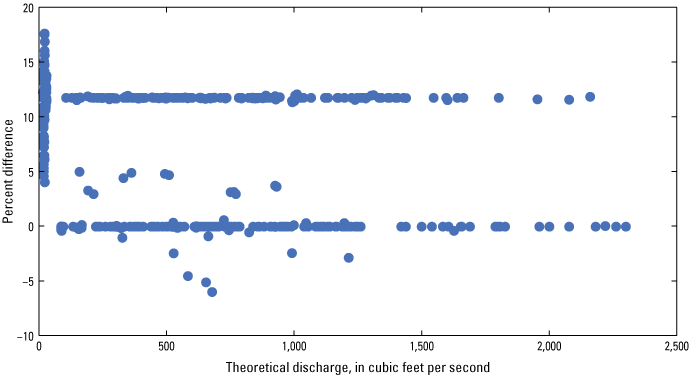
Daily mean theoretical discharge and corresponding percent differences at Moss Bluff.
02243960 Ocklawaha River at Rodman Dam Near Orange Springs
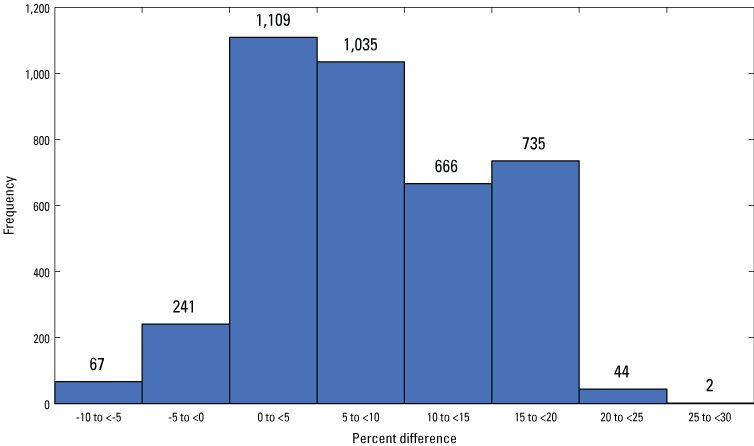
Discharge was compared at Rodman Dam for 4,110 daily mean values, all of which were classified as free orifice flow. The theoretical discharge ranged from 17.6 to 5,130 ft3/s, and the average percent difference between theoretical and USGS discharge was 18.5 percent. The average absolute difference was also 18.5 percent because all percent differences were positive. The most common range of daily percent differences was between 10 and 20 percent (fig. 8). Percent difference decreased as discharge increased, and theoretical discharges greater than 1,000 ft3/s were within 20 percent of the USGS discharge (fig. 9).
Percent differences for daily mean U.S. Geological Survey and theoretical discharge at Rodman Dam.
Daily mean theoretical discharge and corresponding percent differences at Rodman Dam.
254543080491101 Tamiami Canal at S–12–A Near Miami
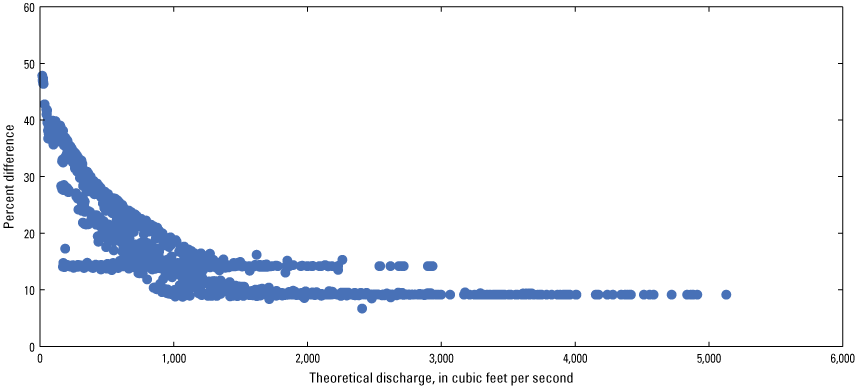
Only 34 daily mean discharge values were compared at S–12–A under submerged orifice conditions because of limited gate openings for complete days. The theoretical daily mean discharge ranged from 38.3 to 206 ft3/s and was lower than the USGS values by an average of 22.2 percent. The average absolute difference was also 22.2 percent because all percent differences were positive. All percent differences except three fell between 20 and 25 percent (fig. 10), and the percent differences remained below 30 percent for the entire range of theoretical discharges (fig. 11).
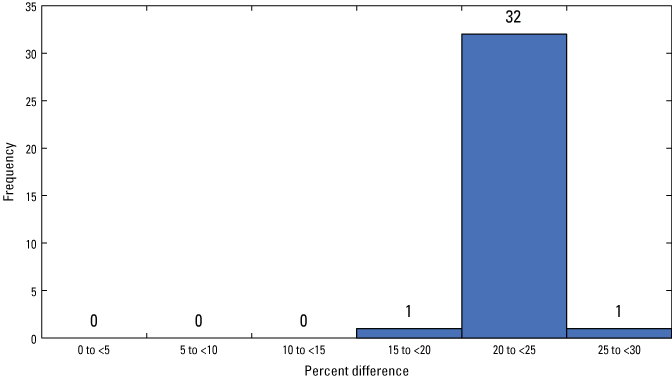
Percent differences for daily mean U.S. Geological Survey and theoretical discharge at S–12–A.
Daily mean theoretical discharge and corresponding percent differences at S–12–A.
02289019 Tamiami Canal at S–12–B Near Miami
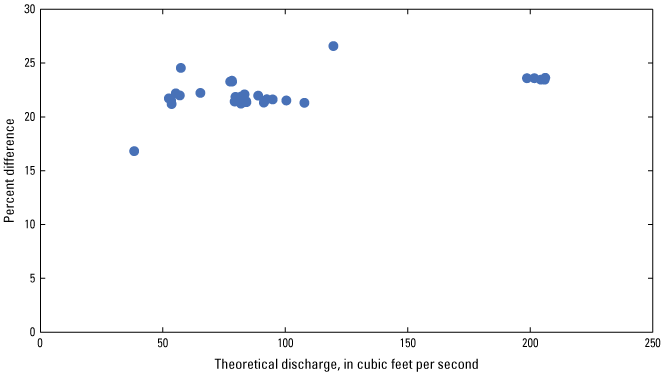
Discharge at S–12–B was compared for 141 daily mean values all under submerged orifice conditions. The theoretical daily mean discharge ranged from 23.2 to 292 ft3/s and was lower than the USGS values by an average of 20.1 percent, which also matches the average absolute difference percent difference. The most common range of daily percent differences was between 15 and 20 percent (fig. 12), and the percent differences remained near 20 percent for theoretical discharges greater than 75 ft3/s (fig. 13).
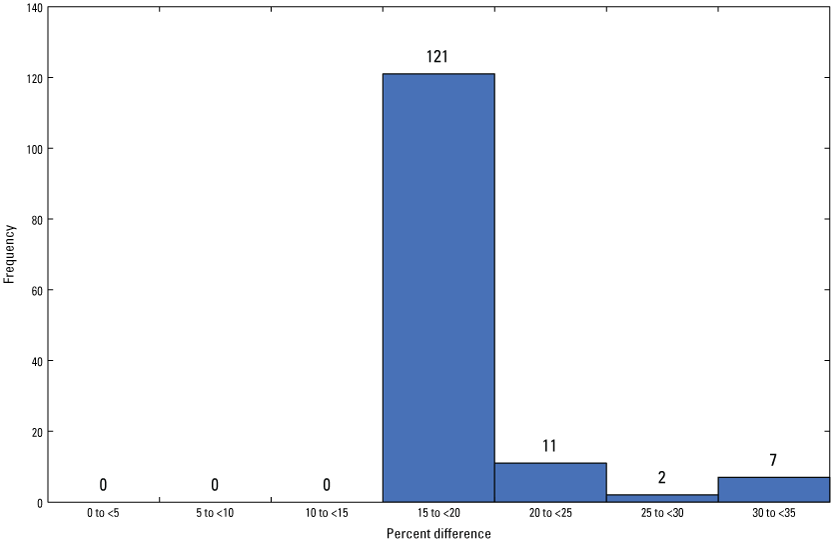
Percent differences for daily mean U.S. Geological Survey and theoretical discharge at S–12–B.
Daily mean theoretical discharge and corresponding percent differences at S–12–B.
02289041 Tamiami Canal Below S–12–C Near Miami
Discharge at S–12–C was compared for 316 daily mean values, all under submerged orifice conditions. The theoretical daily mean discharge ranged from 25.0 to 440 ft3/s and was lower than the USGS values by an average of 25.8 percent, which also matches the average absolute difference percent difference. The most common range of daily percent differences was between 25 and 30 percent (fig. 14), but theoretical discharges greater than 300 ft3/s typically had percent differences between 15 and 25 percent (fig. 15).
Percent differences for daily mean U.S. Geological Survey and theoretical discharge at S–12–C.
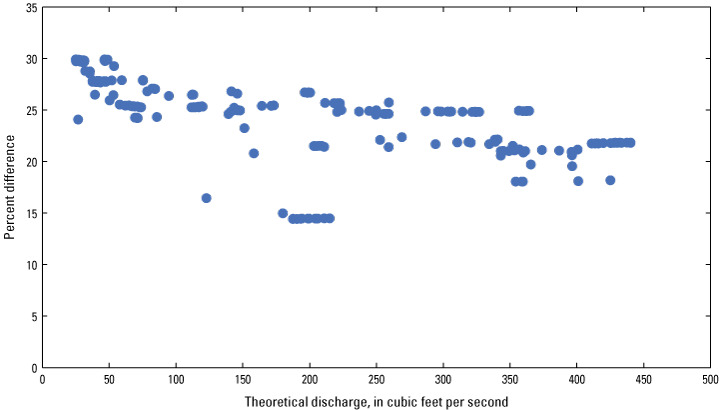
Daily mean theoretical discharge and corresponding percent differences at S–12–C.
254543080405401 Tamiami Canal at S–12–D Near Miami
S–12–D had the most discharge data and largest daily mean discharge of the four S–12 structures compared. The theoretical daily mean discharge was compared for 732 daily mean values that ranged from 14.1 to 662 ft3/s. These theoretical discharge values were lower than the USGS values by an average of 21.2 percent, which also matches the average absolute difference percent difference. The most common range of daily percent differences was between 20 and 25 percent (fig. 16), and that range included the entire range of daily mean theoretical discharges (fig. 17).
Percent differences for daily mean U.S. Geological Survey and theoretical discharge at S–12–D.
Daily mean theoretical discharge and corresponding percent differences at S–12–D.
02292900 Caloosahatchee River at S–79 Near Olga
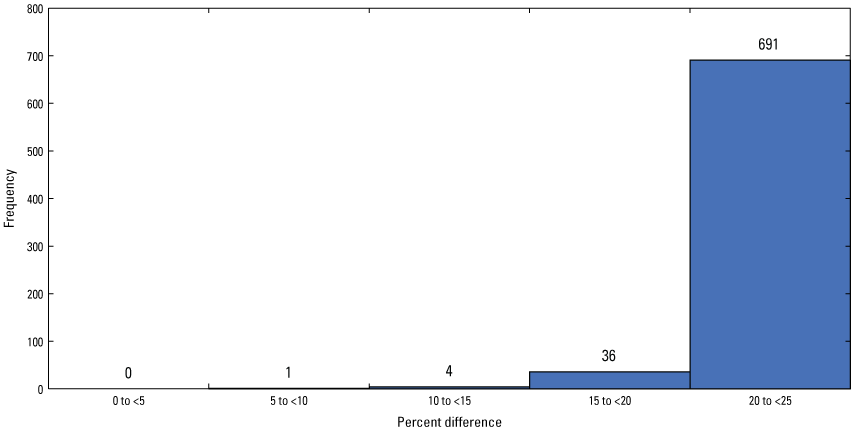
Daily mean discharge at S–79 was compared for 2,613 values under submerged orifice conditions. The theoretical daily mean discharges ranged from 20.0 to 14,700 ft3/s, and the comparison produced an average difference of 4.96 percent. The average absolute difference was 5.71 percent. Most theoretical discharges plotted within 20 percent of the USGS discharge (fig. 18). Figure 19 shows a strong positive relationship between the percent difference and theoretical daily mean discharge, where the theoretical discharge plots at least 10 percent low for values above 8,000 ft3/s.
Percent differences for daily mean U.S. Geological Survey and theoretical discharge at S–79.
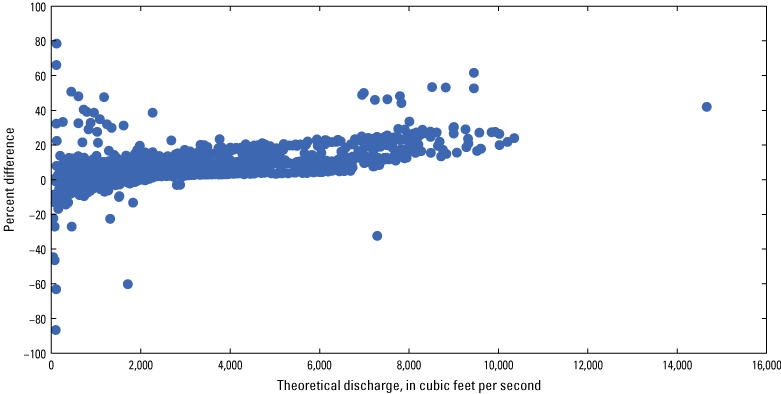
Daily mean theoretical discharge and corresponding percent differences at S–79.
02299710 Cow Pen Slough at Control Near Bee Ridge
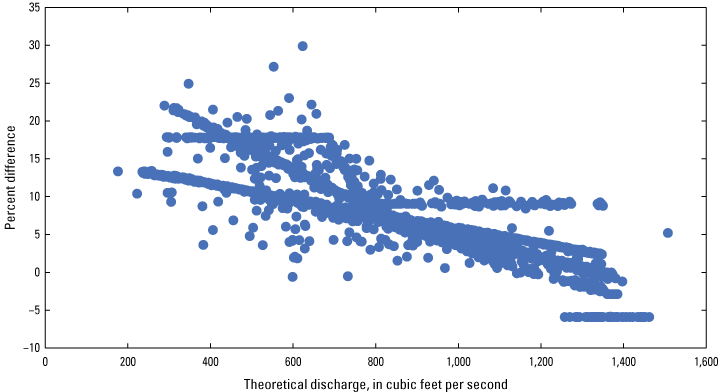
Free orifice and free weir flow were compared for 762 values at Cow Pen Slough, and the theoretical discharge was an average 22.8 percent higher than the USGS discharge. The average absolute difference was 24.6 percent. The theoretical daily mean discharges ranged from 10.5 to 1,360 ft3/s, and approximately half of the theoretical discharges plotted within ±20 percent of the USGS discharge (fig. 20). The percent differences showed an increasing curvilinear relationship with discharge, and mostly positive percent differences were calculated at theoretical discharges greater than 300 ft3/s (fig. 21).
Percent differences of daily mean U.S. Geological Survey and theoretical discharge at Cow Pen Slough.
Daily mean theoretical discharge and corresponding percent differences at Cow Pen Slough.
02307498 Lake Tarpon Canal at S–551 Near Oldsmar
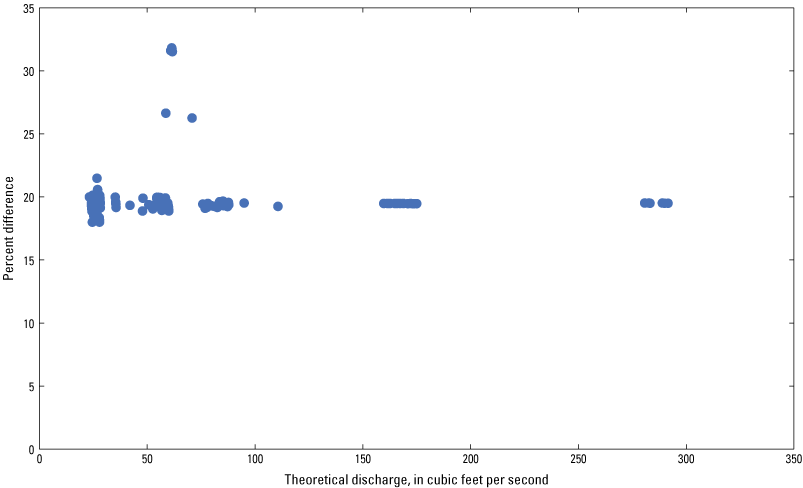
Daily mean discharge at S–551 was compared for 349 values under submerged orifice conditions. The theoretical daily mean discharge ranged from 15.7 to 904 ft3/s, and the comparison indicated an average difference of 14.5 percent, which also matches the average absolute difference percent difference. The theoretical discharge plotted below the USGS discharge for all values compared in the study, and a range of 10–15 percent was the most common (fig. 22). The percent difference showed a constant relationship between 10 and 20 percent as theoretical discharge increased greater than 400 ft3/s (fig. 23).
Percent differences for daily mean U.S. Geological Survey and theoretical discharge at S–551.
Daily mean theoretical discharge and corresponding percent differences at S–551.
02313230 Withlacoochee River at Inglis Dam Near Dunnellon
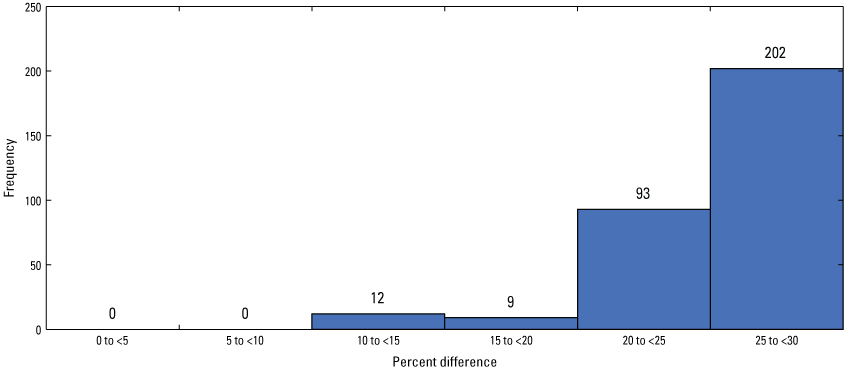
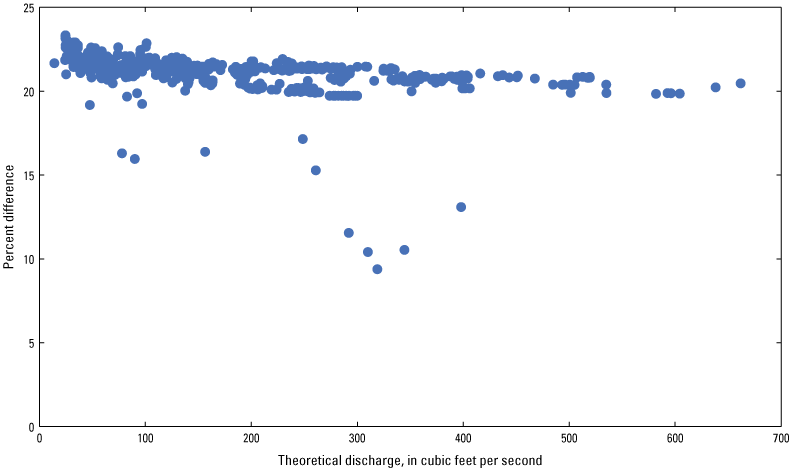
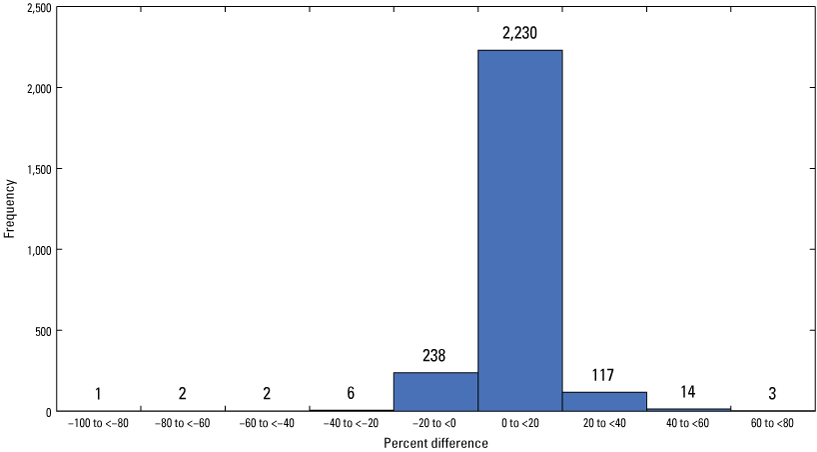
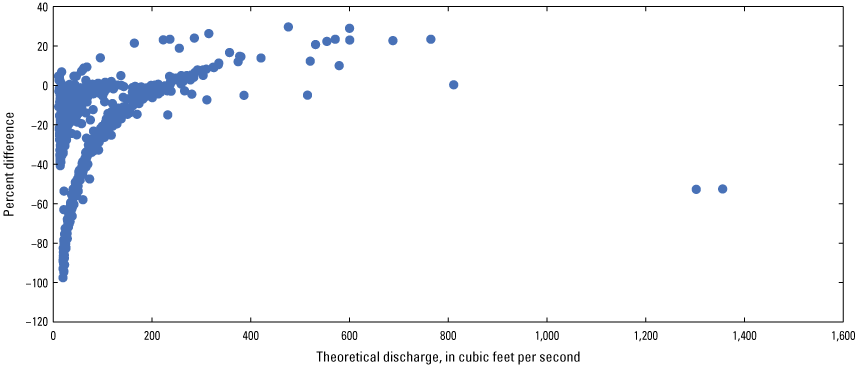
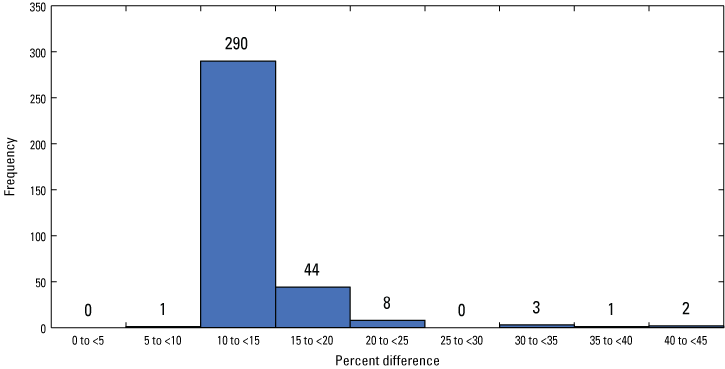
Daily mean discharge at the Inglis Dam structure was compared for 1,018 values under free orifice conditions. The theoretical daily mean discharge ranged from 12.5 to 3,560 ft3/s, and the comparison produced an average difference of 9.80 percent. The average absolute difference was 10.6 percent. Approximately 75 percent of the theoretical daily mean discharges plotted between 10 and 20 percent lower than the USGS daily mean discharge (fig. 24). The percent difference showed a constant relationship between 0 and 20 percent for all theoretical discharges greater than 1,000 ft3/s (fig. 25).
Percent differences for daily mean U.S. Geological Survey and theoretical discharge at Inglis Dam.
Daily mean theoretical discharge and corresponding percent differences at Inglis Dam.
02313250 Withlacoochee River Bypass Channel Near Inglis
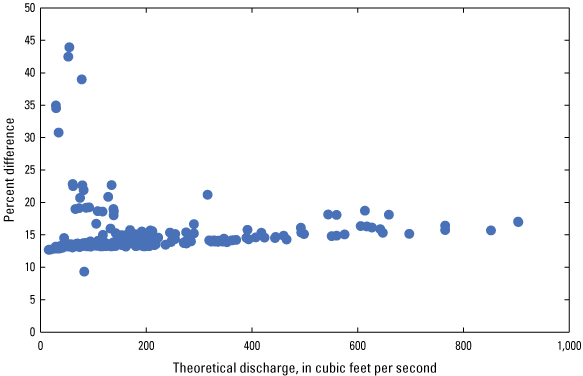
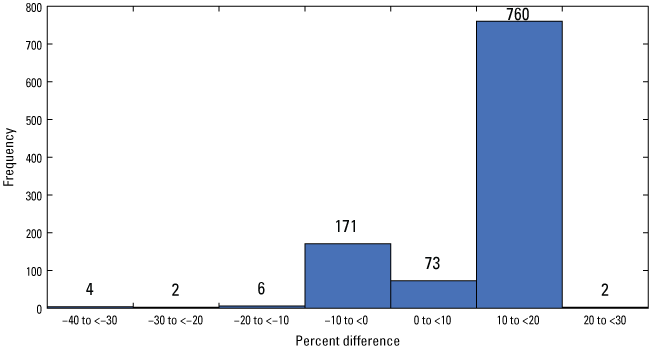
The flow regimes for the Bypass Channel structure were classified as either free orifice or free weir for the 3,899 values compared. The theoretical daily mean discharge ranged from 176 to 1,510 ft3/s, and the comparison indicated an average difference of 8.20 percent. The average absolute difference was 8.50 percent. The range of 0–5 percent included the most daily mean percent differences, and approximately 99 percent of the theoretical discharges were within ±20 percent of the USGS discharges (fig. 26). The percent difference slightly decreased as theoretical discharge increased (fig. 27).
Percent differences for daily mean U.S. Geological Survey and theoretical discharge at Bypass Dam.
Daily mean theoretical discharge and corresponding percent differences at Bypass Dam.
Overall Structure Comparisons
An overall comparison of the theoretical discharge to the USGS discharge for all structures combined was calculated using the average of absolute values of the daily percent differences from each structure (table 4). The average of the absolute values of the percent differences was 18.7 percent. This average represents the overall difference between theoretical discharge and USGS discharge for all 15,441 values.
The daily mean percent differences were compared for each structure in the study (fig. 28). The only negative mean and median percent differences, which indicate that the theoretical discharge is larger than the USGS discharge, were for 02237700 Apopka Beauclair and 02299710 Cow Pen Slough, which also had the largest range of percent differences.
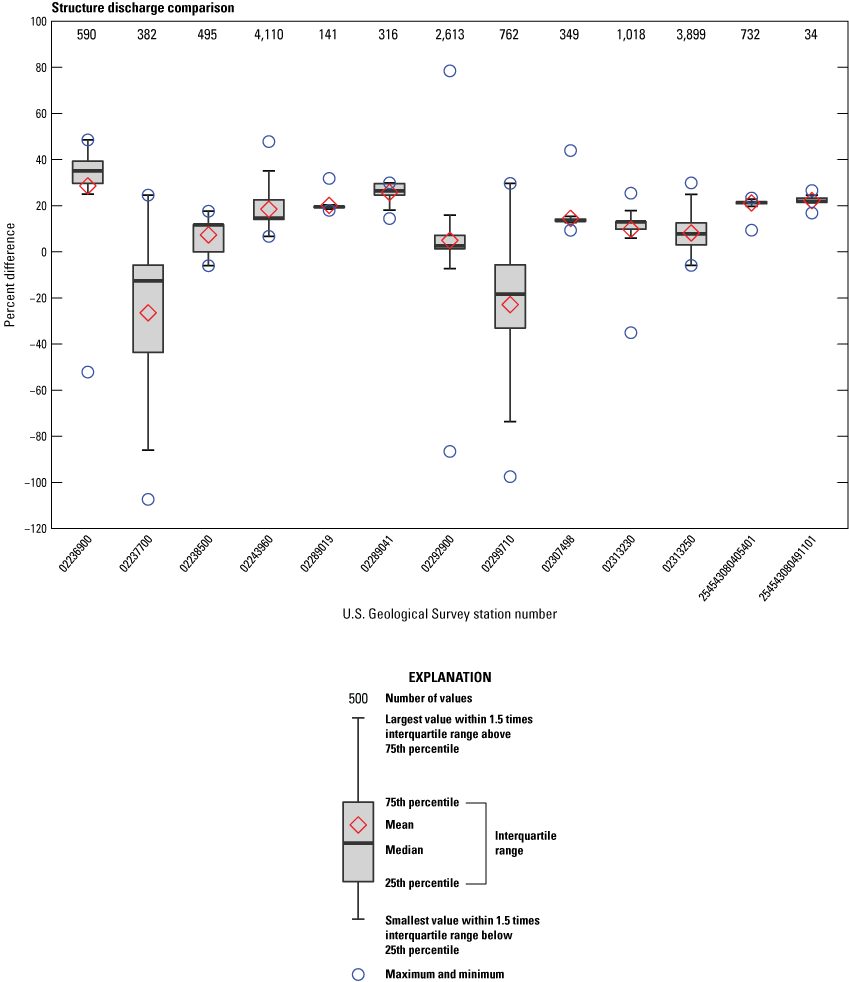
Daily mean percent difference data for all structures compared.
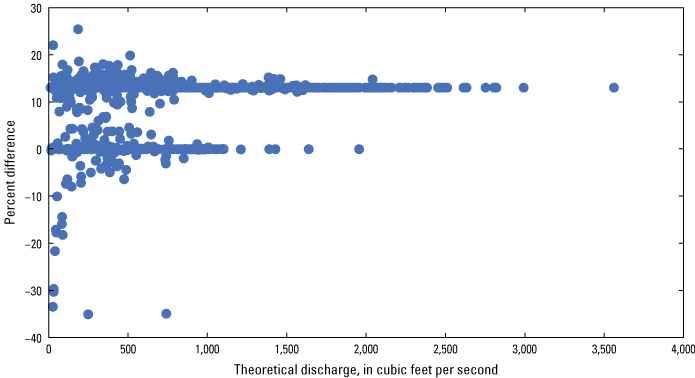
A comparison of all theoretical and USGS discharge values for all structures shows a curvilinear relationship that begins at approximately 1,500 ft3/s (fig. 29). A good fit between the two methods would plot near the one-to-one line. However, the theoretical discharge plotted farther below the line and included more scatter as USGS discharge increased. This figure shows that even though the overall average of the absolute values of the percent differences is 18.7 percent for all structures included in the study, greater percent differences and less confidence may occur for large discharges.
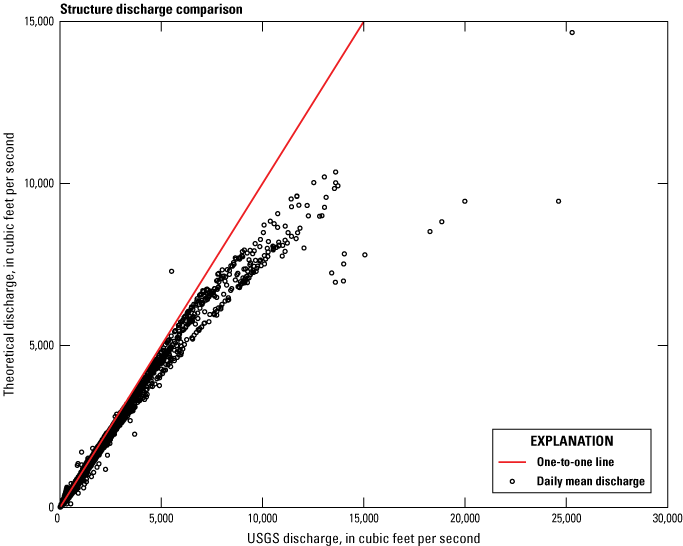
Daily mean theoretical and U.S. Geological Survey (USGS) discharges for all structures compared.
The free orifice flow regime had the largest number of discharge values compared, followed by submerged orifice, free weir, and submerged weir, which only compared 59 values (table 5). Free orifice flow was compared at six structures, submerged orifice at eight structures, free weir at two structures, and submerged weir at one structure.
Table 5.
Number of daily mean discharges compared in each flow regime.[USGS, U.S. Geological Survey; NA, not applicable]
Summary
The U.S. Geological Survey (USGS) calculated discharge at 13 water control structures in Florida using theoretical equations and uncalibrated coefficients gathered from previous studies and typical textbook values for selected flow regimes and structure type. These discharge values were compared to those calculated and published by the USGS from October 1, 2007, to September 30, 2019, using traditional methods and coefficients verified by direct discharge measurements. Comparisons done in this study show percent differences in the ratings and procedures between theoretical and USGS discharge for complete days of flow and not necessarily every day of the study period. Percent differences larger than those shown in this study may have occurred but were not compared because of adjustments made for debris interference, flows spanning multiple regimes on the same day, or USGS values that were estimated. The percent differences were not compared for discharges less than 10 cubic feet per second to avoid large percentages for small actual differences in discharge. The structures compared include a mixture of vertical lift and radial gates with free and submerged conditions for both orifice and weir flow.
On average, the absolute value of percent differences for all structures was 18.7 percent. The average percent differences between the USGS values and those computed using theoretical discharge calculations ranged from −26.5 to 28.6 percent, and four structures had average differences less than 10 percent.
References Cited
Bureau of Reclamation, 2001, Weirs, chap. 7 of Water measurement manual—A water resources technical publication: Bureau of Reclamation: U.S. Department of the Interior, Bureau of Reclamation web page, accessed January 26, 2021, at https://www.usbr.gov/tsc/techreferences/mands/wmm/.
Kennedy, E.J., 1984, Discharge ratings at gaging stations: U.S. Geological Survey Techniques of Water-Resources Investigations, book 3, chap. A10, 59 p. [Also available at https://pubs.usgs.gov/twri/twri3-a10/pdf/TWRI_3-A10.pdf.]
Ryan, P.J., and Hazelbaker, C.L., 2022, Data for the comparison of computed flow through manually operated water control structures in Florida using theoretical versus calibrated coefficients: U.S. Geological Survey data release, https://doi.org/10.5066/P9MHF0GD.
Sanders, C.L., and Feaster, T.D., 2004, Computation of flow through water-control structures using program DAMFLO.2: U.S. Geological Survey Open-File Report 03–473, 109 p. [Also available at https://pubs.usgs.gov/of/2003/ofr03473/.]
Sauer, V.B., and Turnipseed, D.P., 2010a, Stage measurement at gaging stations: U.S. Geological Survey Techniques and Methods, book 3, chap. A7, 45 p. [Also available at https://doi.org/10.3133/tm3A7.]
Sauer, V.B., and Turnipseed, D.P., 2010b, Discharge measurements at gaging stations: U.S. Geological Survey Techniques and Methods, book 3, chap. A8, 87 p. [Also available at https://doi.org/10.3133/tm3A8.]
Tillis, G.M., and Swain, E.D., 1998, Determining discharge-coefficient ratings for selected coastal control structures in Broward and Palm Beach Counties, Florida: U.S. Geological Survey Water-Resources Investigations Report 98–4007, 37 p. [Also available at https://doi.org/10.3133/wri984007.]
U.S. Army Corps of Engineers [USACE], 2020, HEC-RAS River Analysis System hydraulic reference manual: U.S. Army Corps of Engineers CPD–69, Version 6.0 Beta, accessed January 26, 2021, at https://www.hec.usace.army.mil/software/hec-ras/documentation/HEC-RAS_6.0_ReferenceManual.pdf.
U.S. Geological Survey [USGS], 2021, USGS water data for the Nation: U.S. Geological Survey National Water Information System database, accessed March 2021 at https://doi.org/10.5066/F7P55KJN.
For more information about this publication, contact
Director, Caribbean-Florida Water Science Center
U.S. Geological Survey
4446 Pet Lane, Suite 108
Lutz, FL 33559
For additional information, visit
https://www.usgs.gov/centers/car-fl-water
Publishing support provided by
Lafayette Publishing Service Center
Disclaimers
Any use of trade, firm, or product names is for descriptive purposes only and does not imply endorsement by the U.S. Government.
Although this information product, for the most part, is in the public domain, it also may contain copyrighted materials as noted in the text. Permission to reproduce copyrighted items must be secured from the copyright owner.
Suggested Citation
Ryan, P.J., and Hazelbaker, C.L., 2022, Comparison of computed flow through manually operated water control structures in Florida using theoretical versus calibrated coefficients: U.S. Geological Survey Open-File Report 2022–1011, 25 p., https://doi.org/10.3133/ofr20221011.
ISSN: 2331-1258 (online)
Study Area
| Publication type | Report |
|---|---|
| Publication Subtype | USGS Numbered Series |
| Title | Comparison of computed flow through manually operated water control structures in Florida using theoretical versus calibrated coefficients |
| Series title | Open-File Report |
| Series number | 2022-1011 |
| DOI | 10.3133/ofr20221011 |
| Publication Date | March 30, 2022 |
| Year Published | 2022 |
| Language | English |
| Publisher | U.S. Geological Survey |
| Publisher location | Reston, VA |
| Contributing office(s) | Caribbean-Florida Water Science Center |
| Description | Report: vii, 25 p.; Data Release; Dataset |
| Country | United States |
| State | Florida |
| Online Only (Y/N) | Y |