

Mapping Structural Control Through Analysis of Land-Surface Deformation for the Rialto-Colton Groundwater Subbasin, San Bernardino County, California, 1992–2010
Links
- Document: Report (3 MB pdf) , HTML , XML
- Data Release: Data release - Web interface: U.S. Geological Survey National Water Information System web page
- NGMDB Index Page: National Geologic Map Database Index Page (html)
- Download citation as: RIS | Dublin Core
Acknowledgments
The author gratefully acknowledges the San Bernardino Valley Municipal Water District for their cooperation during this study. The author thanks the University NAVSTAR Consortium for allowing free access to continuous Global Positioning System and Synthetic Aperture Radar data and the European Space Agency for their free and open-data policy.
Abstract
The locations of many faults in and near the Rialto-Colton groundwater subbasin are not precisely known because the spatial density of existing lithologic and hydrologic data used to infer the locations of faults can be sparse. The U.S. Geological Survey, in cooperation with the San Bernardino Valley Municipal Water District, analyzed structural control of groundwater flow in and near the Rialto-Colton groundwater subbasin using Interferometric Synthetic Aperture Radar (InSAR) methods. Faults commonly are barriers to groundwater flow, and the high spatial resolution of InSAR imagery can be used to infer the locations of buried faults where groundwater pumping occurs. InSAR results have revealed three areas in and near the Rialto-Colton groundwater subbasin where buried faults are interpreted as groundwater-flow barriers: the northwestern area about 3 miles northwest of the City of Rialto, the San Jacinto fault area west of the City of San Bernardino, and the southeastern area about 2 miles southeast of the City of Colton. The InSAR results were combined with knowledge gained from previous studies to better define the location and extent of faults acting as groundwater-flow barriers. New data about faults acting as groundwater-flow barriers can be incorporated into future conceptual and hydrologic models of the Rialto-Colton groundwater subbasin and provide water managers information to help effectively manage groundwater resources.
Introduction
The Rialto-Colton groundwater subbasin (California Department of Water Resources, 2018; hereafter referred to as “Rialto-Colton subbasin”) is in southern California about 60 miles (mi) east of Los Angeles (fig. 1). The basin is bounded by the San Jacinto fault (SJF) on the northeast, the Rialto-Colton fault (RCF) on the southwest, the San Gabriel Mountains on the northwest, and the Box Springs Mountains on the southeast (Dutcher and Garrett, 1963; Catchings and others, 2008). The semi-arid region has a mild winter and warm summer climate (Dutcher and Garrett, 1963). Historically, irrigated and non-irrigated agriculture was the dominant land-use type, but by the late 1950s, urban development sharply increased and eventually replaced agriculture as the dominant land use. In 1993, about two-thirds of the basin consisted of residential, industrial, and commercial land use (Woolfenden and Koczot, 2001). Local purveyors receive State Water Project water to supplement native groundwater extraction, primarily through artificial recharge (San Bernardino Valley Municipal Water District, 2020).
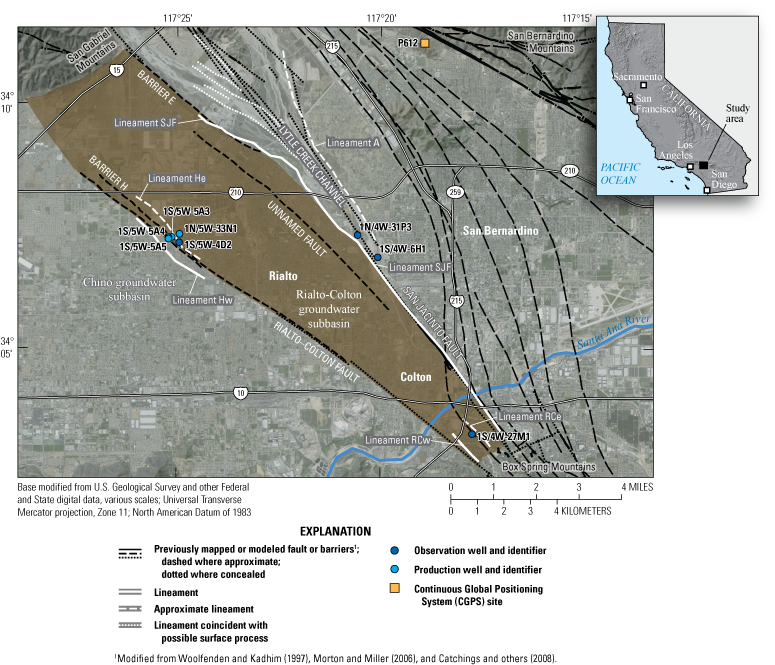
Study area showing selected wells, roads, cities, continuous Global Positioning System (CGPS) site P612, Rialto-Colton groundwater subbasin (shaded), previously mapped faults and barriers (black lines), InSAR detected lineaments (white lines), and other features near the Rialto-Colton groundwater subbasin, San Bernardino County, California. Previously mapped faults and barriers modified from Woolfenden and Kadhim (1997), Morton and Miller (2006), and Catchings and others (2008).
In 1991, the San Bernardino Valley Municipal Water District and the U.S. Geological Survey entered into a cooperative agreement to characterize the groundwater-flow system of the subbasin including the construction of a groundwater-flow model (Woolfenden and Koczot, 2001). The purpose and scope of this report is to map structural controls of groundwater flow in and near the Rialto-Colton subbasin using Interferometric Synthetic Aperture Radar (InSAR) methods for 1992–2010. Structural control information derived from InSAR results is used to improve the understanding of groundwater flow. Spatially detailed InSAR results also can be incorporated into future conceptual and hydrologic models of the Rialto-Colton subbasin and help water managers direct limited resources to areas and maximize the efficacy of future water resources management strategies.
Geohydrologic Setting
The lithology of the Rialto-Colton subbasin consists of Quaternary unconsolidated alluvial deposits, Tertiary to Quaternary partly consolidated continental deposits, Tertiary consolidated continental deposits, and a pre-Tertiary basement complex (Dutcher and Garrett, 1963). The unconsolidated and partly consolidated deposits primarily consist of sand and gravel with interbedded silt and clay, the consolidated deposits consist of clay and compacted sand, and the basement complex consists of igneous and metamorphic rock (Woolfenden and Kadhim, 1997). The region has several northwest-southeast trending faults. Two prominent faults in the region that partially define the areal extent of the Rialto-Colton subbasin are the SJF and the RCF. The SJF is a right-lateral strike-slip fault that has a vertical component (Dutcher and Garrett, 1963); the RCF likely is an abandoned trace of the SJF that vertically offsets the basement complex, where the basement is generally deeper in the Rialto-Colton subbasin than in the neighboring Chino groundwater subbasin (Woolfenden and Kadhim, 1997; California Department of Water Resources, 2018; fig. 1).
The unconfined to partly confined aquifer system consists of four hydraulically connected water-bearing units described by Dutcher and Garrett (1963) and Woolfenden and Kadhim (1997): unconsolidated alluvial deposits and upper, middle, and lower water-bearing zones in the partly consolidated continental deposits. Underlying the water-bearing units are the consolidated Tertiary continental deposits and basement complex which are not considered part of the aquifer system. The complex lithologic and structural framework of the Rialto-Colton subbasin controls groundwater flow in the basin and across boundaries to nearby basins.
Interferometric Synthetic Aperture Radar
Synthetic Aperture Radar (SAR) imagery is produced by reflecting radar signals off a target area and measuring the two-way travel time back to the satellite. The SAR interferometry technique uses two SAR images of the same area acquired at different times and “interferes” (differences) them, resulting in maps called interferograms that show line-of-sight ground-surface displacement (range change) between the two periods. The generation of an interferogram produces amplitude and phase components. Amplitude is the measure of the radar signal intensity returned to the satellite. Amplitude depends on the variable reflective properties of the landscape and shows features such as buildings, roads, mountains, and other reflective features. Phase is proportional to line-of-sight distance from the ground to the satellite (range) and is used to measure land-surface deformation (uplift or subsidence). For example, if the ground has moved away from the satellite (subsidence), an increase in phase is measured (fig. 2). Conversely, if the ground has moved closer to the satellite (uplift), a decrease in phase is measured. Interferograms contain phase values that repeat from 0 to 2 pi (a sine wave) and are termed “wrapped” interferograms because each time the data reach 2 pi, the values “wrap” back to zero. The wrapped interferograms in this study consist of bands of repeating color cycles where one complete cycle of color equates to approximately 1.1 inches (in.) of relative range (phase) change (fig. 2).
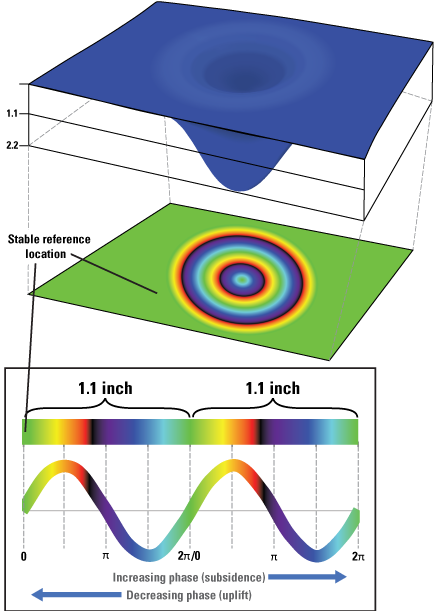
Illustration of how to read and interpret a generalized interferogram. The first step is to select a stable reference location, ideally where the phase is stable. Then, determine the number of color cycles between the selected reference location and a selected area of interest, where each complete cycle of colors is 1.1 inches (in.) of relative range change (land deformation). To determine if the deformation is uplift or subsidence, follow the progression of colors on the color bar: green to yellow (left to right) is subsidence; green to cyan (right to left) is uplift. In this illustration, two complete (left to right) cycles of colors from the outer circumference to the center of the “bull’s-eye” are shown, thus 2.2 in. of subsidence (or 4-pi worth of range change) is represented.
Interferograms in this study achieved a spatial resolution of approximately 100 feet (ft) because a 100-ft resolution digital elevation model was used for georeferencing and terrain corrections during processing. The SAR satellites used in this report “look” to the side at an average angle of about 23 degrees from vertical, which means that values of range change are about 92 percent of vertical elevation change. Interferograms in this study are presented in relative line-of-site range change because (1) the additional processing necessary to convert to vertical elevation change (“unwrapping”) can introduce spatially dependent errors that can negatively affect the identification of lineaments and (2) vertical magnitudes are not required to map structural control. Interferogram quality is dependent on topography, satellite orbit geometry, land-use practices, and other factors. For example, interferograms in areas of high topographic relief can produce excessive topographic effects that can mask land-surface deformation, and less than optimal satellite orbit geometry can exaggerate this error. Additionally, densely forested areas tend to absorb or reflect the radar signals from various depths in the tree canopy, resulting in random signal noise in those locations. In contrast, areas with low topographic relief and consistently uniform surfaces like the largely urban Rialto-Colton subbasin, or sparsely vegetated areas generally produce higher signal quality because the previously discussed error sources are minimized. Sneed and Brandt (2020) describe InSAR methodology in more detail.
For this study, SAR data from the European Space Agency’s (ESA; https://www.esa.int/) European Remote-Sensing 1 and 2 (ERS1 and ERS2) satellites (1992–2000) and from ESA’s ENVIronmental SATellite (ENVISAT) satellite (2003–10) were acquired from the University NAVSTAR Consortium (2013) for InSAR analysis. There were 31 ERS (ERS1 and ERS2 combined) and 35 ENVISAT interferograms that were of suitable quality to be used in the analysis. Interferograms spanned various periods during September 1992 and May 2010, with time spans ranging from about 1 month to about 4 years. Four representative interferograms are presented in this report (two ERS and two ENVISAT).
Mapping Structural Control of Groundwater Flow
In unconsolidated or partly consolidated basins like the Rialto-Colton subbasin, faults commonly are barriers to groundwater flow caused by the juxtaposition of deposits of differing compressibilities (such as consolidated rocks against unconsolidated deposits) or from the displacement of preferential flow paths in water-bearing deposits (Galloway and others, 1999). The locations of groundwater-flow barriers can be inferred where groundwater pumping occurs in compressible deposits and causes the aquifer system to compact or expand at differing amounts across the barrier. The high spatial resolution of interferograms can be used to infer the locations of buried faults not readily evident on the surface by identifying lineaments in the interferogram (Sneed and others, 2014). In the context of this report, lineaments are linear or partially linear features in interferograms that truncate land-surface deformation caused by the differential compaction or expansion of the aquifer system. Greater deformation rates from groundwater pumping facilitate a more robust identification of lineaments because the differential subsidence or uplift on either side of the groundwater-flow barrier is more pronounced. In the Rialto-Colton subbasin, periods of groundwater-level decline generally correlate with subsidence (aquifer-system compaction), and periods of groundwater-level recovery generally correlate with uplift (aquifer-system expansion; figs. 3, 4, 5).
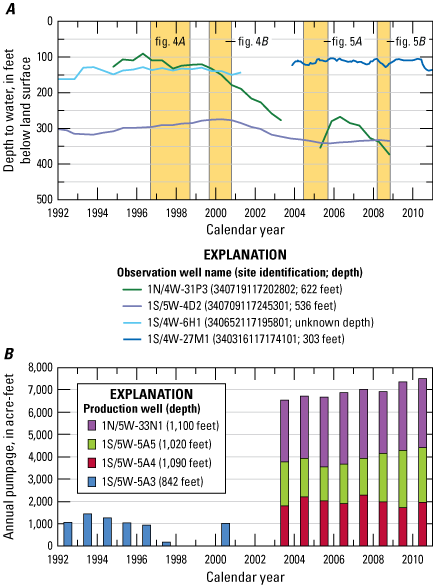
A, Depth to water in selected USGS observation wells for 1992–2010 and periods for interferograms shown in figures 4 and 5; B, annual pumpage at selected production wells for 1992–2010, Rialto-Colton groundwater subbasin, San Bernardino County, California. Groundwater level data are available from U.S. Geological Survey (2014b) and pumpage data are compiled by Water Master Support Services (2010). Well locations are shown in figure 4.
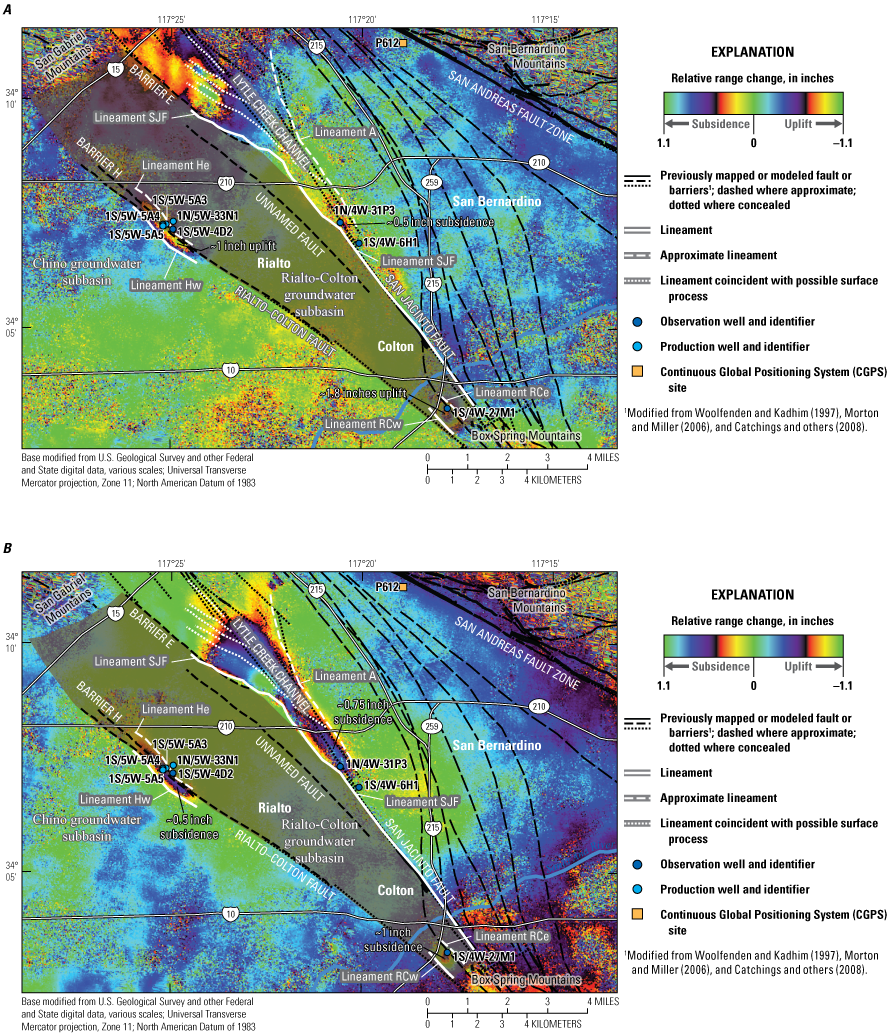
Selected wells, roads, cities, continuous Global Positioning System (CGPS) site P612, Rialto-Colton groundwater subbasin (shaded), previously mapped faults and barriers (black lines), and InSAR-detected lineaments (white lines) on interferograms for A, September 9, 1996–September 14, 1998; and B, August 30, 1999–October 23, 2000 (includes the magnitude 7.1 Hector Mine earthquake from October 16, 1999, discussed in text), Rialto-Colton groundwater subbasin, San Bernardino County, California. Previously mapped faults and barriers modified from Woolfenden and Kadhim (1997), Morton and Miller (2006), and Catchings and others (2008).
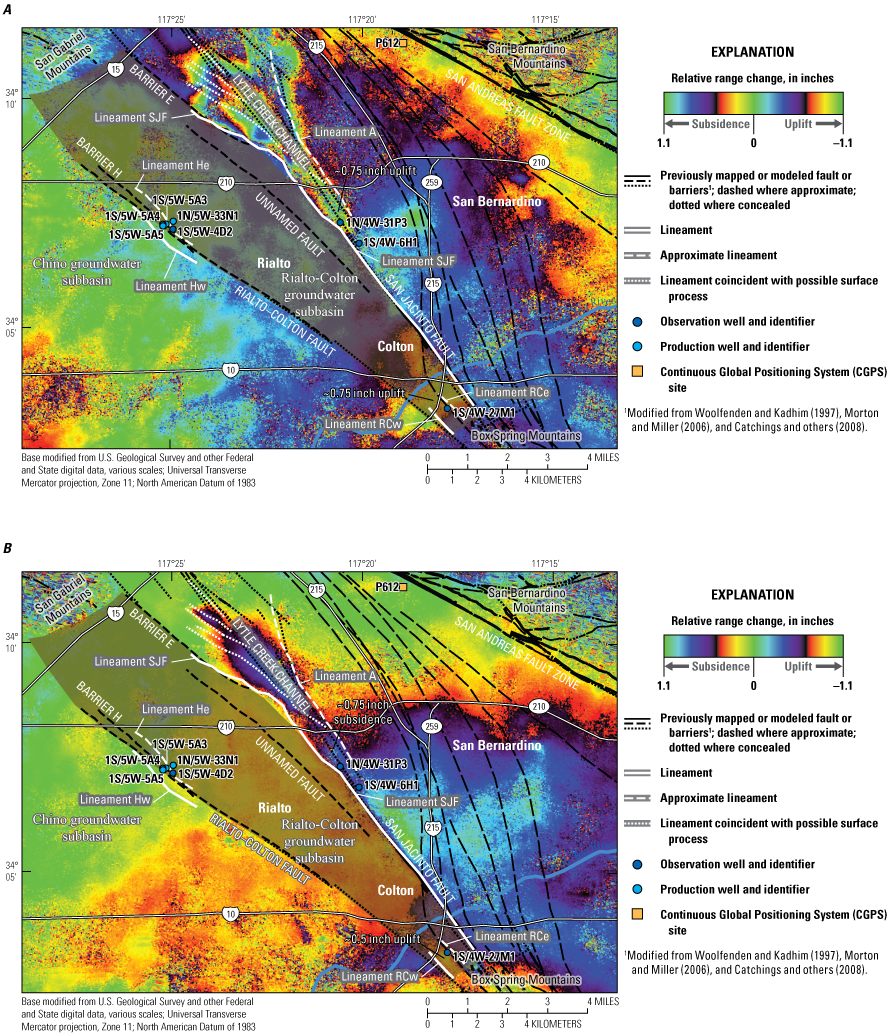
Selected wells, roads, cities, continuous Global Positioning System (CGPS) site P612, Rialto-Colton groundwater subbasin (shaded), previously mapped faults and barriers (black lines), and InSAR detected lineaments (white lines) on interferograms for A, June 14, 2004–September 12, 2005; and B, March 10, 2008–November 10, 2008, Rialto-Colton groundwater subbasin, San Bernardino County, California. Previously mapped faults and barriers modified from Woolfenden and Kadhim (1997), Morton and Miller (2006), and Catchings and others (2008).
Identification of Lineaments in Interferograms
InSAR results have identified three areas in and near the Rialto-Colton subbasin where lineaments are interpreted as buried faults acting as groundwater-flow barriers: (1) the northwestern area about 3 mi northwest of the City of Rialto, (2) the San Jacinto fault area west of the City of San Bernardino, and (3) the southeastern area about 2 mi southeast of the City of Colton. These areas where lineaments were identified are generally suitable for InSAR analysis because the areas where deformation was detected are fairly flat and largely urban. Some of the areas where lineaments were identified also are proximal to known groundwater production wells (figs. 1, 3, 4), and each area generally is near previously mapped faults. The names of lineaments identified in this report are generally based on the names of nearby barriers or faults identified in previous reports. For example, Lineament Hw is west of Barrier H (Woolfenden and Kadhim, 1997) and Lineament SJF is near the San Jacinto fault (Morton and Miller, 2006).
Northwestern Area
-
• The northwestern area contained a “dog leg” shaped deformation feature that measured about 2 mi by 0.5 mi and was truncated by lineaments to the southwest (Lineament Hw) and northeast (Lineament He; fig. 4).
-
• Within this “dog leg” shaped feature, between 0.5 in. subsidence and 1 in. uplift was observed for various periods during 1992–2000 (fig. 4), and deformation was not observed during 2003–10 (fig. 5).
-
• Lineaments He and Hw (and the deformation that facilitated their identification) were prominent in most interferograms used in this study from 1992 and 2000 (fig. 4) but were absent in interferograms that span 2003–10 (fig. 5).
-
• Lineaments He and Hw fully truncated deformation in most interferograms during 1992–2000, indicating these lineaments likely acted as strong barriers to groundwater flow.
-
• The locations and orientations of Lineament Hw and the northwest part of Lineament He indicate they likely are previously unmapped splays of Barrier H (Woolfenden and Kadhim, 1997), and the Rialto-Colton fault zone as reported by Anderson and others (2004) and Catchings and others (2008).
-
• Pumping records from selected production wells indicated the annual groundwater pumpage increased greatly between 1992–2000 and 2003–10. Pumping increased from less than 1,500 acre-feet per year (acre-ft/yr) in a single well (1S/5W-5A3) during the first period, to more than 6,500 acre-ft/yr distributed among three nearby wells (15/5W-5A4, -5A5, and -33N1) that penetrated deeper into the aquifer system during the second period (fig. 3B). A nearby observation well (1S/5W-4D2) indicated groundwater levels declined more than 60 ft from the earlier period to the later period of increased pumping (fig. 3A).
-
• The semi-rectangular pixelated area (uncorrelated InSAR signal returns) immediately north of Lineament He that appeared in some interferograms (figs. 4B, 5A) was coincident with the urban grid structure and was interpreted to be unrelated to pumping-induced deformation.
San Jacinto Fault Area
-
• The San Jacinto fault area contained a wedge-shaped deformation feature that measured about 6 mi by 2 mi and was fully or partially truncated by lineaments to the southwest (Lineament SJF), and to the northeast (Lineament A on the northeast edge of the Lytle Creek channel; fig. 5).
-
• Within this wedge-shaped feature, between 0.5 and 1 in. of subsidence was observed for various periods during 1992–2000, and between 0.75 in. of subsidence and 0.75 in. of uplift was observed for various periods during 2003–10 (figs. 4, 5).
-
• Lineaments A and SJF (and the deformation that facilitated their identification) were prominent in most of the 66 interferograms used in this study from 1992 to 2010.
-
• Lineament SJF fully truncated deformation in most of the interferograms from 1992 to 2010, indicating Lineament SJF likely was a strong barrier to groundwater flow.
-
• Lineament A fully truncated deformation in some interferograms, but deformation crossed this lineament in other interferograms, indicating Lineament A likely acted as a partial barrier to groundwater flow (figs. 4B, 5A).
-
• The location and orientation of Lineament SJF indicate that it can be interpreted as the San Jacinto fault, and that Barrier E (Woolfenden and Kadhim, 1997) likely is an extension of the San Jacinto fault (Morton and Miller, 2006; figs. 4B, 5).
-
• The location and orientation of Lineament A is similar to the location and orientation of previously mapped faults in the Lytle Creek Channel (Morton and Miller, 2006).
-
• Available observation well data indicate groundwater levels generally declined during at least some of the period of study where subsidence is measured (for example, well 1N/4W-31P3, figs. 3A, 4A). Subsidence was not measured where groundwater-level declines were less pronounced (for example, well 1S/4W-6H1, figs. 3A, 4B).
-
• Additional lineaments in the Lytle Creek channel (fig. 4A) likely were partially related to erosional and depositional processes or stream recharge (Lu and Danskin, 2001) but also coincide with mapped faults (Morton and Miller, 2006).
Southeastern Area
-
• The southeastern area contained a semi-circular shaped deformation feature that measured about 0.6 mi by 0.5 mi and was fully or partially truncated by lineaments to the southwest (Lineament RCw) and northeast (Lineament RCe, fig. 4).
-
• Within this semi-circular shaped feature, between 1 in. of subsidence and 1.8 in. of uplift was observed for various periods during 1992–2000, and between about 0.5 and 0.75 in. of uplift was observed during 2003–10 (figs. 4, 5).
-
• Lineaments RCw and RCe (and the deformation that facilitated their identification) were prominent in most of the 66 interferograms used in this study during 1992–2010.
-
• Lineament RCw fully truncated deformation in most interferograms during 1992–2010 (fig. 4A), indicating this lineament likely acted as a strong barrier to groundwater flow. Lineament RCe fully truncated deformation in some interferograms (for example fig. 4B), but deformation crossed this lineament in others (for example, the blue/purple colors immediately northeast of Lineament RCe, fig. 4A), indicating this lineament likely acted as a partial barrier to groundwater flow.
-
• The location and orientation of Lineament RCw was similar to a segment of the Rialto-Colton fault (Morton and Miller, 2006). Lineament RCe was consistent with the path of the unnamed fault (if extended to the southeast) described in Woolfenden and Kadhim (1997) and was nearly coincident with a modeled fault described in Catchings and others (2008).
-
• Available observation well data indicate groundwater levels generally did not vary substantially during 2003–10; however, groundwater levels increased about 9 ft during 2004–05 when about 0.75 in. of uplift was measured (well 1S/4W-27M1, figs. 3A, 5A).
Differentiating Pumping-Induced Deformation from Tectonic Deformation
Pumping-induced deformation (aquifer-system compaction) and tectonic-induced deformation is differentiated qualitatively. The regional deformation associated with long-term tectonic plate movement and earthquakes can be differentiated from the localized deformation caused by pumping because tectonic motions cause deformation over a relatively large area (Massonnet and others, 1993) compared with the relatively localized deformation typically associated with pumping (Bawden and others, 2003).
The continuous Global Positioning System (CGPS) site P612 (University NAVSTAR Consortium, 2014) is in the foothills of the San Bernardino Mountains (fig. 1) and was used to help differentiate vertical deformation caused by long-term tectonic plate movement from displacements caused by localized pumping. Day-to-day CGPS vertical deformation measurements varied by up to 2 in. or more, which likely is the result of variable atmospheric moisture, electronic noise, and other effects not directly related to land-surface-deformation (Zerbini and others, 2001; Williams and others, 2004; Langbein, 2008). To minimize this high-frequency noise, a 31-day moving average was applied to the CGPS vertical deformation measurements. The removal of day-to-day variations in the CGPS measurements did not remove seasonal or long-term deformation trends and permitted more meaningful land-surface deformation measurements (fig. 6).
During 2005–10, CGPS site P612 did not record substantial, longer-term (annual to multi-annual) vertical land-surface deformation (fig. 6). Shen and others (2011) identified up to about 0.04 inches per year (in/yr) of tectonic uplift along the Transverse Ranges during 1970–2004 where the San Bernardino Mountains are located. However, Shen and others (2011) did not indicate substantial longer-term, vertical land-surface deformation during 1970–2004 in the area immediately southwest of the San Andreas fault zone near the location of site P612 (fig. 4). Therefore, tectonic uplift in the Transverse Ranges did not contribute substantially to CGPS-measured vertical land-surface deformation and is unlikely to adversely affect InSAR measurements in the study area.
Data from the U.S. Geological Survey Earthquake Hazards Program (U.S. Geological Survey, 2014a) indicated about 100 earthquakes ranging from Magnitude (M) 4.5 to M 7.3 occurred less than 100 mi from the study area during 1992–2010. Seven of these earthquakes, ranging from M 4.5 to M 5.5, occurred during the operational history of site P612 (2005–10) and had no appreciable effect on vertical deformation measured at the site (fig. 6). Therefore, earthquakes of up to M 5.5 likely did not adversely affect InSAR analyses in this study. Six interferograms used in this study included either the January 17, 1994, Northridge (M 6.7) earthquake or the October 16, 1999, Hector Mine (M 7.1) earthquake (fig. 4B). Although these larger earthquakes predate the installation of site P612, the observed deformation patterns and lineaments in these interferograms are consistent with other interferograms used in this study that do not span large earthquakes.
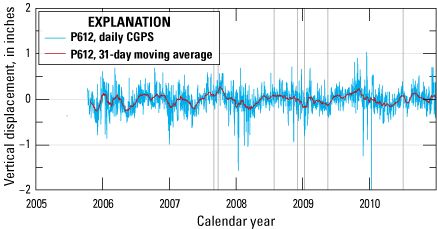
Vertical deformation as measured from continuous Global Positioning System (CGPS) site P612 with a calculated 31-day moving average. Vertical lines indicate occurrences of earthquakes of at least Magnitude 4.5 that occurred within about 75 miles of the City of Rialto during the operational history of the CGPS site. Location of CGPS site P612 shown in figure 1. Continuous Global Positioning System data acquired from the University NAVSTAR Consortium (2014).
Correlation of Changes in Pumping, Groundwater Levels, and Deformation
In the northwestern area, data from selected production and observation wells indicated that changes in pumping correspond, in part, with changes in groundwater levels in nearby wells, and these changes in groundwater levels correlated with observed deformation patterns. For example, pumping records for production well 1S/5W-5A3 during 1996–98 indicate a nearly 1,000 acre-feet (acre-ft) reduction in pumping volume, which corresponded to about 10 ft of groundwater-level increases in nearby observation well 1S/5W-4D2 and about 1 in. of uplift for the same period (figs. 3, 4A). During 1999–2000, pumping was increased by about 1,000 acre-ft at production well 1S/5W-5A3, which corresponded to about 2 ft of groundwater-level decline in the nearby observation well (1S/5W-4D2) and about 0.5 in. of subsidence for the same period (figs. 3, 4B). However, from 2003 to 2010, changes in pumping are not as well correlated with changes in nearby groundwater levels. Production well 1N/5W-33N1 showed an increase of nearly 350 acre-ft in pumping volume, but nearby observation well 1S/5W-4D2 showed nearly 10 ft of groundwater-level decline. Furthermore, nearby production wells 1S/5W-5A4 and 1S/5W-5A5 each indicated about 200 acre-ft of reduced pumping volume (fig. 3B). Land-surface deformation was not observed in this area during 2003–10 despite the increase in total pumping (fig. 3B). The two production wells (1N/5W-33N1 and 1S/5W-5A3) that appear to partially influence groundwater levels in observation well 1S/5W-4D2 are northeast of Barrier H, whereas production wells (1N/5W-5A4 and 1S/5W-5A5) with the least influence on observation well 1S/5W-4D2 are southwest of Barrier H (fig. 1). As noted earlier in this report, the three production wells being used during the second period of this study (2003–10; 1N/5W-5A4, 1S/5W-5A5, and 1N/5W-33N1) penetrate deeper into the aquifer system than the single production well used during the first period of this study (1992–2000). The increase in total groundwater pumping and lack of observed subsidence in this area during the second period (2003–10) indicated that the location (relative to mapped groundwater barriers or lineaments) or the depth of pumping during this time was not sufficient to create conditions in which lineaments can be readily identified in interferograms and indicated that pumping during this later time may have occurred in less compressible deposits.
In the San Jacinto fault area, pumping data were not available; however, changes in groundwater levels in observation wells generally correlated with observed deformation patterns. Groundwater levels at well 1N/4W-31P3 decreased between 12 and 45 feet during 1996–98 and 1999–2000, where between 0.5 and 0.75 in. of subsidence was observed, respectively. Data from observation well 1N/4W-31P3 also indicated groundwater levels increased about 75 ft during 2005, whereas interferograms that also spanned 2005 show about 0.75 in. of uplift (figs. 3A, 5A). Groundwater levels at well 1S/4W-6H1 were relatively stable during 1996–2001 (compared to groundwater levels at the nearby well 1N/4W-31P3), and substantial deformation did not occur at this location during a similar period (figs. 3A, 4).
In the southeastern area, groundwater-pumping data were not available, and the correlation between changes in available groundwater levels and observed land-surface deformation was less clear. Groundwater levels at well 1S/4W-27M1 increased about 9 ft during 2004–05, and about 0.75 in. of uplift was observed (figs. 3A, 5A). However, land-surface deformation observed during 2004–05 (fig. 5A) was distinct from land-surface deformation observed in most of the other interferograms (1992–2010) used in this study (fig. 5B). Therefore, observed land-surface deformation patterns were not strongly influenced by changes in groundwater levels at observation well 1S/4W-27M1.
Summary
The U.S. Geological Survey, in cooperation with the San Bernardino Valley Municipal Water District, analyzed structural control of groundwater flow in the Rialto-Colton groundwater subbasin using Interferometric Synthetic Aperture Radar (InSAR) methods. The high spatial resolution of InSAR imagery revealed three areas in and near the Rialto-Colton groundwater subbasin where buried faults are interpreted as groundwater-flow barriers where groundwater pumping occurs. Groundwater-flow barriers were detected in InSAR imagery for the San Jacinto fault area and the southeastern area during 1992–2010. Groundwater-flow barriers were detected in InSAR imagery for the northwestern area during 1992–2000 and absent in InSAR imagery during 2003–10 when deformation was not detected. Available pumping records at selected wells in the northwestern area indicated the amount of groundwater extracted in this area increased greatly after 2002 and was being pumped from a deeper part of the aquifer. The absence of InSAR-detected lineaments (and the deformation that facilitated their identification) in this area during 2003–10 indicated that the location (relative to mapped groundwater barriers or lineaments) or the depth of pumping during this time was not sufficient to create conditions in which lineaments can be readily identified in interferograms and indicated that pumping during this later period may have occurred in less-compressible deposits.
The locations of many faults in and near the Rialto-Colton groundwater subbasin are not precisely known. Traditional geologic mapping techniques and modeling studies have identified (or inferred) numerous faults acting as groundwater barriers; however, traditional methods rely in part on the spatial density of existing lithologic and hydrologic data to infer the locations of faults acting as groundwater barriers. The high spatial resolution of InSAR data combined with the knowledge gained from previous studies were used to more precisely define the location and extent of faults acting as groundwater barriers. This increase in precision will inform development of better conceptual and hydrologic models of the Rialto-Colton groundwater subbasin.
References Cited
Anderson, M., Matti, J., and Jachens, R., 2004, Structural model of the San Bernardino basin, California, from analysis of gravity, aeromagnetic, and seismicity data: Journal of Geophysical Research, v. 109, no. B4, 24 p., accessed April 9, 2015, at https://doi.org/10.1029/2003JB002544.
Bawden, G.W., Sneed, M., Stork, S.V., and Galloway, D.L., 2003, Measuring human-induced land subsidence from space: U.S. Geological Survey Fact Sheet 069–03, 4 p. [Available at https://doi.org/10.3133/fs06903.]
California Department of Water Resources, 2018, ArcGIS REST Services directory, SMGA Data Viewer: California Department of Water Resources website, accessed March 23, 2022, at https://gis.water.ca.gov/arcgis/rest/services/Geoscientific/i08_B118_CA_GroundwaterBasins/FeatureServer.
Catchings, R.D., Rymer, M.J., Goldman, M.R., Gandhok, G., and Steedman, C.E., 2008, Structure of the San Bernardino Basin along two seismic transects—Rialto-Colton Fault to the San Andreas Fault and along the I-215 Freeway (I-10 to SR30): U.S. Geological Survey Open-File Report 2008–1197, 70 p., accessed March 21, 2018, at https://doi.org/10.3133/ofr20081197.
Dutcher, L.C., and Garrett, A.A., 1963, Geologic and hydrologic features of the San Bernardino area, California; with special reference to underflow across the San Jacinto fault: U.S. Geological Survey Water-Supply Paper 1419, 114 p., accessed May 15, 2017, at https://doi.org/10.3133/wsp1419.
Galloway, D.L., Jones, D.R., and Ingebritsen, S.E., eds., 1999, Land subsidence in the United States: U.S. Geological Survey Circular 1182, 175 p. [Available at https://doi.org/10.3133/cir1182.]
Langbein, J., 2008, Noise in GPS displacement measurements from Southern California and Southern Nevada: Journal of Geophysical Research, v. 113, no. B5, 12 p. [Available at https://doi.org/10.1029/2007JB005247.
Lu, Z., and Danskin, W.R., 2001, InSAR analysis of natural recharge to define structure of a ground-water basin, San Bernardino, California: Geophysical Research Letters, v. 28, no. 13, p. 2661–2664, accessed April 9, 2015, at https://doi.org/10.1029/2000GL012753.
Massonnet, D., Rossi, M., Carmona, C., Adragna, F., Peltzer, G., Feigl, K., and Rabaute, T., 1993, The displacement field of the Landers earthquake mapped by radar interferometry: Nature, v. 364, p. 138–142, accessed July 20, 2020, at https://doi.org/10.1038/364138a0.
Morton, D.M., and Miller, F.K., 2006, Geologic map of the San Bernardino and Santa Ana 30’ x 60’ quadrangles, California, with digital preparation by Cossette, P.M., and Bovard, K.R.: U.S. Geological Survey Open-File Report 2006–1217, scale 1:100,000, 199 p. [Available at https://doi.org/10.3133/ofr20061217.]
San Bernardino Valley Municipal Water District, 2020, San Bernardino Valley Municipal Water District website, accessed July 20, 2020, at https://www.sbvmwd.com/home.
Shen, Z.-K., King, R.W., Agnew, D.C., Wang, M., Herring, T.A., Dong, D., and Fang, P., 2011, A unified analysis of crustal motion in Southern California, 1970–2004—The SCEC crustal motion map: Journal of Geophysical Research, v. 116, no. B11, 19 p., accessed April 24, 2020, at https://doi.org/10.1029/2011JB008549.
Sneed, M., and Brandt, J.T., 2020, Detection and measurement of land subsidence and uplift using Global Positioning System surveys and interferometric synthetic aperture radar, Coachella Valley, California, 2010–17: U.S. Geological Survey Scientific Investigations Report 2020–5093, 74 p. [Available at https://doi.org/10.3133/sir20205093.]
Sneed, M., Brandt, J.T., and Solt, M., 2014, Land subsidence, groundwater levels, and geology in the Coachella Valley, California, 1993–2010: U.S. Geological Survey Scientific Investigations Report 2014–5075, 62 p. [Available at https://doi.org/10.3133/sir20145075.]
University NAVSTAR Consortium, 2013, Web interface: Seamless SAR Archive (SSARA) Federated Web Service, accessed June 21, 2021, at https://web-services.unavco.org/brokered/ssara/gui.
University NAVSTAR Consortium, 2014, File Transfer Protocol interface: Continuous Global Positioning System data archive, accessed October 20, 2014, at ftp://data-out.unavco.org/pub/products/position/P612/.
U.S. Geological Survey, 2014a, Web interface: U.S. Geological Survey Earthquake Hazards Program web page, accessed October 20, 2014, at https://earthquake.usgs.gov/earthquakes/search/.
U.S. Geological Survey, 2014b, Web interface: U.S. Geological Survey National Water Information System web page, accessed June 11, 2014, at https://doi.org/10.5066/F7P55KJN.
Water Master Support Services, 2010, Watermaster annual report: Water Master Support Services, accessed September 30, 2010, at https://www.wmwd.com/294/Western-San-Bernardino-Annual-Reports.
Williams, S.D.P., Bock, Y., Fang, P., Jamason, P., Nikolaidis, R.M., Prawirodirdjo, L., Miller, M., and Johnson, D.J., 2004, Error analysis of continuous GPS position time series: Journal of Geophysical Research, v. 109, no. B3, 19 p. [Available at https://doi.org/10.1029/2003JB002741.]
Woolfenden, L.R., and Kadhim, D., 1997, Geohydrology and water chemistry in the Rialto-Colton Basin, San Bernardino County, California: U.S. Geological Survey Water Resources Investigations Report 1997–4012, 101 p., accessed May 12, 2017, at https://doi.org/10.3133/wri974012.
Woolfenden, L.R., and Koczot, K.M., 2001, Numerical simulation of groundwater flow and assessment of the effects of artificial recharge in the Rialto-Colton Basin, San Bernardino, California: U.S. Geological Survey Water Resources Investigations Report 2000–4243, 148 p., accessed June 11, 2019, at https://doi.org/10.3133/wri20004243.
Zerbini, S., Richter, B., Negusisi, M., Romagnoli, C., Simon, D., Domenichini, F., and Schwahn, W., 2001, Height and gravity variations by continuous GPS, gravity, and environmental parameter observations in the southern Po Plain, near Bologna, Italy: Earth and Planetary Science Letters, v. 192, no. 3, p. 267–279. [Available at https://doi.org/10.1016/S0012-821X(01)00445-9.]
Conversion Factors
U.S. customary units to International System of Units
Datum
Horizontal coordinate information is referenced to the Universal Transverse Mercator projection Zone 11; North American Datum of 1983 (NAD 83).
For more information concerning the research in this report, contact the
Director, California Water Science Center
U.S. Geological Survey
6000 J Street, Placer Hall
Sacramento, California 95819
Publishing support provided by the U.S. Geological Survey
Science Publishing Network, Sacramento Publishing Service Center
Disclaimers
Any use of trade, firm, or product names is for descriptive purposes only and does not imply endorsement by the U.S. Government.
Although this information product, for the most part, is in the public domain, it also may contain copyrighted materials as noted in the text. Permission to reproduce copyrighted items must be secured from the copyright owner.
Suggested Citation
Brandt, J.T., 2022, Mapping structural control through analysis of land-surface deformation for the Rialto-Colton groundwater subbasin, San Bernardino County, California, 1992–2010: U.S. Geological Survey Open-File Report 2022–1030, 11 p., https://doi.org/10.3133/ofr20221030.
ISSN: 2331-1258 (online)
Study Area
| Publication type | Report |
|---|---|
| Publication Subtype | USGS Numbered Series |
| Title | Mapping structural control through analysis of land-surface deformation for the Rialto-Colton groundwater subbasin, San Bernardino County, California, 1992–2010 |
| Series title | Open-File Report |
| Series number | 2022-1030 |
| DOI | 10.3133/ofr20221030 |
| Publication Date | July 29, 2022 |
| Year Published | 2022 |
| Language | English |
| Publisher | U.S. Geological Survey |
| Publisher location | Reston, VA |
| Contributing office(s) | California Water Science Center |
| Description | Report: vi, 11 p.; Data Release |
| Country | United States |
| State | California |
| County | San Bernardino County |
| Other Geospatial | Rialto-Colton groundwater subbasin |
| Online Only (Y/N) | Y |