

Distribution and Demography of Coastal Cactus Wrens in Southern California, 2015–19
Links
- Document: Report (4 MB) , HTML , XML
- Data Releases:
- Surveys and Monitoring of Coastal Cactus Wren in Southern San Diego County
- USGS data release - Cactus Wren Invertebrate Diet Derived from Sequencing of Nestling Fecal Samples in San Diego County, California
- Download citation as: RIS | Dublin Core
Acknowledgments
This research was funded by the San Diego Association of Governments. The authors thank the biologists who assisted in data collection for this project: Lisa Allen, Annabelle Bernabe, Trevin Braun, PJ Falatek, Collin Farmer, Aaron Gallagher, Katie Hall, Scarlett Howell, Jennifer Jacobs, and Michelle Treadwell. Amy Vandergast provided results of fecal analysis and advice on prey analyses. We thank the land managers, property owners, and other stakeholders who facilitated access to the survey and monitoring plots, including but not limited to: Pete Famolaro (Sweetwater Authority), John Martin (San Diego National Wildlife Refuge), Steve Geitz, Kira Haley, and Debbie Lundy (Helix Water District), Michael Galloway and Kim Smith (California Department of Transportation), Troy Goodenough and Jeff Sykes (San Diego Gas and Electric Company), Richard A. Ryals (City of Chula Vista), Trish Smith (The Nature Conservancy), Brian Canaris (Otay Project Limited Partnership), Jason Allen, John Barone, Viviana Castellon, Andrew Field, Niki McGinnis, Betsy Miller, Herman Parker, Kim Roeland, Richard Trisby, and Kim Wehinger (City of San Diego), Louis Chertkow, David Collins, Roger Covalt, Megan Hamiliton, Joshua Lambdin, Erica Mills, Mary Neiz, Robert Piazza, Jennifer Price, Marc Pumpkinthief, Lauren Raduc, Mika Shamada-Cicirelli, James Stowers, Maryanne Vancio, Michael Verderber, and Chris Zirkle (San Diego County Parks and Recreation), Tracie Nelson (California Department of Fish and Wildlife), Jason Forga and Emmanuel Gaviola (San Diego County Department of General Services), Jodi Casstillo, Pastor Dan Grant, and Tylene Howarter (Skyline Church), Cindy Dunn (City of San Diego Real Estate Department, Airports Division) Charlie de la Rosa (Safari Park), Brock Ortega (Dudek), Phil Clark, Mary Miner, and Jim Merzbacher. We are grateful for statistical assistance from Shannon Mendia and Rob Klinger, logistical assistance from Ryan Pottinger, and report review by Kristine Preston and Trish Smith.
Executive Summary
Surveys and monitoring for the coastal Cactus Wren (Campylorhynchus brunneicapillus) were completed in San Diego County between March 2015 and July 2019. A total of 383 plots were surveyed across 3 genetic clusters (Otay, Lake Jennings, and Sweetwater/Encanto). From 2015 to 2019, 317 plots were surveyed 8 times (twice per year in 2015, 2017–19). Additional plots were added in later years as wrens were discovered in new locations. We found differences in the proportion of plots occupied in the genetic clusters, with a lower proportion of plots occupied in the Otay cluster than in the Lake Jennings and Sweetwater/Encanto clusters in all years. Plot occupancy increased each year in the Otay and Sweetwater/Encanto clusters but not in the Lake Jennings cluster. The number of Cactus Wren territories increased from 2015 through 2018, and then decreased in 2019 in all three genetic clusters.
We monitored nesting activities for two populations of Cactus Wrens in southern San Diego County. The Otay population consisted of two sites within the Otay genetic cluster, and the San Diego population consisted of two sites within the Sweetwater/Encanto and Lake Jennings genetic clusters. Nest monitoring occurred at 10–13 territories per year in the Otay population and 14–18 territories in the San Diego population from 2015 through 2019. All territories were occupied by pairs except two territories in 2015, five in 2016, and two in 2019. Between 46 and 74 Cactus Wren nests were monitored each year, which totaled 295 monitored nests from 2015 to 2019. To evaluate the direct influence of precipitation on breeding success, bio-year precipitation (“precipitation”) was calculated from July 1 of the prior year through June 30 of the breeding season year. Overall apparent nest success was positively influenced by precipitation with the lowest apparent nest success of 50 percent in 2015 and the highest apparent nest success of 72 percent in 2017, corresponding to the second lowest and the highest precipitation years, respectively. Apparent nest success also was higher in the Otay population than in the San Diego population. The number of brood nests initiated per pair and the number of renesting attempts per pair also were higher in years with more precipitation. Other metrics of Cactus Wren nesting success and productivity were positively influenced by the amount of precipitation, including clutch size and egg hatching success. The percent of hatchlings that fledged was greater in the Otay population than in the San Diego population but was not influenced by precipitation. The number of fledglings per pair was higher in years with more precipitation and was greater in the Otay population than in the San Diego population. Predation was the predominant cause of nest failure in both populations.
Analysis of Cactus Wren daily nest survival rate indicated that there was a population, and possibly a precipitation effect on nest survival, with the daily survival rate for the Otay population significantly higher than for the San Diego population and weak increase in the daily survival rate with more precipitation.
A total of 629 Cactus Wrens were banded during the course of the study, 360 in the San Diego population and 269 in the Otay population. Between 2015 and 2019, we resighted 301 color-banded adult birds that ranged between 1 and 8 years old. One additional color-banded bird was resighted in San Pasqual Valley (as part of a separate study); this bird originated in the San Diego population and was excluded from our analyses.
Annual survival was higher for adult Cactus Wrens (ranging from 60 to 70 percent) than for first-year wrens (ranging from 20 to 28 percent) and varied by year. Annual survival was also weakly but positively correlated with precipitation. Annual survival was higher for first year and adult Cactus Wrens following years with increased precipitation. We found no evidence that survival differed by population.
Banding also allowed us to examine whether there were differences in movement of adult and first-year Cactus Wrens by year or by population. We found that average dispersal distance for first-year Cactus Wrens was 1.9 kilometers in the Otay population and 1.6 kilometers in the San Diego population and did not differ by population or year. Dispersal between populations was not common. We detected five instances of movement of first-year wrens between the San Diego and Otay populations. All movements into and out of the San Diego population were from or into territories in the Sweetwater area. We detected no movement between the Lake Jennings site and either of the Sweetwater or Otay sites; however, we did detect one wren that dispersed from Lake Jennings to the San Pasqual Valley population in 2019, which was a distance of 26.4 kilometers. Adult Cactus Wrens were site-faithful, with 87 percent of adults remaining on the same territory between breeding seasons. Precipitation may be a weak driver of movement for adult Cactus Wrens, with adults more likely to remain on the same territory following years of increased precipitation. There was no difference in adult movement between populations.
Arthropods were collected in pitfall traps and by vacuum in 23 Cactus Wren territories during 3 sampling periods in 2016 (early nesting, peak nesting, and late nesting). Arthropods of 19 orders and at least 128 families were collected. Analysis of 43 Cactus Wren fecal samples identified 10 arthropod orders that were present in more than 10 percent of fecal samples. The most abundant arthropod order collected was Hymenoptera; however, Cactus Wrens consumed arthropods in the order Hymenoptera significantly less than their availability, suggesting that this order was avoided. No other orders were significantly selected or avoided; however, selection indices of arthropod families identified that two families of arthropods (Isopoda Porcellionidae [woodlice] and Hymenoptera Formicidae [ants]) were avoided. After excluding the taxa that were avoided or not represented in fecal samples, 95 percent of Cactus Wren prey items were collected in pitfall traps and 5 percent were collected by vacuum. The most abundant prey orders captured were Diptera, Coleoptera, Hemiptera, Hymenoptera, and Aranea.
Analysis of the abundance of Cactus Wren prey items by vegetation type and sampling period indicated that vegetation type by itself was not a significant predictor of arthropod abundance but interacted with sampling period. Seasonal availability of arthropods was highest in the peak nesting period, followed by early and late nesting periods for California sagebrush (Artemisia californica), lemonadeberry (Rhus integrifolia), non-native grass, and bare ground, whereas availability increased from early to late nesting periods for blue elderberry (Sambucus mexicana spp. caerulea), cactus (Opuntia spp. and Cylindropuntia spp.), California buckwheat (Eriogonum fasciculatum), native bunch grasses, and black mustard (Brassica nigra). During the early nesting period, arthropods were most abundant in native bunch grasses and least abundant in lemonadeberry. During the peak nesting period, arthropods were most abundant in native bunch grasses and in areas of bare ground and were least abundant in cactus and blue elderberry. During late nesting, arthropods were most abundant in blue elderberry and non-native grass and least abundant in lemonadeberry and mustard.
Each year from 2015 to 2019, vegetation data were collected at the same 23 territories where arthropods were sampled: 9 territories in the Otay population and 14 territories in the San Diego population. Cactus, California buckwheat, and non-native grasses were detected within at least 60 percent of sampling points in the Otay population. Cactus, California sagebrush, California buckwheat, non-native grass, and black mustard each were detected within an average of 40 percent of sampling points in the San Diego population. No native bunch grass or lemonadeberry were recorded at the Lake Jennings site within the San Diego population. The cover of shrub species was relatively stable throughout the 5 years. Cover of herbaceous species and bare ground had greater annual variation than shrub species.
We found that vegetation cover varied widely among territories, with territory accounting for 69 percent of the variation in vegetation cover. Redundancy analysis allowed us to identify the vegetation types that accounted for the most variation. We used the top scores from the redundancy analysis to identify six vegetation types to be used in generalized linear mixed models analyzing the relationships between vegetation type, precipitation, and Cactus Wren breeding productivity. Three vegetation variables influenced the number of fledglings produced per pair. California sagebrush had a positive effect on the number of fledglings per pair whereas non-native grass and black mustard had a negative effect.
Breeding productivity, survival, and movements of adult and first-year Cactus Wrens indicated that the Otay population behaved similarly to, if not out-performed, the San Diego population during the span of our project, suggesting that the driving forces behind low numbers of Cactus Wrens in the Otay population before 2015 were no longer in effect. The Cactus Wren populations in Otay and San Diego reached a peak in 2018, which followed a year of high productivity and survivorship, both of which were correlated with high precipitation. This peak in population size was consistent with reproductive timing and productivity in other bird populations in semi-arid ecosystems that were linked to precipitation and arthropod abundance. We did not find a strong link among arthropod abundance, vegetation composition, and Cactus Wren breeding productivity, likely in part because arthropod abundance varied by vegetation type and sampling period, suggesting that different vegetation types provided important sources of prey at different periods of the breeding season. Arthropod abundance also may not represent arthropod availability when vegetation structure discourages the ground foraging behavior of species such as Cactus Wrens. Cover of non-native grass negatively influenced breeding productivity, although arthropods were abundant in non-native grass. Other factors that could have influenced differential breeding productivity between the Otay and San Diego populations were habitat restoration, control of annual herbaceous vegetation, human disturbance, lingering effects of wildfire, and nest predation. Overall, precipitation appeared to be a driver of Cactus Wren breeding productivity and possibly survival, potentially obscuring proximate effects of arthropod or vegetation composition.
Introduction
The coastal Cactus Wren (wren, Campylorhynchus brunneicapillus) is a fragmentation-sensitive resident species in southern California requiring thickets of cholla (Cylindropuntia spp.) or prickly pear cactus (Opuntia spp.) for nesting. Limited naturally by the patchy distribution of this habitat, Cactus Wren populations have become further fragmented in recent decades by urbanization, habitat degradation, and stochastic events such as wildfire (Solek and Szijj, 2004; Hamilton and others, 2020). As a result, Cactus Wren populations have diminished in size and distribution, and occur largely as islands in a matrix of generally unsuitable habitat.
Among the possible consequences of fragmentation on Cactus Wren viability is genetic isolation, which could lead to loss of genetic variability and ability to adapt to changing environments (Barr and others, 2015). Although Cactus Wrens, like other birds, are mobile and can presumably fly long distances between patches (Preston and Kamada, 2012; Kamada and Preston, 2013), there appears to be little genetic connectivity among populations in southern California (Barr and others, 2015). First-year dispersal, whereby young birds leave their natal territories and establish breeding territories of their own, is the key process by which genetic connectivity is achieved, yet this stage of the life history of birds is probably the most poorly understood and has not been documented between populations in southern California before the initiation of this project.
In addition to isolation, population declines in part of the range have raised concerns regarding the capacity for long-term persistence of Cactus Wrens in San Diego County. Coastal Cactus Wren populations have declined in southern California over the last three decades (Preston and Kamada, 2012); however, in San Diego County, particularly steep declines have been detected recently in the southern part of the county in the vicinity of Otay River valley. Cactus Wren territories on conserved lands in this region, which numbered 53 in 1992, declined to 14 in 2014 (The Nature Conservancy and San Diego Management and Monitoring Program, 2015).
Although associated with long-term Cactus Wren declines, neither fire nor development appear to be the primary factor responsible for the more recent and localized Otay wren population decline. Recent multiple years of drought may have affected wren abundance by reducing arthropod food resources, which could lower fecundity and survival (Preston and Kamada, 2012). Annual precipitation has been less than 75 percent of average (24.9 centimeters [cm]) in half of the last 20 years (2000–19), and in 8 of those years, precipitation was less than 50 percent of the average (National Oceanic and Atmospheric Administration, 2020). In 2014, an extreme drought year, productivity was exceptionally low, with only 3 fledglings observed during surveys of a population occupying 14 territories in the Otay region (The Nature Conservancy and San Diego Management and Monitoring Program, 2015).
Food availability for Cactus Wrens may be affected by annual precipitation, and mediated by habitat quality, as characterized by the composition and cover of native and non-native plant species, amount of bare ground, and microsite characteristics such as soils, slope and aspect. Poor habitat quality may exacerbate food limitation during drought years; thus, improving habitat quality through management could increase food availability and enhance wren productivity and survival. Developing management strategies to increase the stability of wren populations in years with low rainfall could be of particular importance if droughts become more frequent, intense, and prolonged in the future, as predicted by climate change models.
The goal of this study was to identify factors responsible for population declines in southern San Diego County, particularly in the Otay River valley, by examining Cactus Wren productivity and survival and their relationships to precipitation, habitat quality, and arthropod food availability. This report is presented in two chapters. Chapter A presents our first objective, to perform surveys to assess the population status of Cactus Wrens in three genetic clusters (Barr and others, 2015) in southern San Diego County over a 5-year study period (2015–19; Kus and Lynn, 2022). Chapter B presents our remaining objectives, to (1) monitor the nesting activity of Cactus Wren pairs to determine annual productivity in the Otay River valley (Otay population) compared to nearby Cactus Wren pairs at Lake Jennings and near the Sweetwater reservoir (San Diego population); (2) color-band Cactus Wren adults and nestlings to determine annual survival and movement of adults and first-year birds among the Otay and San Diego populations; (3) analyze arthropod abundance sampled from Cactus Wren territories to assess food availability; (4) collect data on vegetation structure and species composition in monitored Cactus Wren territories and examine relationships between prey abundance and vegetation composition and cover at the Otay and San Diego populations; and (5) relate Cactus Wren productivity to precipitation, vegetation structure/composition, and food availability in the Otay and San Diego populations. Cactus Wren data used in this report can be found in Kus and Lynn (2022).
Chapter A
Survey Methods
Survey plots were established in suitable Cactus Wren habitat throughout San Diego County by the U.S. Fish and Wildlife Service (USFWS) in 2011. Suitable habitat was defined by clusters of cacti on south-facing slopes on conserved land within the San Diego Multiple Species Conservation Program boundary (The Nature Conservancy and San Diego Management and Monitoring Program, 2015). Multiple, contiguous plots were established where sufficient habitat occurred within a canyon or open space. Survey plots ranged in size from 0.03 to 23.7 hectares (ha; 1.6±1.7 ha). We selected a subset of these plots in southern San Diego County that represented three genetic clusters, Otay, Lake Jennings, and Sweetwater/Encanto (Barr and others, 2015; fig. 1). We surveyed each plot twice each year in 2015, 2017–19. We did not survey in 2016 because the change in Cactus Wren numbers from previous surveys to 2015 was not considered critical to trigger annual surveys.
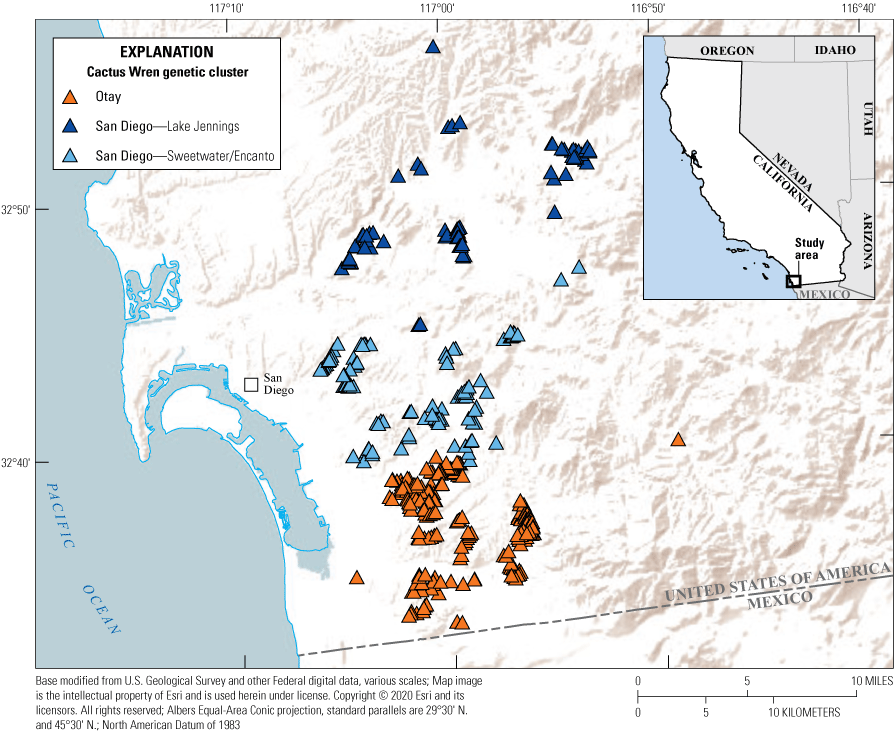
Locations of Cactus Wren survey plots in San Diego County, California.
Each survey plot was visited twice during a survey year, once between March 1 and May 31, and once between June 1 and July 31. Using binoculars, plots were scanned for Cactus Wrens and wren nests on arrival and if wrens were not immediately detected, a Cactus Wren song was broadcast for 15–30 seconds to elicit response. If no wrens were detected, plots were then carefully traversed for up to 20 minutes, looking for wrens or wren nests, periodically broadcasting the wren song. In addition to recording presence or absence of Cactus Wrens, observers attempted to count all wrens within the plot, determine their age (first-year or adult), and resight legs to record color-band combinations. A Global Positioning System (GPS; World Geographic System of 1984 [WGS 84]) point was collected where Cactus Wrens were located, and if no wrens were observed, GPS points were collected at recently constructed wren nests.
Cactus Wren territories often included all or parts of multiple survey plots. Therefore, occupancy of survey plots alone likely overestimated the actual number of wrens in the survey areas. To arrive at a more standard population count, surveyors observed the behavior of wrens during surveys to determine the actual number of Cactus Wrens using a block of survey plots. Population parameters including number of wrens, age, breeding status (paired or unknown), evidence of breeding (nests or fledglings observed), and color-band status were compiled by territory rather than by survey plot.
We used Chi-square test (and Fisher’s Exact test when any category contained fewer than five sample points) to compare the proportions of survey plots that were occupied across genetic clusters. Data were analyzed throughout using Program R (R Core Team, 2020). Two-tailed tests were considered significant if P≤0.10. Unless otherwise stated, means are presented with standard deviations.
Survey Results
We surveyed a total of 383 plots for Cactus Wrens between 2015 and 2019 (table 1). We surveyed 317 plots 8 times (twice each year in 2015, 2017–19). We dropped 1 plot (access was denied) and added 53 plots in 2017, which also were surveyed in 2018 and 2019. We added 8 more plots in 2018 when wrens were discovered in new locations. Four plots were surveyed only in 2019 because Cactus Wrens had been incidentally detected at those locations in prior years.
Table 1.
Number of plots occupied by Cactus Wrens/number of plots surveyed, and proportion occupied by Cactus Wrens (in parentheses), by genetic cluster and year.Overall, Cactus Wrens were detected at least once at 157 of the 383 plots (41 percent) that we surveyed (table 1). Of the 317 plots that were surveyed all 4 years, 112 (35 percent) were occupied by Cactus Wrens for at least 1 survey (table 2). A lower proportion of plots were occupied in the Otay genetic cluster than in the Lake Jennings and Sweetwater/Encanto clusters in all years. Plot occupancy increased each year in the Otay and Sweetwater/Encanto genetic clusters but not in the Lake Jennings genetic cluster. There were 35 plots that were occupied in all 4 years: 16 in the Otay genetic cluster, 8 in the Lake Jennings genetic cluster, and 11 in the Sweetwater/Encanto genetic cluster.
Table 2.
Number of plots surveyed all 4 years that were occupied by Cactus Wrens.[Numbers in parentheses are the proportion of plots that were occupied. Total: number of plots occupied at least one year/total number of plots surveyed every year. Abbreviations: P, probability that the statistical test result was false; <, less than]
From 2015 to 2019, we found a minimum of 43 and a maximum of 99 Cactus Wren territories across all survey plots (table 3). The total number of territories increased each year from 2015 through 2018 but then dropped in 2019 in all three genetic clusters. We determined that most of the territories were occupied by pairs in all years (table 4).
Table 3.
Number of Cactus Wren territories detected in the 317 plots that were surveyed all 4 years (2015, 2017–19).[Total number of Cactus Wren territories detected across all plots, including those we did not survey every year, in parentheses.]
Chapter B
Methods
Breeding Productivity—Data Collection
To examine and compare population parameters between the Otay and San Diego Cactus Wren populations, we established two study plots in the Otay population (Salt Creek and Johnson Canyon) and two study plots in the San Diego population (Lake Jennings and Sweetwater; fig. 2). We monitored nesting activity at Cactus Wren territories in these four study plots weekly between February and August in 2015–19. In 2016, we added a third study plot in the Otay population, Wolf Creek, but then abandoned it after that year because site conditions made collecting accurate data impractical.
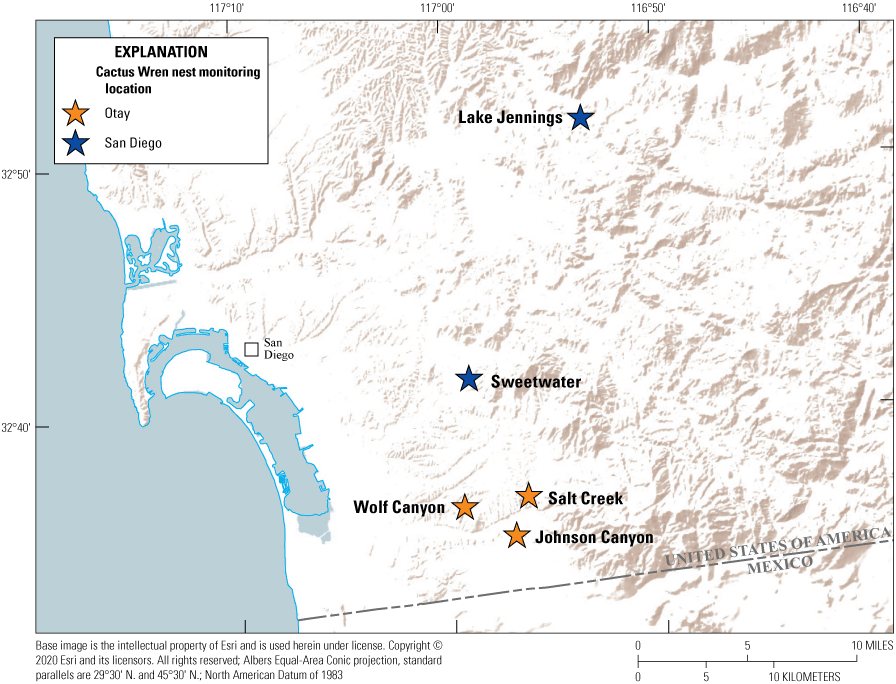
Cactus Wren nest monitoring plot locations in San Diego County, California, 2015–19.
We initially selected Cactus Wren territories for monitoring in 2015 and included all wren territories at Salt Creek (five territories) and Johnson Canyon (five territories) in the Otay population, all but one wren territory at Lake Jennings (eight territories), and all wren territories at Sweetwater (Sweetwater Summit Regional Park, Sweetwater Reservoir, and San Diego National Wildlife Refuge; six territories) in the San Diego population. In subsequent years, we monitored new territories when previously occupied territories were determined to be vacant.
All Cactus Wren nests were located and a GPS point for each nest was collected. Cactus Wrens build multiple nests, many of which are “roost” or “dummy” nests that are not used for breeding. We checked all nests at each territory weekly until a “brood” nest was identified by the presence of eggs or nestlings. Nests were approached carefully to avoid flushing an incubating female or older nestlings. Brood nests were checked weekly using a fiber optic camera or by reaching a hand into the nest to feel contents to determine the number of eggs, the number and age of nestlings, and whether the nest had successfully fledged young (nestlings reached 19 days of age or were detected alive outside of the nest). Unsuccessful nests were placed into one of three nest fate categories. Nests found empty or destroyed before the estimated fledge date and where adult wrens were not found tending fledgling(s) were considered depredated. Nests failing for reasons such as collapse of the host cactus or the presence of a clutch of infertile eggs were classified as failing because of other causes that were known. Nests that appeared intact and undisturbed but were abandoned with Cactus Wren eggs or nestlings were classified as having failed because of unknown causes. We located and monitored all nesting activity for each focal pair through the entire breeding season.
From these data, we calculated several measures of productivity: egg clutch size, egg hatch rate (number and percent of eggs that hatched), nest hatch rate (number and percent of nests with eggs that hatched), hatchling fledge rate (number and percent of hatchlings that fledged), nest fledge rate (number and percent of nests with hatchlings that fledged), egg fledge rate (number and proportion of eggs that produced fledglings), apparent nest success (number of nests with eggs that produced fledglings), and the number of fledglings produced per pair. We compared the egg hatch rate with the hatchling fledge rate and the nest hatch rate with the nest fledge rate to determine which stage of the nesting cycle was more vulnerable to failure. We also compared egg hatch rate with nest hatch rate and hatchling fledge rate with nest fledge rate to determine if factors that influenced these stages were affecting the entire nest (nest scale) or only affecting some of the nest contents (partial nest failure).
Breeding Productivity—Data Analysis
We used Chi-square and Fisher’s Exact tests to determine if there were differences in proportions of renesting attempts between Cactus Wren populations and years and after successful or failed first nesting attempts and to determine if there were differences between populations in the proportion of failed nests that failed as a result of depredation or other causes. To evaluate the direct influence of precipitation on breeding success and productivity, bio-year precipitation (hereafter, “precipitation”) was calculated from July 1 of the year before breeding through June 30 of the breeding season year. Although this definition of bio-year does not include the entire breeding season, very little precipitation fell between June and the end of the breeding season (September), and therefore, the defined period was functionally inclusive of the entire breeding season. We used logistic regression to determine if precipitation and population (Otay or San Diego) influenced egg hatch rate, hatchling fledge rate, the proportion of pairs that attempted a second nest, and apparent nest success. We used precipitation data from the El Cajon weather station (National Oceanic and Atmospheric Administration, 2020). We used Poisson regression to determine if precipitation and population influenced the number of brood nests produced per pair per year and egg clutch size because Poisson was appropriate for count data. For Poisson and quasi-Poisson regressions, we used incident rate ratios (e[estimate]) to quantify the amount of change in the response variable for each predictor variable, holding all other variables in the equation constant.
We used the RMark package (Laake, 2013) in Program R (R Core Team, 2020) to model the effects of Cactus Wren population (Otay or San Diego) and precipitation (as described in the preceding paragraph) on daily survival rate (DSR) of Cactus Wren nests (White and Burnham, 1999; Dinsmore and others, 2002). Nest survival was calculated across a 39-day cycle encompassing egg-laying, incubation, hatching, and nestling periods. Age of nests at the time they were discovered was calculated by forward- or backward-dating of nests in relation to known dates of egg-laying, hatching, or hatchling age. We used an information-theoretic approach (Akaike’s Information Criteria for small sample sizes or AICc; Burnham and Anderson, 2002) to evaluate support for nest survival models regarding the effects of population and precipitation. We used logistic regression with a logit link to build models. First, we generated a constant survival model to serve as a reference for the effects of Cactus Wren population and precipitation on DSR. We then modeled the covariates and evaluated support for the model in relation to the constant survival model. Well supported models had ∆AICc less than 2.
Survivorship and Movement—Data Collection
We banded wrens at nest monitoring sites with a combination of colored leg bands unique to each individual to evaluate survivorship and dispersal of adults and first-year birds. Adults and fledglings were captured opportunistically at monitored territories using mist nets and song playback to attract birds to nets. All hatchlings from accessible nests in monitored territories were banded at 5–15 days old (age target was 6–12 days old; hatchlings outside of this age range were evaluated for banding potential on an individual basis). During banding of nestlings, we recorded age (in days), weight, and collected fecal samples for a diet analysis. During banding of adults, we recorded sex, weight, and reproductive status. We resighted all Cactus Wrens at survey plots and monitoring sites, when possible, to identify individuals based on color-band combinations. When bands were missing or observations were unclear, we returned on non-survey days to obtain photographs using a Canon 7D Mark II digital single-lens reflex camera with the Canon 100–400 millimeter (mm) F/4.5–5.6 zoom lens. Photographs were useful for determining fine color differences (faded bands) or reading numbers on metal bands.
Cactus Wrens do not exhibit obvious sexual dimorphism when observed under normal field conditions. Gender is typically determined by specific behavioral cues (position during copulation, incubation [performed only by the female]) or morphology of birds in the hand (females have brood patches, males have cloacal protuberances). Gender cannot be determined for nestlings without genetic analysis. If none of these cues were observed, for convenience in reporting we assigned an adult as “male” if it sang or called more frequently or was more visually obvious (potentially advertising territory boundaries), although females can also exhibit these behaviors. As a result, we did not have a large sample of confirmed-gender adults, and therefore, we did not attempt gender-related analyses of survivorship or movements except as general summaries.
Survivorship and Movement—Data Analysis
We used the RMark package (Laake, 2013) in Program R (R Core Team, 2020) to model the effects of age (first-year or adult), population (Otay or San Diego), precipitation, and year on Cactus Wren survivorship. We calculated annual survival from 2015 to 2019 by creating an encounter history matrix of all individual Cactus Wrens ever encountered within the study area. Survivorship was assumed to be constant for adults once they survived their first year. For precipitation, we used bio-year in the previous year (July 1–June 30 for the bio-year ending in the previous breeding season (for example, survival for 2017–18 as a function of the precipitation in the bio-year ending in 2017) as a time-varying individual covariate. We used precipitation data from the El Cajon weather station (National Oceanic and Atmospheric Administration, 2020). We used logistic regression with a logit link to build and rank models by AICc and present annual real estimates from the top model. Because we expected survival to differ between first-year and adult birds, age was included in all models. If there was support for multiple models (ΔAICc less than 2), we averaged all models using AICc weights to obtain annual real estimates of survival for adult and first-year Cactus Wrens. We also evaluated the effect of covariates within our top models by examining the odds ratio for each covariate (the odds that the covariate had an effect on survivorship where “no effect” equals 1, negative effect less than 1, positive effect greater than 1). We then calculated the 95-percent confidence interval of the odds ratio to determine the likelihood that the effect was significant. Where the confidence interval was greater than or less than 1, we concluded that we had 95-percent confidence that the covariate had a positive or negative effect on survivorship relative to the reference condition.
We calculated natal dispersal distance for first-year Cactus Wrens by measuring the straight-line distance between the center of an individual’s natal territory and the center of the same individual’s breeding territory the following year. We used the Kruskall-Wallis test to determine whether natal dispersal distance differed by population. Similarly, adult site fidelity was determined by measuring the distance between the center of a bird’s breeding territories in successive years. Wrens exhibited site fidelity if they returned to within 100 meters (m) of their previous year’s territory. We used logistic regression to determine whether site fidelity differed by population or with precipitation in the previous bio-year.
Diet Analysis and Prey Availability—Data Collection
Cactus Wren fecal samples were analyzed to identify arthropod taxa that were considered Cactus Wren prey and we assessed the abundance of these taxa by vegetation type within wren territories. Fecal samples were collected from nestlings when a fecal sac was produced during the banding process. In 2016, 43 fecal samples were collected and analyzed for diet content using deoxyribonucleic acid (DNA) barcoding and screened against the custom database from the San Diego Natural History Museum arthropod collections of our study areas to obtain operational taxonomic units (OTU), which is a quantified representation of each taxon within a fecal sample (A. Vandergast, unpub. data, 2020). The genetic amplification and analysis process introduces some known errors that can skew the volume of an OTU within a sample or introduce contaminants, so a taxon was excluded from further examination if it accounted for less than 1 percent of the OTUs in a given fecal sample. Operational taxonomic units were grouped into arthropod orders and families and identified to species when possible. The sampling unit for analysis was the number of fecal samples that contained each OTU. Any taxa determined to be present in the environment but not likely to come from the fecal sample (for example, parasites such as mites [order Acari] and thrips [order Thysanoptera], or taxa that were likely miscoded such as Decapoda) were removed from further examination. It is worth noting that fecal samples were collected from nestlings only. It is likely that adult Cactus Wrens consumed similar prey to what was fed to nestlings, but there may be some items missing from our analysis that adult Cactus Wrens consumed.
The San Diego Natural History Museum collected arthropods in 2016 at 9 monitored territories in the Otay Cactus Wren population and at 14 monitored territories in the San Diego Cactus Wren population (San Diego Natural History Museum, unpub. data, 2017). Using pitfall traps (for ground and litter-dwelling arthropods) and back-pack vacuums (for canopy-dwelling and aerial arthropods), arthropods were collected in the following vegetation species known to be used by foraging Cactus Wrens: blue elderberry (Sambucus nigra spp. caerulea; hereafter “elderberry”), cactus (cholla or prickly pear), California sagebrush (Artemisia californica; hereafter “sagebrush”), California buckwheat (Eriogonum fasciculatum; hereafter “buckwheat”), lemonadeberry (Rhus integrifolia), native bunch grass, non-native grass (multiple species), and black mustard (Brassica nigra; hereafter “mustard”). Arthropods also were collected from bare ground using pitfall traps (no vacuum samples were collected from bare ground). We refer to the plant species and bare ground collectively as “vegetation types.” Pitfall traps were open for 10 to 15 days and target plants were vacuumed for 30 seconds to collect arthropods from the foliage. Any large arthropods flushed while vacuuming also were collected when possible. Not all vegetation types were adequately represented at every Cactus Wren territory to support a pitfall trap or to provide enough substrate for a vacuum sample in 2016, when prey sampling occurred. Also, pitfall traps were sometimes disturbed, preventing the collection of arthropods at that vegetation type. Plant types that were not sampled at all territories included native bunch grass (sampled at 6 territories), elderberry (sampled at 10 territories), lemonadeberry (sampled at 10 territories), mustard (sampled at 21 territories), buckwheat (sampled at 22 territories), and non-native grass (sampled at 22 territories). Samples were collected during three periods of the Cactus Wren breeding season corresponding to early nesting (courtship, nest building, egg laying, February–early March), peak nesting (feeding hatchlings, May–June), and late nesting (feeding fledglings, independent fledglings, September). Arthropods greater than 5 mm in length were identified, counted, and sorted into groups or taxa with known or presumed significance to Cactus Wren (Hamilton and others, 2020). Arthropod biomass was not calculated.
Diet Analysis and Prey Availability—Data Analysis
To determine which arthropod taxa to include in prey abundance analyses, we used R package adehabitatHS (Calenge, 2006) to calculate resource selection indices (wi) which examined the relationship between arthropods consumed by Cactus Wrens (found in fecal samples) and available (collected in pitfall traps and by vacuum; Reynolds and others, 2006):
wherewi is the resource selection index for arthropod order i,
oi is the relative proportion of fecal samples that contained order i (the proportion of fecal samples that contained order i divided by the sum of the proportions of fecal samples that contained orders i through n, where n=the total number of orders), and
pi is the proportion of prey arthropods collected in pitfall traps that were classified into order i
Values of wi greater than 1 were evidence of selection (used disproportionately more than their availability), values less than 1 were evidence of avoidance (used less than their availability), and values equal to 1 indicated arthropods were used in proportion to their availability. We calculated 95-percent confidence intervals from standard errors (SE) provided for each wi by adehabitatHS:
whereΣ u is the sum of the proportions of fecal samples that contained orders i through n, where n=the total number of orders.
Resource selection indices were considered significant if the 95-percent confidence intervals for wi did not contain 1 (Reynolds and others, 2006). First, we calculated resource selection indices for arthropods by orders in which they were classified. Next, we calculated resource selection indices for arthropod families to identify if there were any families that drove the selection or avoidance at the order level. Families that were avoided were not considered prey and were excluded from further arthropod prey analyses. Arthropod families that were selected or were neither selected nor avoided were considered prey and included in subsequent analyses. We included all unidentified larval arthropods in our Cactus Wren analyses as prey despite the inability to classify them into orders or families.
The sampling units for arthropod prey abundance analyses were the number of arthropod prey collected per sampling event (pitfall trap session or vacuuming session) by vegetation type, Cactus Wren territory (to control for differences in sampling between territories), and sampling period. Because only a small proportion of arthropods were collected by vacuum, we performed further analyses only on arthropods collected by pitfall trap.
We used generalized linear mixed modeling (GLMM; Faraway, 2006) to build a series of models describing the relationship between vegetation type, sampling period, and the number of arthropod prey collected in pitfall traps. We included sampling period as a fixed effect because it did not have enough levels to include as a random effect. Cactus Wren territory was a random effect, and we nested vegetation type (all pitfall trap samples collected at a unique vegetation type location) within Cactus Wren territory also as a random effect and treated the arthropod data as Poisson-distributed. We used AICc to evaluate models; the model with the lowest AICc and any model within two AICc of the lowest model were considered well supported. Odds ratios were examined to evaluate the influence of each level of each variable (fixed effects) on arthropod abundance. If there was support for multiple models (ΔAICc less than 2), we averaged all models using AICc weights to obtain real estimates of arthropod abundance for each level of each variable.
Vegetation Composition—Data Collection
We collected and analyzed vegetation data at Cactus Wren territories to compare vegetation structure and species composition across territories and relate it to arthropod prey availability and wren productivity. Permanent vegetation sampling plots were established in 2015 at the same 23 monitored wren territories where arthropods were collected. Vegetation plots consisted of 30 points arranged in a 5 x 6 grid with 15 m between points in both directions. Points were revisited annually at the end of the breeding season and the presence or absence of the following species recorded within a 2-m-radius circle surrounding the point: native bunch grasses, non-native annual grasses, cactus, elderberry, lemonadeberry, sagebrush, buckwheat, and mustard. Percent cover of each species was calculated as the percent of the 30 sampling points at which the species was present. The substrate at the center of each point was recorded as plant, bare ground, or litter to calculate the percent of bare ground within each plot. In 2016, we did not estimate cover of shrubs, but instead only recorded presence or absence of herbaceous species.
Vegetation Composition—Data Analysis
Shrub data were not collected in 2016. The lack of data presented several options for our analyses. These included ignoring 2016 altogether, pooling data across years, or interpolating the missing values (estimating 2016 shrub cover based on the known data points in 2015, 2017–19 using linear regression). Ignoring 2016 and pooling data across years entailed a loss of information, particularly in analyses of the relationship between nest success and vegetation cover where inter-annual variation was one of our main interests. Thus, we felt that interpolation of the 2016 cover values, especially if interpretation of patterns for that year was done cautiously, was the more appealing option. We reasoned that woody species are not prone to major shifts in cover between successive years (unless there was a major disturbance such as a fire, landslide, and so forth), autocorrelation between successive years tended to be in the strong to moderate range, 2016 was the fourth consecutive drought year (interannual variation over the last several years was relatively low), the sampling design gave us the capability of estimating cover in each territory, and we would be interpolating and not extrapolating the cover values. These five conditions taken together indicated to us that interpolated cover values for 2016 would be reasonable and provide us greater flexibility and ecological insight than simply removing that year from the analyses or pooling data across years. We used GLMM to estimate the missing cover values and then used those in subsequent analyses. We used a binomial error structure in the model, with cover estimated as the proportion of point intercept hits out of 30 points. Year was specified as the fixed effect and coded as time (for example, 2015=1, 2016=2, and so forth) to avoid problems with convergence because of large numbers. Territory was specified as a random effect, which allowed us to estimate cover in 2016 for each one. We performed a preliminary analysis to evaluate random slope-intercept models, but these did not converge because of singularity (insufficient sample size relative to the number of parameters in the model). Therefore, all estimates of shrub cover in 2016 were derived from random intercept models.
Analysis of vegetation data entailed two separate but related steps. The first consisted of a multivariate analysis (redundancy analysis [RDA]; Buttigieg and Ramette, 2014) focused on differences in vegetation cover among territories. This step allowed us to evaluate: (1) the range in variation of vegetation cover among territories, (2) the degree to which vegetation cover varied by year, (3) the most important variables for differentiating vegetation across the territories, and (4) how distinct the populations (Otay and San Diego) were in vegetation structure. In the second step, we used a GLMM to relate the most important vegetation variables from the RDA to the number of fledglings produced per pair.
We used the RDA to evaluate the degree to which vegetation cover varied among territories and years. Redundancy analysis combines principal components analysis (PCA) and multiple regression to summarize variation in response variables (in our case, percent cover of vegetation types), such as (1) among sampling units (territories within each year), and (2) in relation to a set of explanatory (or predictor, environmental) variables. The explanatory variables can be either continuous (for example, elevation, soil moisture) or categorical (for example, burned or unburned); when explanatory variables are categorical, RDA can be conceptualized as a form of multivariate analysis of variance (ANOVA). Redundancy analysis creates two sets of ordination axes, one based on linear combinations of response variables (vegetation types; the PCA component) and one based on the linear combination of response variables after they are “constrained” by the explanatory variables (territory and year); the multiple regression component. Thus, RDA is among multivariate methods known as constrained ordinations. The PCA step provides the total amount of variation in vegetation species cover and the regression gives the proportion of that variation that is accounted for by the explanatory variables. One of the notable strengths of constrained ordination is it allows simultaneous evaluation of overall variation in a dataset and variation relative to explanatory variables. Other variables can be included as covariates, which further enables evaluation of the relative contribution of explanatory variables, covariates, and residual variation to overall variation in the data. Scores are derived for sampling units, species (vegetation types), and the explanatory variables in ordination space, and significance of the overall ordination and the variables in the model are evaluated with Monte Carlo permutation tests. This makes RDA free of the restrictive assumptions of more traditional parametric multivariate analyses, such as multivariate ANOVA, discriminant analysis, and canonical correlation analysis.
We specified two separate RDA models. Territory was the explanatory variable and year was a covariate in the first model, whereas year was the explanatory variable and territory was the covariate in the second model. This approach allowed us to calculate the relative contributions of territory and year to the overall variation in the data; in other words, the variability among territories within years, and the variability in vegetation across years, which differed in precipitation. Territory and year were each considered a categorical variable in both models. Although uncommon vegetation species have little effect on the results of an RDA, they can distort visualization of the ordination axes and scores. Thus, we performed a preliminary analysis to determine if any of the vegetation variables could be removed from the models. Based on this, we removed elderberry, lemonadeberry, and native bunch grass from further analyses, resulting in a matrix with dimensions of 115 sampling units (23 territories x 5 years) and 6 vegetation variables (bare ground, buckwheat, cactus, mustard, non-native grass, and sagebrush). Monte Carlo tests were based on 999 permutations.
We used Poisson regression with the number of fledglings per pair as the response variable in a GLMM (Christensen, 2019) with territory as a random effect to analyze the effects of vegetation composition and bio-year precipitation on annual productivity. We used the results of the RDA as a guide to determine which vegetation variables to include in the models. We included precipitation in the analysis to compare the relative effect of precipitation to the contribution of the vegetation variables to the model. To compare the magnitude of the effects of each model parameter, we standardized the vegetation and precipitation variables by calculating the z scores for each variable, rescaling the variables to have a mean of zero and a standard deviation of one. Z scores are calculated using the following formula:
whereResults
Breeding Productivity
Nesting activity was monitored annually at 10–13 territories in the Otay population (fig. 3A, 3B) and 14–18 territories in the San Diego population (fig. 3C, 3D) from 2015 through 2019 (table 5). All territories except three in 2016 (two in Otay and one in San Diego) and two in 2017 (both in San Diego) were considered fully monitored, meaning that all brood nests within the territory were found and documented during the breeding season. One or more brood nests may have been missed at partially monitored territories. All monitored territories were occupied by pairs except two territories that were occupied by single birds in 2015, five in 2016, and two in 2019. We monitored 46–74 Cactus Wren brood nests per year. Of these nests, 46–71 were in fully monitored territories (table 6).
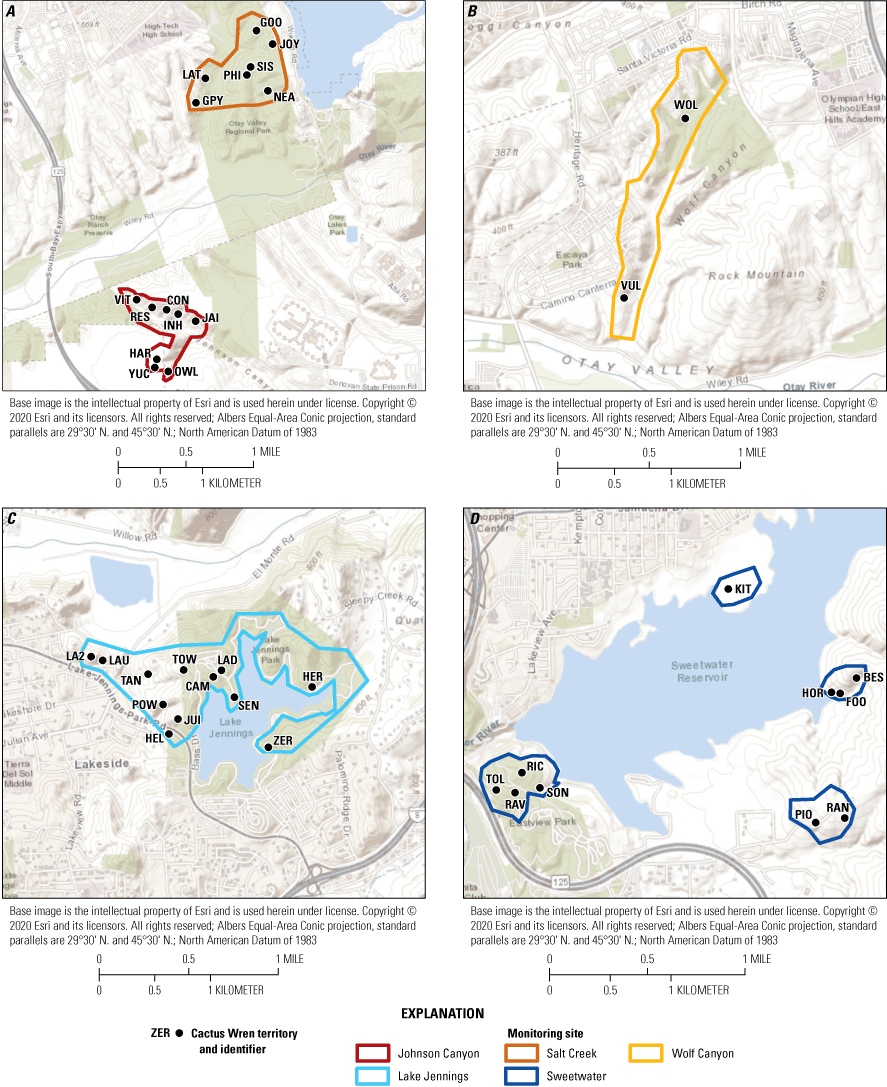
Locations of monitored Cactus Wren territories, southern San Diego County, 2015–19. See figure 2 for geographic reference.
Table 5.
Number of fully and partially monitored Cactus Wren territories by population, southern San Diego County, 2015–19.Table 6.
Number of Cactus Wren brood nests and precipitation at monitored territories by population, southern San Diego County, 2015–19.[Average brood nests per pair calculated from fully monitored territories. Precipitation is in centimeters and is compiled from the bio-year (July 1–June 30) that ended in the breeding year. Abbreviation: ±, plus or minus]
Nesting Attempts
The Cactus Wren breeding season began in January or February and ended in July or August. The earliest first nest initiation (first egg laid in the first nest) was on January 23, 2017, in the San Diego population and February 12, 2019, in the Otay population. The latest first nest initiation was April 12, 2018, in the Otay population and February 26, 2016, in the San Diego population.
Fully monitored Cactus Wren pairs laid eggs in zero to four brood nests each year. The number of brood nests per Cactus Wren pair did not differ between populations; however, there was a significant, relationship between the number of brood nests and the amount of precipitation (for every 1-cm increase in precipitation, there was a 1-percent increase in the number of brood nests per Cactus Wren pair; table 7).
Table 7.
Results of Poisson regression of the number of Cactus Wren brood nests per pair as a function of the amount of precipitation and by population (Otay or San Diego).[Incident rate ratio is the multiplicative amount of change in number of nests with every 1-centimeter change in precipitation, holding all other variables constant. Precipitation was compiled for the bio-year (July 1–June 30) ending in the current breeding year. Abbreviations: P, probability that the statistical test result was false; <, less than]
The number of pairs that attempted a second nest was significantly and positively related to the amount of precipitation and did not differ between populations (table 8). In 2018, the driest year of the study, Cactus Wren pairs were more likely to renest after a failed first nesting attempt than they were after a successful first nesting attempt (fig. 4; Fisher’s Exact test, P=0.07). A similar, but non-significant, pattern was seen in 2015, another dry year (Fisher’s Exact test, P=0.16). In all other years, Cactus Wren pairs were as likely to renest after a failed first nesting attempt as they were after a successful first nesting attempt (Fisher’s Exact test, 2016, 2017, 2019: P>0.99). Over all years, 75–100 percent of Cactus Wren pairs attempted to renest after a failed first nesting attempt, and 38–100 percent attempted to renest after a successful first nesting attempt.
Table 8.
Results of logistic regression of the number of attempted Cactus Wren renests after a first nesting attempt as a function of the amount of precipitation and by population (Otay or San Diego).[Precipitation was compiled for the bio-year (July 1–June 30) ending in the current breeding year. Abbreviations: P, probability that the statistical test result was false; <, less than]
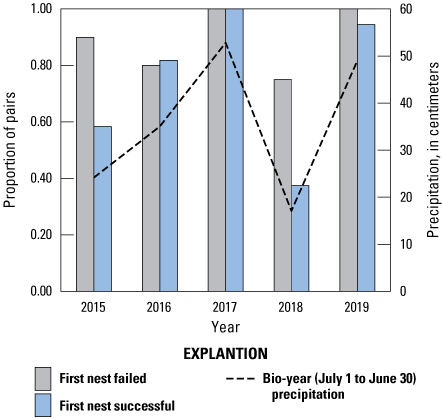
Proportion of Cactus Wren pairs that renested after successful and failed first nesting attempts by year and by precipitation, southern San Diego County, 2015–19. Precipitation was compiled for the bio-year (July 1–June 30) ending in the current breeding year.
On average, Cactus Wren pairs fledged the highest number of broods in the wettest years, 2017 (1.9±0.7) and 2019 (1.7±1.1), and the lowest number of broods in the driest years, 2018 (0.9±0.6) and 2015 (1.0±0.7). In 4 of the 5 years of our study, a few fully monitored Cactus Wren pairs failed to fledge any nests (fig. 5). The proportion of pairs that did not fledge any nests was similar between populations from 2015 through 2017 (2015: 25 percent at San Diego versus 20 percent at Otay; 2016: 8 percent at San Diego versus 11 percent at Otay; 2017: 0 percent at both populations) until 2018, when 35 percent of San Diego pairs and 9 percent of Otay pairs failed to fledge any nests. Similarly, in 2019, 33 percent of San Diego pairs and no Otay pairs failed to fledge any nests. Several Cactus Wren pairs fledged two or more broods each year from 2015 to 2019. During 3 of 4 years, 4 (2016) or 5 (2017 and 2019) Cactus Wren pairs fledged 3 broods, and in 2019, 1 Cactus Wren pair fledged 4 broods.
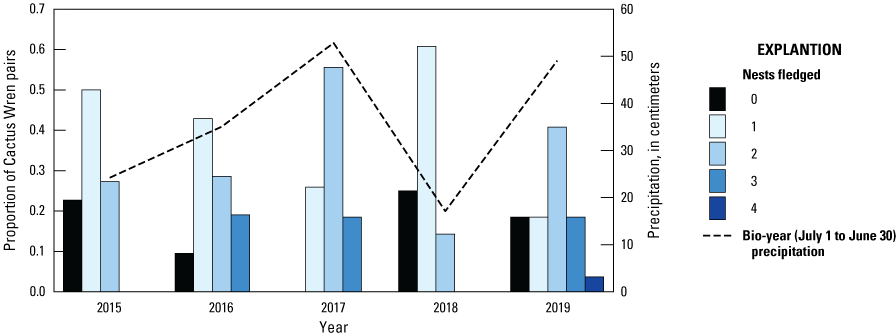
Number of nests fledged by Cactus Wren pairs from 2015 to 2019 and precipitation, southern San Diego County. Precipitation was compiled for the bio-year (July 1–June 30) ending in the current breeding year.
Nest Success
Of the 295 Cactus Wren nests monitored from 2015 to 2019 (286 in fully monitored territories, 9 in partially monitored territories), apparent nest success (the percent of brood nests that successfully fledged young) ranged from 50 percent in 2015 (23/46) to 72 percent in 2017 (53/74) across all territories (table 9). Apparent nest success increased significantly with the amount of precipitation and was higher in the Otay population than in the San Diego population (table 10).
Table 9.
Fate of monitored Cactus Wren nests in all monitored territories by population and year, southern San Diego County, 2015–19.[Percent successful or failed were the percent of all nests that were successful or failed within each population per year, in parentheses. Percent of depredated, other, or unknown nest fates were the percent of all failed nests within each nest failure category, per population per year, in parentheses.]
Table 10.
Results of logistic regression of Cactus Wren apparent nest success as a function of the amount of precipitation and of population (Otay or San Diego).[Precipitation was compiled for the bio-year (July 1–June 30) ending in the current breeding year. Abbreviation: P, probability that the statistical test result was false]
The most common cause of nest failure was presumed to be predation (71–100 percent of all nest failures), although only one confirmed predation event was witnessed. A California kingsnake (Lampropeltis getula californiae) was discovered coiled in a nest at Lake Jennings with agitated adult Cactus Wrens nearby in 2015. Other causes of failure included 3 nests in which eggs did not hatch and were either infertile or died during a heat wave, 2 nests that failed after one or both adults disappeared (likely depredated), 3 nests that were abandoned after anthropogenic disturbance, and 11 nests that were abandoned for no apparent reason, 6 with eggs and 5 with hatchlings.
Across both populations, the proportion of unsuccessful nests that failed as a result of predation versus other causes of nest failure varied by year. Nest failure as a result of predation was lower in 2016, 2018, and 2019 (74–76 percent of failures) than in 2015 and 2017 (95–96 percent of failures; Fisher’s Exact test, P=0.08). We did not find a significant difference in the percent of nests that failed as a result of predation between the Otay and San Diego populations in any year or across all years combined (Fisher’s Exact test, P>0.17); however, there were notably more nest failures that could not be attributed to predation in the San Diego population (16) than in the Otay population (3), particularly in 2018 and 2019 (table 9). All nest failures were attributed to predation in the Otay population in 2015, 2017, and 2019.
Productivity
We found 1,082 Cactus Wren eggs in 295 monitored nests from 2015 to 2019 in the Otay and San Diego populations (tables 11, 12). Cactus Wren clutch size ranged from two to eight eggs. Although we found nests with single eggs, we could not confirm that these were full clutches (for example, we found nests later in the nest cycle that may have lost eggs or egg laying was interrupted and the nest abandoned). Two nests were discovered with eight eggs at the same territory in 2 different years. Both nests were abandoned shortly after eggs were laid. One other nest was found containing six nestlings, all of which successfully fledged. We do not know if this nest initially contained more than six eggs. Clutch size did not differ between populations but was positively associated with precipitation (for every 1-cm increase in precipitation, there was a 1-percent increase in clutch size; table 13; fig. 6). The effect of precipitation on wren clutch size was most pronounced between the wet years of 2017 and 2019 and the extreme dry year of 2018 (fig. 6).
Table 11.
Reproductive success and productivity of nesting Cactus Wrens in the Otay population, San Diego County, 2015–19.[Calculations of average clutch size include only nests that had a known full clutch. Calculations of average young fledged per pair include only fully monitored Cactus Wren pairs. Abbreviation: ±, plus or minus]
Table 12.
Reproductive success and productivity of nesting Cactus Wrens in the San Diego population, San Diego County, 2015–19.[Calculations of average clutch size include only nests that had a known full clutch. Calculations of average young fledged per pair includes only fully monitored Cactus Wren pairs. Abbreviation: ±, plus or minus]
Table 13.
Results of Poisson regression of Cactus Wren clutch size as a function of the amount of precipitation and of population (Otay or San Diego).[Incident rate ratio is the multiplicative amount of change in clutch size with every 1-centimeter change in precipitation, holding all other variables constant. Precipitation was compiled for the bio-year (July 1–June 30) ending in the current breeding year. The Otay population is the reference and, therefore, is included in the intercept. Abbreviations: P, probability that the statistical test result was false; <, less than]
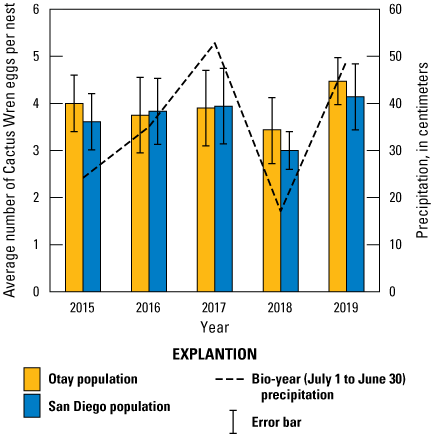
Average Cactus Wren egg clutch size by year, population, and precipitation, southern San Diego County, 2015–19. Error bars represent 1 standard deviation. Precipitation was compiled for the bio-year (July 1–June 30) ending in the current breeding year.
The percent of eggs that hatched was higher as precipitation increased and was higher in the Otay population than in the San Diego population (table 14). Disparities within years between the percent of eggs that hatched and the percent of nests with eggs that hatched indicate that the factors affecting hatch rate were operating at the egg level (for example, infertile or inviable eggs, crushed eggs, partial predation) rather than at the nest level. At least one egg was lost from 87 nests before the date the nest failed (26 nests) or was ultimately successful (61 nests), whereas 59 nests failed during the egg stage. In contrast, the percent of hatchlings that fledged and the percent of nests with hatchlings that fledged at least one young were similar within years, indicating that factors affecting fledge rate were operating at the nest level. The percent of hatchlings that fledged was higher in the Otay population than in the San Diego population but was not significantly related to precipitation. In the Otay population, the percent of eggs that hatched was consistently lower than the percent of hatchlings that fledged indicating that factors causing partial nest failure were occurring in late egg or early nestling stages. In the San Diego population, the percent of eggs that hatched was lower than the percent of hatchlings that fledged from 2015 through 2017, but in 2018 and 2019, the relationship was reversed. The number of fledglings produced per egg combined the egg hatch rate and the hatchling fledge rate, and therefore appeared higher in the Otay population but did not track bio-year precipitation.
Table 14.
Results of logistic regressions of Cactus Wren hatching and fledging success as a function of the amount of precipitation and by population (Otay or San Diego).[Precipitation was compiled for the bio-year (July 1–June 30) ending in the current breeding year. The Otay population is the reference and, therefore, is included in the intercept. Abbreviation: P, probability that the statistical test result was false; <, less than]
We found 579 fledglings in all fully and partially monitored Cactus Wren territories from 2015 to 2019 in the Otay and San Diego populations (tables 11, 12). The number of fledglings per fully monitored pair ranged from 0 to 12. The average number of fledglings per fully monitored pair was higher with more precipitation and was higher in the Otay population than in the San Diego population (table 15; fig. 7).
Table 15.
Results of quasi-Poisson regression of the number of Cactus Wren fledglings produced per pair as a function of the amount of precipitation and of population (Otay or San Diego).[Incident rate ratio is the multiplicative amount of change in number of fledglings per pair with every 1-centimeter change in precipitation, holding all other variables constant. Precipitation was compiled for the bio-year (July 1–June 30) ending in the current breeding year. The Otay population is the reference and, therefore, is included in the intercept. Abbreviations: P, probability that the statistical test result was false; <, less than]
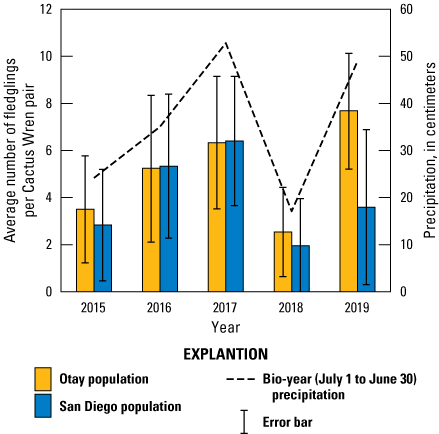
Average number of Cactus Wren fledglings per pair by year, population, and precipitation, southern San Diego County, 2015–19. Error bars represent 1 standard deviation. Precipitation was compiled for the bio-year (July 1–June 30) ending in the current breeding year.
Daily Nest Survival
Using Cactus Wren population and precipitation as covariates, we built five models with potential to predict that a nest would survive from one day to the next. The constant model was least supported of all models (table 16). Adding precipitation and population separately moderately improved model fit. The models that included both precipitation and population were the two best supported for predicting Cactus Wren daily nest survival. The top model showed that nests had a higher likelihood of survival in the Otay population than the San Diego population (table 17; fig. 8). The 95-percent confidence interval of the odds ratio did not include 1, indicating that population was a significant contributor to this model. The odds ratio for the San Diego population in this model was 0.59, indicating that when precipitation was held constant, the odds that a nest in the San Diego population would survive 1 day were 41 percent less than the odds that a nest in the Otay population would survive 1 day. In the top model, precipitation had an odds ratio of 1.03 and the lower boundary of the 95-percent confidence interval was slightly above 1, indicating that for every 1-cm increase in precipitation DSR increased by 3 percent. The second-ranked model included an interaction between population and precipitation, specifically that while DSR tracked precipitation in both populations from 2015 to 2018, in 2019, Otay DSR responded to high precipitation while San Diego DSR did not (fig. 8). This interaction, along with the population variable, did not contribute significantly to predicting DSR because the 95-percent confidence intervals of the odds ratios included 1. In the second-ranked model, the odds ratio for precipitation was 1.07, indicating that precipitation had a slightly positive effect on DSR (for every 1-cm increase in precipitation, DSR increased by 7 percent). Population was included in the top three models and in two of these models, DSR for the Otay population was significantly higher than the DSR for the San Diego population (95-percent confidence interval of the odds ratio did not include 1).
Table 16.
Logistic regression models of daily Cactus Wren nest survival as a function of the amount of precipitation and Cactus Wren population (Otay or San Diego) in southern San Diego County, 2015–19.[Models are ranked from best to worst based on Akaike’s Information Criterion for small samples (AICc), the difference between the model’s AICc and the highest-ranked model’s AICc (ΔAICc), and AICc weights. AICc is based on −2 x loge likelihood and the number of parameters in the model. Precipitation was compiled for the bio-year (July 1–June 30) ending in the current breeding year.]
Table 17.
Parameter estimate (β), standard error, odds ratios and 95-percent confidence intervals for the top three models explaining daily survival rate of Cactus Wren nests at Otay and San Diego populations, southern San Diego County, 2015–19.[Models are in order of best-supported to least-supported. Reference represents Cactus Wren nests in the Otay population in 2015. All other values are relative to the reference values. Precipitation was compiled for the bio-year (July 1–June 30) ending in the current breeding year.]
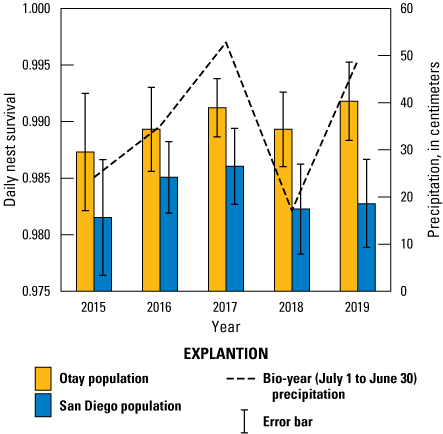
Daily nest survival rate of Cactus Wren nests by population and precipitation in southern San Diego County, 2015–19. Precipitation was compiled for the bio-year (July 1–June 30) ending in the current breeding year. Error bars represent the standard error of the mean daily nest survival rate.
Survivorship and Movement
We banded 629 Cactus Wrens between 2015 and 2019 (table 18). In total, 579 first-year wrens were banded: 260 in the Otay population and 319 in the San Diego population. A total of 50 Cactus Wrens were banded as adults: 9 in the Otay population and 41 in the San Diego population.
During surveys and monitoring between 2015 and 2019, we resighted 301 adult birds with color-bands (153 individuals, some of which were resighted in multiple years; tables 19, 20), 105 in the Otay population (101 individuals) and 196 in the San Diego population (52 individuals), most of which we were able to identify. One additional bird that had originally been banded as a hatchling in the San Diego population was identified in the San Pasqual Valley as a part of a separate study; that bird was excluded from our analyses. We were unable to identify seven birds as a result of missing bands. Adult birds ranged in age from 1 to 8 years old (table 20), with the oldest birds banded initially in 2011 in a previous study (Barr and others, 2015), one of which was present for all 5 years of the project.
Table 19.
Number of adult color-banded Cactus Wrens detected by population and year, southern San Diego County, 2015–19.[Number of birds banded in previous years in parentheses. Abbreviation: —, not applicable]
| Year | Otay population |
San Diego population |
Other |
|---|---|---|---|
| 2015 | 14 (2) | 116 (2) | — |
| 2016 | 11 (9) | 24 (22) | — |
| 2017 | 23 (22) | 238 (35) | — |
| 2018 | 241 (37) | 70 (48) | — |
| 2019 | 226 (26) | 348 (48) | 41 (1) |
Table 20.
Number of banded adult Cactus Wrens by age, year, and population, southern San Diego County, 2015–19.[—, no data; ≥, greater than or equal to]
Survivorship
The best models explaining annual survival of Cactus Wrens included age (first-year or adult) and either year or precipitation in the previous bio-year (ΔAICc=0.3; table 21). Examination of the odds ratios showed that survival of adult Cactus Wrens was significantly higher than that of first-year Cactus Wrens (table 22). Age was an important variable in all of the models. In both models that contained year we found that survival was lower in 2018–19 than in any of the other time intervals. Although there was less support for an effect of precipitation on survival, there was some evidence (odds ratio=1.01, with the 95-percent confidence interval boundary just above 1) that survival may be positively correlated with precipitation (table 22; fig. 9). There was less support for a population effect on survival; examination of the odds ratio in all models that included population suggested that population did not contribute significantly to the model (the 95-percent confidence interval spanned 1).
Table 21.
Survivorship models for the effects of age, previous bio-year precipitation (July 1–June 30), year, and population on adult and first-year survival of Cactus Wrens, southern San Diego County, 2015–19.[Models are ranked from best to worst based on Akaike’s Information Criterion for small samples (AICc), ΔAICc, and Akaike weights. AICc is based on −2 x loge likelihood and the number of parameters in the model.]
Table 22.
Parameter estimate (β), standard error, odds ratios and 95-percent confidence intervals for the top five models (ΔAICc less than 2) explaining annual survival of Cactus Wrens, southern San Diego County, 2015–19.[Reference represents first-year birds (in all models) in the Otay population (in models with population included) and survival 2015–16 in models with year. All other values are relative to the reference values.]
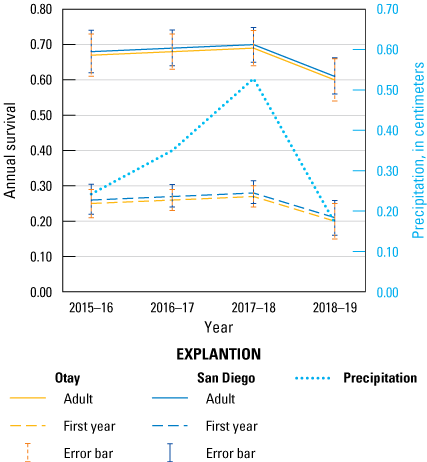
Annual survival of adult and first-year Cactus Wrens in the San Diego and Otay populations and precipitation in southern San Diego County, 2015–19. Precipitation was compiled for the bio-year (July 1–June 30) ending in the previous breeding year. Error bars are standard error of the mean annual survival.
We averaged models to obtain estimates of annual survival for adult and first-year Cactus Wrens. Annual survival for adults ranged from 60 to 70 percent whereas first-year survival ranged between 20 and 28 percent (table 23; fig. 9). Survival was similar for the San Diego and Otay populations. The highest values occurred in 2017–18 and the lowest in 2018–19 for both age classes and in both populations, coinciding with the years of highest and lowest precipitation (fig. 9). Detection probability was high (0.94) for adult and first-year wrens.
Movement
First-Year Dispersal
We were able to calculate natal dispersal distance for 100 first-year Cactus Wrens between 2015 and 2019 (table 24). Cactus Wrens banded in their first year in the Otay population that were detected as adults the following year dispersed on average 1.9±2.6 kilometers (km), whereas those banded in the San Diego population dispersed an average of 1.6±2.6 km. Average natal dispersal distance did not differ by population or by year (table 25).
Table 24.
Average natal dispersal distance by population and year for first-year Cactus Wrens, southern San Diego County, 2015–19.[Distances are in kilometers.]
Table 25.
Results of Kruskall-Wallis tests comparing the dispersal distance of first-year Cactus Wrens by year and by population.[H, Kruskal-Wallis Chi-squared statistic; P, probability that the statistical test result was false]
Although dispersal between populations was rare, we documented five instances of natal dispersal between the Otay and the San Diego populations (table 26), all between Sweetwater and either the Johnson Canyon or Salt Creek sites within the Otay population. Four Cactus Wrens dispersed from Sweetwater to either Salt Creek or Johnson Canyon and one dispersed from Johnson Canyon to Sweetwater. We detected no dispersal between our Lake Jennings site and either Sweetwater or Otay; however, as a part of another study we detected one wren that dispersed from Lake Jennings to the San Pasqual Valley in 2019, a distance of 26.4 km. This bird was not included in our analyses.
Table 26.
Cactus Wren natal dispersal between the Otay and San Diego populations, southern San Diego County, 2015–19.[Sex: F, female; M, male]
Adult Site Fidelity
Resighting banded birds also allowed us to document the movement of adult Cactus Wrens between territories through the years. We found that adult Cactus Wrens were very territory-faithful, with 87 percent of adults (85 and 88 percent in the Otay and San Diego populations, respectively) remaining on the same territory (within 100 m; table 27). Banded birds that moved between years (n=18) moved on average 0.3±0.2 km in the San Diego population and 2.7±2.5 km in the Otay population (table 28). There were four birds in the Otay population that moved more than 1 km between breeding seasons. No adults in the San Diego population moved more than 1 km and only three moved more than 400 m between years.
Table 27.
Percentage of banded adult Cactus Wrens that remained on the same territory (or within 100 meters of previous year’s territory), southern San Diego County, 2015–19.Table 28.
Average between-year movement of adult Cactus Wrens that did not remain on the same territory by population and year, southern San Diego County, 2015–19.[Distances are in kilometers. Abbreviation: —, no data]
Results of logistic regression of the likelihood that adult Cactus Wrens remained on the same territory between years as a function of population and previous bio-year precipitation suggest that precipitation was a weak driver of adult movement, with Cactus Wrens more likely to remain on the same breeding territory following years with higher precipitation in the bio-year before the movement (table 29). For example, precipitation from July 1, 2014, to June 30, 2015, was related to birds dispersing between 2015 and 2016. There was no difference between the proportion of adult wrens that dispersed between years in the Otay population compared with the San Diego population.
Table 29.
Results of logistic regression of the effects of population and precipitation during the previous bio-year (July 1–June 30) on the probability that adult Cactus Wrens would remain on the same breeding territory in the subsequent year, southern San Diego County, 2015–19.[Otay is the reference population for the estimate. Abbreviation: P, probability that the statistical test result was false]
Diet Analysis and Prey Sampling
A total of 37,111 individual arthropods of 19 orders and at least 128 families were collected in pitfall traps and by vacuum in 2016. Of the 37,111 individual arthropods, 2 percent (902/37,111) of arthropods were collected by vacuum while the remainder were collected in pitfall traps. Of these, 36,663 (99 percent) were classified in orders identified in fecal samples. Of all arthropods that were collected in pitfall traps and by vacuum, 448 belonged to orders not represented in fecal samples (class Arachnida, orders Opiliones: 112, Pseudoscorpiones: 3, and Solfugida: 26) or were not identified to order (class Diplopoda: 48, class Insecta: 13, unidentified larvae: 246). Of all arthropods collected, 15,900 (43 percent) belonged to families that were found in fecal samples (15,823 collected in pitfall traps, 77 collected by vacuum); the remaining 57 percent were either not identified or belonged to families that were not identified in fecal samples.
We found 10 arthropod orders in more than 10 percent of Cactus Wren nestling fecal samples (table 30). We found 16 arthropod families of 9 orders in more than 10 percent of fecal samples. No single arthropod family in the order Neuroptera was represented in more than 10 percent of fecal samples, although collectively, neuropterans were found in 12 percent of fecal samples. All 10 orders and 12 of the 16 families most commonly found in fecal samples were collected in pitfall traps and by vacuum. Four of the arthropod families found commonly in fecal samples were not collected by pitfall traps or by vacuum.
Table 30.
The proportion of 2016 Cactus Wren nestling fecal samples (n=43) that contained each arthropod order (and families that were found in at least 10 percent of fecal samples), and the proportion of arthropods collected of each order and family.[Proportion of arthropods collected: in pitfall traps and by vacuum. Proportion presented for order includes all arthropods collected that were identified to that order including those that were not identified to family (n=36,663; excludes 246 unidentified larvae). Proportion presented for family includes all arthropods identified to family; families not found in at least 10 percent of fecal samples are not itemized in this table although their number is included in the total number of arthropods collected (n=19,836). Abbreviations: <, less than; —, no data]
The genus of this isopod family identified in fecal samples was a marine isopod from in southern Asia but was the closest match in the genetic barcode bank. It likely represents a different, uncoded isopod genus.
The most abundant arthropod order collected was Hymenoptera (36 percent), followed by Isopoda (23 percent), Diptera (16 percent), Coleoptera (10 percent), and Hemiptera (10 percent). Each of the remaining arthropod orders made up less than 1 percent of all arthropods collected. Cactus Wrens consumed arthropods in the order Hymenoptera significantly less than their availability (table 31). Selection indices for all other arthropod orders were within the 95-percent confidence intervals indicating that Cactus Wrens did not significantly select or avoid them.
Table 31.
Selection indices of arthropod orders used by and available to Cactus Wrens in southern San Diego County, 2016.[Selection index (wi): proportion of fecal samples containing the arthropod order divided by the proportion of this order collected in all pitfall traps and by vacuum. Values of wi less than 1 suggest avoidance, values of wi greater than 1 suggest selection.]
We identified 29 arthropod families in fecal samples and that were also collected in pitfall traps or by vacuum. Two of these families (Isopoda Porcellionidae [woodlice] and Hymenoptera Formicidae [ants]) were avoided (consumed significantly less than their availability; table 32). All other families were consumed in proportion to their availability. Because woodlice and ants were avoided, we excluded them from further prey abundance analyses. Additionally, individuals within orders and classes not identified in fecal samples and individuals identified only to class Insecta were excluded from further prey abundance analyses. Unidentified larvae (246) were included in prey analyses.
Table 32.
Selection indices of arthropod families used by and available to Cactus Wrens in southern San Diego County, 2016.[Selection index (wi): proportion of fecal samples containing the arthropod family divided by the proportion of the family collected in all pitfall traps and by vacuum. Values of wi less than 1 suggest avoidance, values of wi greater than 1 suggest selection.]
After excluding the arthropod taxa that were avoided or not represented in fecal samples, the remaining 17,697 individual arthropods were considered Cactus Wren prey. Of the arthropods considered Cactus Wren prey, 95 percent (16,823) were captured in pitfall traps and 5 percent (874) were captured by vacuum. Diptera (32 percent) was the most abundant order within the taxa considered Cactus Wren prey, followed by Coleoptera (20 percent), Hemiptera (20 percent), Hymenoptera (12 percent), and Aranea (9 percent). All other taxa represented 1 percent or less of the number of arthropods that were considered Cactus Wren prey.
We created a series of GLMMs to determine the contribution of vegetation type and sampling period to the abundance of arthropods collected in pitfall traps. The highest ranked model contained the interaction between vegetation type and sample period and the AICc weight was 1, indicating that no other models carried enough weight to be considered viable (table 33). In this model, the 95-percent confidence interval for the odds ratio of all vegetation types (when not interacting with sample period) included 1, indicating that arthropod abundance by vegetation type alone did not contribute significantly to the model (table 34). No other model had an AICc score within two of the top ranked model. The magnitude of the variance for the random effects (vegetation type within territory=0.50–0.52 for all models; territory=0.03–0.05 for all models) was comparable in scale to the parameter estimates in all models, indicating that the random effects were strong (there was high variability in arthropod abundance between territories and vegetation types within territories).
Table 33.
Generalized linear mixed models for the effect of vegetation type (plant) and sampling period on the abundance of arthropods in pitfall traps within Cactus Wrens territories in southern San Diego County, 2016.[Period: early nesting period, peak nesting period, late nesting period; plant: sagebrush, buckwheat, lemonadeberry, elderberry, cactus, native bunch grass, non-native grass, mustard, bare ground; models are ranked from best to worst based on Akaike’s Information Criterion for small samples (AICc), the difference between the model’s AICc and the highest-ranked model’s AICc (ΔAICc), and AICc weights. AICc is based on −2 x loge likelihood and the number of parameters in the model.]
Table 34.
Parameter estimate (β), standard error, odds ratio, and 95-percent confidence intervals for each fixed effect describing the relationship of Cactus Wren population, sample period, and vegetation type (plant) to arthropod abundance in the top model period * plant.[Reference includes the early nesting sampling period and non-native grass. Odds ratio values greater than one indicate that the effect had a positive influence on arthropod abundance; values less than one indicate the effect had a negative influence on arthropod abundance.]
According to the top model, arthropod prey abundance was 17 percent higher in the peak nesting period than in the early nesting period and was 33 percent lower in the late nesting period than in the early nesting period (table 34; fig. 10). Arthropod abundance was also influenced by interactions between vegetation type and sampling period in the top model. Vegetation types departing from the “peak greater than early greater than late” pattern of arthropod seasonal abundance included elderberry, cactus, buckwheat, native bunch grass, and mustard, all of which exhibited a pattern of “early greater than peak greater than late” arthropod availability (fig. 10). Notably, during the early nesting period, arthropods were most abundant in native bunch grass and least abundant in lemonadeberry. Arthropods were most abundant in elderberry (although not significantly represented in the models) and non-native grass and least abundant in lemonadeberry and mustard in the late nesting period. During peak nesting period, arthropods were most abundant in native bunch grass and in patches of bare ground (although not significantly represented in the models) and least abundant in cactus and elderberry. Differences in arthropod prey abundance between vegetation types alone were minor and no vegetation type stood out as supporting substantially more or fewer arthropods than any other.
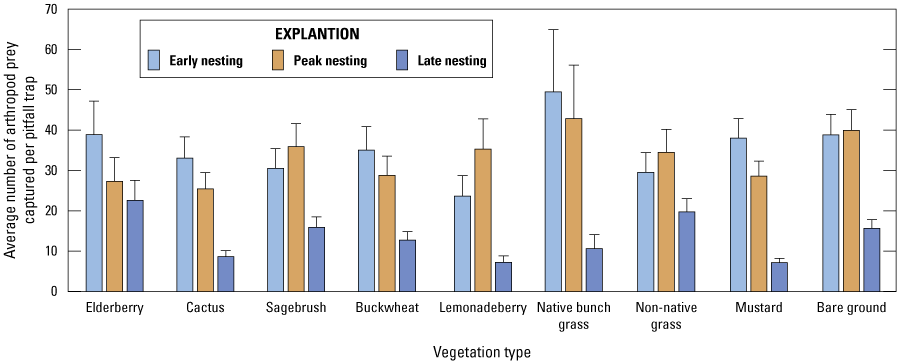
Average number of arthropod prey collected in pitfall traps by sampling period and vegetation type, southern San Diego County, 2016. Bars represent standard error of the mean number of arthropods per pitfall trap.
Insufficient arthropods were captured during vacuum sampling to incorporate into GLMM analysis. Visual inspection of the capture rate indicates that the highest arthropod abundance was in non-native grass and sagebrush (fig. 11).
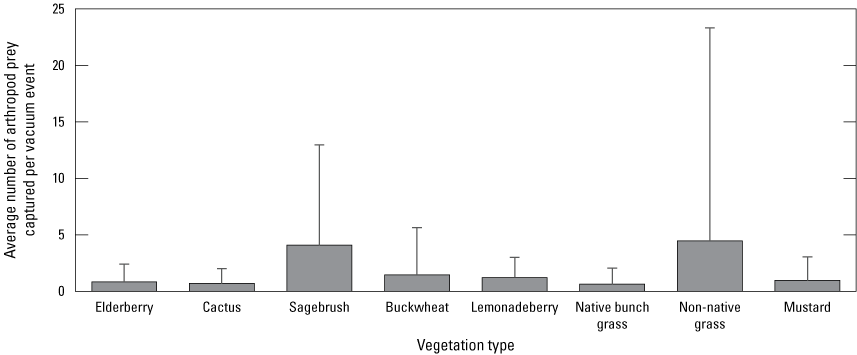
Average number of arthropod prey collected by vacuum by vegetation type, southern San Diego County, 2016. Error bars represent 1 standard deviation.
Vegetation Composition
Vegetation was sampled at 23 territories, 9 in the Otay population and 14 in the San Diego population, from 2015 to 2019. We measured cover each year for three herbaceous species (native bunch grasses, non-native grasses, and mustard), for five shrub species (cactus, elderberry, lemonadeberry, sagebrush, and buckwheat), and for bare ground. Four of the vegetation types were widespread, occurring at all territories; however, elderberry, lemonadeberry, native bunch grass, and mustard were absent at one or more Cactus Wren territories. Vegetation types that accounted for the most cover in the Otay population were cactus, buckwheat, and non-native grasses, each occurring in at least 60 percent of sampling points across territories in most years (fig. 12). In the San Diego population, cactus, sagebrush, buckwheat, non-native grass, and mustard were present in at least 40 percent of sampling points across territories in most years (fig. 13). One notable difference between the Otay and San Diego populations was the absence of lemonadeberry or native bunch grass at all Lake Jennings territories within the San Diego population. Laurel sumac (Malosma laurina), which is floristically and structurally similar to lemonadeberry, was the prevalent shrub at Lake Jennings. In contrast, lemonadeberry and native bunch grass were present at all but two of the Otay territories. Elderberry was not common in either population and was only sampled at four territories (two in Otay and two in San Diego). The cover of individual shrub species was fairly stable through time, with small annual changes. We found greater annual variation within the herbaceous species and bare ground.
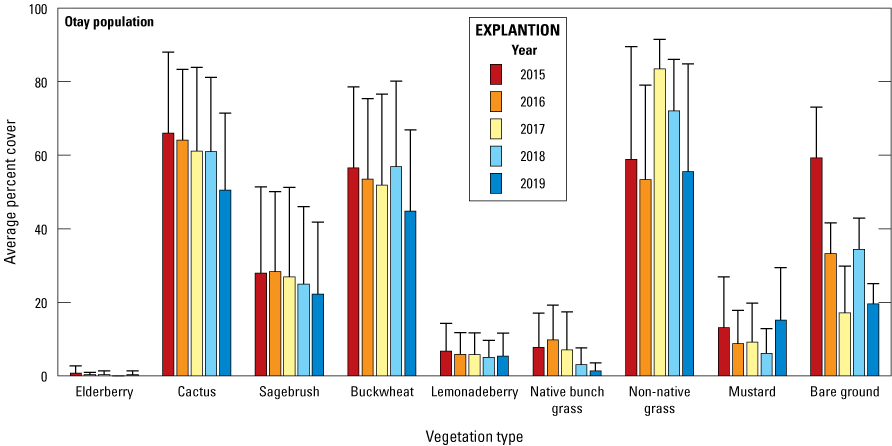
Average annual percent cover (percentage of sampling points with vegetation type within 2 meters) of vegetation types for Cactus Wren territories in the Otay population, southern San Diego County, 2015–19. Shrub values for 2016 were estimated using generalized linear mixed modeling. Error bars are 1 standard deviation.
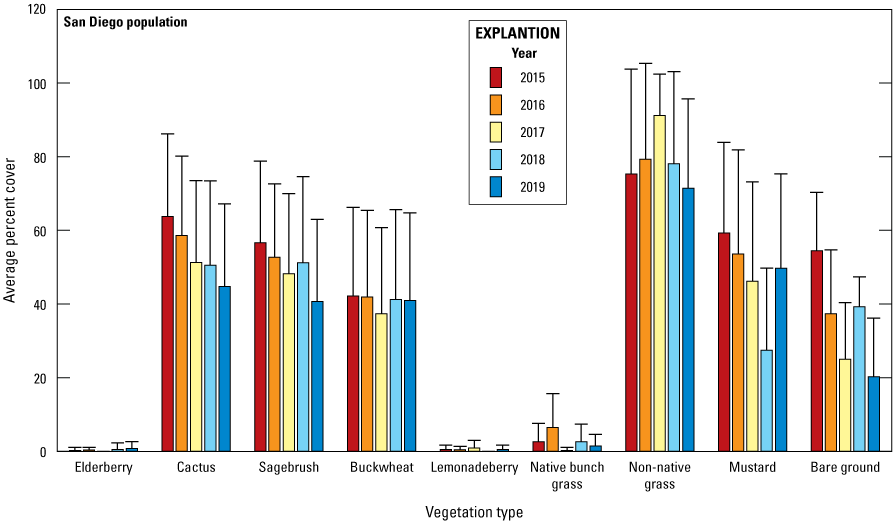
Average annual percent cover (percentage of sampling points with vegetation type within 2 meters) and standard deviation of vegetation types for Cactus Wren territories in the San Diego population, southern San Diego County, 2015–19. Shrub values for 2016 were estimated using generalized linear mixed modeling. Error bars are 1 standard deviation.
Variation in Vegetation Composition Between Territories and Years
Model 1: Variation Among Territories
The first RDA model characterized the variation in the vegetation composition and cover across territories, with year as a covariate. We found that vegetation cover varied widely among territories. A high proportion (69 percent) of the total variation in the data was explained by the effect of territory (F=19.9, P<0.001); this was approximately four times greater than that explained by the covariate year (table 35). Monte Carlo permutation tests indicated that the first five RDA axes were significant (F>30.6, P<0.001). Only three of the axes had a clear ecological interpretation; thus, our interpretation is restricted to these axes (table 36).
Table 35.
Partitioning of the variance in vegetation cover from redundancy analysis (RDA) describing the proportion of the variance explained by Cactus Wren territory and year, southern San Diego County, 2015–19.Table 36.
Vegetation type scores (loadings) from redundancy analysis for RDA axes 1–3 (scores represent the magnitude of each vegetation type on the axis), the proportion of variation explained by each axis and the cumulative variation explained by each successive axis.The first three axes accounted for 80 percent of the variation in vegetation composition and cover attributable to territory. The first axis was a gradient from mustard-dominated to buckwheat- and cactus-dominated territories, the second was a gradient from territories with high cover of sagebrush and cactus to those with high cover of buckwheat, and the third was a gradient from territories with high cover of non-native grass and buckwheat to those with high cover of cactus (table 36). There was little indication territories in the San Diego and Otay populations differed in vegetation composition along the first two RDA axes (fig. 14). Centroids of the territories were generally mixed in ordination space (fig. 14). The 95-percent confidence ellipses indicated vegetation composition within territories did not vary greatly among years.
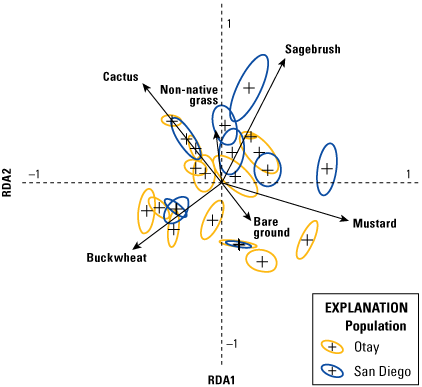
Variation in vegetation composition by redundancy analysis axis 1 and axis 2 among 23 Cactus Wren territories in southern San Diego County, California. Crosses (+) and 95-percent confidence ellipses indicate the centroids and inter-annual variation, respectively, of each territory across five years (2015–19). The first axis (RDA1) is a gradient from territories with higher cover of mustard to those with higher cover of buckwheat and cactus. The second axis (RDA2) is a gradient from territories with higher cover of sagebrush and cactus to those with higher cover of bare ground.
Territories in the San Diego and Otay populations also were intermixed in ordination space along the second and third axes, although not to the degree as along the first and second axes. A higher proportion of the territories in the San Diego population were characterized by sagebrush and cactus whereas a higher proportion of territories in the Otay population had relatively high cover of buckwheat (fig. 15). Consistent with the first two axes, the 95-percent confidence ellipses and graphs of individual year indicated vegetation composition within territories did not vary greatly among years for the second and third axes (fig. 15).
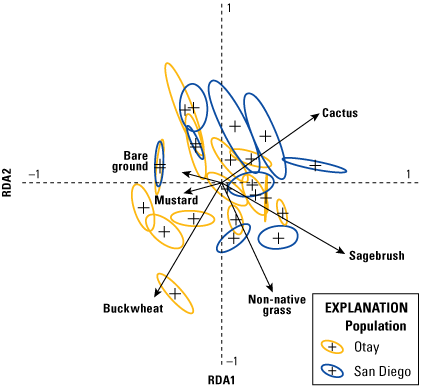
Variation in vegetation composition by redundancy analysis axis 2 and axis 3 among 23 Cactus Wren territories in southern San Diego County, California. Crosses (+) and 95-percent confidence ellipses indicate the centroids and inter-annual variation, respectively, of each territory across five years (2015–19). The first axis (RDA2) is a gradient from territories with higher cover of sagebrush and cactus to those with higher cover of bare ground. The second axis (RDA3) is a gradient from territories with higher cover of non-native annual grass and buckwheat to those with higher cover of cactus.
Model 2: Variation Across Years
The second RDA model characterized the variation in vegetation cover across years, with territory as a covariate. Monte Carlo permutation tests indicated that the first three RDA axes were significant (F>6.9, P<0.001). Only two of the axes had a clear ecological interpretation; thus, our interpretation is restricted to these axes (table 37). Because Model 2 simply interchanged the explanatory variable (year) and covariate (territory), the total variation in the data explained by these two sources were mirror images of those in Model 1 (17.3 percent by year, 69 percent by territory, table 35). Although the amount of total variation accounted for by year was notably less than territory, it nonetheless was a substantial effect (F=27.5, P<0.001).
Table 37.
Vegetation type scores (loadings) from redundancy analysis for RDA axes 1–3 where the scores represent the magnitude of each vegetation type on the axis, the proportion of variation explained by each axis and the cumulative variation explained by each successive axis.The first two axes accounted for 93 percent of the variation attributable to year. The first axis was a strong gradient from territories with high cover of bare ground to those with low cover of bare ground (table 37). The second axis was a clear gradient from territories with high cover of non-native grass to those with high cover of mustard (table 37). Centroids and the 95-percent confidence ellipses of the years indicated a general progression consistent with variation in inter-annual variation in precipitation, with 2017 and 2019 being years with considerably more precipitation than 2015, 2016 and 2018 (fig. 16). This progression was particularly evident from graphs of the individual years (fig. 17).
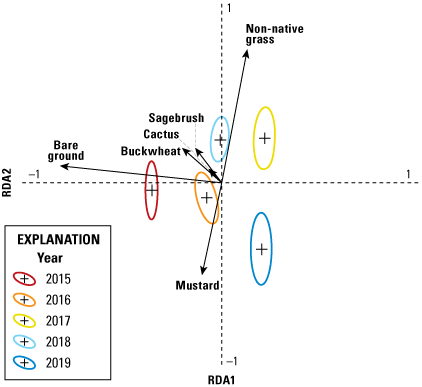
Variation in vegetation composition across years by redundancy analysis axis 1 and axis 2 among 23 Cactus Wren territories in southern San Diego County, California. Crosses (+) and 95-percent confidence ellipses indicate the centroids and variation of each year across 23 territories. The first axis (RDA1) is a gradient from years with higher cover of bare ground to those with low cover of bare ground. The second axis (RDA2) is a gradient from years with high cover of non-native annual grass to those with high cover of mustard.
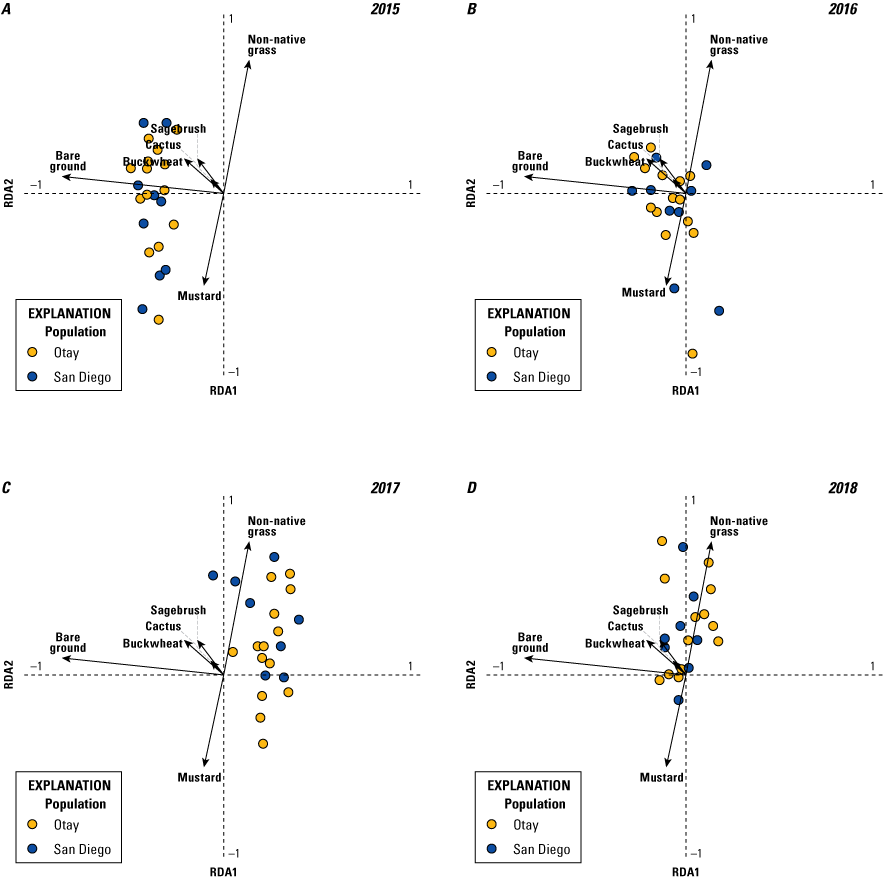
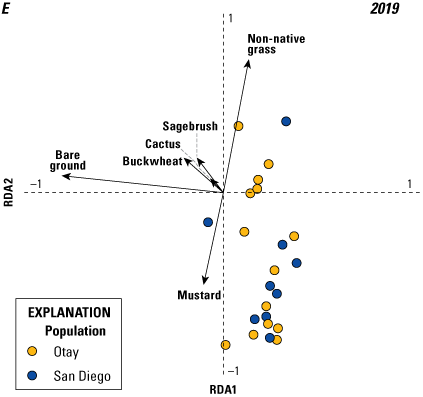
Individual years of variation in vegetation composition across years by redundancy analysis axis 1 and axis 2 among 23 Cactus Wren territories in San Diego County, California. The first axis (RDA1) is a gradient from years with higher cover of bare ground to those with low cover of bare ground. The second axis (RDA2) is a gradient from years with high cover of non-native annual grass to those with high cover of mustard.
Relationship Between Vegetation and Cactus Wren Productivity
We performed a GLMM on the effect of vegetation composition and cover on Cactus Wren productivity. We used the vegetation variables identified in the RDA that were found to have a strong effect on the ordination of the territories (non-native grass, sagebrush, bare ground, mustard, cactus, and buckwheat). Three vegetation variables affected the number of fledglings produced per pair. Percent cover of sagebrush (P=0.07; fig. 18A) had a positive effect on productivity whereas non-native grass (P=0.004; fig. 18C) and mustard (P=0.10; fig. 18B) had negative effects (table 38). Precipitation, as previously discussed (see “Breeding Productivity” section) also was significant in this model, with the number of more fledglings produced with increasing precipitation (P<0.001; fig. 18D). Comparisons of the estimates of the slope coefficients reveal that the precipitation effect (0.42) was 2.6 times stronger than the effect of any vegetation cover variables (highest estimate for vegetation cover variables was −0.16, non-native grass; table 38).
Table 38.
Results from the generalized linear mixed model on the effects of precipitation and vegetation cover on the number of fledglings produced by Cactus Wrens, southern San Diego County, 2015–19.[Precipitation was compiled for the bio-year (July 1–June 30) ending in the current breeding year. Abbreviations: P, probability that the statistical test result was false; <, less than]
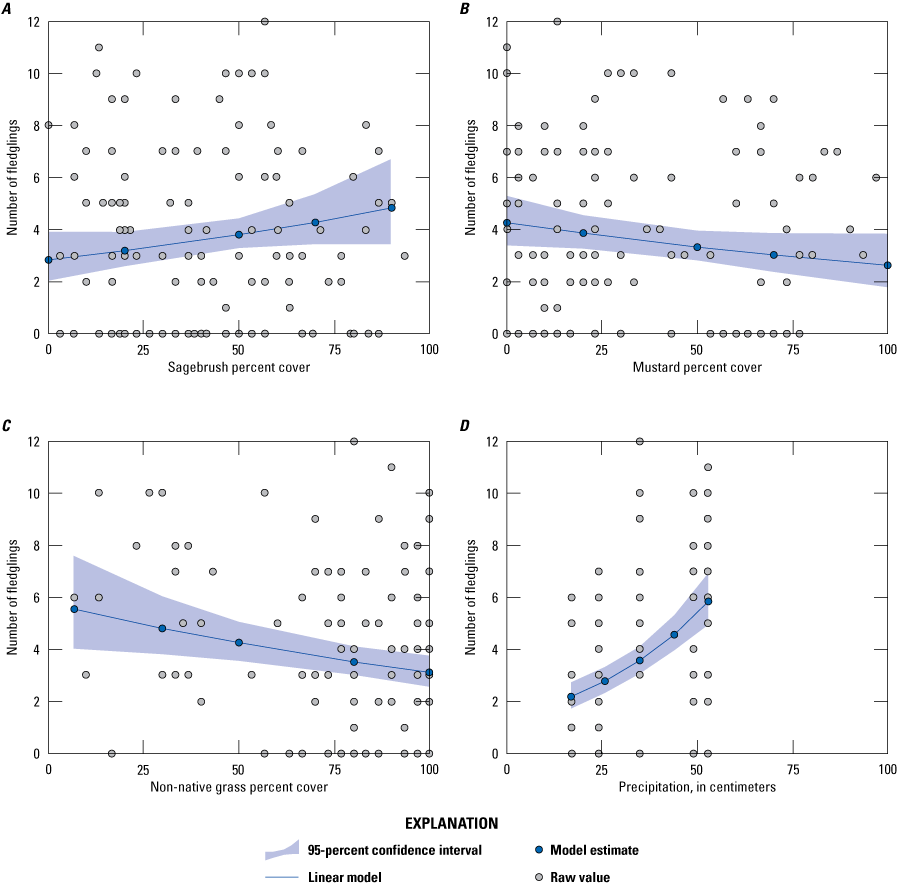
Generalized linear mixed model results and 95-percent confidence interval showing the effects of percent cover (percent of sampling points with vegetation type within 2 meters) of sagebrush, mustard, non-native grass, and precipitation on the number of fledglings produced per pair by Cactus Wrens, southern San Diego County, 2015–19.
To determine whether the vegetation effects on breeding productivity were between-year (as a result of annual changes in precipitation or other effects) or within-year differences we also analyzed each year separately. In 3 of the 5 years, we found a negative effect of non-native grass and mustard on the number of fledglings produced per pair, suggesting that these were within-year effects (table 39). The results for other variables were less clear, appearing either in only a single year (sagebrush and cactus) or having different signs in different years (bare ground and buckwheat).
Table 39.
Summary of the results from five generalized linear models on the effects of vegetation cover on the number of Cactus Wren fledglings per pair in each year, southern San Diego County, 2015–19.[Significant results are indicated by a + (positive effect; +, P=0.10; ++, P=0.05; +++, P=0.01; ++++, P=0.001), a - (negative effect; -, P=0.10; --, P=0.05; ---, P=0.01), or ND (no effect). Abbreviation: P, probability that the statistical test result was false]
Discussion
Between 2015 and 2019, the Cactus Wren population in the Otay River valley increased from a low of 12 territories in 2015 (comparable to the 2014 low count) to peak at 34 territories in 2018 before dropping back down to 25 in 2019. The Cactus Wren populations in the Lake Jennings and Sweetwater/Encanto genetic clusters also peaked in 2018, signifying that conditions across southern San Diego County likely promoted the increase, rather than localized conditions specific to one genetic cluster or population. The proportion of Cactus Wren survey plots that were occupied increased from 2015 through 2019 at the Otay and Sweetwater/Encanto genetic clusters but decreased at the Lake Jennings genetic cluster. The number of Cactus Wren territories increased from 2015 through 2018 at all three genetic clusters, although the increase at Lake Jennings was minor compared to the other two populations. In addition, although the number of territories in all three genetic clusters decreased from 2018 to 2019, the final number of territories at Otay and Sweetwater/Encanto was greater than the number of territories detected in 2015, whereas the final number of territories at Lake Jennings was less than the number detected in 2015. The difference in the population trend at Lake Jennings relative to the other two genetic clusters suggests a variety of possibilities that may be interconnected. First, cactus scrub habitat patches in the Lake Jennings area tended to be smaller and more disjunct than in the Otay population, and the Lake Jennings Cactus Wrens may already occupy all currently suitable habitat known in the area. Therefore, any increase in the population would require crowding into areas already occupied by other wrens. This is supported by how little inter-annual movement was detected at the San Diego population (including Lake Jennings and Sweetwater/Encanto) compared to the Otay population. Second, Lake Jennings Cactus Wrens that did move may have dispersed outside and north of our study plots where we did not perform surveys. In 2019, we found one Cactus Wren in San Pasqual Valley that had dispersed from Lake Jennings. This was the only Cactus Wren that we located outside of the Lake Jennings area that originated from Lake Jennings. No Cactus Wrens from Lake Jennings were found in the more southern survey areas (Otay and Sweetwater/Encanto) nor were any Cactus Wrens from the southern survey areas found at Lake Jennings. Likely there are barriers to dispersal south of Lake Jennings (for instance, Interstate 8 and urban development) that present obstacles to genetic exchange between these two areas. Barr and others (2015) found little to no genetic connectivity among the three genetic clusters, suggesting a high degree of isolation among them. Although uncommon, we documented five instances of dispersal between the Otay and Sweetwater/Encanto populations. Third, the Lake Jennings Cactus Wrens may be experiencing low breeding productivity or survivorship, demonstrating a true contraction of that population.
Breeding productivity, survival, and movements of adult and first-year Cactus Wrens indicate that the Otay population behaved similarly to, and in some cases out-performed, the San Diego population over the span of our project. Daily nest survival rate was consistently and significantly higher within the Otay Cactus Wren population than within the San Diego population. The Otay population also produced at least as many fledglings per pair each year as the San Diego population, and twice as many fledglings per pair as the San Diego population in 2019. Survivorship of adults and first-year birds were equal between the Otay and San Diego populations, as was the distance of first-year dispersal and adult movements between years. Cumulatively, we found little evidence that the driving force behind low numbers of Cactus Wrens in the Otay population before 2015 was still occurring as of 2015.
The Otay and San Diego Cactus Wren populations exhibited a similar pattern in breeding productivity from 2015 through 2018. However, this pattern was disrupted in 2019. Breeding productivity for both populations was low in 2018 and increased in 2019 in the Otay population but not in the San Diego population. In 2019, although the Otay and San Diego populations initiated a similar number of brood nests per pair, the Otay population produced twice as many fledglings per pair, had higher egg hatching and hatchling fledging success, and higher overall nest fledging success than the San Diego population. One third of the pairs in the San Diego population did not successfully fledge young in 2019, whereas all 12 pairs in the Otay population successfully fledged young. Nests (and individual eggs and hatchlings) in the San Diego population were more susceptible to loss between hatching and fledging than during the egg stage in 2019.
Differential hatching and fledging success at the two populations in 2019 may have been influenced by the positive effect of habitat restoration in the Otay population, the persistence of annual herbaceous cover in the San Diego population, the continued, and possibly increased, disturbance in the San Diego population and associated predators, lingering effects of 2003 and 2007 wildfires in parts of the San Diego population or a combination of any of these factors. Cactus planting and habitat restoration (annual herb control, shrub-thinning) was initiated at Salt Creek in the Otay population in 2009 (Bennett and Dodero, 2011), and beginning in 2016 (Goddard, 2019), occurred near and within monitored Cactus Wren territories. Areas of thick shrubs (buckwheat, sagebrush, and lemonadeberry) were thinned or removed entirely from cactus patches over several seasons (during non-breeding periods). Annual grasses and forbs were sprayed with herbicide in the clearings. Cactus buds (mostly cholla) were snapped off mature cactus and planted throughout the restoration site. Three restoration patches were established within our monitoring area in Salt Creek and were used by Cactus Wrens shortly after restoration activity began. Public access to the Salt Creek area was also discouraged with locked gates and sensitive habitat signs. The mesa west of Johnson Canyon (Lonestar Ridge, also in the Otay population) has been undergoing habitat restoration since at least 2008 (The Nature Conservancy and San Diego Management and Monitoring Program, 2015) to remove weeds and to establish and enhance cactus growth for sensitive wildlife species including Cactus Wrens. Additionally, the riparian vegetation at the bottom of Johnson Canyon (next to monitored Cactus Wren territories and used by post-fledging families) was restored starting in 2016. Weed control in the cactus scrub in Johnson Canyon began in 2008 and has continued in Lonestar Ridge and Johnson Canyon throughout our project period. Public access to Johnson Canyon and the western mesa has also been restricted by locked gates, although the dirt road along the bottom of the canyon continued to be used.
Conversely, mustard, a disturbance-driven invasive annual plant, was more common across Cactus Wren territories in the San Diego population than in the Otay population. Mustard cover was negatively associated with Cactus Wren breeding productivity. Also, monitored territories in the San Diego population were subject to disturbance, mostly from recreation, throughout the 5-year period of our project. Monitored territories at Lake Jennings occurred mostly within the Lake Jennings Park campground and along a well-travelled fishing access road and much of the Lake Jennings cactus scrub was within the perimeter of the 2003 Cedar wildfire. The number of territories in this area increased between 2015 and 2019, although the number of occupied survey plots did not, suggesting that Cactus Wrens may have been crowding into the available habitat at Lake Jennings, and some pairs may have been pushed into marginal habitat. One pair at Lake Jennings colonized a popular fishing spot in 2018 and 2019. This territory was not monitored in 2018, but all four nests in this territory failed in 2019. In 2018, a wren pair built a nest largely composed of fishing line and at least one young wren became entangled in the fishing line and died. The birds at this territory and in neighboring territories were frequently observed foraging in open dumpsters. In 2017, an adult male disappeared shortly after its nest fledged, leaving the female to tend to six fledglings before a new, unbanded male claimed the territory. In 2019, one Cactus Wren pair disappeared from a territory at Lake Jennings, abandoning a nest with hatchlings. One adult disappeared from another Lake Jennings territory, leaving its mate to tend a single fledgling.
Habitat restoration has been occurring on the San Diego National Wildlife Refuge, near monitored Cactus Wren territories, replacing cactus burned in wildfires. In 2018, a cactus patch that had been planted in 2011 (J. Martin, biologist at San Diego National Wildlife Refuge, oral commun., 2021) was colonized by a pair of Cactus Wrens that remained on-territory at least through 2019. However, two other territories in this area at the nearby Sweetwater Summit County Park were abandoned between 2018 and 2019. In 2019, both adults disappeared from a territory in Sweetwater Summit County Park, (adjacent to a campground and within a trail system that was regularly used by hikers and bicyclers) in the week their hatchlings were predicted to fledge. The family was not seen again in 2019 and the nest was assumed to have failed. Another pair near the Sweetwater Summit County Park campground had four nests in 2019, all of which failed the week before the hatchlings were predicted to fledge. The cause of failure for three of these nests was likely predation, although one contained dead hatchlings and ants when it was discovered to have failed.
Nest predation has been identified as possibly adversely affecting bird nesting in coastal sagebrush communities, particularly in Cactus Wrens in Orange County (Preston and Rotenberry, 2006; Kamada and Preston, 2013). Between 26 and 48 percent of Cactus Wren nests were presumed depredated during the 5 years of our project. Nest depredation rates as a proportion of all nest failures were similar between the two populations throughout all years; however, in 2019, the San Diego population experienced a much higher nest failure rate (54 percent) than the Otay population (10 percent) and 29 percent of the nest failures at the San Diego population were attributed to causes other than nest depredation (although two nests failed when one or both adults disappeared). We attributed the disappearance of adults and many nest failures to predation; however, examination of predation and documentation of the presence of predators was not part of our study design. More intensive techniques that might elucidate the role of predators in Cactus Wren nest fate include cameras directed at active nests and regular surveys for predators, including corvid and raptor nest surveys. Although predation appeared to be a major contributor to nest failures and the disappearance of adults, other sources of nest failure may be important to consider.
Although we found variability in vegetation composition and arthropod abundance among territories, we were able to control for that variation to recognize patterns in these two variables across territories. When controlling for Cactus Wren territory, arthropod abundance was most strongly affected by a combination of vegetation type and sampling period but was not influenced by vegetation alone. The inclusion of sampling period suggests that different vegetation types were important sources of arthropod prey at different periods of the Cactus Wren breeding cycle, and therefore, a mix of plant species provides the most stable and reliable prey source throughout the year.
Availability of arthropods during early and peak nesting periods is likely to affect breeding productivity (the number of fledglings produced; Simons and Martin, 1990; Illera and Díaz, 2006). These are the periods during which adults initiate nests and lay eggs, and availability of prey can influence the number of eggs laid and energy expenditure of adults required to brood eggs and tend nestlings. We found that the most vulnerable stage of the Cactus Wren nesting cycle was during the transition from eggs to hatchlings: hatching rate increased with more precipitation and was higher in the Otay population than in the San Diego population. Furthermore, the hatching rate of individual eggs was lower than for entire nests, suggesting infertility, partial predation, inadequate tending by adults, asynchronous hatching which may lead to increased fatality of younger nestlings, or other factors that caused partial nest failure while allowing some hatchlings to survive and fledge. During the early and peak breeding periods, arthropods were most abundant in native bunch grass, which was absent from Lake Jennings within the San Diego population and uncommon at virtually all Cactus Wren territories that we sampled.
Lemonadeberry and elderberry also were uncommon across all territories and absent from several. However, arthropod prey abundance was high in elderberry, relative to other vegetation, in the early and late nesting periods and was moderately high in lemonadeberry in the peak nesting period. Non-native grass was common across all Cactus Wren territories and supported low arthropod prey abundance in the early nesting season relative to other vegetation; however, it supported moderate arthropod prey abundance in the peak nesting season and high arthropod abundance in the late nesting period.
Despite the relative abundance of arthropod prey in non-native grass, we found a negative relationship between Cactus Wren breeding productivity and cover of non-native grass. Arthropod abundance (as sampled by pitfall traps) and arthropod availability may not be equal, depending on vegetation structure (see Hutto, 1990; Wolda, 1990). The structure of native bunch grass required that pitfall traps be placed in close proximity to the base of the grass and not actually within the clump. For arthropods to be captured, they had to move away from the base of the clump to fall into the pitfall trap. This behavior makes arthropods vulnerable to depredation by Cactus Wrens which frequently forage on open ground and litter near the base of vegetation. Therefore, pitfall traps in native bunch grass vegetation likely sample the availability of the arthropods to Cactus Wrens and not just the abundance of arthropods in the vegetation type. Annual plants, such as non-native grass and mustard, grow in large patches with thick stem density and foliage near the ground, vegetation structure that may be less attractive to ground-foraging Cactus Wrens but that can easily accommodate a pitfall trap within the patch. Therefore, although arthropods may be abundant in these vegetation types, they may not be as available to Cactus Wrens as their abundance predicts. Non-native grass cover was particularly high within the San Diego population where it averaged 15 to 20 percent more cover than any other vegetation type. Mustard cover was also high in the San Diego population relative to the Otay population.
Cactus Wren breeding productivity was positively related to sagebrush cover. Sagebrush contained moderately high arthropod abundance in the peak and late nesting periods relative to other vegetation types and was relatively common in Cactus Wren territories in the San Diego population, though less so in the Otay population. Shrubs such as sagebrush and buckwheat have high stem and foliage density near the base; however, these shrubs also have higher canopy area per stem, requiring more space between shrub stems and providing openings near the ground that were accessible to wrens. Vacuuming of foliage was intended to collect canopy-dwelling arthropods such as lepidopteran larvae, which have been identified as common Cactus Wren prey. Only 5 percent of arthropod prey were collected using the vacuum protocol for this study, likely an under-representation of the abundance of these canopy-dwelling species. Future examination of arthropod prey relationships could be improved by spending more time vacuuming foliage.
Overall, precipitation appeared to be a driver of Cactus Wren survivorship and breeding productivity, likely obscuring any proximate effects of arthropod or vegetation composition. The effect of precipitation on the number of fledglings produced was more than two times the effect of any of the vegetation cover variables. The relationship between vegetation and breeding productivity was further complicated by the fact that vegetation cover was also affected by precipitation, making it challenging to tease apart whether differences in productivity were a result of within-year differences in vegetation structure or between-year changes in vegetation attributable to the level of annual precipitation. Vegetation cover also varied by territory and by year with shifts in the amount of annual herbaceous vegetation (especially non-native grasses and mustard) that tracked precipitation levels. We found that generally Cactus Wren productivity increased with precipitation and that the cover of non-native grasses and mustard also increased with precipitation. However, even when evaluating vegetation and productivity on an annual basis, we found negative relationships between the number of fledglings produced and the cover of both of these vegetation types in 3 out of 5 years, suggesting that Cactus Wrens were negatively affected by the cover of non-native grasses and mustard, regardless of precipitation levels.
It is possible that there is a link between arthropod abundance, vegetation composition, and Cactus Wren breeding productivity and survivorship that we did not discover because we only sampled arthropods for one breeding season (2016) that followed a bio-year of moderate precipitation. Precipitation was likely sufficient to stimulate primary productivity and provide an adequate prey base during 2016. In a low precipitation year, arthropods would likely be more limited and may express more of a relationship with particular vegetation types that provide refuge and resources (for instance, vegetation types that are more resilient to drought).
The peak in Cactus Wren numbers at all locations in 2018 corresponded to high breeding productivity the previous year (2017) followed by high annual survival from 2017 to 2018. The number of Cactus Wren nesting attempts, the proportion of nests that successfully fledged, egg clutch size, and the number of fledglings produced per pair during our project were all correlated with precipitation. Similarly, low precipitation in the 2017–18 bio-year corresponded to low breeding productivity in 2018 and low annual survival from 2018 to 2019. DeSante and Geupel (1987), Grant and others (2000), and Morrison and Bolger (2002) documented the influence of the timing and amount of precipitation in arid and semi-arid ecosystems such as southern California on reproductive timing and output in birds. Increased number of nesting attempts and increased size and survivorship of young have been linked to increased food availability during the Cactus Wren nestling stage (Simons and Martin, 1990). Similarly, Illera and Díaz (2006) found that the onset of Canary Island Stonechat (Saxicola dacotiae) breeding closely matched the onset of precipitation in a semi-arid system with seasonal autumn-winter rains. Arthropod availability on the Canary Islands also was positively related to the previous month’s rainfall, and the number of nesting attempts, egg clutch size, and the number of fledglings produced per stonechat pair were correlated with arthropod availability. França and others (2020) also found that the onset of reproduction was correlated with the onset of seasonal precipitation, although they did not find a direct link between precipitation and the timing of reproduction and instead suggested that the proximate mechanism of prey availability was the cue triggering breeding. In our study, daily nest survival for Cactus Wrens was not strongly associated with precipitation, suggesting that once a nest was initiated, other factors (for example, predation, location-specific arthropod availability) were more important determinants of its survival. Preston and Rotenberry (2006) found that food availability and nest predation each had an effect on annual reproductive output in birds in southern California chaparral. Although precipitation was identified as a consistent driver of Cactus Wren survivorship and breeding productivity, year was better than precipitation at predicting survivorship. This supports the contention that a combination of factors varied annually to influence Cactus Wren demographics.
References Cited
Barr, K.R., Kus, B.E., Preston, K.L., Howell, S., Perkins, E., and Vandergast, A.G., 2015, Habitat fragmentation in coastal southern California disrupts genetic connectivity in the cactus wren (Campylorhynchus brunneicapillus): Molecular Ecology, v. 24, no. 10, p. 2349–2363. [Available at https://doi.org/10.1111/mec.13176.]
Bennett, A., and Dodero, M., 2011, 2009–10 Annual report for Otay Ranch Preserve—Salt Creek and San Ysidro Parcels: Prepared for City of Chula Vista, San Diego Management and Monitoring Program, 193 p., accessed December 13, 2021, at https://sdmmp.com/view_article.php?cid=CID_ctamanah%40usgs.gov_57640ac7b66c7.
Buttigieg, P.L., and Ramette, A., 2014, A guide to statistical analysis in microbial ecology—A community-focused, living review of multivariate data analyses: FEMS Microbiology Ecology, v. 90, no. 3, p. 543–550. [Available at https://doi.org/10.1111/1574-6941.12437.]
Calenge, C., 2006, The package adehabitat for R software—A tool for the analysis of space and habitat use by animals: Ecological Modelling, v. 197, nos. 3–4, p. 516–519. [Available at https://doi.org/10.1016/j.ecolmodel.2006.03.017.]
Christensen, R.H.B., 2019, Package ‘ordinal’—Regression models for ordinal data: R package version 2019.12-10, accessed December 13, 2021, at https://CRAN.R-project.org/package=ordinal.
DeSante, D.F., and Geupel, G.R., 1987, Landbird productivity in central coastal California—The relationship to annual rainfall and a reproductive failure in 1986: The Condor, v. 89, no. 3, p. 636–653. [Available at https://doi.org/10.2307/1368653.]
Dinsmore, S.J., White, G.C., and Knopf, F.L., 2002, Advanced techniques for modeling avian nest survival: Ecology, v. 83, no. 12, p. 3476–3488. [Available at https://doi.org/10.1890/0012-9658(2002)083[3476:ATFMAN]2.0.CO;2.]
França, L.F., Figueiredo-Paixão, V.H., Duarte-Silva, T.A., and dos Santos, K.B., 2020, The effects of rainfall and arthropod abundance on breeding season of insectivorous birds, in a semi-arid neotropical environment: Zoologia, v. 37, p. 1–7. [Available at https://doi.org/10.3897/zoologia.37.e37716.]
Goddard, C., 2019, City of Chula Vista Otay River Valley and Salt Creek Cactus Wren 3 project (SANDAG Grant #5004731)—Year 3, 4th quarter: Final report for the San Diego Association of Governments, San Diego Management and Monitoring Program, 50 p., accessed December 13, 2021, at https://sdmmp.com/view_article.php?cid=SDMMP_CID_187_5eebe5ffa2955.
Grant, P.R., Grant, B.R., Keller, L.F., and Petren, K., 2000, Effects of El Nino events on Darwin’s Finch productivity: Ecology, v. 81, no. 9, p. 2442–2457. [Available at https://doi.org/10.2307/177466.]
Hamilton, R.A., Proudfoot, G.A., Sherry, D.A., and Johnson, S., 2020, Cactus Wren (Campylorhynchus brunneicapillus), version 1.0, in Poole, A.F., ed., Birds of the world: Cornell Lab of Ornithology, Ithaca, NY, USA, accessed October 14, 2020, at https://doi.org/10.2173/bow.cacwre.01.
Hutto, R.L., 1990, Measuring the availability of food resources: Studies in Avian Biology, v. 13, p. 20–28. [Available at https://sora.unm.edu/node/139265.]
Illera, J.C., and Díaz, M., 2006, Reproduction in an endemic bird of a semi-arid island—A food-mediated process: Journal of Avian Biology, v. 37, no. 5, p. 447–456. [Available at https://doi.org/10.1111/j.2006.0908-8857.03676.x.]
Kamada, D., and Preston, K., 2013, Nature reserve of Orange County—Coastal Cactus Wren dispersal and survival surveys, genetics, and parasite sampling and arthropod foraging ecology in 2012: Annual report prepared in fulfillment of reporting requirements for the memorandum of understanding between Dana Kamada and the California Department of Fish and Wildlife, 92 p., accessed December 13, 2021, at https://sdmmp.com/upload/SDMMP_Repository/0/25hms3p4y9qxw7rv18gdkzncbft0j6.pdf.
Kus, B.E., and Lynn, S., 2022, Surveys and monitoring of Coastal Cactus Wren in southern San Diego County: U.S. Geological Survey data release, accessed December 13, 2021, at https://doi.org/10.5066/F76H4FK5.
Laake, J.L., 2013, RMARK—An R interface for analysis of capture-recapture data with MARK: Seattle Wash, AFSC Processed Rep 2013–01, National Oceanic and Atmospheric Administration, Alaska Fisheres Science Center, National Marine Fisheries Service, 25 p., accessed December 13, 2021, at https://www.researchgate.net/publication/267509042_RMark_an_R_Interface_for_analysis_of_capture-recapture_data_with_MARK.
Morrison, S.A., and Bolger, D.T., 2002, Variation in a sparrow’s reproductive success with rainfall—Food and predator-mediated processes: Oecologia, v. 133, no. 3, p. 315–324. [Available at https://doi.org/10.1007/s00442-002-1040-3.]
National Oceanic and Atmospheric Administration, 2020, Global summary of the month dataset—Precipitation (PRCP): National Centers for Environmental Information, accessed October 14, 2020, at https://www.ncdc.noaa.gov.
Preston, K., and Kamada, D., 2012, Nature reserve of Orange County—Monitoring Coastal Cactus Wren reproduction, dispersal and survival, 2009–11: Final report prepared for California Department of Fish and Game, LAG# P0982013, 85 p., accessed December 13, 2021, at https://nrm.dfg.ca.gov/FileHandler.ashx?DocumentID=46786&inline.
Preston, K.L., and Rotenberry, J.T., 2006, The role of food, nest predation, and climate in timing of Wrentit reproductive activities: The Condor, v. 108, no. 4, p. 832–841. [Available at https://doi.org/10.1093/condor/108.4.832.]
R Core Team, 2020, R—A language and environment for statistical computing: R Foundation for Statistical Computing, Vienna Austria, accessed December 13, 2021, at http://www.R-project.org.
Reynolds, M.H., Slotterback, J.W., and Walters, J.R., 2006, Diet composition and terrestrial prey selection of the Laysan Teal on Laysan Island: Atoll Research Bulletin, v. 543, p. 181–199. [Available at https://repository.si.edu/handle/10088/33930.]
Simons, L.S., and Martin, T.E., 1990, Food limitation of avian reproduction—An experiment with the Cactus Wren: Ecology, v. 71, no. 3, p. 869–876. [Available at https://doi.org/10.2307/1937358.]
Solek, C., and Szijj, L.J., 2004, Cactus Wren (Campylorhynchus brunneicapillus), in The coastal shrub and chaparral bird conservation plan—A strategy for protecting and managing coastal scrub and chaparral habitats and associated birds in California: California Partners in Flight, accessed October 14, 2020, at http://www.prbo.org/calpif/htmldocs/species/scrub/cactus_wren.html.
The Nature Conservancy and San Diego Management and Monitoring Program, 2015, South San Diego County coastal Cactus Wren (Campylorhynchus brunneicapillus) habitat conservation and management plan: Prepared for San Diego Association of Governments, accessed December 13, 2021, at https://sdmmp.com/upload/projects/20160330_2357_194.pdf.
White, G.C., and Burnham, K.P., 1999, Program MARK—Survival estimation from populations of marked animals: Bird Study, v. 46, no. S1, p. S120–S139. [Available at https://doi.org/10.1080/00063659909477239.]
Wolda, H., 1990, Food availability for an insectivore and how to measure it: Studies in Avian Biology, v. 13, p. 38–43. [Available at https://sora.unm.edu/node/139267.]
Datum
Horizontal coordinate information is referenced to the World Geographic System of 1984 (WGS 84).
Supplemental Information
Note to U.S. Geological Survey users: Use of hectare (ha) as an alternative name for square hectometer (hm2) is restricted to the measurement of small land or water areas.
For more information concerning the research in this report, contact the
Director, Western Ecological Research Center
U.S. Geological Survey
3020 State University Drive East
Sacramento, California 95819
https://www.usgs.gov/centers/werc
Publishing support provided by the U.S. Geological Survey
Science Publishing Network, Sacramento Publishing Service Center
Disclaimers
Any use of trade, firm, or product names is for descriptive purposes only and does not imply endorsement by the U.S. Government.
Although this information product, for the most part, is in the public domain, it also may contain copyrighted materials as noted in the text. Permission to reproduce copyrighted items must be secured from the copyright owner.
Suggested Citation
Lynn, S., Houston, A., and Kus, B.E., 2022, Distribution and demography of Coastal Cactus Wrens in Southern California, 2015–19: U.S. Geological Survey Open-File Report 2022-1044, 44 p., https://doi.org/10.3133/ofr20221044.
ISSN: 2331-1258 (online)
Study Area
| Publication type | Report |
|---|---|
| Publication Subtype | USGS Numbered Series |
| Title | Distribution and demography of Coastal Cactus Wrens in Southern California, 2015–19 |
| Series title | Open-File Report |
| Series number | 2022-1044 |
| DOI | 10.3133/ofr20221044 |
| Publication Date | August 30, 2022 |
| Year Published | 2022 |
| Language | English |
| Publisher | U.S. Geological Survey |
| Publisher location | Reston, VA |
| Contributing office(s) | Western Ecological Research Center |
| Description | Report: ix, 44 p.; Data Release |
| Country | United States |
| State | California |
| Online Only (Y/N) | Y |