

Abundance of Eelgrass (Zostera marina) at Key Black Brant (Branta bernicla nigricans) Wintering Sites Along the Northern Pacific Coast of Baja California, Mexico, 1998–2012
Links
- Document: Report (2.8 MB pdf) , HTML , XML
- Related Work: OFR 2022-1004 — Spatial extent of seagrasses (Zostera marina and Ruppia maritima) along the central Pacific coast of Baja California, Mexico, 1999–2000
- Data Releases:
- USGS data release - Point sampling data for eelgrass (Zostera marina) and widgeongrass (Ruppia maritima) abundance in embayments of the north Pacific coast of Baja California, Mexico, 1998–2012
- USGS data release - Mapping data of eelgrass (Zostera marina) distribution, Alaska and Baja California, Mexico
- Download citation as: RIS | Dublin Core
Acknowledgments
This study was funded by the U.S. Fish and Wildlife Service through the North American Wetlands Conservation Act, Ducks Unlimited de Mexico, and U.S. Geological Survey Alaska Science Center (USGS ASC). The research was not possible without a dedicated USGS-ASC field team who assisted with the seagrass surveys. In particular, special gratitude goes to Matthew Anderson, Blake Bartzen, Cody Dean, Adrian Gall, James Hall, Tyler Lewis, Danielle Mason, Kelsey Navarre, Dan Rizzolo, Dina Roberts, Marnie Shepherd, and Erin Spear for their many hours spent in the cold, sting ray-infested Pacific “intertidal” waters. Logistical support and assistance was provided by the following individuals and institutions: Caroline Rakos, George Rakos, Richard Wheeler, Dorothy Wheeler, and James White at Bahia San Quintin; Don Brubaker, Slater Buck, John Martin, Mendel Stewart, and Val Urban of San Diego National Wildlife Refuge; Jose Ley, Maria de Los Angeles, Fedrico Liera Mayoral, and staff at Kuyima; Alejandro Cabello-Pasini of the Instituto de Investigaciones Oceanológicas Universidad Autónoma de Baja California; Jorge Ayala, Martin Dominguez, Edmundo Elorduy, Martin Guiterrez, Fernando Heredia, and staff at Compañia Exportadora de Sal; and Víctor Sánchez-Sotomayor and staff at the Vizcaino Biosphere Reserve. The findings and conclusions in this report are those of the authors and do not necessarily represent the views of the U.S. Fish and Wildlife Service.
Abstract
Trends in the abundance and distribution of eelgrass (Zostera marina), the primary winter forage of black brant (Branta bernicla nigricans), was evaluated at three major wintering sites for black brant along the northern Pacific coast of Baja California, Mexico. This region of northwestern Mexico contains significant beds of eelgrass that were showing signs of decline, which may negatively affect the Pacific flyway population of black brant. Embayment-wide surveys of eelgrass were conducted at Bahia San Quintin (BSQ), Laguna Ojo de Liebre (LOL), and Laguna San Ignacio (LSI) between 1998 and 2012 to estimate baselines and trends in the distribution and abundance of this seagrass in Mexico. Eelgrass was the most abundant and frequently encountered seagrass in each site across survey years. Density and aboveground biomass of eelgrass was greater in BSQ than in LOL and LSI while abundance of widgeongrass (Ruppia maritima), a secondary source of food for brant, was greatest in LSI across survey years. Widgeongrass occurred higher in the intertidal zone than did eelgrass in all embayments, and both seagrasses generally shifted to lower water depths along a southward latitudinal gradient. A negative temporal trend in abundance of seagrasses was detected in BSQ that appeared linked to impacts of climate warming and an increase in macroalgae populations. Decreases in abundance of seagrasses were also detected in LOL and LSI, although long-term trends were less certain in LOL. Overall, declines in abundance of eelgrass in Baja California may be influencing the ongoing shift in the winter distribution of brant to areas north of the Mexican border.
Introduction
Northwestern Mexico is the predominant wintering area for black brant (Branta bernicla nigricans; hereinafter “brant”) in the eastern Pacific Flyway. Up to 95 percent of the brant population has traditionally wintered in this region of Mexico, but since the 1980s numbers of brant have steadily declined and now northwestern Mexico barely supports a majority (55 percent) of the overall population (2017–19 3-year running average; Olson, 2019). This negative trend in the brant wintering population in Mexico has coincided with the region’s declining environmental conditions for eelgrass (Zostera marina), the primary food of brant during the non-breeding season (Ward and others, 2003; Ward and others, 2005; Lewis and others, 2020). Reductions in eelgrass availability and abundance at brant wintering areas have been linked to lower survival (Leach and others, 2017; Stillman and others, 2021), reduced reproductive performance (Sedinger and others, 2006, 2011; Schamber and others, 2012), lower population size (Sedinger and others, 2006), and use of alternative winter and spring staging sites (Wilson and Atkinson, 1995; Lindberg and others, 2007; Sedinger and others, 2011) in brant.
In Mexico, most (80 percent) brant winter within protected eelgrass embayments along the northern Pacific coast of Baja California (Palacios and Ávila, 2019). These embayments contain some of the largest eelgrass meadows on the west coast of North America (Wyllie-Echeverria and Ackerman, 2003; Ward, 2022; Ward and Hogrefe, 2022). A significant portion of these meadows occur intertidally, which is particularly valuable to brant because they cannot dive and, therefore, rely on access to exposed eelgrass shoots during low tides. Brant spend more than 80 percent of their daylight time feeding during low tides and prefer low-intertidal eelgrass beds where nutrient quality and abundance are greatest (Ward and Stehn, 1989; Moore and Black, 2006). Therefore, it is critical to monitor the status and trends of eelgrass in brant wintering areas of northern Baja California.
These eelgrass-dominated embayments used by brant also provide food and refuge for a variety of ecologically and commercially valuable marine fauna, such as bivalves (for example, oysters, Crassostrea gigas; scallops, Argopecten ventricosus), crustaceans (for example, lobsters, Panulirus spp.; shrimp, Penaeus spp.), eastern Pacific green turtles (Chelonia mydas), finfish (for example, sea bass, Paralabrax spp., Mycteroperca spp; rays and skates, Rhinobatos spp.), and hundreds of thousands of waterbirds (Massey and Palacios, 1994; Dedina and Young, 1995; Ramírez-Rodríguez and Ojeda-Ruíz, 2012). As such, a significant portion of the local economy (in other words, commercial and sport fisheries, aquaculture, sport hunting, and tourism) of Baja California depends on the marine resources of these coastal embayments (Aguirre-Muñoz and others, 2001). Consequently, changes in the abundance and distribution of eelgrass not only impact brant, but also affect the economies of the local communities of Baja California (Aguirre-Muñoz and others, 2001).
Eelgrass meadows of Baja California are coming under increasing threats from direct and indirect human activity (in other words, aquaculture, residential and commercial [salt mining] development) and climate warming (Ibarra-Obando and Escofet, 1987; Ortega and Castellanos, 1995; Aguirre-Muñoz and others, 2001; Rodríguez-Salinas and others, 2010); however, quantifiable data on the status and trends of this and other seagrasses are largely lacking. In the only published study of seagrass abundance trends in Mexico, Ward and others (2003) reported declines in spatial extent of eelgrass beds in Bahia San Quintin (BSQ) over a 13-year period (1987–2000). More recent genetic studies of eelgrass populations suggest that fragmentation and loss may be occurring across a broader scale in northwestern Mexico (Muñiz-Salazar and others, 2005, 2006). Ward and others (2003) attributed the eelgrass losses in BSQ primarily to degrading environmental conditions (flooding, sediment loading) associated with El Niño Southern Oscillation (ENSO) events. ENSO events and the associated rise in sea surface temperature, sea level and precipitation have also been linked to reductions in eelgrass distribution and abundance in other Pacific coast embayments (Cabello-Pasini and others, 2002; Johnson and others, 2003; Thom and others, 2003) and are increasing in intensity and frequency in the north Pacific (Anderson and others, 1992; Timmermann and others, 2003; Ward and others, 2005; Bromirski and others, 2013).
Eelgrass populations in Mexico are vulnerable to rising temperatures because they occur at the southern limit of this species’ range in the Northern Hemisphere (Riosmena-Rodriguez and Sanchez-Lizaso, 1997; Green and Short, 2003) and are thus already constrained by high sea temperatures and irradiance levels (Meling-López and Ibarra-Obando, 1999; Cabello-Pasini and others, 2003). For example, eelgrass populations along the northeastern coast of the Gulf of California, Mexico (for example, Canal del Infiernillo) are annuals, as shoots die during the hot summer months (Phillips and Backman, 1983), in contrast to more northerly populations of eelgrass which are perennials. Therefore, it is important to obtain baseline data to monitor potential impacts from climate warming and other human-related activities. In this study, repeatable embayment-wide surveys were conducted between 1998 and 2012 to assess status and trends in the abundance of eelgrass in three key brant wintering in Baja California, Mexico.
Methods
Study Area
Eelgrass surveys were conducted along the northern Pacific coast of Baja California in the three major wintering areas of black brant: Bahia San Quintin (BSQ), Laguna Ojo de Liebre (LOL), and Laguna San Ignacio (LSI; fig. 1). These three embayments combined contain the largest beds of eelgrass in the southern portion of its range in the eastern north Pacific (Wyllie-Echeverria and Ackerman, 2003) and support about 30 percent of the entire Pacific flyway brant population each winter (Olson, 2019; Palacios and Ávila, 2019). The climate of the region is arid with warm average annual air temperatures (15–27 degrees Celsius [oC]) and low average annual precipitation (<15 centimeters [cm]; Phleger and Ewing, 1962; Ibarra-Obando and others, 2001; Cabello-Pasini and others, 2003).
BSQ is the smallest (4,900 hectares [ha]) and shallowest (maximum water depth of about 8 meters [m] at the mouth of the bay) of the three embayments (fig.1). The bay has undergone considerable alterations in support of agriculture, including a dike that extends almost completely across the bay and hundreds of racks and containers used for oyster and other bivalve farming (Ward and others, 2003). Additionally, much of the surrounding land has been plowed for farming, leading to an increase in sediment loading into the bay (Ward and others, 2003). The most common human activity in the bay is boating associated with waterfowl hunting and mariculture.
LOL and LSI are large (58 and 25 kilometers squared [km2], respectively), hypersaline, deeper water (maximum water depths of about 25 m deep) embayments (Ward and others, 2022 situated in the Vizcaino Biosphere Reserve, the largest federally designated protected area in Mexico (fig. 1). They are the principle calving and nursery areas for the northeastern Pacific population of gray whale (Eschrichtius robustus) and important nursery areas for harbor seals (Phoca vitulina) and California sea lions (Zalophus californianus; Rice and others, 1981). LOL and LSI are influenced by warm equatorial surface waters and experience higher sea and air temperatures, lower precipitation, and higher evaporation rates than in BSQ (Cabello-Pasini and others, 2003; Winant and de Velasco, 2003).
LOL has undergone considerable human alteration in support of one the largest salt producing operations in the world (Eberhardt, 1966). Large salt pannes and shrublands adjacent to the lagoon were converted to evaporation ponds or filled to construct buildings and roads. Smaller areas inside the lagoon (channels, salt marshes) were dredged to allow passage of transport barges or filled to accommodate roads and a shipping dock. Guerrero Negro, a town of about 14,000 residents, is located less than 2 km away from the lagoon. Although located in a biosphere reserve, LOL receives considerable human activity primarily from boats associated with transporting salt, fishing, clamming, and whale-watching.
LSI is the least altered of the three embayments and has had historically few permanent residents along its shores. A small community of about 100 people reside year-round at the lagoon. The most common activities in this lagoon are boating associated with fishing, whale-watching, and oyster-farming.
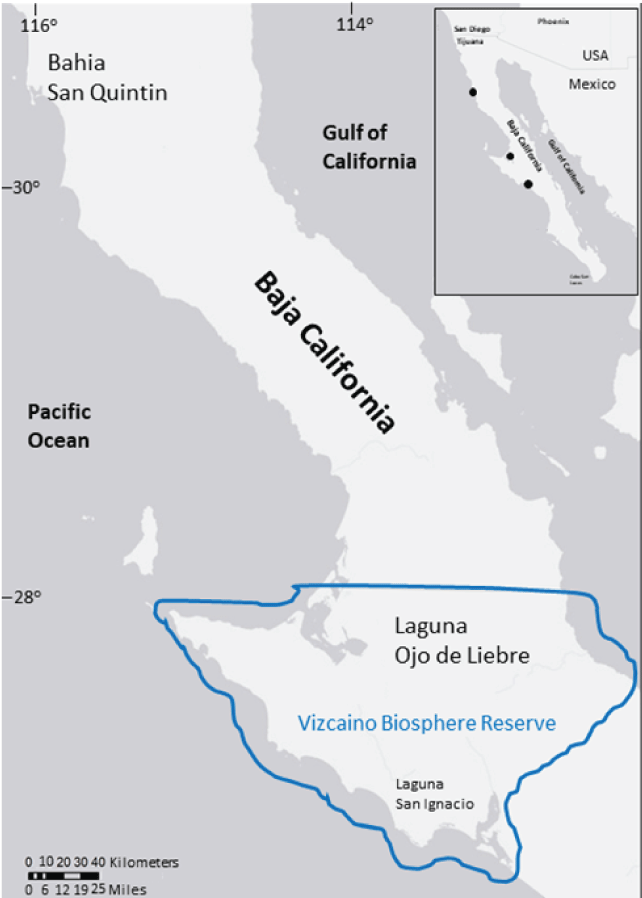
Locations of the three embayments that are assessed for eelgrass (Zostera marina) abundance along the northern Pacific coast of Baja California, Mexico: Bahia San Quintin, Laguna Ojo de Liebre, and Laguna San Ignacio. The two southern embayments are located within the Vizcaino Biosphere Reserve (solid line).
Surveys
The abundance of eelgrass and widgeongrass (Ruppia maritima, a less dominant seagrass that also provides food for brant in Mexico; Ward and others, 2005; Ward and others, 2022) were conducted over a 9–19-day period in late autumn and early winter of 1998, 1999, 2005, and 2012 (table 1). In 1998 and 1999, a point sampling approach was used following a systematic random design, where points were distributed evenly across each of the embayments (BSQ: 500 m spacing between points; LOL and LSI: 1 km spacing between points; fig. 2). The survey area was restricted to points located within high intertidal zone (+1.5 m mean lower low water [MLLW]; upper limit of widgeongrass in the bay excluding salt marsh) to the shallow subtidal (–2.5 m MLLW; deepest depth reachable by snorkeling). This survey area encompassed the majority of the spatial extent of eelgrass (75–80 percent in LOL/LSI and >90 percent in BSQ; Ward and others, 2004; Ward and others, 2022 and all intertidal beds, which are the most critical to brant and at risk to impacts of climate warming (for example, desiccation and disease; Short and Neckles, 1999). In 2012 surveys were restricted to only BSQ and previously identified eelgrass areas within this bay because of time and logistical constraints. Thus, there was only one site estimate (BSQ) for eelgrass abundance in 2012.
Table 1.
Sampling periods and number of days to complete seagrass (Zostera marina) surveys in three embayments along the northern Pacific coast of Baja California, Mexico.[Range of dates is in month/day/year format; —, not applicable]

Distribution of survey points in Bahia San Quintin (A), Laguna Ojo de Libre (B), and Laguna San Ignacio (C), Baja California, Mexico, in 1998, 1999, 2005, and 2012. Stars (A) denote locations of additional abundance surveys.
Points were located by boat and sampled by snorkeling primarily during high tide. At each point, water depth was measured with a tape measure attached to a pole, and percent cover of eelgrass, widgeongrass and all macroalgae (seaweeds) species combined were estimated within four, 0.25-m2 quadrats. We also estimated the distance a 20-cm diameter Secchi disk disappeared from the surface when lowered into the water. If eelgrass or widgeongrass was present at a point, five representative plants were collected from each quadrat and measured for shoot length. Water depth (m) measurements were standardized to MLLW by subtracting the measured water depth from the closest publicly available tidal gauges with consideration to observed offsets in the timing of tidal curves. Tidal gauge measurements at San Diego (Broadway), California were used for BSQ with no offset except in the back part of the bay behind the dike (1 hour delay). Tidal gauge measurements at San Carlos, Baja California were used for the other two lagoons with offsets of 0–3 hours in LOL and 0–2 hours in LSI, depending on the location in each lagoon (in other words, no delay at the mouth of lagoon, 1–2 hour-delay mid-lagoon, and 2–3 hour-delay at the back of the lagoon).
A rapid, visual estimation technique was used to assess abundance of seagrasses and seaweeds. This method is quick yet robust and highly repeatable, thereby minimizing among observer differences in estimates of percent cover of seagrasses and seaweeds (Kenworthy and others, 1993). The cover of seagrasses and seaweeds present in a quadrat was assigned a Braun-Blanquet (BB; Braun-Blanquet, 1972) visual cover score (BB score of 0 percent=0; solitary shoot=0.1; 2–5 shoots=0.5; 1–5 percent=1; 6–25 percent=2; 26–50 percent=3; 51–75 percent=4; 76–100 percent=5). From these cover estimates three statistics were computed for eelgrass, widgeongrass and total seaweeds: density, abundance, and frequency of occurrence according to algorithms presented by Fourqurean and others (2001). An abundance index (mean BB score times mean shoot length) was also calculated for each quad with seagrass to estimate aboveground biomass at each point. For quadrats where widgeongrass was present but not measured for shoot length, the mean length of widgeongrass for all quadrats in the year of the survey at a site was used instead.
To establish the relationship between the abundance index and aboveground biomass for each seagrass species, eelgrass and widgeongrass were harvested annually within 12–37 calibration quadrats (0.25-m2) in each embayment. Percent cover (BB score) was assessed and seagrass shoots (aboveground parts only) within each quadrat were removed, cleaned, and 10 representative shoots were measured for shoot length. Samples were then dried to constant mass and weighed to determine biomass per quadrat, which was scaled to grams per square meter (g/m2). Finally, linear regression was used to determine the annual slope of the relationship between the abundance index and aboveground biomass across calibration quadrats for each embayment (eelgrass) or all embayments combined (widgeongrass). An estimate of aboveground biomass was then back-calculated for each seagrass species in a quadrat.
Summary statistics of environmental and seagrass parameters were calculated for each embayment and year after first averaging values of the four quadrats at each point. Means and standard errors are reported unless otherwise noted.
Results and Discussion
Bahia San Quintin
Eelgrass was the dominant seagrass both intertidally (0.0–0.8 MLLW) and subtidally (< 0.0 MLLW) across all survey years in BSQ. Mean tidal depth was lower at survey points with eelgrass (–0.18+0.03 m [range = –1.8 m to 0.8 m; n=392]) than at survey points with widgeongrass, 0.5 m+0.05 m (range= –0.7 m to 1.3 m; n=49; fig. 3) in BSQ, reflecting the generally discrete spatial variation in distribution of these seagrasses in embayments of northern Baja California (fig. 3; Ward and others, 2004; Ward and others, 2022).
During the first 2 years of the survey period (1998, 1999), eelgrass was the most common macrophyte in the bay, occurring on a majority of points (mean=0.74) and with a high density (mean=3.22; table 2). Widgeongrass and seaweeds were less common on points (mean=0.15 and 0.34, respectively) and occurred at a lower density (mean=0.34 and 1.01, respectively) during the first 2 years of our surveys (1998, 1999; table 2). However, this pattern of eelgrass dominance changed during the last 2 years (2005, 2012) of the study, in which we observed fewer points with eelgrass (mean=0.47) with a lower density (mean=1.51) and an increase in the number points with seaweeds (mean=0.58) with a greater density (mean=2.23; fig.4A–B). Moreover, mean aboveground biomass of eelgrass declined between the early (1998, 1999) and later years (2005, 2012) of the survey years (table 2; fig.4C). Widgeongrass aboveground biomass also declined over the 3 years of surveys (table 2; fig. 4D). There was no assessment of widgeongrass biomass in the last year of the study.

Means and 95 percent confidence intervals in tidal depth of the presence of eelgrass (Zostera marina) and widgeongrass among study sites, Baja California, Mexico. Tidal height based on mean lower low water (see “Methods” section). BSQ, Bahia San Quintin; LOL, Laguna Ojo de Liebre; LSI, Laguna San Ignacio.
The increase in seaweeds abundance in 2005 and 2012 was largely driven by an expansion of Ulva spp., which was the most frequently encountered seaweed in the BSQ across all years. The temporal increase in seaweed abundance coincided with an overall decline in biomass of eelgrass (Spearman’s r= –0.184; P=0.001) and widgeongrass (Spearman’s r= –0.214; P=0.001) on survey points. Declines in eelgrass biomass appeared to be similar between intertidal and subtidal areas of the bay.
Seagrass declines that were first detected in the 1990s (Ward and others, 2003) continued through the early 2000s in BSQ (Zertuche-González and others, 2009). Much of the eelgrass losses can be directly attributed to the proliferation of Ulva, particularly in the southern and western parts of the bay (Ward and others, 2003). Large accumulations of drift macroalgae, such as Ulva, can negatively impact eelgrass growth and survival in embayments that become nutrient over-enriched. These fast-growing macroalgae can out compete seagrasses for nutrients and light and eventually displace them as the dominant macrophyte in nutrient enriched embayments (Short and Burdick, 1996; Hauxwell and others, 2001; McGlathery and others, 2001).
Table 2.
Mean annual estimates (and standard errors) of abiotic properties and seagrass and seaweed abundance in Bahia San Quintin, Baja California, Mexico.[n, number of survey points; SE, standard error; cm, centimeter; m, meter; —, no data; g/m2, gram dry mass per square meter]
Braun-Blanquet visual estimation technique (Braun-Blanquet, 1972): 0 percent=0; solitary shoot=0.1; 2 to 5 shoots=0.5;1–5 percent=1; 6–25 percent=2; 26–50 percent=3; 51–75 percent=4; 76–100 percent=5. See Methods section for further details.

Graphs showing means and 95 percent confidence intervals in the frequency of occurrence (A) and density (B) of eelgrass (Zostera marina) and seaweeds, and aboveground biomass of eelgrass (C) and widgeongrass (Ruppia maritima; D) in Bahia San Quintin, Baja California, Mexico, between 1998 and 2012. Dotted lines represent linear regression trends. Biomass of widgeongrass was not assessed in 2012. g/m2, gram per square meter. g/m2, gram per square meter; R2, Spearman's rank correlation coefficient.
The drop in eelgrass abundance also occurred in the eastern part of the bay, but a large portion of this reduction can be linked to ENSO flood events in the winters of 1997–98 and 2009–10 that led to significant sediment loading of eelgrass beds located at or near the mouth of the Simon River (Ward and others, 2003). Reasons for the proliferation of Ulva in BSQ are unknown but may be due to increased nutrient-enrichment from the expansion of oyster farming in the bay (Ward and others, 2003; Zertuche-González and others, 2008), but see Jorgensen and others (2010) for other possible reasons for the Ulva proliferation.
Laguna Ojo de Liebre
Eelgrass was the dominant seagrass species in LOL and largely occurred in the low intertidal to subtidal areas of the lagoon. Mean tidal height of eelgrass across survey points was –0.25+0.03 m (range= –1.4 m to 0.6 m; n=273), slightly lower, but statistically similar to the mean tidal height of eelgrass in BSQ across similar survey years (fig. 3). Widgeongrass occurred primarily in the mid to low intertidal areas in LOL. Mean tidal height of widgeongrass was 0.19+0.03 m (range= –1.0 m to 1.1 m; n=273), which was lower than the mean tidal height of widgeongrass in BSQ (fig. 3). Seaweeds were mainly distributed where eelgrass occurred. Mean tidal height of seaweeds was –0.15+0.04 m (range= –1.4 m to 1.1 m; n=157).
Mean aboveground biomass and shoot length of eelgrass was consistently lower in LOL than in BSQ across common survey years (1998, 1999 and 2005; table 2 and 3). On average over these 3 years, aboveground biomass was three times lower in LOL (24.9 grams [g] per square meter, m2) than in BSQ (75.8 g/m2). The lower eelgrass biomass in LOL was likely driven by the lower density and shorter shoot length of eelgrass in this lagoon (density score: mean=2.0+0.10; length: mean=14.7+0.52 cm) compared to BSQ (density score: mean=2.5+0.11; length: mean=47.0+1.38 cm).
Table 3.
Mean annual estimates (and standard errors) of abiotic properties, and seagrass and seaweed abundance in Laguna Ojo de Liebre, Baja California, Mexico.[n, number of survey points; SE, standard error; cm, centimeter; m, meter; g/m2, gram dry mass per square meter]
Braun-Blanquet visual estimation technique (Braun-Blanquet, 1972): 0 percent=0; solitary shoot=0.1; 2 to 5 shoots=0.5; 1– percent=1 6–25 percent=2; 26–50 percent=3; 51–75 percent=4; 76–100 percent=5. See Methods for further details.
The frequency of occurrence and density of eelgrass decreased in LOL across survey years (fig. 5A–B). This reduction of eelgrass appeared linked to a general increase in frequency of occurrence and density of seaweeds (fig. 5A–B). Nevertheless, a negative trend in aboveground biomass of eelgrass was not detected across survey years (table 3; fig. 5C). It is unclear why a decrease in aboveground biomass was not detected, but it could be related to the stability of shoot lengths in eelgrass, which were stable across survey years (table 3). Aboveground biomass of widgeongrass was highly variable and no trend was detected in this seagrass across the three survey years (table 3; fig. 5D).

Graphs showing means and 95 percent confidence intervals in the frequency of occurrence (A) and density (B) of eelgrass (Zostera marina) and seaweeds, and aboveground biomass of eelgrass (C) and widgeongrass (Ruppia maritima) (D) in Laguna Ojo de Liebre, Baja California, Mexico, between 1998 and 2005. Dotted lines represent linear regression trends.
Laguna San Ignacio
Eelgrass was also the dominant seagrass in LSI, but unlike the other two sites, monotypic beds of eelgrass occurred primarily in subtidal areas. Mean tidal height of eelgrass across survey points was –0.60+0.03 m (range= –1.8 m to 0.4 m; n=136), lower than the mean tidal height of eelgrass at the other two sites (fig. 3). Widgeongrass was the dominant seagrass of intertidal areas in LSI (Ward and others, 2022). Mean tidal height of widgeongrass was –0.16+0.04 m (range= –2.0 m to 0.7 m; n=122), also lower than the mean tidal height of widgeongrass at the other sites (fig. 3). Mean tidal height of seaweeds was –0.39+0.03 m (range= –1.4 m to 0.5 m; n=165).
The deeper depth distribution of eelgrass in LSI was consistent with findings of Cabello and others (2003), who reported that eelgrass shoots grew about 1 m lower within the water column in LSI than in BSQ. They attributed the greater depth distribution of eelgrass to higher water temperatures, irradiance levels and clarity of the more tropical waters in these Vizcaino embayments compared to the more temperate waters and environmental conditions in BSQ.
Table 4.
Mean annual estimates (and standard errors) of abiotic properties, and seagrass and seaweed abundance in Laguna San Ignacio, Baja California, Mexico.[n, number of survey points; SE, standard error; cm, centimeter; m, meter; g/m2, gram dry mass per square meter]
Braun-Blanquet visual estimation technique (Braun-Blanquet, 1972): 0 percent=0; solitary shoot=0.1; 2 to 5 shoots=0.5; 1–5 percent=1; 6–25 percent=2; 26–50 percent=3; 51–75 percent=4; 76–100 percent=5. See Methods for further details.
Mean aboveground biomass of eelgrass was considerably lower per annum in LSI than in BSQ, and slightly higher than aboveground biomass levels in LOL across survey years (tables 2, 3). In contrast, mean aboveground biomass of widgeongrass was two times higher in LSI (6.3+0.5 g/m2) than in BSQ (2.7+0.5 g/m2) and LOL (3.0+0.4 g/m2) across survey years, as reflected by the higher densities and frequency of occurrence of this seagrass in LSI when compared to the other two sites (tables 2, 4).
While frequency of occurrence of eelgrass was highly variable (fig. 6A), mean eelgrass abundance score and aboveground biomass declined across survey years in LSI (table 4; fig. 6B). This reduction in abundance appeared to be driven largely by a declining eelgrass density in all three years and to a lesser extent shoot length, which dropped in 2005 (table 4; fig. 6C).
The decline in eelgrass abundance in LSI, however, doesn’t appear to be linked to an increase in seaweed abundance as was found in BSQ because seaweeds also declined over the survey years (table 4; fig. 6C). Moreover, the decline in eelgrass abundance was not similarly detected in widgeongrass; the aboveground biomass of this seagrass increased over the same survey years (table 4; fig.6D).

Means and 95 percent confidence intervals in the frequency of occurrence and density of eelgrass (Zostera marina) and seaweeds, and aboveground biomass of eelgrass and widgeongrass (Ruppia maritima) in Laguna San Ignacio, Baja California, Mexico, between 1998 and 2005. Dotted lines represent linear regression trends. Confidence intervals represent the upper and lower ends of the 95 percent certainty range of values around the mean of the sample data.
Conclusion
This study provides the first embayment-wide estimates of the aboveground biomass of seagrasses in BSQ, LOL, and LSI. Estimates can be used to monitor changes in this critically important resource for wintering brant and other marine organisms. Eelgrass was the dominant seagrass in each of the embayments, and aboveground biomass was two to three times greater in BSQ than in the two more southerly embayments during late autumn–early winter. This result is consistent with site-specific estimates in eelgrass abundance at these embayments over the entire year (Cabello and others, 2003). The higher aboveground biomass and availability of eelgrass in BSQ are likely important factors for the greater numbers of brant that winter in BSQ than in LOL and LSI (Palacios and Ávila, 2015, 2019), despite BSQ containing two to six times less area of eelgrass and widgeongrass than in LSI and LOL, respectively (Ward and others, 2004; Ward and others, 2022). Average density of brant in BSQ was 5.0 birds/ha2 compared to 0.4 birds/ha2 in LOL and 0.6 birds/ha2 in LSI survey between 1998 and 2012 (based on the mid-winter, January, survey of brant in Olson, 2019).
There is concern, however, for declining trends in eelgrass abundance in BSQ and possibly in LSI. While the annual trend estimates entailed only 3–4 years of data, these estimates spanned a much greater number of years (7–14), providing considerable support for negative eelgrass trends. Moreover, the surveys were conducted during favorable environmental conditions; cool sea surface temperatures and reduced precipitation (Minnich and others, 2000; https://psl.noaa.gov/enso/mei), which are associated with relatively high levels of eelgrass abundance (Ward and others, 2005). Results from this study are also consistent with decreasing trend in spatial extent of eelgrass (Ward and others, 2003) and an increasing trend in the proliferation of seaweeds in BSQ over the same period (Ward and others, 2003; Zertuche-González and others, 2009).
As such, declines in eelgrass abundance and distribution in northern Baja California are likely a key reason for the northward shift in the winter distribution of brant from Mexico (Sedinger and others, 2006; 2011). The average number of wintering brant have more than doubled (2.5 times) at traditional brant wintering areas in US and Canada between the decade of the 1990s and 2010s (Ward and others, 2009; Olson, 2019). The distribution of brant has also shifted within Mexico with more birds wintering along the coasts of Sonora and Sinaloa, a distribution pattern that is typical of ENSO winter events when eelgrass abundance is reduced at primary wintering areas of northern Baja California (Ward and others, 2005, Olson 2019) and brant disperse to other embayments in search for eelgrass and other foods. Further, in years of low eelgrass abundance in northern Baja California fewer brant nest on the Yukon-Kuskokwim Delta, Alaska, where most brant breed, (Sedinger and others, 2006). This leads to fewer brant returning to winter in Mexico (Sedinger and others, 2006), a cycle that will likely continue as long as eelgrass abundance declines or remain low in BSQ, LOL and LSI.
Continuation of the trend-monitoring of eelgrass is encouraged in BSQ, LOL, and LSI given their importance to wintering Pacific flyway brant. More broadly, surveys can also provide a direct tool for monitoring the causes and consequences of change in eelgrass abundance in Baja California and be used by management agencies in making decisions for stakeholders and resources (for example, policy decisions on mariculture and salt-mining expansion).
References Cited
Lewis, T.L., Ward, D.H., Sedinger, J.S., Reed, A., Derksen, D.V., Carboneras, C., Christie, D.A., and Kirwan, G.M., 2020, Brant (Branta bernicla), version 1.0, in Billerman, S.M., ed., Birds of the world: Ithaca, New York, Cornell Lab of Ornithology, accessed November 2021 at https://doi.org/10.2173/bow.brant.01.
Thom, R.M., Borde, A.B., Rumrill, S., Woodruff, D.L., Williams, G.D., Southard, J.A., and Sargeant, S.L., 2003, Factors influencing spatial and annual variability in eelgrass (Zostera marina L.) meadows in Willapa Bay, Washington, and Coos Bay, Oregon, estuaries: Estuaries, v. 26, no. 4, p. 1117–1129.
Ward, D.H., 2022, Point sampling data for eelgrass (Zostera marina) and widgeongrass (Ruppia maritima) abundance in embayments of the north Pacific coast of Baja California, Mexico, 1998–2012: U.S. Geological Survey data release, accessed December 2021 at https://doi.org/10.5066/P9H4LBP3.
Ward, D.H., and Hogrefe, K.R., 2022, Mapping data of eelgrass (Zostera marina) distribution, Alaska and Baja California, Mexico: U.S. Geological Survey data release, https://doi.org/10.5066/P9WEK4JI.
Ward, D.H., Morton, A., Markon, C.J., and Hogrefe, K.R., 2022, Spatial extent of seagrasses (Zostera marina and Ruppia maritima) along the Central Pacific Coast of Baja California, Mexico, 1999–2000: U.S. Geological Survey Open-File Report 2022–1004, 13 p., https://doi.org/10.5066/P9WEK4JIx, xx p., https://doi.org/x.
Zertuche-González, J.A., Camacho-Ibar, V.F., Pacheco-Ruíz, I., Cabello-Pasini, A., Galindo-Bect, L.A., Guzmán-Calderón, J.M., Macias-Carranza, V., and Espinoza-Avalos, J., 2009, The role of Ulva spp. as a temporary nutrient sink in a coastal lagoon with oyster cultivation and upwelling influence: Journal of Applied Phycology, v. 21, no. 6, p. 729–736.
Conversion Factors
International System of Units to U.S. customary units
Temperature in degrees Celsius (°C) may be converted to degrees Fahrenheit (°F) as:
°F = (1.8 × °C) + 32.
Publishing support provided by the U.S. Geological Survey
Science Publishing Network, Tacoma Publishing Service Center
For more information concerning the research in this report, contact the
Director, Alaska Science Center
U.S. Geological Survey
4210 University Drive
Anchorage, Alaska 99508
Disclaimers
Any use of trade, firm, or product names is for descriptive purposes only and does not imply endorsement by the U.S. Government.
Although this information product, for the most part, is in the public domain, it also may contain copyrighted materials as noted in the text. Permission to reproduce copyrighted items must be secured from the copyright owner.
Suggested Citation
Ward, D.H., 2022, Abundance of eelgrass (Zostera marina) at key Black Brant (Branta bernicla nigricans) wintering sites along the northern Pacific coast of Baja California, Mexico, 1998–2012: U.S. Geological Survey Open-File Report 2022–1078, 15 p., https://doi.org/10.3133/ofr20221078.
ISSN: 2331-1258 (online)
Study Area
| Publication type | Report |
|---|---|
| Publication Subtype | USGS Numbered Series |
| Title | Abundance of eelgrass (Zostera marina) at key Black Brant (Branta bernicla nigricans) wintering sites along the northern Pacific coast of Baja California, Mexico, 1998–2012 |
| Series title | Open-File Report |
| Series number | 2022-1078 |
| DOI | 10.3133/ofr20221078 |
| Publication Date | November 03, 2022 |
| Year Published | 2022 |
| Language | English |
| Publisher | U.S. Geological Survey |
| Publisher location | Reston, VA |
| Contributing office(s) | Alaska Science Center Biology WTEB |
| Description | Report: vi, 15 p.; 2 Data Releases |
| Country | Mexico |
| Other Geospatial | Baja California |
| Online Only (Y/N) | Y |