

Assessment of Managed Aquifer Recharge at Sand Hollow Reservoir, Washington County, Utah, Updated to Conditions through 2018
Links
- Document: Report (5 MB pdf) , HTML , XML
- Tables:
- Appendix table 1.1 (20 KB csv) - Field water-quality parameters, dissolved organic carbon, tritium, chlorofluorocarbons, sulfur hexaflouride in groundwater and surface water from Sand Hollow, Utah.
- Appendix table 1.2 (25 KB csv) - Major and minor chemical constituents in groundwater and surface water from selected sites in Sand Hollow, Utah.
- NGMDB Index Page: National Geologic Map Database Index Page (html)
- Download citation as: RIS | Dublin Core
Abstract
Sand Hollow Reservoir in Washington County, Utah, was completed in March 2002 and is operated primarily for managed aquifer recharge by the Washington County Water Conservancy District. Sand Hollow Reservoir has remained nearly full since 2006 because of surface-water diversions of about 288,000 acre-feet (acre-ft) from 2002 through 2018. Groundwater levels in monitoring wells near the reservoir rose through 2006 and have fluctuated since then because of variations in reservoir stage and nearby pumping from production wells. Between 2004 and 2018, about 46,000 acre-ft of groundwater was withdrawn by these wells for municipal supply. In addition, about 45,000 acre-ft of shallow seepage was captured by French drains adjacent to the North and West Dams and used for municipal supply, irrigation, or returned to the reservoir. From 2002 through 2018, about 159,000 acre-ft of water seeped beneath the reservoir to recharge the underlying Navajo Sandstone aquifer, which includes about 18,500 acre-ft of recharge in the 2017–18 period since the last report.
Water quality continued to be monitored at various wells in Sand Hollow during 2017–18 to evaluate the timing and location of reservoir recharge as it moved through the aquifer. Changing geochemical conditions at monitoring well water district (WD) 12 indicated rising groundwater levels and mobilization of vadose-zone salts, which could be a precursor to the arrival of reservoir recharge. Changes to geochemical conditions and environmental tracers at monitoring well WD 22 indicated the arrival of reservoir recharge.
Introduction
Sand Hollow Reservoir (fig. 1) in Washington County, Utah, was completed in March 2002 and is operated primarily for managed aquifer recharge (MAR) by the Washington County Water Conservancy District (WCWCD). The reservoir is an off-channel facility that receives water diverted from the Virgin River near the town of Virgin, Utah. The Sand Hollow study area (hereafter referred to as Sand Hollow) has been the subject of interdisciplinary, cooperative investigations of groundwater hydrology and geochemistry since 1999. Previous Sand Hollow reports document pre-reservoir vadose-zone and groundwater conditions before March 2002 (Heilweil and Solomon, 2004; Heilweil and others, 2006, 2007, 2009b; Heilweil and McKinney, 2007); pond and trench infiltration studies adjacent to the reservoir (Heilweil and others, 2004; Heilweil and Watt, 2011); and post-reservoir groundwater conditions, water budgets, and estimates of groundwater recharge from the reservoir from March 2002 through December 2016 (Heilweil and others, 2005, 2009a; Heilweil and Susong, 2007; Heilweil and Marston, 2011; Marston and Heilweil, 2013, 2016; Marston and Nelson, 2018). These reports also contain monitoring-well and production-well completion information, as well as historical water-quality and precipitation data. The objectives of this report are to present and interpret (1) groundwater levels, reservoir altitude, well withdrawals, drain discharge, meteorological data, reservoir water temperature, and inflows/outflows from March 2002 through December 2018 for estimating monthly amounts of MAR from Sand Hollow Reservoir to the Navajo Sandstone aquifer (Navajo aquifer); and (2) groundwater and surface-water chemical data collected before the construction of the reservoir through April 2018 for evaluating groundwater flow paths and travel times of this MAR. This study is a cooperative effort by the WCWCD and the U.S. Geological Survey (USGS), and funding for this work was provided by both the USGS and the WCWCD.
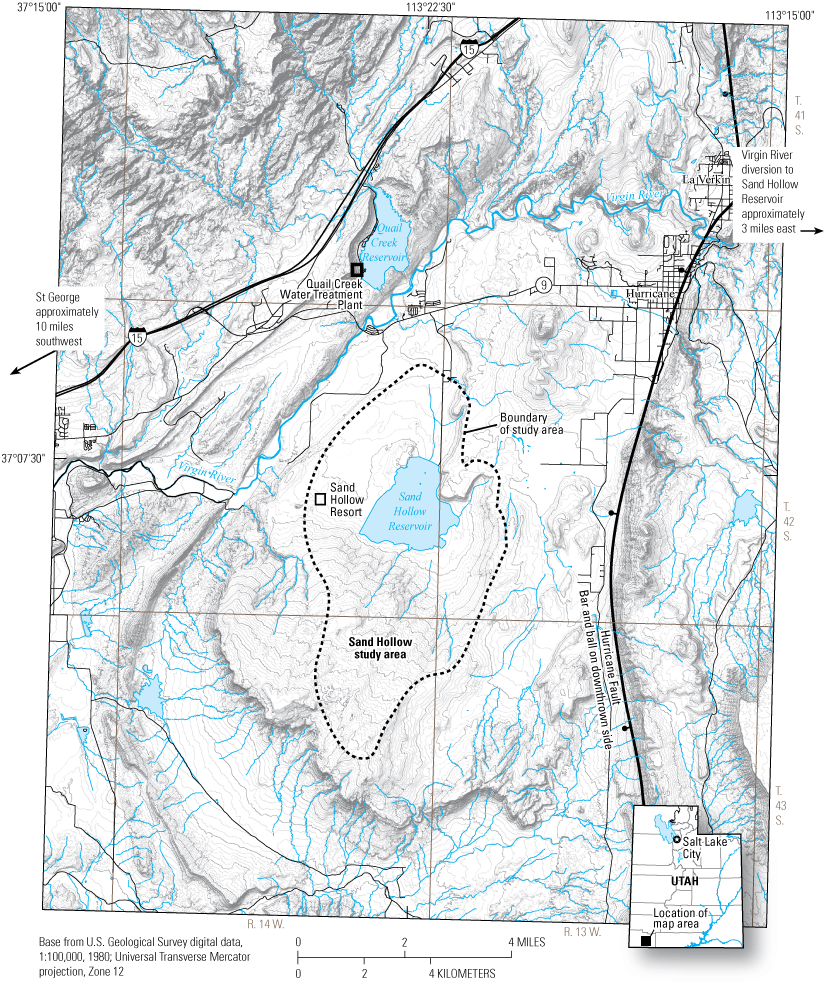
Location of the Sand Hollow study area, Washington County, Utah.
Assessment of Managed Aquifer Recharge from Sand Hollow Reservoir
Many different types of data have been collected to investigate recharge processes, quantify recharge from Sand Hollow Reservoir, and evaluate hydraulic and geochemical changes in the underlying Navajo aquifer. These data include production-well withdrawals near the reservoir; amounts of pumpage from drains capturing shallow groundwater discharge adjacent to the reservoir; reservoir and monitoring-well water levels; inflows and outflows through the pipeline connecting Sand Hollow Reservoir with the Virgin River, Quail Creek Reservoir, and Quail Creek Water Treatment Plant, meteorological parameters; and reservoir water temperatures (fig. 1). The chemistry of groundwater and Sand Hollow Reservoir water was evaluated through field water-quality parameters (water temperature, specific conductance, pH, dissolved oxygen [DO], and total dissolved-gas [TDG] pressure) and analysis of dissolved constituents including major and trace inorganic elements, dissolved organic carbon (DOC), tritium (3H), and industrial dissolved gases.
Data Collection Methods and Results
Data collection methods are described in detail in Heilweil and others (2005) and briefly summarized in the following sections. Water quality samples and field parameters have been collected at reservoir and groundwater sites in Sand Hollow annually each Spring from 2002 to 2018. These data are available by accessing the USGS National Water Information System at https://waterdata.usgs.gov/nwis.
Production-Well Withdrawals
The WCWCD has 13 production wells completed in the Navajo Sandstone that are available to capture both pre-existing groundwater (natural recharge) in Sand Hollow and recharge from Sand Hollow Reservoir (fig. 2). The WCWCD and other water users have pumped groundwater from natural recharge in Sand Hollow for many years, with pumping beginning in the 1970s. The WCWCD groundwater pumping totals are recorded monthly from inline magnetic flow meters installed at each well. Since August 2004, monthly pumping by the WCWCD has generally exceeded 150 acre-feet (acre-ft), except for several months during the winters of 2004–05, 2005–06, 2008–09, and 2010 (fig. 3). Through late 2012, most of this pumping was from wells 8 and 9 (fig. 3), both wells are adjacent to the North Dam. Starting in early 2013, some of the pumping shifted to wells 19, 21, and 23 (fig. 3). From 2004 through 2006, there was minimal pumping from these wells during the winter. Since 2006, pumping has been more constant year-round. Monthly pumping from production wells averaged about 280 acre-ft from March 2006 through December 2018. Smaller amounts have been sporadically pumped from wells 1, 2, and 17. Approximately 46,000 acre-ft were pumped from the WCWCD production wells from January 2004 through December 2018 (fig. 3). As of December 2018, pumped totals by the WCWCD at Sand Hollow have been permitted by the Utah Division of Water Rights as natural recharge in Sand Hollow; these withdrawals are governed by different water rights than water recharged from Sand Hollow Reservoir (withdrawal rights for this artificial recharge have not yet been exercised).
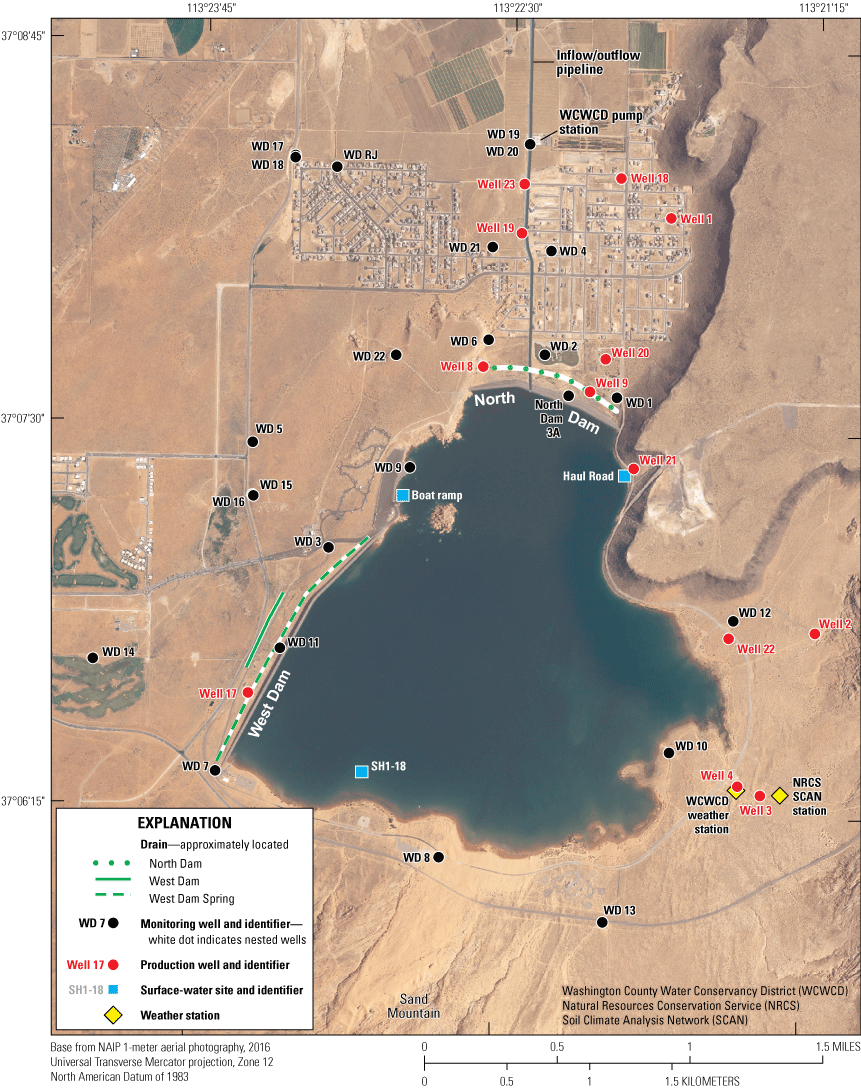
Location of monitoring and production wells, weather stations, drains, and reservoir surface water sampling sites in Sand Hollow, Washington County, Utah.
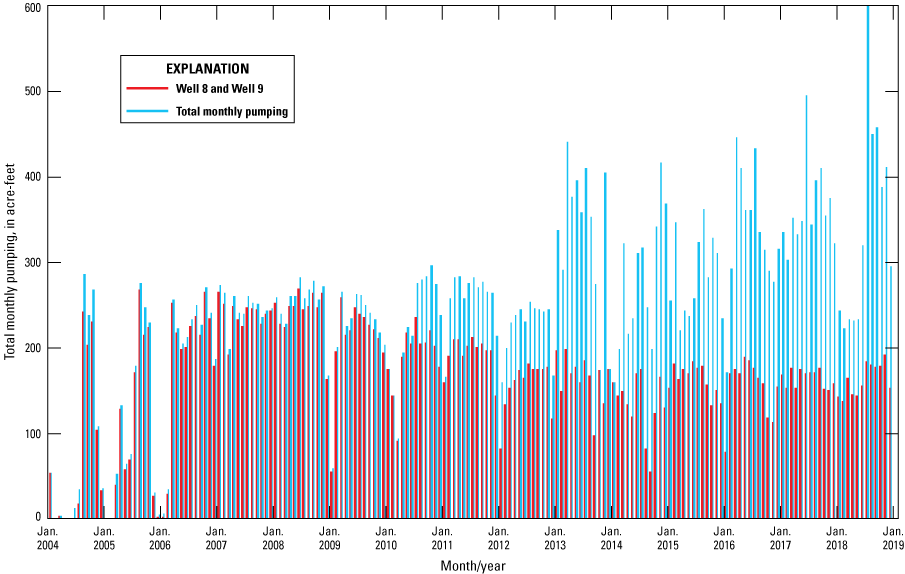
Washington County Water Conservancy District production-well pumped volumes in Sand Hollow, Washington County, Utah, 2004–18.
Drain Discharge
Because of the steep hydraulic gradients associated with the hydraulic connection between the reservoir and the underlying Navajo aquifer, some land-surface areas downgradient of the North and West Dams became saturated following construction of the reservoir. In response, three French drains (North Dam drain, West Dam drain, and West Dam Spring drain) were constructed for capturing this shallow groundwater (fig. 2). The timing of excavation and spatial dimensions for the three drains are described in Heilweil and Marston (2011).
The water pumped from these drains is measured with a Tigermag totalizing flow meter (Sparling Instruments in El Monte, California). Discharge from the North Dam drain has been pumped at a relatively consistent rate (about 50 acre-ft per month) since January 2008 (fig. 4); about 10,500 acre-ft were pumped from the North Dam drain between 2003 and 2018. Initially, all of this water was returned to the reservoir, but since 2007, most of the water has been used by Sand Hollow Resort (fig. 1) to meet irrigation demands. About 2,500 acre-ft of water was pumped from the West Dam drain back into the reservoir from 2005 through 2018. Beginning in October 2006, pumping of discharge from the West Dam Spring drain was initiated and has largely replaced the need for pumping of the West Dam drain (fig. 2). From 2006 through 2018, about 32,000 acre-ft of water was pumped from the West Dam Spring drain for municipal use or returned back to Sand Hollow Reservoir. Although groundwater discharge to the West Dam Spring drain likely does not vary greatly, pumping from this drain has been intermittent. The intermittent pumping schedule has resulted in high variability in the monthly reported discharge from the West Dam Spring drain (fig. 4).
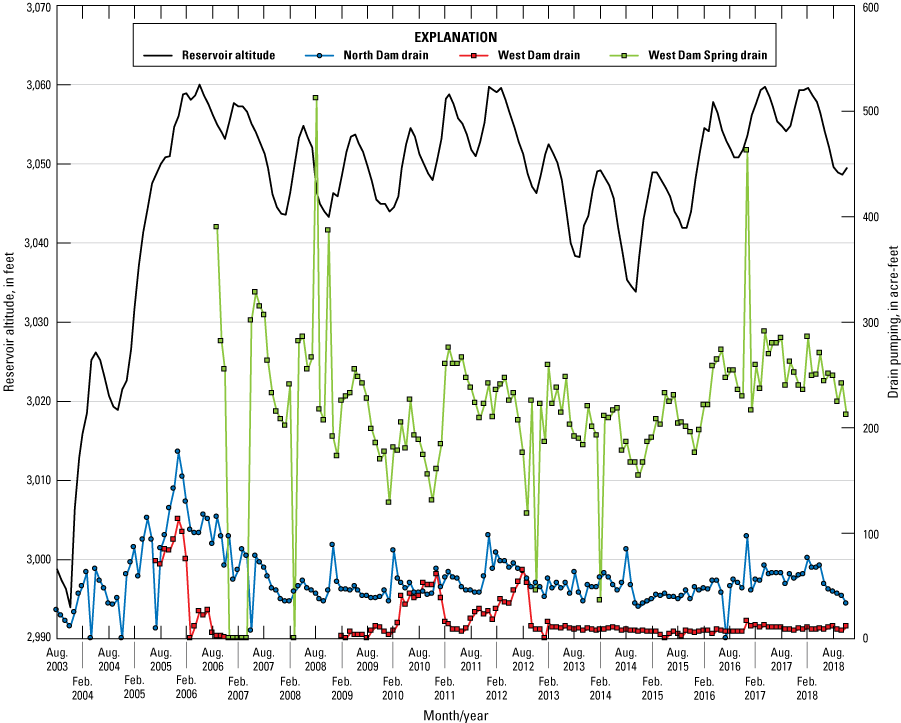
Monthly reported pumping from the North and West Dam drains, and West Dam Spring drain in relation to reservoir altitude, Sand Hollow, Washington County, Utah, 2003–18.
Groundwater-Level Data and Reservoir Altitude
Groundwater levels measured in an extensive monitoring-well network surrounding Sand Hollow Reservoir were used to document changes in the potentiometric surface associated with recharge from Sand Hollow Reservoir. The WCWCD measures water levels monthly in 21 monitoring wells completed in the Navajo aquifer (fig. 2; the water district [WD] RJ and WD 4 monitoring wells were removed in 2013 and 2017, respectively). These wells were constructed with either 1- or 2-inch (in.) diameter polyvinyl chloride casing, with perforations along the bottom 5- to 20-foot (ft) length of the casing (Heilweil and others, 2005). Three locations have nested pairs of WD monitoring wells: (1) WD 15 and WD 16, (2) WD 17 and WD 18, and (3) WD 19 and WD 20. The vertical distance between well screens for the nested-pair wells are 243, 79, and 227 ft, respectively. Water levels were measured by the WCWCD using electric-tape water-level indicators. Annual independent check measurements were performed by USGS personnel for quality assurance to ensure accuracy (repeatability of measurements) of the instruments.
Daily reservoir water-level altitude (stage) was recorded from August 2003 through December 2018 using a pressure transducer installed by the WCWCD in the reservoir along the North Dam. Because of periods of transducer malfunction from 2005 through 2007, and from August 2011 to December 2011, daily reservoir stage was interpolated based on monthly measurements recorded at the boat ramp by WCWCD and Sand Hollow State Park personnel, and then correlated with trends from the transducer data.
Recently measured (January 2014 through December 2018) and previously reported (Heilweil and others, 2005, 2009a; Heilweil and Susong, 2007; Heilweil and Marston, 2011, Marston and Heilweil, 2013, 2016; Marston and Nelson, 2018) groundwater levels and reservoir water-level altitude are shown in figure 5. The reservoir stage rose from about 2,980 ft at the beginning of March 2002 to a maximum of about 3,060 ft in May 2006, when the reservoir was first filled to capacity. The reservoir altitude receded to about 3,040 ft in December 2007 as a result of reduced inflows and evaporative losses and then fluctuated between about 3,040 and 3,060 ft from 2008 through 2011. From 2012 through 2014, the reservoir altitude dropped to a fluctuating level between about 3,030 and 3,050 ft; from 2014 to 2016, the reservoir altitude rose again to a fluctuating level between about 3,040 and 3,055 ft; and from 2016 to 2018, the reservoir maintained an altitude between about 3,050 and 3,060 ft.
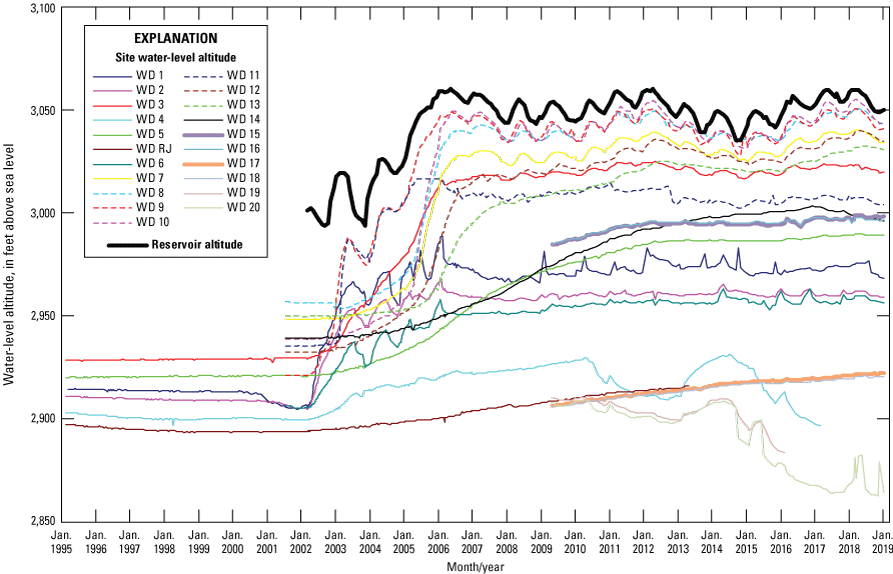
Water-level altitude in monitoring wells and Sand Hollow Reservoir altitude, Sand Hollow, Washington County, Utah, 1995–2018.
Based on water-level measurements in the WCWCD 20 monitoring well network as well as 17 public supply or irrigation wells located near Sand Hollow on the Hurricane Bench, altitude of the water table (or potentiometric surface) near Sand Hollow Reservoir during March 2018 ranged from 2,868 to 3,044 ft (fig. 6). The reservoir altitude during this same period was about 3,050 ft. The lines on figure 6 represent estimated potentiometric contours in the aquifer which indicate lines of equal groundwater-level altitude, and the arrows indicate generalized directions of horizontal groundwater movement away from the reservoir. Horizontal hydraulic gradients are calculated by dividing the difference in water-level altitude between two points by the distance separating these locations and indicate the potential horizontal direction of groundwater movement from high to low groundwater altitudes. The steepest horizontal hydraulic gradients are beneath the North and West Dams and generally decline with increasing distance from the reservoir. The steep hydraulic gradients beneath the dams are the combined result of low-conductivity materials at the core of the dams and pumping from wells and drains at the base of both dams. For example, the horizontal hydraulic gradient between Sand Hollow Reservoir (reservoir altitude of 3,050 ft) and WD 1 (groundwater altitude of 2,976 ft) in 2018 was 0.150 foot per foot (ft/ft), whereas the gradient between WD 6 (groundwater altitude of 2,960 ft) and WD 20 (groundwater altitude of 2,881 ft) was 0.020 ft/ft. In 2018, the resulting regional hydraulic gradient due to managed aquifer recharge between WD 9 (groundwater altitude of 3,051 ft) and WD 17 (groundwater altitude of 2,922 ft) was 0.020 ft/ft.
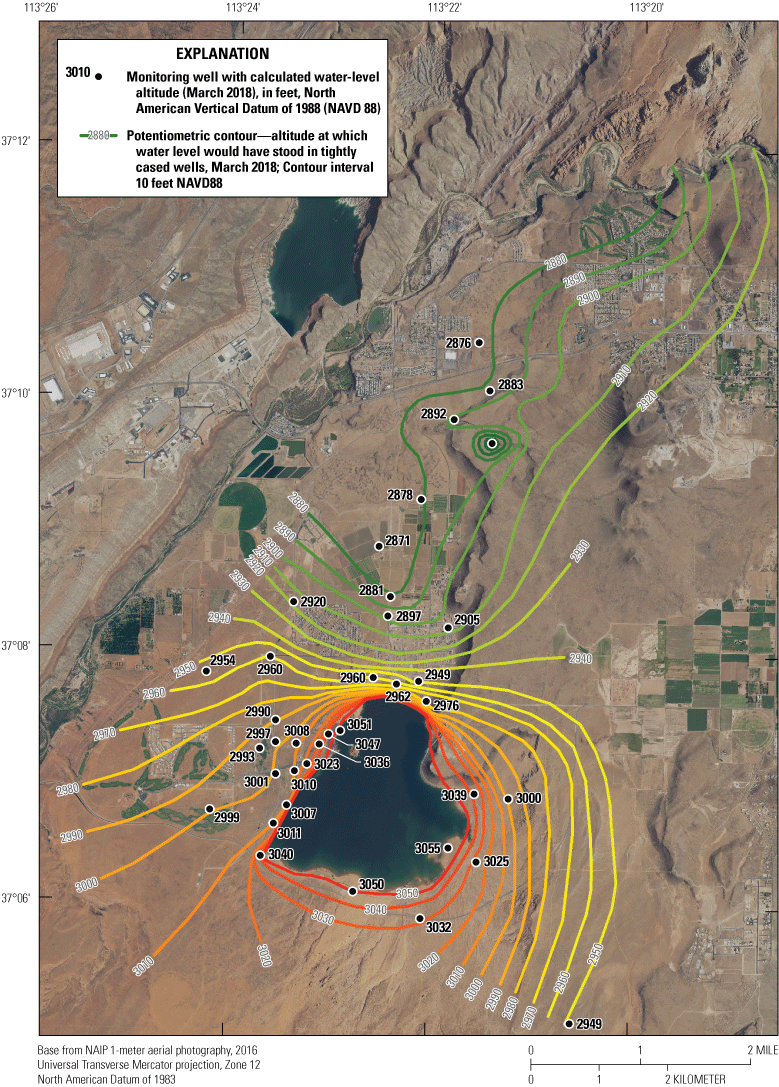
Potentiometric surface of the Navajo aquifer in March 2018, Sand Hollow, Washington County, Utah.
Pumping rates increased at wells WD 19 and WD 23 starting in early 2013. Increased withdrawal has induced a drawdown cone around these production wells north of the reservoir; the drawdowns are apparent in nearby monitoring wells (WD 4, WD 19, and WD 20). Monitoring well WD 19 went dry in March 2016 as a result of the local water table falling below the depth of the screened interval.
Surface-Water Inflow to and Outflow from Sand Hollow Reservoir
Surface water is pumped into and flows out of Sand Hollow Reservoir through a 60-in. diameter pipeline that enters through an inlet structure at the North Dam (fig. 2). This pipeline is part of a network of pipelines that connect the Virgin River, Sand Hollow Reservoir, Quail Creek Reservoir, and the Quail Creek Water Treatment Plant. The WCWCD has the capability to move water within this network of pipelines by using gravity-induced flow and inline pumping. Sand Hollow Reservoir is managed to maximize groundwater recharge and little surface water has been removed from the reservoir. Annual surface-water inflow to and outflow from Sand Hollow Reservoir from 2002 to 2016 is shown in table 1. The “Monthly pump station inflow or outflow” column for 2017 and 2018 in table 2 is the amount of Sand Hollow Reservoir surface water coming in from the Virgin River or going out to the Quail Creek Reservoir, Quail Creek Water Treatment Plant, or other facilities (fig. 1). These data were collected at the WCWCD pump station located about 1 mile (mi) north of the North Dam. Five pumps, each with Sparling Tigermag totalizing flow meters, are linked to a computer system that combines and records total daily discharge in gallons. The flow meters have electronic modules on which calibration diagnostics are performed monthly by the WCWCD. Each module is removed annually for factory recalibration.
Table 1.
Annual reservoir data, evaporation, precipitation, and calculated groundwater recharge from Sand Hollow Reservoir, Utah, 2002–16.[ft, foot; acre-ft, acre-foot; +, plus; −, minus; ft/d, foot per day; —, no data available]
Table 2.
Monthly reservoir data, evaporation, precipitation, and groundwater recharge from Sand Hollow Reservoir, Utah 2017 and 2018.[ft, foot; acre-ft, acre-foot; +, plus; −, minus; ft/d, foot per day; —, no data available; 2σ, two standard deviation; Jan., January; Feb., February; Mar., March; Apr., April; Aug., August; Sept., September; Oct., October; Nov., November; Dec., December]
The “Monthly drain and spring return flow to reservoir” column in table 2 is the portion of discharge to the three drains that is pumped back into Sand Hollow Reservoir. The “Monthly outflow to Sand Hollow Resort” column (table 2) is the amount of water required by the resort that cannot be met by discharge to the North Dam drain and is fulfilled by outflow of stored water from Sand Hollow Reservoir. Therefore, the “Monthly total inflow or outflow to/from reservoir” column is a sum of the pump station inflow/outflow, the drain and spring return flow, and the outflow to Sand Hollow Resort (table 2).
The “Monthly pump station inflow or outflow” column is unchanged from Heilweil and Marston (2011) and is comparable to the “Total surface-water inflow or outflow” column in table 7 of Heilweil and others (2005) from March 2002 to August 2004, the “Monthly surface-water inflow or outflow” column in table 2 of Heilweil and Susong (2007) from September 2004 to August 2006, and the “Monthly net surface-water inflow/outflow” column in table 2 of Heilweil and others (2009a) from September 2006 to December 2007.
As in Heilweil and Marston (2011), the “Monthly drain and spring return flow to reservoir” and “Monthly outflow to Sand Hollow Resort” columns are included in calculations of total inflow to and outflow from the reservoir. These amounts are added to the “Monthly pump station inflow or outflow” column and summed in the “Monthly total inflow or outflow to/from reservoir” column. Monthly total inflow/outflow amounts from January 2017 through December 2018 ranged from about −1,370 to 4,530 acre-ft. Approximately 288,000 acre-ft of total net inflow were pumped into Sand Hollow Reservoir from the Virgin River from 2002 through 2018.
Meteorological Data
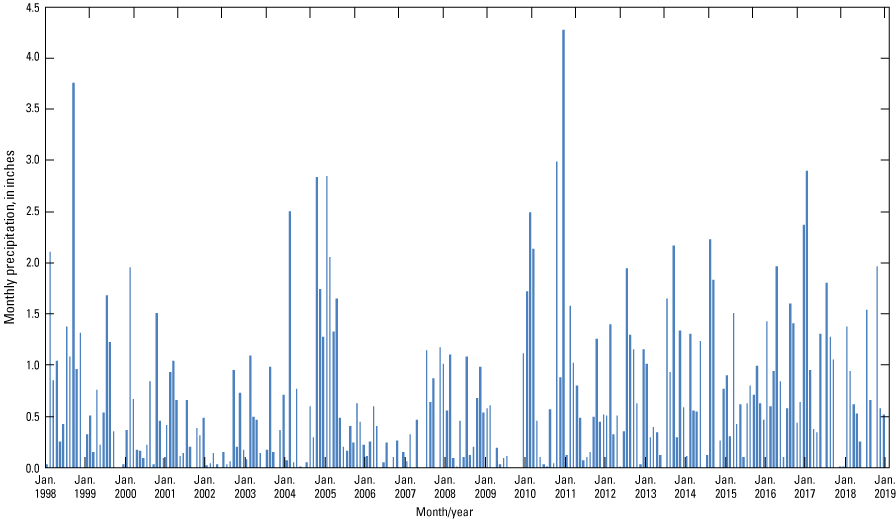
Meteorological data were initially collected at the WCWCD weather station (fig. 2) in Sand Hollow starting in January 1998. Beginning in 2010, the Soil Climate Analysis Network (SCAN) Sand Hollow weather station (https://www.wcc.nrcs.usda.gov/nwcc/site?sitenum=2159) operated by the Natural Resources Conservation Service (NRCS), replaced the collection of data by the WCWCD weather station. The NRCS Sand Hollow SCAN station is located south of the reservoir within Sand Hollow near the site of the decommissioned WCWCD weather station (fig. 2). Data from both weather stations have been used for evaluating evaporation and precipitation, which are required for calculating monthly recharge from Sand Hollow Reservoir. Parameters measured include air temperature, wind speed, wind direction, precipitation, relative humidity, and incoming solar radiation. Instrumentation includes a temperature and relative humidity probe, a wind direction and speed monitor, a tipping bucket rain gage, and a solar radiometer. Sensors collect data every minute, and average hourly and daily values are computed and stored on a data logger, with the exception of precipitation, which is summed rather than averaged. The solar radiation and temperature data were used for calculating evaporation by using the version of the Jenson-Haise method reported in McGuinness and Bordne (1971).
From January 13, 1998, to December 31, 2018, daily average air temperature ranged from −10 to 36 degrees Celsius (°C). The coldest temperatures during the year were typically in December and January, when minimum air temperatures occasionally were below −10 °C. The warmest temperatures were typically in July, when maximum air temperatures occasionally approached 45 °C. The minimum daily averages are typically in December and January, and the maximum daily averages are typically in June and July. Daily average solar radiation ranged from 14 to 990 calories per square centimeter per day.
Monthly precipitation was recorded at the Sand Hollow weather station or the NRCS station continuously from January 1998 through December 2018, except for two periods when malfunctioning instrumentation resulted in data loss: December 26, 2008, to January 3, 2009, and September 28 to November 16, 2009. Precipitation amounts during these two periods were estimated based on data from the nearby St. George Southgate Golf Course weather station (#427516; http://www.wrcc.dri.edu/cgi-bin/cliMAIN.pl?ut7516). From January 1998 through December 2018, monthly precipitation ranged from 0 to about 4.3 in. (fig. 7) and averaged about 0.6 in. Average annual precipitation during the 20-year period was 7.7 in.
Monthly precipitation at Sand Hollow, Washington County, Utah, 1998–2018.
Estimates of Managed Aquifer Recharge from Sand Hollow Reservoir
Substantial amounts of surface water from Sand Hollow Reservoir infiltrate through the underlying sediments to recharge the Navajo aquifer. This recharge is either captured by production wells for municipal supply, or it moves northward through the aquifer toward the Virgin River. Through 2018, withdrawals from production wells operated by the WCWCD at Sand Hollow were permitted for the capture of natural recharge in Sand Hollow. These withdrawals were governed by different water rights than those associated with MAR from Sand Hollow Reservoir; withdrawal rights for this artificial recharge have not yet been exercised.
Recharge from Sand Hollow Reservoir is calculated as the residual with the following water-budget equation (modified from Heilweil and others, 2005):
whereR
is recharge,
Isw
is surface-water inflow,
IDr
is drain return flow,
Osw
is surface-water outflow,
P
is the amount of precipitation falling directly on the reservoir,
ΔS
is change in surface-water storage, and
E
is evaporation.
The following equation was developed to evaluate the uncertainty for each monthly recharge estimate:
whereCU
is the composite uncertainty fraction (two standard deviation, 2σ),
|Ci|
is the absolute value of each component of the water budget (acre-feet),
Σ|Ci|
is the sum of absolute values of all the water-budget components (acre-feet), and
Ui
is the uncertainty fraction (2σ) for each individual water-budget component.
The smallest estimated uncertainty fraction is 0.05 (5 percent) for Isw, IDr, and Osw because these flows were recorded using calibrated inline flow meters. The estimated uncertainty fraction for P is higher, at 0.10 (10 percent), because it was an indirect measurement taken based on nearby meteorological station data. Similarly, the estimated uncertainty fraction also is 0.10 (10 percent) for ΔS because changes in surface-water storage were based only on approximate reservoir water-level altitude/volume relations rather than direct measurements. The largest estimated uncertainty fraction is 0.20 (20 percent) for E, which was based on differences between alternative methods for estimating evaporation at Sand Hollow and other areas (Heilweil and others, 2007; Rosenberry and others, 2007).
The first two reports documenting monthly groundwater recharge beneath Sand Hollow Reservoir through August 2006 (Heilweil and others, 2005; Heilweil and Susong, 2007) did not include precipitation falling directly on the reservoir. Beginning with the third report (Heilweil and others, 2009a), and continuing in this report, an additional term for precipitation falling directly on the reservoir (P) is included in equation 1. The monthly amount of precipitation falling on the reservoir is calculated by multiplying the total monthly precipitation (recorded by the Sand Hollow weather station) by the average reservoir surface area for that month (based on reservoir water-level altitude to area relations for the reservoir). The precipitation term in equation 1, however, does not account for precipitation runoff to the reservoir. Because of high evaporation rates and permeable surficial soils, precipitation events seldom produce runoff that reaches the lower part of Sand Hollow (L. Jessop, Washington County Water Conservancy District, oral commun., 2001), where the reservoir is situated.
Monthly water-budget values calculated for 2017 and 2018 for Sand Hollow Reservoir are shown in table 2. Values are generally monthly averages or totals, except for reservoir altitude and storage, which are shown for the last day of each month. Values for “Monthly evaporation rate,” “Monthly evaporation,” and “Groundwater recharge rate” from January 2017 through December 2018 are monthly averages.
Changes in Reservoir Storage
Changes in reservoir storage were calculated by using altitude to volume relations from daily reservoir water-level altitudes reported by the WCWCD. After inception of the reservoir in 2002, surface-water storage increased to an average of about 47,000 acre-ft in 2006. Surface-water storage decreased to an average of about 37,000 to 38,000 acre-ft during 2008 through 2010. Following the abnormally wet winter and spring of 2010–11, surface-water storage was kept at a high level during 2011 and 2012, averaging between about 44,000 and 45,000 acre-ft but then declined to an average of about 30,000 acre-ft in 2014 as a result of less than normal precipitation in the region and decreased flows in the Virgin River (table 1). Surface water storage increased again in 2016 to average about 42,000 acre-ft. Monthly surface water storage was variable with levels from January 2017 and December 2018 varying between about 37,000 and 51,000 acre-ft.
Reservoir Evaporation
The McGuinness and Bordne (1971) version of the Jensen-Haise method was selected for calculating evaporation from Sand Hollow Reservoir during this study. A detailed comparison to results using other methods for estimating evaporation is given in Heilweil and others (2005). The McGuinness and Bordne (1971) version of the Jensen-Haise method is based on the relation below:
wherePET
is potential evaporation, in centimeters per day (cm/d; the units for PET can be converted to feet per day (ft/d) by multiplying by 0.0328),
Ta
is air temperature, in degrees Fahrenheit (°F), and
Qs
is solar radiation, in calories per square centimeter per day (cal/cm2/d).
By using air temperature and solar radiation from the nearby weather stations (fig. 2), monthly evaporation rates were calculated with equation 3. Average annual evaporation rates ranged from 0.41 to 0.54 ft per year from 2002 through 2016. The estimated monthly evaporation rates ranged from 0.07 to 1.15 ft per month from January 2017 through December 2018 (table 2). Multiplying the estimated monthly evaporation rates by average reservoir surface area yields monthly evaporation losses that ranged from about 90 to 1,510 acre-ft between January 2017 and December 2018.
Estimates of Total Volume of Managed Aquifer Recharge from Sand Hollow Reservoir
Monthly estimates of precipitation (P), evaporation (E), inflows (Isw and Idr), outflows (Osw), and changes in surface-water storage (ΔS) were used in equation 1 to calculate recharge to the Navajo aquifer beneath Sand Hollow Reservoir. Annual recharge from 2002 through 2016 ranged from about 5,400 to 18,200 acre-ft (fig. 8; table 1). Monthly recharge from January 2017 through December 2018 ranged from about 40 to 2,000 acre-ft, with 7.3 to 15 percent composite uncertainties (table 2). Higher composite uncertainties in the summer reflect the larger, weighted importance of evaporation losses, which have the highest uncertainty.
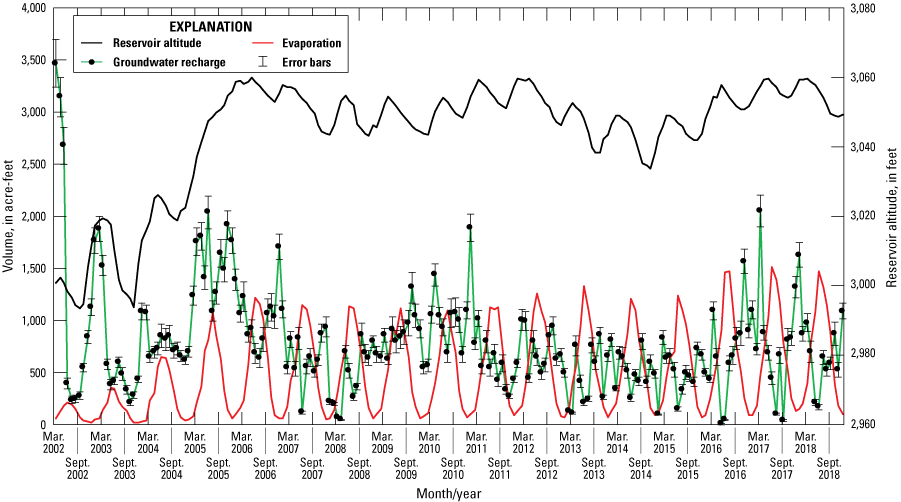
Monthly estimated reservoir altitude, groundwater recharge, and evaporation, Sand Hollow Reservoir, Washington County, Utah, 2002–18.
Estimated average monthly recharge rates beneath Sand Hollow Reservoir ranged from about −0.0003 to 0.430 ft/d between March 2002 and December 2018 (fig. 9). Although the graph shows large monthly fluctuations, recharge has generally stabilized at an average of about 0.02 ft/d during 2011–18.
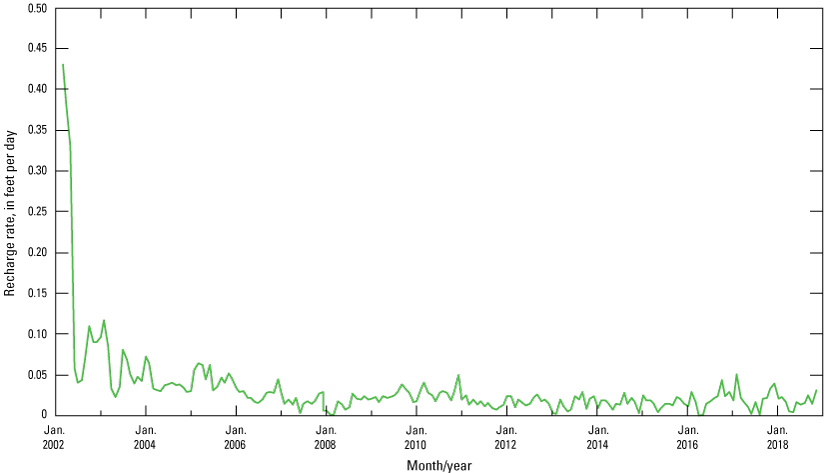
Monthly calculated groundwater recharge rates beneath Sand Hollow Reservoir, Washington County, Utah, 2002–18.
Net inflow, evaporation, and groundwater recharge from Sand Hollow Reservoir from 2002 through 2018 are shown in figure 10. Total net inflow during this period was about 288,000 acre-ft, with annual inflow during this period ranging from about 800 acre-ft in 2007 to 56,000 acre-ft in 2005. The general increase in reservoir water-level altitude and area from 2002 to 2007 resulted in a steady increase in the volume of annual evaporation from about 1,100 to 6,600 acre-ft over the same period, and then remained relatively constant ranging between 5,700 acre-ft in 2010 and 8,300 acre-ft in 2017. Total estimated evaporative losses from 2002 through 2018 were about 101,000 acre-ft. Total estimated evaporation losses from 2017 through 2018 was about 16,400 acre-ft. Annual recharge ranged from a low of about 5,400 acre-ft in 2008 to a high of about 18,000 acre-ft in 2005. Total estimated recharge from 2002 through 2018 was about 159,000 acre-ft, with a 2σ uncertainty of 15,100 acre-ft. Of that total, about 18,500 acre-ft of recharge occurred in 2017 and 2018.
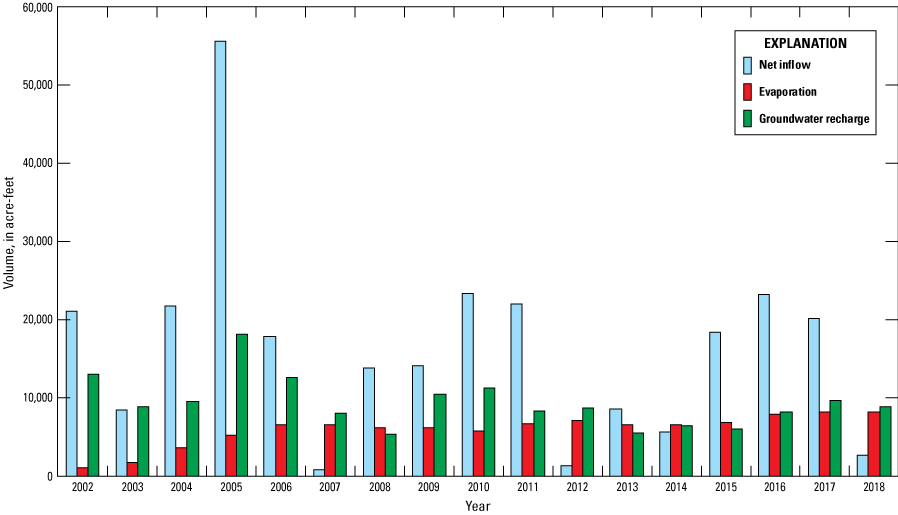
Estimated annual net inflow, evaporation, and groundwater recharge, Sand Hollow Reservoir, Washington County, Utah, 2002–18.
Groundwater and Surface-Water Quality in Sand Hollow
As MAR from Sand Hollow Reservoir moves into the underlying Navajo aquifer, it has an initial water-quality signature similar to the reservoir water, but this evolves as water moves through the subsurface. Along its flow path, the MAR initially moves from the reservoir through the organic-rich silt layer that has accumulated beneath the reservoir, and then it moves through the pre-reservoir vadose zone (now saturated) where vadose-zone solutes had naturally accumulated, and air was trapped before and during filling of the reservoir. This results in water quality that is different from native groundwater. As part of the monitoring of MAR from Sand Hollow Reservoir, water-quality samples from the reservoir and surrounding monitoring wells were collected and analyzed for field water-quality parameters and laboratory chemical, isotopic, and dissolved-gas concentrations.
Field water-quality parameters included water temperature, specific conductance, pH, DO, and TDG pressure. The TDG pressure is the combination of partial pressures of all dissolved gases in the water. Field parameters were measured with a multi-parameter sonde placed within the screened interval at the bottom of each 2-in. monitoring well, and in the reservoir at water depths of approximately 2 ft. The multi-parameter sonde was too large to enter the 1-in. monitoring wells (North Dam 3A, WD 4, WD 5, and WD 12). Consequently, field measurements from these wells were collected onsite with a flow-through chamber connected to the discharge line from either a Waterra inertia pump or peristaltic pump; no TDG pressure measurements were taken at these sites. Additional details regarding field parameter methods are given in Heilweil and others (2005) and Heilweil and Susong (2007).
Laboratory water-quality analyses of water from Sand Hollow Reservoir and groundwater from the Navajo aquifer included dissolved major and trace inorganic elements, DOC, 3H, and industrial dissolved gases. The major inorganic ions included calcium, magnesium, sodium, potassium, bicarbonate, sulfate, chloride, fluoride, and nitrate. Trace elements included bromide, iron, manganese, arsenic, nitrite, ammonia, and orthophosphate. Dissolved gases included chlorofluorocarbons (CFC–11, CFC–12, CFC–113) and sulfur hexafluoride (SF6).
Water samples were collected from 2-in. monitoring wells by using either a Grundfos or Bennett submersible pump; 1-in. wells were sampled with a Waterra inertia pump, and production wells were sampled utilizing installed turbine pumps. Before water sample collection from monitoring wells, water was purged from each well until field parameters stabilized and a minimum of three casing volumes were removed. After purging each well, water was pumped into sample bottles and filtered as necessary. Since 2009, a set of replicate samples has been collected annually at one randomly selected site and separately analyzed for all constituents for quality assurance. Samples for major cations and trace elements were filtered through 0.45-micron disposable filters and collected in clean polyethylene bottles according to procedures described by Wilde and Radtke (1998); samples for major anion analysis were preserved with 7.7-normal nitric acid. Tritium samples were collected in 500-milliliter (ml) polyethylene bottles with polyseal caps and no head space. Chlorofluorocarbon and SF6 samples were collected in 250-ml and 1-liter (L) glass bottles, respectively, according to procedures described on the USGS Reston Groundwater Dating Laboratory website at https://water.usgs.gov/lab/.
Inorganic and organic chemical analyses (major ions, trace elements, and DOC) were analyzed by the USGS at the National Water Quality Laboratory in Denver, Colorado. Chlorofluorocarbons and SF6 (2008–12 and 2015–16) were analyzed by the USGS Chlorofluorocarbon Laboratory in Reston, Virginia. Tritium and SF6 (2013–14) were analyzed at the University of Utah Dissolved Gas Service Center.
Water-Quality Results
Detailed water-quality data and interpretations at Sand Hollow, including trends through 2012, have been previously published (Heilweil and others, 2005, 2009a; Heilweil and Susong, 2007; Heilweil and Marston, 2011; Marston and Heilweil, 2013, 2016; Marston and Nelson, 2018). Appendix 1, tables 1.1 and 1.2 provide this previous data, along with additional data collected during 2017 and 2018. These data are available by accessing the USGS National Water Information System at https://waterdata.usgs.gov/nwis. The following discussion describes recent changes (2017–18) or the continuation of longer trends (2002–18) in water quality.
Perhaps most significant were the changes at wells WD 12 and WD 22, which are 1,000 and 1,700 ft from the reservoir, respectively. Although the low chloride/bromide ratios indicate that reservoir water had not yet arrived at WD 12, increases in other constituents indicate a flush of naturally accumulating vadose-zone salts ahead of reservoir recharge. Although environmental tracers (3H, CFCs, and SF6) also had increased, their concentrations were still lower than those in the reservoir water. At WD 12, specific conductance and dissolved-solids concentrations increased from 2011 through 2016 to values similar to those in the reservoir water. At WD 22, specific conductance and dissolved-solids concentrations increased from 2015 through 2018 to values similar to those in the reservoir. The chloride/bromide ratios and environmental tracer concentrations (3H, CFCs, and SF6) observed in WD 22 were similar to those observed in the reservoir water, indicating that reservoir water has likely reached WD 22. The location of WD 22 was based on predicted travel times from a numerical model of the Hurricane Bench that simulates recharge from Sand Hollow Reservoir (Marston and Heilweil, 2012).
At well WD 6, located 1,000 ft from the reservoir, the chloride/bromide ratio from 2016 through 2018 maintained ratios similar to reservoir water indicating the continued presence of recharge from the reservoir; specific conductance, dissolved-solids concentrations and concentrations of some environmental tracers (3H, CFC–12, and CFC–113) also were about the same as those in the reservoir and remained relatively stable from 2012 through 2018. Other industrial gases (CFC–11 and SF6) and DOC concentrations were substantially lower than reservoir concentrations, but this may indicate other processes or environmental conditions that are unique to this site.
Although well WD 8 had a slight increase in the chloride/bromide ratio from 2002 through 2018, it was still much lower than the ratio in the reservoir water. Although located only 500 ft from the reservoir, this well is downgradient of an area of high natural recharge south of the reservoir and may lie along a groundwater boundary between the two recharge mounds. The relatively high concentrations of modern environmental tracers may be caused by natural recharge. The observed concentration of DO, 28 milligrams per liter (mg/L), indicates a rapid rise in water level and entrapment of air bubbles.
At wells WD 9 and WD 11 (55 and 160 ft away from the reservoir, respectively), the various field parameters, along with the results of chemical analyses and environmental tracers (with the exception of CFC–11 and CFC–113, which were possibly reduced by microbial degradation) indicate that reservoir recharge arrived several years before 2014. Declines in DO in the well may have been due to a combination of dissolution of trapped air bubbles and chemical reduction as recharge infiltrated through carbon-rich sediment at the bottom of the reservoir.
At well WD 15, located 2,400 ft from the reservoir (fig. 2), specific conductance and dissolved-solids concentrations increased from 2010 through 2014, yet chloride/bromide ratios and 3H concentrations remained much lower than those in the reservoir water. This may indicate vadose-zone salt mobilization, likely from rising water levels rather than a salt flush before the arrival of reservoir water. Elevated TDG pressure and DO similarly indicate air entrapment associated with rising water levels. Monitoring well WD 16, located at the same site but screened at a deeper interval, did not show an increase in salinity and had even lower chloride/bromide ratios and 3H concentrations, supporting the interpretation of rising water levels rather than salt flushing before the arrival of reservoir recharge. Wells farther from the reservoir that were sampled in 2013 or 2014 (WD 5 is located 2,800 ft from the reservoir and wells WD 17 and WD 18 are located 5,900 ft from the reservoir) indicated that reservoir recharge had not yet reached these locations.
Arsenic concentrations had generally decreased at locations where reservoir recharge had already arrived or where there had been a water-table rise and flushing of vadose-zone salts, which is typically a precursor to the arrival of recharge. The arsenic concentration decline could be attributable to an increase in oxidizing conditions, which facilitate the adsorption of arsenic on iron oxides within the aquifer matrix; this is in contrast to reducing conditions, which would mobilize arsenic. Wells WD 4, WD 6, WD 8, and WD 12 all showed this trend of decreasing arsenic concentration with increasing DO.
Summary
Since its inception in 2002, diversions to Sand Hollow Reservoir from the nearby Virgin River generally have resulted in rising reservoir stage, ranging from about 3,000 feet (ft) in 2002 to a maximum of about 3,060 ft in 2006, which then fluctuated between about 3,040 and 3,060 ft from 2008 through 2018. Similarly, groundwater levels in monitoring wells closest to the reservoir generally rose between 2002 and 2006, and then fluctuated with the reservoir altitude and pumpage rate from nearby production wells. Water levels in monitoring wells farther from the reservoir were still rising through 2018.
About 46,000 acre-feet (acre-ft) of groundwater was withdrawn from production wells near Sand Hollow Reservoir between 2004 and 2018. French drains, installed to capture shallow seepage near the reservoir, were also pumped as they filled with water. About 10,500 acre-ft of groundwater was pumped from the North Dam drain between 2003 and 2018. Initially, this water was returned to the reservoir, but since 2007, it has been used by Sand Hollow Resort for irrigation. About 2,500 acre-ft of water was pumped from the West Dam drain back into the reservoir from 2005 through 2018. In 2006, the West Dam Spring drain was constructed and largely replaced the function of the West Dam drain. About 32,000 acre-ft of water was pumped from the West Dam Spring drain into the Washington County Water Conservancy District’s municipal supply system from 2006 through 2018.
Total annual surface-water inflow to Sand Hollow Reservoir ranged from about 56,000 acre-ft in 2005 to 800 acre-ft in 2007; total inflow from 2002 through 2018 was about 288,000 acre-ft. The general increase in reservoir water-level altitude and surface area from 2002 to 2007 resulted in a steady increase in the volume of annual evaporation from about 1,000 to about 6,600 acre-ft through 2006, which then leveled off from 2007 through 2018. The total estimated cumulative evaporative loss from 2002 through 2018 was about 101,000 acre-ft; during this same period, annual reservoir recharge to the underlying Navajo Sandstone aquifer fluctuated between about 5,000 and 18,000 acre-ft. Total calculated reservoir recharge from 2002 through 2018 was about 159,000 acre-ft with a two standard deviation uncertainty of 15,100 acre-ft. From 2002 through 2018, calculated monthly recharge volumes ranged from 12 to almost 3,500 acre-ft, and average daily recharge rates (calculated for each month) ranged from 0.0003 to 0.43 ft.
Annual water-quality sampling, including field parameters, chemistry, and environmental tracers (tritium, chlorofluorocarbons, and sulfur hexafluoride) was continued during 2017 and 2018. The most significant changes occurred at monitoring wells water district (WD) 12 (1,000 ft from the reservoir) and WD 22 (1,700 ft from the reservoir), where increases in salinity (specific conductance) and dissolved oxygen (and environmental tracer concentrations at WD 22) indicate rising groundwater levels and mobilization of vadose-zone salts, likely an indicator of the arrival of reservoir recharge. At wells WD 9 (55 ft from reservoir) and WD 11 (160 ft from reservoir), field parameters, and water-quality and environmental tracer data indicate that reservoir recharge arrived several years before 2014. At well WD 6 (1,000 ft from reservoir), salinity, chloride/bromide ratios, and environmental tracer data all indicate the arrival of reservoir recharge before 2018. Although well WD 8 is only 500 ft from the reservoir, it is downgradient of an area of high natural recharge south of Sand Hollow and may lie along a groundwater boundary between the two recharge mounds; relatively high concentrations of modern environmental tracers may be caused by natural recharge. At WD 15 and WD 16 (nested wells that are 2,400 ft from the reservoir), water-quality and environmental tracer data indicated a rising water table, but no arrival of reservoir recharge at the time of this report.
References Cited
Heilweil, V.M., and Marston, T.M., 2011, Assessment of managed aquifer recharge from Sand Hollow Reservoir, Washington County, updated to conditions in 2010: U.S. Geological Survey Scientific Investigations Report 2011–5142, 39 p. [Available at https://doi.org/10.3133/sir20115142.]
Heilweil, V.M., and McKinney, T.S., 2007, Net-infiltration map of the Navajo Sandstone outcrop area in western Washington County, Utah: U.S. Geological Survey Scientific Investigations Map 2988, 2 sheets. [Available at https://doi.org/10.3133/sim2988.]
Heilweil, V.M., McKinney, T.S., Zhdanov, M.S., and Watt, D.E., 2007, Controls on the variability of net infiltration to desert sandstone: Water Resources Research, v. 43, no. 7, 15 p. [Available at https://doi.org/10.1029/2006WR005113.]
Heilweil, V.M., Ortiz, G., and Susong, D.D., 2009a, Assessment of managed aquifer recharge at Sand Hollow Reservoir, Washington County, Utah, updated to conditions through 2007: U.S. Geological Survey Scientific Investigations Report 2009–5050, 19 p. [Available at https://doi.org/10.3133/sir20095050.]
Heilweil, V.M., and Solomon, D.K., 2004, Millimeter- to kilometer-scale variations in vadose-zone bedrock solutes—Implications for estimating recharge in arid settings, in Hogan, J.F., Phillips, F.M., and Scanlon, B.R., eds., Groundwater recharge in a desert environment—The southwestern United States: Washington, D.C., American Geophysical Union, Water Science and Application, v. 9, p. 49–67. [Available at https://doi.org/10.1029/009WSA04.]
Heilweil, V.M., Solomon, D.K., and Gardner, P.M., 2006, Borehole environmental tracers for evaluating net infiltration and recharge through desert bedrock: Vadose Zone Journal, v. 5, no. 1, p. 98–120. [Available at https://doi.org/10.2136/vzj2005.0002.]
Heilweil, V.M., Solomon, D.K., Perkins, K.S., and Ellett, K.M., 2004, Gas-partitioning tracer test to quantify trapped gas during recharge: Groundwater, v. 42, no. 4, p. 589–600. [Available at https://doi.org/10.1111/j.1745-6584.2004.tb02627.x.]
Heilweil, V.M., and Susong, D.D., 2007, Assessment of artificial recharge at Sand Hollow Reservoir, Washington County, Utah, updated to conditions through 2006: U.S. Geological Survey Scientific Investigations Report 2007–5023, 14 p. [Available at https://doi.org/10.3133/sir20075023.]
Heilweil, V.M., Susong, D.D., Gardner, P.M., and Watt, D.E., 2005, Pre- and post-reservoir ground-water conditions and assessment of artificial recharge at Sand Hollow, Washington County, Utah, 1995–2005: U.S. Geological Survey Scientific Investigations Report 2005–5185, 74 p. [Available at https://doi.org/10.3133/sir20055185.]
Heilweil, V.M., and Watt, D.E., 2011, Trench infiltration for managed aquifer recharge to permeable bedrock: Hydrological Processes, v. 25, no. 1, p. 141–151. [Available at https://doi.org/10.1002/hyp.7833.]
Marston, T.M., and Heilweil, V.M., 2012, Numerical simulation of groundwater movement and managed aquifer recharge from Sand Hollow Reservoir, Hurricane Bench area, Washington County, Utah: U.S. Geological Survey Scientific Investigations Report 2012–5236, 34 p. [Available at https://doi.org/10.3133/sir20125236.]
Marston, T.M., and Heilweil, V.M., 2013, Assessment of managed aquifer recharge at Sand Hollow Reservoir, Washington County, Utah, updated to conditions in 2012: U.S. Geological Survey Scientific Investigations Report 2013–5057, 40 p. [Available at https://doi.org/10.3133/sir20135057.]
Marston, T.M., and Heilweil, V.M., 2016, Assessment of managed aquifer recharge at Sand Hollow Reservoir, Washington County, Utah, updated to conditions through 2014: U.S. Geological Survey Open-File Report 2016–1078, 35 p. [Available at https://doi.org/10.3133/ofr20161078.]
Marston, T.M., and Nelson, N.C., 2018, Assessment of managed aquifer recharge at Sand Hollow Reservoir, Washington County, Utah, updated to conditions through 2016: U.S. Geological Survey Open-File Report 2018–1140, 38 p. [Available at https://doi.org/10.3133/ofr20181140.]
Rosenberry, D.O., Winter, T.C., Buso, D.C., and Likens, G.E., 2007, Comparison of 15 evaporation methods applied to a small mountain lake in the northeastern USA: Journal of Hydrology (Amsterdam), v. 340, nos. 3–4, p. 149–166. [Available at https://doi.org/10.1016/j.jhydrol.2007.03.018.]
Appendix 1. Field Water Quality and Geochemistry
Field water-quality parameters, dissolved organic carbon, tritium, chlorofluorocarbons, and sulfur hexafluoride in groundwater and surface water from Sand Hollow, Utah. Available as a CSV file at https://doi.org/10.3133/ofr20221089. Data are also found at https://waterdata.usgs.gov/nwis.
Major and minor chemical constituents in groundwater and surface water from selected sites in Sand Hollow, Utah. Available as a CSV file at https://doi.org/10.3133/ofr20221089. Data are also found at https://waterdata.usgs.gov/nwis.
Conversion Factors
U.S. customary units to International System of Units
Temperature in degrees Fahrenheit (°F) may be converted to degrees Celsius (°C) as follows:
°C = (°F − 32) / 1.8.
Datum
Horizontal coordinate information is referenced to the North American Datum of 1983 (NAD 83).
Altitude, as used in this report, refers to distance above the vertical datum.
Supplemental Information
Specific conductance is given in microsiemens per centimeter at 25 degrees Celsius (µS/cm at 25 °C).
Total dissolved gas pressure is reported in millimeters of mercury (mm Hg), where 760 mg Hg equals one atmosphere.
Concentrations of chemical constituents in water are given in either milligrams per liter (mg/L) or micrograms per liter (µg/L).
Chlorofluorocarbon (CFC) concentrations are reported as picomoles per kilogram (pmol/kg).
Sulfur hexafluoride (SF6) concentrations are reported as femtomoles per kilogram (fmol/kg).
Abbreviations
σ
standard deviation
3H
tritium
DO
dissolved oxygen
DOC
dissolved organic carbon
MAR
managed aquifer recharge
NRCS
Natural Resources Conservation Service
PET
potential evapotranspiration
SCAN
Soil Climate Analysis Network
TDG
total dissolved gas
USGS
U.S. Geological Survey
WCWCD
Washington County Water Conservancy District
WD
water district
For more information concerning the research in this report, contact the
Director, Utah Water Science Center
U.S. Geological Survey
2329 West Orton Circle
Salt Lake City, Utah 84119-2047
801-908-5000
Publishing support provided by the U.S. Geological Survey
Science Publishing Network, Sacramento Publishing Service Center
Disclaimers
Any use of trade, firm, or product names is for descriptive purposes only and does not imply endorsement by the U.S. Government.
Although this information product, for the most part, is in the public domain, it also may contain copyrighted materials as noted in the text. Permission to reproduce copyrighted items must be secured from the copyright owner.
Suggested Citation
Marston, T.M., 2024, Assessment of managed aquifer recharge at Sand Hollow Reservoir, Washington County, Utah, updated to conditions through 2018: U.S. Geological Survey Open-File Report 2022–1089, 20 p., https://doi.org/10.3133/ofr20221089.
ISSN: 2331-1258 (online)
Study Area
| Publication type | Report |
|---|---|
| Publication Subtype | USGS Numbered Series |
| Title | Assessment of managed aquifer recharge at Sand Hollow Reservoir, Washington County, Utah, updated to conditions through 2018 |
| Series title | Open-File Report |
| Series number | 2022-1089 |
| DOI | 10.3133/ofr20221089 |
| Publication Date | January 12, 2024 |
| Year Published | 2024 |
| Language | English |
| Publisher | U.S. Geological Survey |
| Publisher location | Reston, VA |
| Contributing office(s) | Utah Water Science Center |
| Description | Report: v, 20 p.; 2 Tables |
| Country | United States |
| State | Utah |
| County | Washington County |
| Other Geospatial | Sand Hollow Reservoir |
| Online Only (Y/N) | Y |
| Additional Online Files (Y/N) | Y |