

Field Application of Carbon Dioxide as a Behavioral Control Method for Invasive Red Swamp Crayfish (Procambarus clarkii) in Southeastern Michigan Water Retention Ponds
Links
- Document: Report (1.08 MB pdf) , HTML , XML
- Data Release: USGS data release - Water quality and atmospheric carbon dioxide data for field application of carbon dioxide during summer 2018 as a behavioral control method for invasive red swamp crayfish (Procambarus clarkii) in southeastern Michigan water retention ponds
- NGMDB Index Page: National Geologic Map Database Index Page (html)
- Download citation as: RIS | Dublin Core
Acknowledgments
This project was funded by the Great Lakes Restoration Initiative (GLRI). We thank several staff from the Michigan Department of Natural Resources, Michigan State University, Auburn University, U.S. Fish and Wildlife Service, and U.S. Geological Survey for participation in various stages of planning, setup, and completion of this project.
Abstract
This study evaluated carbon dioxide (CO2) injected into water as a possible behavioral stimulant to enhance capture and removal of invasive red swamp crayfish (RSC, Procambarus clarkii [Girard, 1852]) from a retention pond in southeastern Michigan. Objectives of this study were (1) to determine if target CO2 concentrations were attainable within the infested pond and (2) to determine if CO2 treatment was effective to push RSC either towards shorelines or onto dry land, where they could be collected and removed. Carbon dioxide was applied directly into one treatment pond (about [~]2,500 cubic meters) in Novi, Michigan. Two nearby ponds in Livonia, Mich., were used as untreated control ponds. Crayfish removal efficiency was evaluated in all ponds using baited traps and shoreline surveys. Results showed that the CO2 treatment pond reached its target concentration of greater than (>) 200 milligrams per liter (mg/L) of CO2, a benchmark determined from previous laboratory studies, approximately 11 hours after injection started, and maintained concentrations between 200 and 351 mg/L of CO2 for about 2.5 days. During treatment, some emergent crayfish were observed near influent culverts around the pond, which possibly brought about a behavioral response. However, the number of individuals and crayfish observations were minimal and infrequent. Crayfish continued to be removed throughout CO2 treatment with baited traps and perimeter surveys, but differences in catch rates between the treatment and control ponds were not apparent and confounded by a temporal decline in catch rates across all ponds. Overall, this study demonstrated that open-water treatment applications with CO2 are possible, but its effectiveness to enhance RSC removal was unclear because of the limited crayfish observations.
Introduction
Red swamp crayfish (RSC, Procambarus clarkii [Girard, 1852]) are a prolific aquatic invasive species that has spread throughout the United States since the 1920s (Nagy and others, 2020). Native to the southeastern United States, RSC are believed to have been spread into other waterbodies throughout the country for use in the food industry as bait for fishing, through inadvertent transport in aquaculture, and as pets in the aquarium trade (Lodge and others, 2012; Oficialdegui and others, 2019). RSC can cause considerable economic and ecological effects through disruptions to native ecosystems (Souty-Grosset and others, 2016). Range expansion and relocation of RSC has been associated with ecological challenges such as shoreline erosion and loss of sport fish habitat. The economic effects of RSC expansion have led natural resource agencies to address population surveillance and monitoring, and develop novel control techniques. Similarly, management agencies also deal with ecological concerns for native species conservation arising from direct and indirect competition among RSC with native crayfishes for food and habitat resources (Lodge and others, 2012). Although RSC may provide a beneficial new food source for native predators like sportfishes, the long-term ecological fallout of an invasive species is often unknown and irreversible. With limited evidence of previous successful RSC eradications after they have become established, management agencies have expressed a need to immediately address RSC invasions when first detected in new areas.
In 2017, biologists from the Michigan Department of Natural Resources (MIDNR) and Michigan State University (MSU) collected live RSC in isolated ponds throughout the southeastern part of Michigan (Smith and others, 2021). Although RSC are listed as a prohibited aquatic species in Michigan, agencies have speculated that they may have been introduced through a variety of mechanisms, including bait bucket transfer, educational specimens, live markets, or illegal stocking. Nonetheless, RSC are now present in Michigan and pose a threat to spread into new waterbodies. Proximity to the Great Lakes has further emphasized the need to rapidly address RSC infestations in Michigan to prevent a basin-wide invasion. Early detection and limited distribution present an opportunity to implement RSC management plans to control populations and distribution.
The MIDNR develops an annual “Red Swamp Crayfish Response Plan” that includes management goals to suppress established RSC populations, eradicate new RSC populations, and limit distribution into new areas. Baited trapping is perhaps the most practical and efficient method to mitigate RSC infestations. Traps are generally inexpensive, easy to deploy, and highly effective. The MIDNR and MSU have collaboratively established a standardized baited trap sampling protocol for long-term monitoring. Crayfish collected in baited traps provide important information regarding abundance, geographic distribution, and reproductive status (for example, sex and fecundity). However, other supplemental tools are needed to meet management objectives because trapping alone will more than likely not fully eradicate RSC.
Carbon dioxide (CO2) is a new pesticide option in the United States that has been effective at controlling aquatic nuisance species (Cupp and others, 2020). Much of the research and development with CO2 has focused on its use as a lethal and behavioral control for invasive fishes. However, recent studies have also shown its potential as a behavioral stimulant for invasive crayfishes. Laboratory testing indicated that invasive crayfish generally respond to CO2 in two ways (Fredricks and others, 2020). At generally modest concentrations, that is about 50–400 milligrams per liter (mg/L) of CO2, crayfish voluntarily moved away from elevated CO2 and sought refuge in untreated areas, that is locations with ambient CO2 concentrations, or emerged near the air/water interface. In contrast, crayfish exposed to more severe concentrations, that is concentrations that are greater than (>) 1,000 mg/L of CO2, involuntarily showed signs of impairment and narcotization through loss of equilibrium and absence of defense responses. Similar behavioral outcomes were observed in mesocosm studies in outdoor ponds where CO2 treatments pushed nearly 50 percent of all stocked crayfish towards the shorelines, which is where they were collected and removed (Abdelrahman and others, 2021). Although these studies were completed in highly controlled environments, results indicated that CO2 applications altered crayfish behavior in ways that are potentially beneficial as a control measure. Conceptually, CO2 could be applied to push individuals into confined areas where they could be trapped or killed with pesticides. Building on these proof-of-concept studies, the next step is to evaluate CO2 under field conditions to assess effectiveness and relevance under real-world management conditions.
The specific objectives of this study were to determine (1) if open-water field applications can achieve target CO2 concentrations, (2) if CO2 treatments enhance near-shore removal of red swamp crayfish, and (3) if crayfish relative abundance in infested ponds declines after treatment.
Methods
Treatment and Control Sites
Trials were completed between August 14 and 29, 2018, in southeastern Michigan (fig. 1). Three test sites were chosen and included two golf course ponds and a single urban water retention pond with known RSC infestations. In addition to the three test ponds, two untreated control ponds in Livonia, Mich., were chosen. Due to heavy rainfall the week before testing, two of the test ponds were flooded rendering them untreatable. The remaining treatment site was a water retention pond in Novi, Mich. The treatment pond had a volume of ~2,500 cubic meters (m3) and a surface area of ~0.9 hectare (ha). Control pond 1 had a volume of ~400 m3 and a surface area of ~0.2 ha, and control pond 2 had a volume of ~2,000 m3 and a surface area of ~0.7 ha.
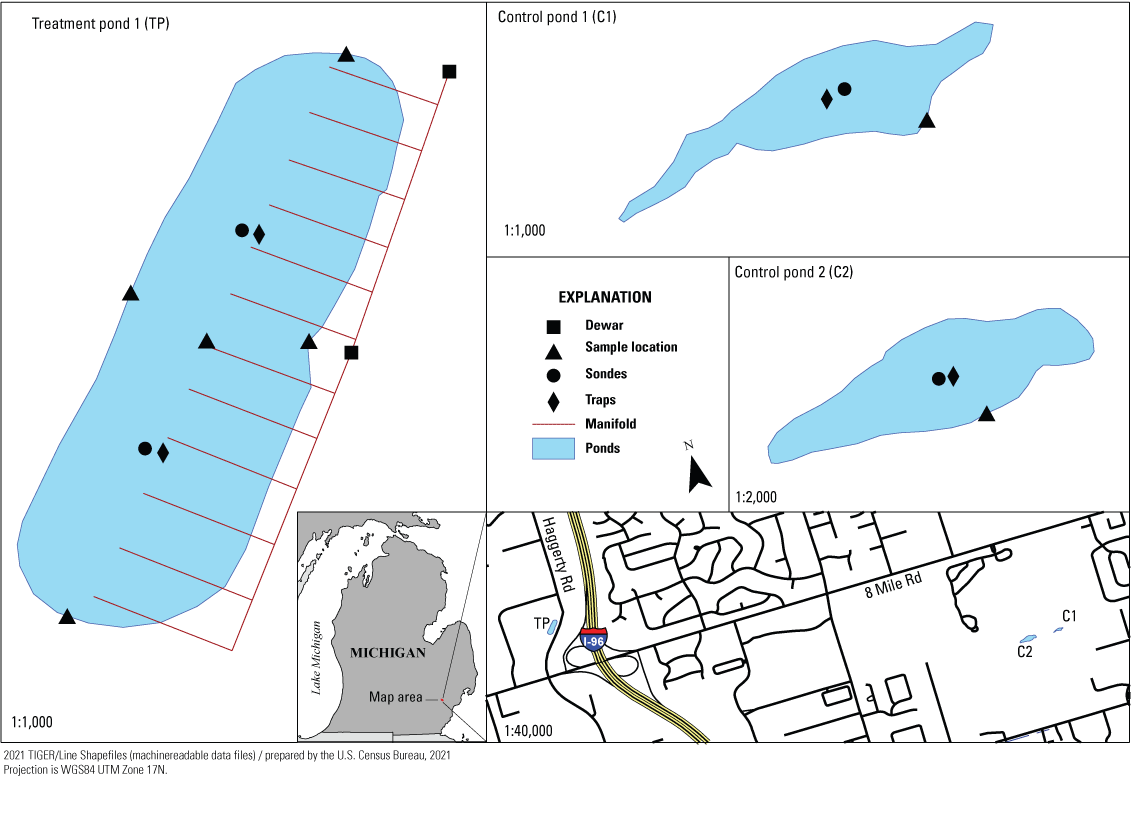
Location and spatial proximity of treatment and control ponds. Approximate locations of gas equipment and sample measurements during treatment applications. Carbon dioxide (CO2) was injected into the treatment pond using an array of diffusers. Control ponds were untreated and received no artificial CO2.
Trapping
Ponds were prepared for testing by removing brush along the shorelines and installing silt fencing as a barrier approximately 1 meter (m) from the shoreline. A folded shade cloth was then placed between the shoreline and the silt fence barrier around each pond. The barrier was necessary to prevent RSC escapement and served as a boundary for perimeter surveys. Shade cloth between the barrier and shoreline provided a terrestrial habitat and a collection point for emergent crayfish (Abdelrahman and others, 2021). Minnow traps (Tackle Factory, Model G40M, 6.35-millimeter [mm] mesh) baited with dry dog food were also placed in control pond 1 (C1), control pond 2 (C2), and treatment pond (TP) throughout testing. Trap openings were increased slightly to approximately 3 centimeters (cm) to accommodate larger crayfish sizes following protocols detailed by previous studies (Capelli and Magnuson, 1983; Hein and others, 2006). Baited traps were placed in C1, C2, and TP according to a fixed distance sampling design (fig. 1). Traps were placed the day before treatment application and checked once daily to evaluate crayfish captures. Perimeter surveys were completed in the CO2-treated pond approximately every 2–4 hours before, during, and after treatment application. Control ponds were also opportunistically surveyed, but timing was not standardized due to limited access to those sites at certain times throughout the day and night. Visual surveys were usually completed in two-person teams; one person waded in the water and the other walked on the shore near the silt fence. Locations where crayfish were collected during perimeter surveys were identified as (1) outside of the silt fence, (2) inside the fence, (3) under the shade cloth flap, or (4) in the water. Crayfish were collected by hand when they were on land and gigged when they were in the water. All crayfish collected from traps or perimeter surveys were removed from the pond and euthanized at the time of their collection.
Water Quality and Atmospheric CO2
Water quality was measured in C1, C2, and TP throughout testing. Baseline water quality was determined by collecting grab samples from each pond approximately 1.2 m from shore and 0.15–0.30 m under the water’s surface (fig. 1). Grab samples were collected approximately every 2 hours in the TP. Less frequent grab samples were collected from C1 and C2 due to limited golf course access at certain times of the day and night. Grab samples were collected from north, west, east, and south locations at the TP, and a single location at C1 and C2 (fig. 1). Intermittent water-quality samples were collected from the center of the TP. Samples were collected with a 1-liter (L) container and sealed. Each grab sample was analyzed for dissolved oxygen (HACH Model HQ40d, Hach Company, Loveland, Colorado), pH (HACH Model HQ40d), water temperature (Thermapen MK4, ThermoWorks, American Fork, Utah), CO2 (HACH Method 8205), ammonia-N (HACH DR3900 photospectometer, TNT 830 test kits), alkalinity (HACH DR3900 photospectometer, TNT 870 test kits) (APHA, 2012), and hardness (HACH DR3900 photospectometer, TNT 869 test kits) (APHA, 2012). Autonomous water-quality sondes (YSI 600XLM, YSI, Yellow Springs, Ohio) were also deployed in each pond to collect time-series pH and water temperature every 30 minutes before, during, and after testing. Sondes were attached to a rope with a buoy and suspended approximately 0.15 m below the surface in C1 (water depth of 0.30 m), 0.20 m below the surface in C2 (water depth of 1.22 m), and 0.3 m below the surface in the TP (water depth of 1.22 m). Time-series pH data from sondes were converted to CO2 concentrations using a standard curve relationship determined from grab sample analyses (fig. 2). Sondes remained in ponds until August 29, 2018, which is when the final water-quality samples were collected and analyzed. The water level had increased by greater than 0.30 m from rainfall and runoff by the end of the study.
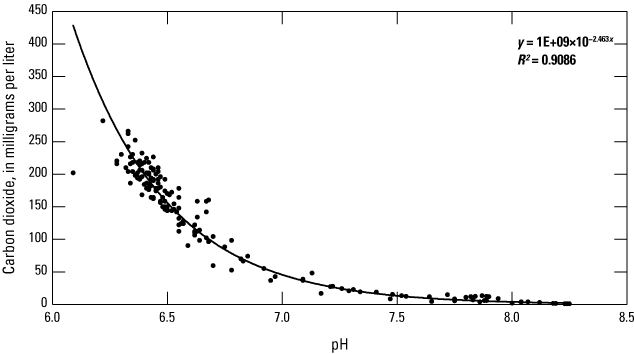
Standard curve of the relation between pH and carbon dioxide in treatment pond water.
Atmospheric CO2 data were collected with a handheld meter (pSense Model AZ–0002, CO2meter.com, Ormond Beach, Florida) at the surface and 1 m above the surface of the ponds at water-quality grab sample locations. Atmospheric CO2 was measured before, during, and after treatment. The purpose of atmospheric sampling was to ensure staff safety and quantify CO2 exposure levels.
Treatment
Carbon dioxide was injected into the TP to obtain a target concentration of 200 mg/L. This concentration was a benchmark established during pilot testing to elicit RSC emergence behaviors in outdoor ponds (Abdelrahman and others, 2021). Briefly, 24 porous air diffusers (Sweetwater Model: DYFP16, Pentair, Apopka, Florida) were attached to small bricks and submerged equidistantly throughout the pond. Each diffuser was attached to clear tubing (6.35 mm inner diameter [I.D.]) that connected to gas flow manifolds (oxygen flow meter manifold, Model: 1FMM222, Pentair, Apopka, Florida) on the shore. Manifolds were then connected with flexible tubing (9.525 mm I.D.) directly to heated gas regulators on CO2 storage tanks (160-L liquid dewars, Airgas Inc.). Twenty-five CO2 tanks were split between the north and east sides of the pond. Tanks were covered with canopies to reduce direct exposure to sunlight to minimize tank pressure, which could accelerate pressure relief of CO2 into the atmosphere. Carbon dioxide treatments in TP began at approximately 1100 hours on August 21, 2018, and ended at approximately 0200 hours on August 24, 2018. Gaseous CO2 was continuously injected at a flow rate of 15 liters per minute (maximum flow rate of gas flow manifolds) per tank until all tanks were empty.
Statistical Analysis
The removal of two treatment ponds due to flooding reduced the number of treatment site replicates to one and confounded any possible inferential comparisons. Therefore, all water quality, air quality, trapping, and perimeter survey data were summarized for each pond using basic descriptive measures (for example, mean and variance estimates). Data summaries are intended to broadly describe outcomes from this study to inform future treatments and management actions. Inferences based on statistical significance are not included. All data collected for this report are available through a U.S. Geological Survey data release, https://doi.org/10.5066/P99OUHMV (Smerud and others, 2022).
Data, Findings, and Observations
Water Quality
Treatment applications met and exceeded target CO2 concentrations. Maximum concentrations measured in TP were 282 mg/L of CO2 (titrated from grab samples; table 1) and 352 mg/L of CO2 (calculated from sonde pH measurements; fig. 3). The discrepancy in maximum concentrations between the two sampling methods was likely attributed to sample locations. Sondes were placed mid-depth in the center of the pond, whereas grab samples were collected near-shore. Target concentrations were achieved approximately 11 hours after treatment initiation and were sustained at >200 mg/L of CO2 for approximately 68 hours. Maximum concentrations were reached at approximately 48 hours into treatment (fig. 3). Control ponds showed only minor fluctuations in ambient CO2 concentrations with a range of 1.6–3.8 mg/L from grab samples and 0–14.5 mg/L from water-quality sondes (table 2).
Table 1.
Water-quality data (dissolved oxygen, temperature, pH, and carbon dioxide [CO2]) from grab samples collected from the treatment pond. Data include baseline (before CO2 was administered, application [during CO2 injection], and post [after CO2 application ended]). Water-quality data for alkalinity, hardness, and ammonia are total values collected during the baseline and post periods of the study.[mg/L, milligram per liter; °C, degree Celsius; CO2, carbon dioxide; CaCO3, calcium carbonate; NH3-N, ammonia nitrogen; Std. dev., standard deviation; --, no data]
Table 2.
Water-quality data from grab samples collected from untreated control ponds throughout the study.[mg/L, milligram per liter; °C, degree Celsius; CO2, carbon dioxide; CaCO3, calcium carbonate; NH3-N, ammonia nitrogen; Std. dev., standard deviation]
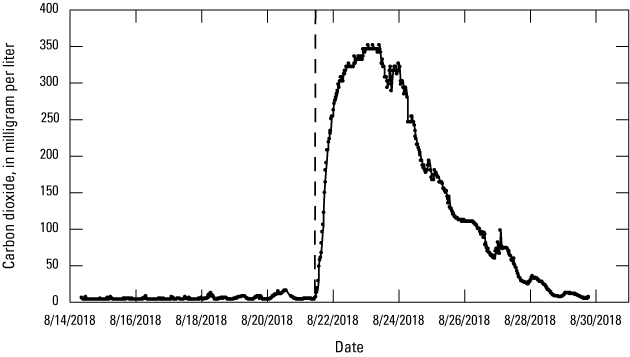
Carbon dioxide concentrations over time in the treatment pond. Dashed line indicates the start of carbon dioxide injection.
Dissolved oxygen in the TP was 8.92 plus or minus (±) 0.85 (mean±standard deviation) mg/L and was 8.53±0.84 mg/L in the control ponds. Mean pH in the TP was 6.77±0.57 and was 8.49±0.85 in the control ponds. The pH suppression observed in the TP was expected because CO2 mixed into water produces an equilibrium reaction with bicarbonate and carbonic acid. Minor pH variations in the untreated control ponds were likely attributed to diurnal photosynthetic activity. Water temperature was 22.5±1.90 degrees Celsius (°C) in the TP and 23.9±2.11 in the control ponds. Alkalinity (as milligrams per liter of calcium carbonate [CaCO3]) was 347±135 in TP and 133±49.6 in the control ponds. Hardness (as milligrams per liter of CaCO3) was 371±71.4 in TP and 131±43.2 in the control ponds. Ammonia (as milligrams per liter of unionized ammonia [NH3-N]) was 0.017±0.002 in the TP and 0.027±0.016 in the control ponds. Complete summaries of water-quality data are documented in tables 1, 2, and 3.
Table 3.
Water-quality data (pH and carbon dioxide [CO2]) from sondes for the treatment pond (baseline, application, and post) and control ponds 1 and 2. Control ponds are not discretized by the treatment period.CO2, carbon dioxide; mg/L, milligram per liter; Std. dev., standard deviation]
Crayfish Trapping and Surveys
Crayfish responses were monitored during injection using a combination of perimeter surveys and baited traps. Overall, catch rates for both sampling methods were relatively low throughout injection. Perimeter survey collections showed a rapid increase in crayfish captured in the water near shore on the second and third day of injection (fig. 4). However, catches on dry land at the other three sample locations saw a slight decline in captured crayfish. Results from baited traps showed a strong temporal decline because of catch rates in the treatment pond starting several weeks before injection (fig. 5). At the start of injection, control and treatment ponds had relatively similar catch rates. Control ponds had consistently low catch rates throughout the summer. Catch rates in the TP at the time of injection were low, which made discerning differences between treatment and control ponds not obvious (fig. 6). Further, there was no clear change in baited trap catches after injection. The low catch rates in all ponds continued throughout the end of trapping season. One possible explanation for the temporal decline in catch rates in the TP before injection was the corresponding decrease in water temperatures (fig. 7). Catch rates seemed to peak when water temperatures were at their highest and then declined with decreasing water temperature. However, this was not corroborated with control ponds where catch rates were consistently low.
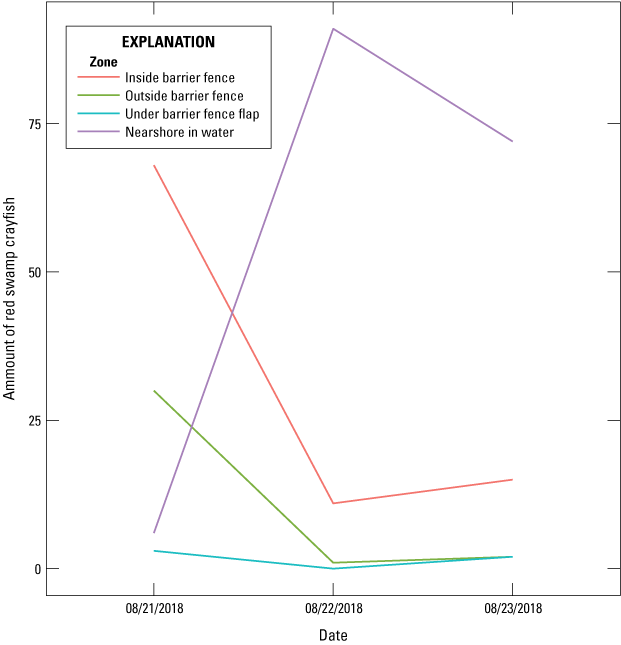
Total number of crayfish collected over time during perimeter surveys in the treatment pond. Crayfish were assigned a location based on where they were captured. The highest number of crayfish were collected near the shoreline in the water.
Catch per unit effort (CPUE) from baited traps in the treatment and control ponds from June 1 to September 30, 2018.
Graph showing catch per unit effort from baited traps in the treatment and control ponds from August 15 to 30, 2018.
Graph showing water temperature data in treatment and control ponds from June 1 to September 30, 2018.
Crayfish and Fish Observations
Visual observations of crayfish and certain fish species were documented throughout testing. Approximately 12 crayfish were observed congregating during treatments on a concrete culvert on the west side of the pond. Crayfish were observed near the air-water interface, and most observations were made during the morning perimeter surveys. On the last day of treatment, four crayfish were observed displaying loss of equilibrium, presumed as narcotization from prolonged CO2 exposure, in the northeast corner of the pond. After 12 hours into CO2 application, large masses of fathead minnows (Pimephales promelas; Rafinesque, 1820) were observed porpoising at the water's surface. At 24 hours, a few small green sunfish (Lepomis cyanellus; Rafinesque, 1819) and four adult-sized channel catfish (Ictalurus punctatus; Rafinesque, 1818) exhibited anesthetic behaviors and loss of equilibrium. Mortalities included one catfish, three green sunfish, and several thousand fathead minnows by the conclusion of the treatment. No crayfish mortalities were documented.
Atmospheric CO2
Atmospheric data displayed minor fluctuations in the treatment pond when CO2 was applied (table 4). The maximum atmospheric CO2 concentration measured at the TP shoreline, 1 m above the water surface, was 1,415 parts per million (ppm). Control ponds reached a maximum of 400 ppm, which was consistent with ambient atmospheric CO2. The highest single atmospheric CO2 level, away from the TP, was 2,390 ppm and was recorded inside the enclosed canopy tent where tanks were stored. All atmospheric CO2 readings were well below the 5,000 ppm 8-hour Time Weighted Average and 30,000 ppm acute 15-minute exposure limits for human safety (National Institute for Occupational Safety and Health [NIOSH], 2019).
Discussion
This study was a first attempt at evaluating CO2 as a behavioral stimulant for RSC under field conditions. The study originally included three RSC-infested ponds with CO2 and was intended to provide replication and allow statistical comparisons with the two control ponds for efficacy assessment. However, flooding made two of the sites untreatable, limiting replication and prohibiting statistical inferences. Nonetheless, this study evaluated a new control technique in the field and collected data for both research and management purposes.
The first objective of this study was to determine if open water CO2 applications are possible. We set an initial benchmark of >200 mg/L of CO2 as our target concentration because RSC displayed emergence behaviors at these concentrations in outdoor mesocosm trials at Auburn University (Abdelrahman and others, 2021). In total, approximately 4,500 kilograms (kg) of gaseous CO2 was injected into the TP over approximately 63 hours. Total cost for the CO2 product was $5,405 U.S. dollars, which equated to approximately $1.20 U.S. dollars per kilogram. Resultant concentrations measured in TP showed that target concentrations were effectively met and exceeded throughout CO2 application. Diffusers were relatively inefficient at delivering CO2 into the pond and resulted in a low gas-transfer efficiency that was estimated at less than 20 percent based on a comparison of the highest measured concentrations relative to the total CO2 mass injected. Other studies with more sophisticated gas-injection equipment have reported much higher efficiencies from 80 to 90 percent and could be considered if treatments are repeated in the future (Cupp and others, 2018; Zolper and others, 2019). However, gas-lines and diffusers were relatively simple to deploy in the field and widely available from aquaculture supply stores, which made them a beneficial method for field testing. Overall, we found that open water applications of CO2 are possible and can be used with common gas-injection equipment.
The second objective for this study was to determine if CO2 applications were effective to enhance nearshore removal of RSC. This proved to be challenging. Placement of physical barriers around the ponds was labor-intensive and required multistaff crews several days to complete. Brush, shoreline irregularities, and culverts further complicated the barrier placement in all ponds. Also, standardization of surveys across treatment and control ponds was not possible due to access limitations as the control ponds were on private property. Perimeter surveys were completed regularly in the TP, but less frequently in control ponds. To address this limitation, we normalized data by catch per unit effort to allow qualitative comparisons. Observations with perimeter surveys were only marginally successful as few crayfish were collected in comparison to bait-trapping. Lack of crayfish observations made it difficult to determine if behavioral responses were indicative of normal behaviors or in response to treatment. However, during the later stages of treatment application, small numbers of crayfish were observed around culvert inflows. It is possible that culverts provided a source of freshwater refuge to escape CO2 exposure. This seems plausible due to the locations where crayfish resided near the air/water interface. Although we did not have the ability to fine-scale measure CO2 stratification at the water’s surface, repeated occurrences of crayfish in those locations indicated it was a favorable location to escape treatment. During future research, CO2 diffusers could be located near or in influent water sources to reduce low CO2 zones of refuge. Regardless, limited observations and lack of replication made it challenging to address whether or not treatments definitively caused crayfish emergence; thus, further testing would be beneficial.
The third objective of this study was to determine if RSC abundance changed after treatments. Baited traps placed in ponds before, during, and after treatments continued to collect RSC during all discretized periods. The number of RSC captured in traps declined or remained low in all ponds during and after treatments. Although this may be attributed to CO2 application, a more likely explanation was seasonally driven by a temporal effect on trap-catch efficiency in both control and treatment ponds. The number of RSC continued to decline after the study concluded, and low trap catches were reported for the remainder of the year. The effect of temporal trapping efficiency (for example, water temperature and reproductive timing) on RSC in Michigan could be consequential for future control efforts; for example, if trap catches are positively correlated with warmer water temperatures, it would be reasonable to focus the most trapping and control efforts during those times of the year. Similarly, if crayfish activity is at its highest during the warmest time of the year, that could be an opportune time to administer pesticides or other control measures. Overall, we documented a decline in catch per unit effort immediately before and during this study, but it is unclear if those reduced catches were due to CO2 treatments or water temperature.
Narcotized crayfish were observed during the later stages of treatment. Loss of equilibrium was not intended with CO2 application and was likely counter-productive to eliciting an emergence behavioral response. CO2 is commonly used as an anesthetic technique for fishery applications, and it is likely that prolonged exposure to elevated CO2 also produced an anesthetic response from crayfish. Mortalities for three fish species were observed during treatment. Although this study did not specifically monitor the survival of crayfish after treatment, the combined observations of fish mortality with narcotization of crayfish indicates that delayed RSC mortality could have occurred. Future research may be useful to determine the potential use of CO2 as a lethal control of nuisance crayfish.
In conclusion, this study demonstrated that open water CO2 applications are possible. Results on RSC behavioral responses were unclear and confounded by limited replication. Population level effects of CO2 treatments are also inconclusive but could be addressed through future research with CO2 as a lethal control.
References Cited
Abdelrahman, H., Gibson, R., Fogelman, K., Cupp, A.R., Allert, A., and Stoeckel, J., 2021, Evaluation of dissolved carbon dioxide to stimulate emergence of red swamp crayfish Procambarus clarkii (Decapoda—Cambaridae) from infested ponds: Management of Biological Invasions : International Journal of Applied Research on Biological Invasions, v. 12, no. 4, p. 952–974, accessed October 3, 2022, at https://doi.org/10.3391/mbi.2021.12.4.11.
Capelli, G.M., and Magnuson, J.J., 1983, Morphoedaphic and biogeographic analysis of crayfish distribution in northern Wisconsin: Journal of Crustacean Biology, v. 3, no. 4, p. 548–564, accessed March 9, 2020, at https://doi.org/10.1163/193724083X00210.
Cupp, A.R., Smerud, J.R., Thomas, L.M., Waller, D.L., Smith, D.L., Erickson, R.A., and Gaikowski, M.P., 2020, Toxicity of carbon dioxide to freshwater fishes—Implications for aquatic invasive species management: Environmental Toxicology and Chemistry, v. 39, no. 11, p. 2247–2255, accessed March 9, 2020, at https://doi.org/10.1002/etc.4855.
Cupp, A.R., Smerud, J.R., Tix, J.A., Rivera, J.M., Kageyama, S.A., Merkes, C.M., Erickson, R.A., Amberg, J.J., and Gaikowski, M.P., 2018, Assessment of carbon dioxide piscicide treatments: North American Journal of Fisheries Management, v. 38, no. 6, p. 1241–1250, accessed March 9, 2020, at https://doi.org/10.1002/nafm.10227.
Fredricks, K.T., Tix, J.A., Smerud, J.R., and Cupp, A.R., 2020, Laboratory trials to evaluate carbon dioxide as a potential behavioral control method for invasive red swamp (Procambarus clarkii) and rusty crayfish (Faxonius rusticus): Management of Biological Invasions: International Journal of Applied Research on Biological Invasions, v. 11, no. 2, p. 259–278, accessed March 9, 2020 at https://doi.org/10.3391/mbi.2020.11.2.06.
Hein, C.L., Roth, B.M., Ives, A.R., and Zanden, M.J.V., 2006, Fish predation and trapping for rusty crayfish (Orconectes rusticus) control—A whole-lake experiment: Canadian Journal of Fisheries and Aquatic Sciences, v. 63, no. 2, p. 383–393, accessed March 9, 2020, at https://doi.org/10.1139/f05-229.
Lodge, D.M., Deines, A., Gherardi, F., Yeo, D.C.J., Arcella, T., Baldridge, A.K., Barnes, M.A., Chadderton, W.L., Feder, J.L., Gantz, C.A., Howard, G.W., Jerde, C.L., Peters, B.W., Peters, J.A., Sargent, L.W., Turner, C.R., Wittmann, M.E., and Zeng, Y., 2012, Global introductions of crayfishes—Evaluating the impact of species invasions on ecosystem services: Annual Review of Ecology, Evolution, and Systematics, v. 43, p. 449–472, accessed March 9, 2020, at https://doi.org/10.1146/annurev-ecolsys-111511-103919.
Nagy, R., Fusaro, A., Conard, W., and Morningstar, C., 2020, Procambarus clarkii (Girard, 1852): U.S. Geological Survey Nonindigenous Aquatic Species database, accessed March 9, 2020, at https://nas.er.usgs.gov/queries/factsheet.aspx?SpeciesID=217.
National Institute for Occupational Safety and Health [NIOSH], 2019, Carbon dioxide, in NIOSH pocket guide to chemical hazards: Centers for Disease Control and Prevention database, accessed March 9, 2020, at https://www.cdc.gov/niosh/npg/default.html. [Carbon dioxide information directly accessible at https://www.cdc.gov/niosh/npg/npgd0103.html.]
Oficialdegui, F.J., Clavero, M., Sánchez, M.I., Green, A.J., Boyero, L., Michot, T.C., Klose, K., Kawai, T., and Lejeusne, C., 2019, Unravelling the global invasion routes of a worldwide invader, the red swamp crayfish (Procambarus clarkii): Freshwater Biology, v. 64, no. 8, p. 1382–1400, accessed March 9, 2020, at https://doi.org/10.1111/fwb.13312.
Smerud, J.R., Tix, J.A., Rivera, J.M., Johnson, T.A., and Cupp, A.R., 2022, Water quality and atmospheric carbon dioxide data for field application of carbon dioxide during summer 2018 as a behavioral control method for invasive red swamp crayfish (Procambarus clarkii) in southeastern Michigan water retention ponds: U.S. Geological Survey data release, https://doi.org/10.5066/P99OUHMV.
Smith, K., Nathan, L., Page, T., and Budnick, W., 2021, Field guide to Michigan crayfish (2d ed.): Department of Fisheries and Wildlife, Michigan State University, 32 p., accessed October 3, 2022, at https://www.michigan.gov/invasives/-/media/Project/Websites/dnr/Documents/Education/NatureHome/Michigan_Crayfish_Guide.pdf?rev=5fbda83cab2e42beb2195e4 251a63d0e&hash=EFA722AB4944BCCB53C0D18FA455563E.
Souty-Grosset, C., Anastácio, P.M., Aquiloni, L., Banha, F., Choquer, J., Chucholl, C., and Tricarico, E., 2016, The red swamp crayfish Procambarus clarkii in Europe—Impacts on aquatic ecosystems and human well-being: Limnologica, v. 58, p. 78–93, accessed March 9, 2020, at https://doi.org/10.1016/j.limno.2016.03.003.
Zolper, T.J., Cupp, A.R., and Smith, D.L., 2019, Investigating the mixing efficiencies of liquid-to-liquid chemical injection manifolds for aquatic invasive species management: Journal of Fluids Engineering, v. 141, no. 3, 14 p., accessed March 9, 2020, at https://doi.org/10.1115/1.4041361.
Conversion Factors
International System of Units to U.S. customary units
Temperature in degrees Celsius (°C) may be converted to degrees Fahrenheit (°F) as follows: °F=(1.8×°C)+32.
Datum
Vertical coordinate information is referenced to the North American Vertical Datum of 1988 (NAVD 88).
Horizontal coordinate information is referenced to the North American Datum of 1983 (NAD 83).
Supplemental Information
Concentrations of chemical constituents in water are given in milligrams per liter (mg/L).
Abbreviations
C1
control pond 1
C2
control pond 2
CaCO3
calcium carbonate
CO2
carbon dioxide
CPUE
catch per unit effort
GMT
Greenwich Mean Time
I.D.
inner diameter
MIDNR
Michigan Department of Natural Resources
MSU
Michigan State University
NH3-N
ammonia nitrogen
NIOSH
National Institute for Occupational Safety and Health
ppm
part per million
RSC
red swamp crayfish
TP
treatment pond
USD
U.S. dollar
USD/kg
U.S. dollar per kilogram
Disclaimers
Any use of trade, firm, or product names is for descriptive purposes only and does not imply endorsement by the U.S. Government.
Although this information product, for the most part, is in the public domain, it also may contain copyrighted materials as noted in the text. Permission to reproduce copyrighted items must be secured from the copyright owner.
Suggested Citation
Smerud, J., Rivera, J., Johnson, T., Tix, J., Fredricks, K., Barbour, M., Herbst, S., Thomas, S., Nathan, L., Roth, B., Smith, K., Allert, A., Stoeckel, J., and Cupp, A., 2022, Field application of carbon dioxide as a behavioral control method for invasive red swamp crayfish (Procambarus clarkii) in southeastern Michigan water retention ponds: U.S. Geological Survey Open-File Report 2022–1105, 12 p., https://doi.org/10.3133/ofr20221105.
ISSN: 2331-1258 (online)
Study Area
| Publication type | Report |
|---|---|
| Publication Subtype | USGS Numbered Series |
| Title | Field application of carbon dioxide as a behavioral control method for invasive red swamp crayfish (Procambarus clarkii) in southeastern Michigan water retention ponds |
| Series title | Open-File Report |
| Series number | 2022-1105 |
| DOI | 10.3133/ofr20221105 |
| Publication Date | December 13, 2022 |
| Year Published | 2022 |
| Language | English |
| Publisher | U.S. Geological Survey |
| Publisher location | Reston, VA |
| Contributing office(s) | Upper Midwest Environmental Sciences Center |
| Description | Report: vii, 12 p.; Data Release |
| Country | United States |
| State | Michigan |
| Online Only (Y/N) | Y |