

Sampling and Analysis Plan for the Koocanusa Reservoir and Upper Kootenai River, Montana, Water-Quality Monitoring Program, 2021
Links
- Document: Report (1.39 MB pdf) , HTML , XML
- Download citation as: RIS | Dublin Core
Acknowledgments
The authors sincerely thank all field personnel and science-support staff in the Wyoming–Montana Water Science Center who collect and quality assure water-quality and streamflow data. Rod R. Caldwell and Timothy Bartos provided colleague review.
Abstract
In 2021, the U.S. Geological Survey will collect water-quality samples and environmental data from 3 sites in Koocanusa Reservoir and from 1 site in the Kootenai River. The transboundary Koocanusa Reservoir is in southeastern British Columbia, Canada, and northwestern Montana, United States, and was formed with the construction of Libby Dam on the Kootenai River 26 kilometers upstream from Libby, Montana. Two of the reservoir sites and the Kootenai River site, in the Libby Dam tailwater (the outflow of the reservoir flow into the Kootenai River), are equipped with automated, high-frequency ServoSipper water samplers. At the two reservoir sites, these samplers are mounted to pontoon platforms and automatically collect samples from multiple depths; a ServoSipper sampler was deployed at one site in 2019, and another ServoSipper sampler will be deployed at a second site in 2021. Discrete water-quality samples will be collected monthly at two depths at the river site and at two of the reservoir sites. The goal of this project is to collect multidepth, high-frequency vertical and temporal water-quality samples and data to understand the limnological and biological processes that control variations and trends in selenium concentrations and loads throughout Koocanusa Reservoir and in the Libby Dam tailwater at the southern end of the reservoir. This sampling and analysis plan documents the organization, sampling and data-collection scheme and design, pre- and post-collection processes, and quality-assurance and quality-control procedures.
Introduction
Selenium in the 145-kilometer (km)-long transboundary Koocanusa Reservoir (also known as “Lake Koocanusa”) in southeastern British Columbia and northwestern Montana (fig. 1) has been detected at concentrations above State and Federal water-quality and aquatic life standards (Montana Department of Environmental Quality, 2020b). The reservoir is within the international Kootenai (spelled “Kootenay” in Canada) River watershed, which contains critical habitat for native fish species. Site-specific selenium standards for surface water (the dissolved fraction) and fish tissue were established for the reservoir in 2020 (Montana Department of Environmental Quality, 2020a). The standards were adopted into Montana State law in 2020 and approved by the Environmental Protection Agency (EPA) in 2021. To inform the development of these site-specific selenium standards, the U.S. Geological Survey (USGS) began a water-quality monitoring program in 2019 to understand spatial and temporal limnological and biological processes that control variations in selenium concentrations and loads throughout Koocanusa Reservoir and the Libby Dam tailwater. Two additional program goals were to understand the implications of long-term changes to water quality and the potential effects of selenium contamination on the ecological integrity of Koocanusa Reservoir and the Libby Dam tailwater. The water-quality monitoring program continued in 2020 and 2021.
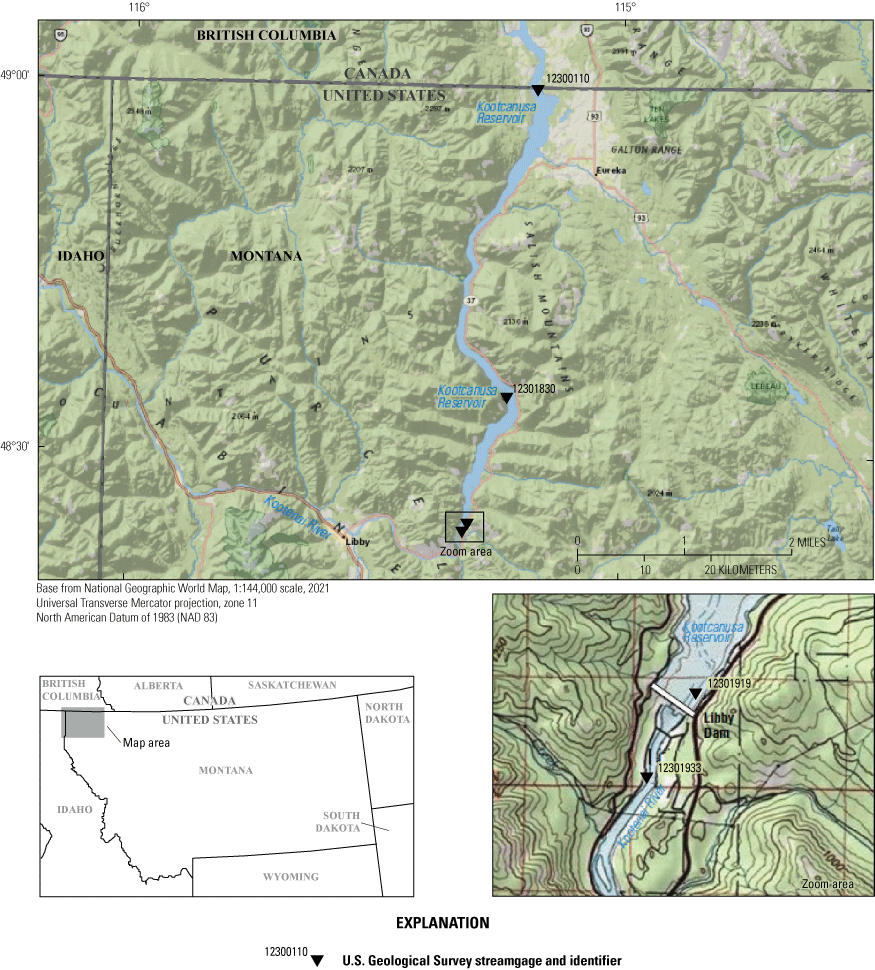
Kootenai River watershed, including the Koocanusa Reservoir and major tributaries.
Purpose and Scope
The purpose of this report is to describe the sampling and analysis plan (SAP) of the USGS WY–MT WSC Koocanusa/Kootenai long-term water-quality monitoring program. This SAP follows the policies and procedures of the USGS, specifically, the USGS “National Field Manual for the Collection of Water-Quality Data” (NFM) (U.S. Geological Survey, variously dated) and Guidelines and Standard Procedures for Continuous Water-Quality Monitors—Station Operation, Record Computation, and Data Reporting (Wagner and others, 2006). Deviations from standard USGS procedures or where no standard procedures are available are detailed in this SAP. This report includes the logistics, sampling and data-collection scheme and design, post-collection processes, and quality-assurance procedures. The requirements for data management and review and procedures to ensure health and safety are also provided.
Study Area
Koocanusa Reservoir was created by the construction of Libby Dam in 1972, 26 km upstream from the town of Libby, Mont., and impounds water from about 23,271 square kilometers (km2), or 47 percent, of the Kootenai River drainage basin (Woods, 1982). Three Canadian rivers (Kootenai, Elk, and Bull Rivers) supply 87 percent of the inflow to Koocanusa Reservoir (Bonde and Bush, 1975). The reservoir has a volume of 7.16 cubic kilometers (km3), and it reaches 77 km from Libby Dam in Montana to the Canada–U.S. border and 68 km farther into British Columbia (Easthouse, 2018). Koocanusa Reservoir has a mean depth of 38 meters (m), a maximum depth of 106 m at the Libby Dam forebay, and a mean water residence time of about 9 months (Easthouse, 2013). Normal full pool and minimum regulated reservoir elevations are 750 and 697 m, respectively (Easthouse, 2013). Downstream of the reservoir, below Libby Dam, the Kootenai River experiences reduced flows for most of the year, with peak outflows of up to 750 cubic meters per second in late May through June and again in December (Easthouse, 2018).
Background
Selenium in Koocanusa Reservoir has been detected at concentrations above State and Federal water-quality and aquatic life standards (Montana Department of Environmental Quality, 2020b). Selenium is a required micronutrient for most organisms but elevated concentrations in water bioaccumulate in egg-laying fish and birds, causing various sublethal effects and death. Increased nitrate loads to the reservoir also are of concern because of the potential effects on phytoplankton and zooplankton community composition and alteration of the reservoir’s trophic status resulting from high nitrogen: phosphorus ratios (Elser and others, 2000). One source of selenium and nitrate in the Kootenai River Basin is the excavation of bedrock in the Elk Valley to access coal seams for metallurgical steelmaking and coal production. There are currently five open-pit coal mines in this region of southeastern British Columbia, all operated by Teck Coal, a subsidiary of Teck Resources Ltd., with an annual production volume of approximately 21 million tons of metallurgical coal (Teck Resources Limited, 2020).
Since 1984, selenium concentrations in the Elk River measured at a British Columbia environmental monitoring station (site 0200016) (British Columbia Ministry of Forests Lands Natural Resource Operations and Rural Development, 2022) 2.2 miles above its discharge into Koocanusa Reservoir have ranged from below detection to greater than 8 micrograms per liter (µg/L). In 2012, the Montana Department of Environmental Quality (MTDEQ) listed Koocanusa Reservoir as threatened by selenium (reporting as required by section 305(b) of the United States Federal Clean Water Act [33 U.S.C. 1251 et seq.]). In April 2013, the British Columbia Minister of Environment issued a Ministerial Order (No. M113) under the Environmental Management Act (Province of British Columbia, 2013) to reduce water-quality effects of mining activities. Site-specific selenium standards of 0.8 µg/L for dissolved selenium in the water column and 15.1 milligrams per kilogram (mg/kg) dry weight for fish egg (ovary) tissue (in addition to the muscle and whole-body standards) were established for the reservoir in 2020 following collaborative work by the MTDEQ, the British Columbia Ministry of Environment and Climate Change Strategy, the Lake Koocanusa Monitoring and Research Working Group, and a Selenium Technical Subcommittee. The standards were adopted into Montana State law in 2020 and approved by the EPA in 2021.
Monitoring water quality (and fish populations) in Koocanusa Reservoir and the Kootenai River has been a collaborative effort since at least 1967, when the U.S. Army Corps of Engineers (USACE) and the USGS began collecting water samples (Easthouse, 2013) to better understand the relation between Libby Dam (completed in 1972) operations on the reservoir and downstream effects on the Kootenai River. Monitoring and research by these and other agencies have increased recently because of concerns that discharge from coal mining operations has led to increased selenium concentrations (Montana Department of Environmental Quality, 2020a), and there is now a need to better understand the biogeochemical dynamics and ecological impact of selenium in the basin (Presser and Naftz, 2020).
In 2019, the USGS began a water-quality monitoring program in Koocanusa Reservoir and the Kootenai River just below Libby Dam (hereafter referred to as the “Koocanusa/Kootenai water-quality monitoring program”) to provide high-frequency water-quality data for U.S. and Canadian Tribal, State, and Federal regulatory agencies. Specific objectives of this study were to (1) collect subdaily water-quality samples (reported as 30-day averages) from multiple depths; (2) collect continuous vertical profile data to understand limnological processes contributing to variations in selenium concentrations; and (3) establish a baseline dataset based on selenium concentrations throughout the reservoir.
Approach
Water-quality samples in the 2021 Koocanusa/Kootenai water-quality monitoring program will be collected to measure concentrations of selenium, nutrients, anions, organic carbon, and other constituents. The overall approach for sample and data collection will include the following components:
-
• A pontoon platform on Koocanusa Reservoir at the Libby Dam forebay (Lake Koocanusa at Forebay near Libby, Montana; USGS station 12301919; hereafter referred to as “site LIBF”; fig. 1 and table 1) and at the international boundary (Lake Koocanusa at International Boundary, Montana; USGS station 12300110; hereafter referred to as “site LIBB”, fig. 1 and table 1) to automatically collect vertical water-quality profile data and water-quality samples using a ServoSipper sampling system (see “Continuous ServoSipper Sampling Procedures” section). Subsamples will be collected automatically each day from multiple depths (table 2). Weekly samples will be composited from the daily subsamples and submitted for laboratory analyses.
-
• Manual collection of discrete water-quality samples from 2 depths at sites LIBF and LIBB (monthly) and at Tenmile Creek (Lake Koocanusa at Tenmile Creek near Libby, Montana; USGS station 12301830; hereafter referred to as “site LIBT”) (once) within Koocanusa Reservoir and as a depth-integrated sample in the Kootenai River below Libby Dam, Montana (USGS station 12301933; hereafter referred to as “site LIBW;” fig. 1).
-
• Technical review of the analytical results, evaluation of the quality-control data, and implementation of the data management plan (see section Data Management and Reporting).
-
• Distribution of approved data to the public using the USGS National Water Information System (NWIS; U.S. Geological Survey, 2023).
Table 1.
Sample and data-collection locations and equipment, U.S. Geological Survey Koocanusa/Kootenai water-quality monitoring program, 2021.[USGS, U.S. Geological Survey; ADCP, acoustic Doppler current profiler]
Table 2.
Types and frequencies of data collected in the U.S. Geological Survey Koocanusa/Kootenai water-quality monitoring program, 2021.[USGS, U.S. Geological Survey; ADCP, acoustic Doppler current profiler; m, meter]
Changes from 2020 Sampling Design
The 2021 SAP for the Koocanusa/Kootenai water-quality monitoring program differs from the 2020 sampling plan (unpublished) by the following modifications:
-
1. A second pontoon platform will be added in 2021 at the Libby Dam forebay (site LIBF) in the Koocanusa Reservoir using the same equipment and data-collection scheme as deployed at the international boundary site (LIBB). This site will be visited monthly for servicing and discrete sampling.
-
2. Sampling at pontoon platforms sites (LIBB and LIBF) will be changed from collecting daily samples (in 2019 and 2020) to collecting weekly composite samples of the daily subsamples in 2021.
-
3. Discrete samples will be collected from LIBB, LIBF, and LIBT at two depths in 2021: 3 m below the reservoir surface and 3 m above the reservoir bottom. In 2020, discrete samples were collected at four depths.
-
4. Total selenium will be added to the analyses of samples collected at the pontoon platforms, sites LIBB, LIBF, and LIBW, in 2021.
-
5. Selenium speciation, total and dissolved trace metals (including selenium), nutrients, total organic carbon, dissolved organic carbon, and major ions will be added to the discrete sample analyses in 2021.
-
6. Synoptic sampling will not be done in 2021. In 2020, synoptic sampling was done in September at six sites from above the Elk River in Canada where it enters the Kootenai River (about a quarter of a mile upstream) and downstream to the Kootenai River below Libby Dam near Libby, Montana.
Organization and Responsibilities
The USGS WY–MT WSC personnel will collect water-quality samples, data, and related information for the Koocanusa/Kootenai water-quality monitoring program, 2021. Specific responsibilities of key personnel are listed in table 3. The project and field leads are responsible for ensuring that personnel who perform sample collection have appropriate training and are cognizant of on-site safety considerations. All samples will be shipped to two laboratories for chemical analyses: the USGS National Water Quality Laboratory (NWQL; Denver, Colorado) and the Brooks Applied Laboratory (Bothell, Washington). The Brooks Applied Laboratory will be used primarily to analyze samples for selenium concentration (total and dissolved) and selenium speciation. All other samples will be analyzed at the NWQL (tables 4 and 5).
The address and contacts for laboratories are:U.S. Geological Survey, National Water Quality LaboratoryP.O. Box 25585Denver, Colorado 80225-0585(303) 236-3500Jeff McCoy, Chief Supervisory ChemistBrooks Applied Laboratory18804 North Creek Parkway, Suite 100Bothell, Washington 98011(206) 632–6206Amanda Royal, Laboratory Project Manager
Table 3.
Personnel in the U.S. Geological Survey Koocanusa/Kootenai water-quality monitoring program, 2021.Sampling and Analysis Plan
Sampling procedures in the Koocanusa/Kootenai water-quality monitoring program are based on methods and requirements described in the NFM (U.S. Geological Survey, variously dated). Continuous environmental data will be recorded, processed, and reported as described in the USGS publication, “Guidelines and Standard Procedures for Continuous Water-Quality Monitors—Station Operation, Record Computation, and Data Reporting” (Wagner and others, 2006). Deviations from standard USGS procedures or where no standard procedures are available are described in the following report sections. Water-quality sampling procedures are regularly overseen by the WY–MT WSC Water-Quality Specialist to ensure field protocols are followed. Field methods are independently reviewed once every 3 years during the WY–MT WSC’s Internal Technical Review process.
Sampling Locations and Frequencies
The sites, frequencies, data types, and equipment used for data and sample collection in the Koocanusa/Kootenai water-quality monitoring program are described in tables 1 and 2. The abbreviated identifiers for USGS stations are based on, but are different from, the abbreviated site identifiers used by the U.S. Army Corps of Engineers (Easthouse, 2018). Two of the four sampling locations listed in table 1 are on pontoon platforms with automated ServoSipper samplers, novel automated water samplers that use a peristaltic pump and a series of valves to collect water samples, and continuous vertical profilers (LIBB and LIBF; fig. 1 and table 1). One site without a pontoon platform will be sampled once in 2021 (LIBT), and one site in the Kootenai River includes a streamgage, a stationary sonde, and a ServoSipper (LIBW). Station LIBB is also equipped with an acoustic Doppler current profiler (ADCP) to measure water-current velocities over a depth range using the Doppler effect of sound waves scattered back from particles within the water column (Côté and others, 2011). Stations LIBB and LIBF transmit vertical profile data remotely in near real time, and station LIBB also transmits ADCP data in near real time.
Sampling and Data Collection from Pontoon Platforms
Pontoon platforms (figs. 2 and 3) will be deployed at sites LIBB and LIBF (fig. 1) to provide continuous monitoring of total and dissolved selenium concentrations (table 4) and vertical profile data. The platform at LIBB will be moored 0.75 mile south of the Canadian border and accessed by boat. The platform at LIBF will be deployed in the Libby Dam forebay. A ServoSipper sampling system developed by Thomas Chapin (USGS, Denver, Colo.) will be mounted to the pontoon platforms.
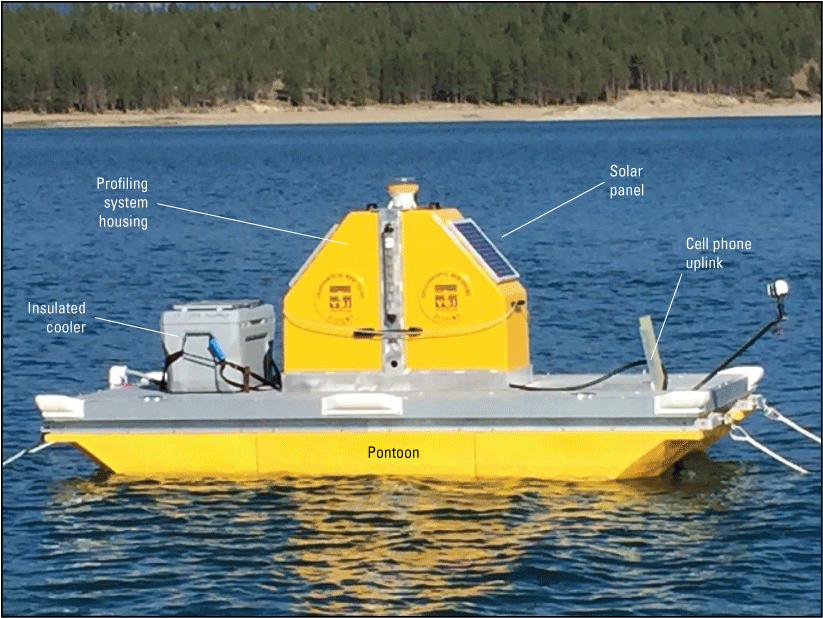
Koocanusa Reservoir pontoon platform used to collect water samples. Photograph by Thomas Chapin, U.S. Geological Survey.
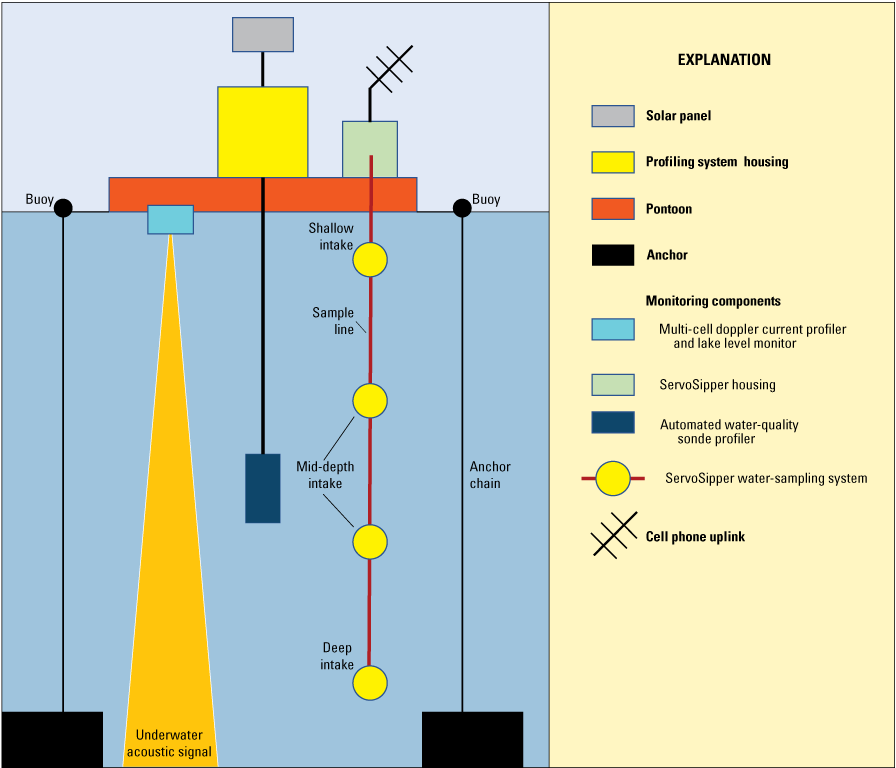
Koocanusa Reservoir pontoon platform. Monitoring components include the ServoSipper water-sampling system (yellow circles; sample collection points), acoustic Doppler current profiler (light blue), and the automated water-quality sonde profiler (dark blue rectangle).
Table 4.
List of analytes, collection, and preservation methods, and hold times for continuous ServoSipper samples collected in the U.S. Geological Survey Koocanusa/Kootenai water-quality monitoring program, 2021.[CASRN, Chemical Abstracts Services Registry Numbers (a registered trademark of the American Chemical Society); USGS, U.S. Geological Survey; BAL, Brooks Applied Laboratory; mL, milliliter; µm, micrometer; <, less than]
Continuous Vertical Profile Sensors at Reservoir Pontoon Platforms
Continuous (subdaily) vertical profiles of turbidity, dissolved oxygen concentration and percent saturation, pH, specific conductance, water temperature, and chlorophyll a fluorescence will be recorded using water-quality sensors on a YSI model EXO2 sonde (YSI, Inc., Yellow Springs, Ohio) mounted to the pontoon platforms. The sondes will connect to a data logger/control system connected to an electric winch that lowers the sondes to the appropriate measurement depth (fig. 3; table 3). Four to 12 vertical profiles will be completed per day with data recorded at every 1 m. The profiling equipment will be serviced monthly, and the continuous records will be processed according to established USGS protocols (Wagner and others, 2006). Sondes will be deployed in April and retrieved in November (depending on weather conditions). Site LIBB will also be equipped with an Aanderaa ADCP (Aanderaa Data Instruments AS, Norway). The ADCP will collect velocity profiles every 15 minutes at 1-m depth intervals (table 2).
Continuous ServoSipper Sampling at Pontoon Platforms
Each pontoon platform will be equipped with a ServoSipper sampling system. ServoSipper samples will be collected at the depths and frequencies listed in table 2 and analyzed for total and dissolved selenium (table 4). The ServoSipper pump and valve system automatically collects 8 samples per depth—4 filtered and 4 unfiltered–in 50-milliliter (mL) plastic centrifuge tubes that are pre-loaded with small boluses (small, single dose) of 7.5 Normal Ultrex nitric acid for sample preservation. The ServoSipper system and power package are secured to the pontoon platform and placed inside an insulated cooler for protection against freezing and wave splash (fig. 2). A solar panel is mounted on the top of the cooler to recharge the battery power source. Semi-rigid silicone pump tubing is deployed through the bottom of the platform. The silicone tubing size for the pinch valves is 1/16-inch internal diameter and 1/8-inch outer diameter, 1/8-inch internal diameter and 1/4-inch outer diameter for some of the transfer lines, and the long intake lines to the specific sample depths consist of Kynar tubing that is 1/8-inch internal diameter and 3/16-inch outer diameter. The pump tubing is contained inside of a weighted, 2.5-centimeter (cm) diameter polyvinyl chloride (PVC) conduit attached to the side of the monitoring platform. Multiple sample access ports are pre-drilled into the conduit and screened with nylon mesh to allow for different sample depths during changes in reservoir stage or monitoring needs. These sites will be visited at least monthly for sample retrieval and equipment maintenance. The ServoSippers will be deployed in April and retrieved in November (depending on weather conditions).
Discrete Sampling at Pontoon Platforms
Discrete water-quality samples will also be collected monthly at pontoon platform sites, LIBB and LIBF, and at site LIBT, from April through October or November (depending on weather; tables 2 and 5). Samples will be collected, filtered, and preserved according to procedures described by Ward and Harr (1990), Horowitz and others (1994), and the USGS NFM (U.S. Geological Survey, variously dated) and analyzed for the constituents listed in table 5 and appendix 1. Water samples will be collected with a Kemmerer sampler, a weighted-bottle sampler that consists of a plastic tube with end caps that close by means of a messenger to entrap the water sample inside. Samples will be collected from two depths: 3 m below the water surface and 3 m above the bottom. To minimize contamination of filtered samples, subsamples will be filtered directly from the Kemmerer sampler via a peristaltic pump that passes the water through silicone tubing and a filter connected directly to the Kemmerer sampler. Whole-water subsamples will be collected directly from the Kemmerer sampler. The water samples will not be mixed in a churn because there is minimal sediment present, and samples will be taken from a stationary water column. In instances of severe weather, samples will be processed immediately upon returning to the mobile laboratory vehicle.
Table 5.
List of analytes, collection and preservation methods, laboratory information, and hold times for discrete samples collected in the U.S. Geological Survey Koocanusa/Kootenai water-quality monitoring program, 2021.[CASRN, Chemical Abstracts Services Registry Numbers (a registered trademark of the American Chemical Society); USGS, U.S. Geological Survey; CaCO3, calcium carbonate; NWQL, USGS National Water Quality Laboratory; mL, milliliter; µm, micrometer; <, less than; N, normal; N, nitrogen; mm, millimeter; GF/F, glass fiber filter; BAL, Brooks Applied Laboratory; P, phosphorus]
Sampling and Data Collection in the Kootenai River, Site LIBW
A YSI model EXO2 water-quality sonde (YSI, Inc., Yellow Springs, Ohio) will be located at the streamgage house on the riverbank of the Kootenai River to measure turbidity, dissolved oxygen concentration and percent saturation, pH, specific conductance, water temperature, and chlorophyll a fluorescence. The sonde will be housed in a 30-foot-long section of 4-inch PVC pipe with a lockable cap. In the winter, heat tape will be applied down the pipe to free the sonde if it freezes at the water surface. A cable housed in ¾-inch diameter PVC conduit will run from the sonde to the data-collection platform (DCP). The sonde will record data every 15 minutes and will transmit data through the DCP hourly. The sonde will be deployed all year and serviced monthly (depending on weather), and the continuous records will be processed according to established USGS protocols (Wagner and others, 2006). Multidepth profile data will be collected twice per year from a cableway according to Wagner and others (2006). Continuous ServoSipper sampling at this site will be as described for pontoon platform sites LIBB and LIBF. The ServerSipper will be deployed all year, and this site will be visited monthly for sample retrieval and equipment maintenance (depending on weather conditions).
Discrete Sampling from Cableway
Discrete water-quality samples will be collected monthly all year (depending on weather) from site LIBW (table 2). This site is near the ServoSipper intake, and the location was determined by reviewing ADCP measurements from the cableway at various flows to determine the thalweg of the cross section, which is where the highest velocities occur. The site is well-mixed during dam releases as it is 0.6 mile downstream of the dam. There are no tributary inflows between Libby Dam and the sample site. Kootenai River samples will be collected from a cableway at a pre-determined, single horizontal point (one cable marked with red paint at about 44.2 m) at the thalweg of the river via a US D-96 depth-integrating suspended hand line sampler (Edwards and Glysson, 1999; Federal Interagency Sedimentation Project, 2015). This device uses a plastic or Teflon nozzle and a plastic bag as a sample container to collect flow-weighted samples in streams. Samples will be collected, processed, filtered, and preserved according to procedures described by Ward and Harr (1990), Horowitz and others (1994), and NFM (U.S. Geological Survey, variously dated) and analyzed for the constituents listed in table 5.
Sample Collection, Preservation, and Processing
This section describes the procedures for discrete and continuous water-quality sample collection, including sample trip and site visit preparation, documentation, sample tracking, and shipping to laboratories for analyses. Sample bottles and equipment will be cleaned at the WY–MT WSC water-quality laboratory in Helena, Mont., before taking them into the field and the Kemmerer sampler will be rinsed with native surface water between sampling sites. All samples will be collected following strict adherence to USGS guidelines for obtaining representative samples for a relevant description of the environment. This requires field personnel to (1) understand the study objectives, including data-quality requirements, in the context of the water system being sampled, (2) minimize artifacts of the sampling process, and (3) be aware of and document conditions that could compromise the quality of a sample (U.S. Geological Survey, 2006). In addition, field personnel will be expected to perform the following throughout the sampling process:
-
• Use prescribed “clean hands/dirty hands” techniques for parts-per-billion trace metal and other low-level sampling (U.S. Geological Survey, 2006).
-
• Wear appropriate disposable, powderless gloves.
-
• Change gloves before each new step during sample collection and processing and avoid hand contact with contaminating surfaces.
-
• Never contact water samples using gloved or ungloved hands.
-
• Use equipment constructed of materials that are inert with respect to the analytes of interest.
-
• Use only equipment that has been cleaned according to prescribed procedures.
-
• Field rinse equipment as directed.
-
• Follow a prescribed order for collecting samples.
Continuous ServoSipper Sampling Procedures
The ServoSipper sampler lines consist of 1/8-inch internal diameter silicone tubing with intakes set at the sampling depths listed in table 2. The sampler lines are protected inside conduit which hangs from the side of the pontoon platform (fig. 3). The end of the conduit is weighted to keep the lines taut. The protective conduit is perforated adjacent to the end of the sampler line (intake) and is covered by a polypropylene, 100-micrometer (µm) mesh filter sock through which sample water is pumped. Water samples will be pumped daily into either filtered (0.45-µm pore size, 25-millimeter [mm] diameter nylon filter) or unfiltered 50-mL sample vials containing 100 microliters (µL) of nitric acid and 100 µL of deionized water to preserve the samples. The 50-mL sample vials receive about 5–7 mL of sample water per day. After 7 days, 35–50 mL of subsample will be collected, and the ServoSipper will shift to a new set of sample vials and start the filling process again. Prior to each daily sample fill, the ServoSipper’s sample pump flushes lake water (at least 3 times the amount of water in each line) through the intake line. Each ServoSipper tray holds 8 vials which has enough capacity to store samples collected over 28 days (each vial includes a 7-day composite sample), and each tray stores samples retrieved from the predetermined depths. The sample trays are housed in a locked cooler to prevent tampering and contamination. A 12-volt battery charged by a 30-watt solar panel powers the pumps.
Samples will be retrieved, bottled, and labeled on the ServoSipper by two people using the following process:
-
1. Disconnect the intake and waste line and unplug the battery lead before removing the tray.
-
2. Using the PICAXE software (Revolution Education, Ltd., United Kingdom), download the sample log and convert it to an electronic spreadsheet. The log contains the time stamp, fill volume, and condition comments for each sample and whether the sample was retained. Samples that overfill, partially fill, or are potentially compromised are discarded.
-
3. Retrieve samples from one tray at a time.
-
4. Following the clean hands/dirty hands approach (U.S. Geological Survey, 2006), disconnect the sample vials, one at a time, from the ServoSipper tray and record the fill volume.
-
5. Pour the sample from the 50-mL sample vial into a 125-mL, acid-rinsed bottle and label the bottle with the station identification, date range, sample time, depth, and if the sample was filtered or unfiltered.
-
6. Once labeled, place these bottles in a clean bag and label the bag with the sample depth, site identification, and sample date. Place all samples on ice.
-
7. Prepare a tray for the next sampling trip by checking the voltage of and replacing (if needed) all batteries. Inspect all lines for leaks or crimps and replace old desiccant packets, if necessary.
-
8. Remove used filters and flush the manifold tubing (also called the “racetrack”) with deionized water for at least 30 seconds.
-
9. Add new filters and flush the line and filter with about 8–10 mL of deionized water.
-
10. Load new, cleaned (within the past 1 week) 50-mL vials containing preservative into the cleaned tray. Vials are cleaned with phosphate-free detergent, a dilute acid (5 percent hydrochloric acid [HCl]) solution, and double-distilled water.
-
11. Run at least one blank using appropriate analyte-free water for each tray using the tray to pump the blank water directly into the vial. Transfer the blank water into a bottle and label it.
-
12. Start a new program on the tray and replace it in the cooler. Reconnect all lines.
-
13. Check the ServoSipper before leaving the site to verify that the first-day samples have been filled and that everything is working properly.
Discrete Sampling Procedures
The following procedure will be used to collect discrete water samples from Koocanusa Reservoir.
Preparing for Sampling
Navigate to within 10 m of the site if no pontoon platform is present and secure the boat to prevent drifting. This distance may need to be increased on windy days in case the anchor drags. Upon arrival at each site, field personnel perform the following preparation steps:
-
1. Conduct a safety inspection of the site, including pontoon platforms, and vicinity as outlined in the Job Hazard Analysis (app. 2).
-
2. Prior to disturbing the site, describe and record the site and environmental conditions in field notes or field forms, as appropriate. This information must include the USGS site identifier, sampling date and time, on-site personnel, weather conditions, field observations, and an inventory of samples and sample types to be collected. Any unusual conditions must be noted.
-
3. Measure and record the site depth using a depth sounder. Use this depth to determine where to place the Kemmerer sampler during collection.
-
4. Use a recently calibrated water-quality data sonde to record instantaneous field measurements describing site conditions during sampling. Position the sonde as close as possible to the upper depth at which samples are collected. Record these values on the field notes or forms and repeat the measurements after sampling is complete.
-
5. Create a clean environment for sample collection, identify the “clean hands” and “dirty hands” personnel (U.S. Geological Survey, 2006), and unpack the sampling equipment while minimizing contamination. Record the time sampling begins.
-
6. Collect blank samples for quality control, as needed, at the first site sampled before collecting environmental samples. Blank samples are not field rinsed prior to collection. Alternatively, laboratory blank samples may be collected before going into the field.
-
7. All personnel apply fresh, clean nitrile gloves prior to sample collection.
Collecting Water-Quality Samples
Sampling equipment and bottles are field rinsed to condition, or equilibrate, the equipment to the sample environment and to help ensure that all cleaning-solution residues or blank water have been removed. Discrete water-quality samples are collected from two depths, 3 m below the water surface and 3 m above the bottom, with a Kemmerer sampler using the following procedure:
-
1. Field rinse the Kemmerer sampler 3 times with deionized water, and rinse again once with native site water with both ends open.
-
2. Using the clean hands/dirty hands approach, lower the Kemmerer sampler on a line to the desired depth and send the messenger to close both ends.
-
3. Collect whole-water (unfiltered) subsamples directly from the Kemmerer sampler using the sample containers, volumes, and preservatives listed in tables 4 and 5. Rinse sample bottles 3 times with native water, fill bottles to account for appropriate headspace, add preservative as needed, and immediately place on ice. Record lot numbers of all preservatives used in the field notes.
-
4. To minimize contamination from the environment, filter samples (dissolved constituents) in the field directly from the Kemmerer sampler via a peristaltic pump that passes the water through silicone tubing and a capsule filter connected directly to the Kemmerer sampler. Before attaching the silicone tubing, purge the tubing to remove residual water. Attach a new, conditioned (flushed with 1–3 L deionized water) capsule filter (0.45-µm pore size), record the lot number of the filter, and purge for an additional 10 seconds. Attach the tubing to the Kemmerer sampler, then remove the capsule filter from the threaded connection. Turn on the pump to allow the tubing to be field rinsed. Return the capsule filter and start the pump. Use filtered water to rinse the sample bottles three times before filling them. Use a new, conditioned filter for each primary sample. Purge the tubing and discard the filter when sampling is complete.
Sample Preservation
All collected samples will be placed into appropriate, labeled containers. Samples requiring preservation will be preserved immediately after sample collection, typically within an hour. Filtered chlorophyll a and selenium speciation samples will be frozen immediately with dry ice after collection. All other samples will be stored on wet ice until they are returned to the lab. Samples will be stored in the refrigerator and (or) freezer before shipping. Chlorophyll a and selenium speciation samples will be shipped on dry ice to prevent thawing. Chlorophyll a samples will be filtered the same day as collection and before they are shipped to the analyzing laboratory. These samples will be filtered using the following procedure:
-
1. Create a clean work surface and apply clean nitrile gloves.
-
2. Set up filtration apparatus consisting of a filtration catchment flask (any size) and filter holder (size to fit 47-mm diameter filter). With clean forceps, position a new glass fiber filter (GF/F, 0.7 µm pore size), grid side down, in the center of the plastic disk filter holder.
-
3. Mix the sample by gently inverting the sample bottle several times. Use a graduated cylinder to measure a volume appropriate to the relative amount of biomass in the sample. This is typically 750 mL. Record the total volume filtered.
-
4. Apply vacuum with a hand pump to pass the sample through the filter. Do not exceed a vacuum of 20 cm mercury.
-
5. When filtering is complete, rinse the graduated cylinder with deionized water, pass this water through the filter, then rinse the walls of the catchment flask and pass this water through the filter.
-
6. When all rinse water has passed through the filter, carefully release the vacuum and un-screw the catchment flask.
-
7. Using clean forceps, carefully fold one side of the filter over the other with sample contents facing the inside. Do not touch the filtered material.
-
8. Place the filter in a small petri dish labeled with the site ID, date, and sampled volume, wrap the dish in labeled foil, and immediately freeze.
-
9. Clean the filtration apparatus and equipment with deionized water before filtering subsequent samples.
Processing Water Samples
Preserved water-quality samples will be shipped overnight and with proper preservation to the corresponding laboratory within appropriate corresponding hold times (table 5). Data will be received electronically, reviewed by the project and data leads, and uploaded to NWIS (U.S. Geological Survey, 2023). Quality-control data will be reviewed as received. If needed, rerun or follow-up analyses will be requested from the corresponding laboratory.
Sample Documentation and Chain of Custody
Data collected in the Koocanusa/Kootenai water-quality monitoring program must be legally defensible, so the transfer of samples and sampling data will be strictly controlled. Standard chain-of-custody (CoC) procedures, when required, will be followed for field documentation, sample labeling, packaging, and shipping of all samples. This section summarizes the procedures used in this study, which closely follow those outlined in the chain-of-custody and documentation section of a USGS report, “U.S. Geological Survey Protocol for Sample Collection in Response to Deepwater Horizon Oil Spill, Gulf of Mexico, 2010” (Wilde and Skrobialowski, 2011).
Site Files and Field Notes
Site files containing descriptive information on location, conditions, purpose, and ancillary information will be kept for each data-collection site (Schroder and Shampine, 1992). Much of this information will also be stored electronically. A station description will be prepared for each water-quality station where continuous data will be recorded. The mandatory site information includes the following: agency code, site identifier, project number, station name, latitude, longitude, latitude-longitude accuracy, horizontal datum, Water Science Center code, State code, county code, land net location, location map, map scale, altitude, method of altitude measurement, accuracy of altitude, vertical datum, hydrologic unit code, topographic setting, agency use of site, date inventoried, station type, data type, data reliability code, site type, and use of site.
The following information will be recorded by field personnel during each site visit: Sampling date and names of all personnel on site, time of sample collection, measurement, or observation, USGS site identifier, weather and flow conditions, calibration checks for field instruments, field measurements, number and type of samples collected, and any modifications of established sampling procedures. In addition, field personnel will record all CoC information for samples, including notes regarding the courier, tracking information, and laboratory to which samples were being transferred. All information will be recorded electronically.
Sample Labeling
All samples will be collected and stored in the required container type (tables 4 and 5) and clearly labeled. Labels may be preprinted or hand-written in the field with a permanent, waterproof marking pen using a waterproof label (for example, Avery Weatherproof Laser Address Labels, product 5520) securely attached to the sample container. When preprinted labels are used, field personnel will ensure that the label and the information on it remain intact and legible throughout the processing and shipping process.
Further guidance on sample processing and container types can be found in chapter 5 of the USGS NFM (U.S. Geological Survey, 2002). Each sample label and the analytical service request (ASR) forms that accompany the samples will show the following:
Sample Tracking
A record of all samples collected and shipped to analyzing laboratories will be maintained to ensure the complete and timely receipt of analytical results and accurate transfer of data to NWIS. Technical personnel will be responsible for recording the required information. The project lead or designated technical personnel will review the tracking log to determine if analyses are missing and for taking corrective action(s) if necessary. A catalog or listing of samples and schedules that are collected for the project will be maintained in an electronic spreadsheet.
Sample Custody
All samples collected in the Koocanusa/Kootenai water-quality monitoring program will be documented according to the procedures outlined in NWQL Standard Operating Procedure QUAX0030.4 (U.S. Geological Survey, 2011). To maintain a clear record of sample custody from collection through sample analysis and to inform the laboratory of the analysis being requested for each sample, samples shipped to Brooks Applied Laboratory will include both CoC and ASR forms. Samples shipped to NWQL will include ASR forms, but they will not include CoC forms because they are not required with NWQL’s routine level of security. The NWQL, located on the Denver Federal Center campus, is a restricted access facility that uses a proximity card system for employee entry and requires all employees and visitors to pass through guarded gates. Samples received at the NWQL are promptly logged, checked for proper preservation (if required), and placed in storage areas appropriate for each sample type to await analysis. No further security procedures are involved. Samples are disposed of after normal holding times using routine disposal procedures. CoC (if required) and ASR forms will be sealed in plastic bags inside the shipping container.
Samples will be properly packaged and sent for analysis as a batch shipment, when feasible. Three copies of each CoC and (or) ASR form will be completed for each sample. Two copies will accompany each shipment, and 1 copy will be saved for project records. CoC forms, when required, will be signed and dated by a member of the field team with the date and time of sample transfer. If samples are transferred to the laboratory by courier, tracking numbers will be recorded on all forms during shipping. Upon receipt of the samples, the laboratory receiver will complete the transfer by signing and dating the CoC form. One copy will be left at the laboratory and another copy will be returned to USGS project personnel.
Sample Packaging
All samples will be collected in the containers specified in tables 4 and 5. Following collection, sample bottle caps will be checked to ensure tight, secure seals. Glass containers will be wrapped in foam sleeves, bubble packs, or in foam boxes designed for shipping glass containers to prevent breakage during shipping. Chilled samples will be packed with sufficient ice to keep the temperature at or below 4 degrees Celsius (°C). The volume of ice should be equal to or greater than the volume occupied by the samples. Twice the volume of ice will be used during warm months. “Blue-ice” or other types of commercially available re-freezable ices will not be used because samples could become contaminated or may not maintain an adequate temperature. Chlorophyll a and selenium speciation samples will be shipped with dry ice to keep the contents of the shipping containers frozen. These samples will be placed in separate shipping containers. Because of overpressure from carbon dioxide, these shipping containers will be ventilated. When shipping dry ice, guidelines provided by the shipping service being used will be strictly followed.
Sample containers will be sealed in two plastic, sealable bags (double bagged). Prior to shipping, each sample will be compared to entries on the CoC and ASR forms to ensure bottles and CoC entries match. If ice is required for sample preservation, samples will be packaged in thermally insulated, rigid coolers with ice; samples shipped with dry ice will be placed in Styrofoam coolers to facilitate ventilation. Each package of samples will be sealed with appropriate shipping tape and shipped by the most expedient means possible. The temperature of each cooler shipped to NWQL will be measured during sample login and documented in the Laboratory Information Management System. Samples will also be checked for proper preservation upon receipt. Samples or coolers that arrive at NWQL above the minimum temperature requirement may still be processed and flagged accordingly. The resulting data are reviewed and either maintained (with the appropriate remark code in NWIS) or rejected and not reported.
Coolers will be inspected before packing samples to ensure that coolers are in acceptable condition: coolers with missing handles, loose fitting lids, and cracks are not used. Shipping containers will be lined with two (one bag inside of the other) heavyweight plastic bags. To isolate the samples from ice melt, samples will be placed in heavy, sealable bags. Bagged sample containers and ice, if required, will be placed inside the plastic bags, and the bags will be sealed with a knot, filament tape, or twist ties. Shipping containers will be securely taped around the outside to prevent leaking and to maintain sample integrity. Coolers with spigots will be sealed with silicone or epoxy to prevent leakage.
Quality Assurance and Quality Control
The quality-assurance (QA) and quality-control (QC) procedures used in the USGS Koocanusa/Kootenai water-quality monitoring program ensure the usability and reliability of all data. Key components of the QA/QC plan for this work include, but are not limited to, following standard procedures for decontaminating field equipment; maintaining, calibrating, and operating field equipment and instrumentation in accordance with manufacturer’s instructions; following standard operating procedures outlined in the USGS NFM (U.S. Geological Survey, variously dated); using standard field forms; using skilled personnel for sampling; and adhering to this SAP. The QC samples described in this section ensure that data collected in the field, analyzed by the laboratory, and entered into NWIS will be of known and appropriate quality to meet the objectives of the study.
USGS Quality-Assurance Program
To address quality-control issues that are related to water-quality activities, the USGS Water Mission Area has implemented policies and procedures designed to ensure that all scientific work by or for the Water Mission Area is consistent and of documented quality. One tool used to ensure compliance is the technical review of water activities in USGS water science centers. These reviews are conducted by multidiscipline teams and are scheduled onsite at usually 3-year intervals. The reviews include, but are not limited to, the following activities:
-
• Observing field methods, equipment and field installations, vehicles, laboratories, and warehouses for adequacy, safety, and compliance with policies and guidelines
-
• Reviewing data records and analytes, technical files, and documentation such as flood plans and model archives
-
• Reviewing quality-assurance plans and procedures that cover program planning, field measurements, sample collection, laboratory analyses, data interpretation, and report preparation and publication
-
• Reviewing quality-control procedures for activities involving field measurements, sample collection, laboratory analyses, and data interpretation
-
• Reporting the review findings to the science centers at the conclusion of each review, including major comments and recommendations resulting from the review.
In addition, the USGS Quality Systems Branch (QSB; https://www.usgs.gov/mission-areas/water-resources/science/quality-systems-branch-qsb) produces water and sediment performance-assessment samples and data to provide the USGS laboratory users, USGS laboratories, and field personnel with quantitative performance information to assess data quality. Specific QA programs within the QSB include the Inorganic Blind Sample Project (https://qsb.usgs.gov/ibsp/), the Organic Blind Sample Project (https://qsb.usgs.gov/obsp/), the Laboratory Evaluation Project, (https://qsb.usgs.gov/lep/), the National Field Quality Assurance (NFQA) Project (https://qsb.usgs.gov/nfqa/), and the Standard Reference Sample Project (https://qsb.usgs.gov/srs/), among others.
The USGS NWQL is accredited by the National Environmental Laboratory Accreditation Conference (NELAC) Institute (https://www.nelac-institute.org/), actively participates in the NELAC Institute National Environmental Laboratory Accreditation Program (NELAP) and participates in the proficiency testing program specified by the NELAC Institute (NELAC is not an acronym; it is a contrived word). NWQL also operates under the quality management system (QMS) required of all USGS laboratories. The QMS defines the policies, procedures, and documentation that ensure the laboratory continually meets a defined standard of quality that is designed to provide customers with legally defensible data of known and documented quality and, where applicable, demonstrates regulatory compliance. The QMS establishes the standard under which all laboratory operations are performed, including the laboratory’s organization, objectives, and operating philosophy. The QMS has been prepared to assure that the laboratory operates a quality system in compliance with the 2003 NELAC standard.
Additionally, all field personnel in the USGS Koocanusa/Kootenai water-quality monitoring program participate in the USGS NFQA program. For quality assurance and consistency among instruments and users, the NFQA program was created in 1979. The program monitors the proficiency of alkalinity, pH, and specific conductance measurements determined by USGS water-quality field analysts. Field personnel and water-quality analysts are sent proficiency samples of pH, specific conductance, and alkalinity (added in 1984) annually. Participants who receive an unsatisfactory performance rating are given a second round of samples (Stanley and others, 1992). Results of the NFQA Program are reviewed by the Water Science Center Director and the Water Science Center Water-Quality Specialist. If unsatisfactory performance persists, additional training and testing are provided to achieve satisfactory performance or staff are reassigned.
Field Quality Control
The QC samples are collected to determine the acceptability of performance in the data-collection process and to provide a basis for evaluating the adequacy of procedures that were used to obtain data. The QA plan for this project follows that of the QA Plan for Water-Quality Activities for the WY–MT WSC. The QC samples will be collected along with all primary environmental samples following USGS protocols described in chapter A4 of the NFM (U.S. Geological Survey, variously dated). Between 10 to 20 percent (or more) of all samples analyzed will consist of QC samples (table 6; app. 3). Field blank samples will consist of American Chemical Society reagent-grade inorganic blank water (IBW), or pesticide-grade organic blank water (for organic carbon analysis) processed through clean sampling equipment prior to collecting environmental samples.
Table 6.
Types of quality-control (QC) samples collected in the U.S. Geological Survey Koocanusa/Kootenai water-quality monitoring program, 2021.[QC, quality control; IBW, inorganic-grade blank water]
Equipment Calibration, Maintenance, and Documentation
Equipment will be calibrated and maintained as described in the USGS NFM (U.S. Geological Survey, variously dated), Wagner and others (2006), and in the relevant manufacturer’s instructions, primarily the EXO User Manual (YSI, Inc., Yellow Springs, Ohio). Instruments that are not left in the field for unattended deployments will be calibrated and checked the same day they are used in the field. Instruments left in the field for unattended operation will be calibrated just prior to deployment and checked against a recently calibrated instrument following the criteria in table 7. Monthly service visits for unattended instruments will also be conducted during routine site or service visits. During these monthly visits, vertical profiles of turbidity, dissolved oxygen concentration and percent saturation, pH, specific conductance, water temperature, and chlorophyll a fluorescence will be recorded with a recently calibrated sonde (the “reference” sonde) brought into the field to check the performance of the deployed platform sonde (the “site” sonde). Care will be given to ensure that reference and site sonde profiles are done close together in time. The reference and site sondes also will be placed side-by-side in the same river or reservoir water to compare readings. These comparisons are used to apply corrections to the data based on calibration drift and (or) fouling of the sensors as described in Wagner and others (2006). The site sondes will be cleaned, re-calibrated, if needed (table 7), and re-deployed.
Table 7.
Water-quality property stabilization criteria and calibration guidelines used for sensor data collection in the U.S. Geological Survey Koocanusa/Kootenai water-quality monitoring program. Criteria are based on the recommendations provided in Wagner and others (2006).[±, plus or minus; µS/cm at 25 °C, microsiemens per centimeter at 25 degrees Celsius; mg/L, milligram per liter; NTU, Nephelometric Turbidity Unit]
Documentation of sonde calibrations and calibration checks are critical for ensuring accuracy of the data. All sensor values will be recorded before and after each calibration so that the data can be adjusted proportionately to the amount of drift (Wagner and others, 2006). Sensors will not be calibrated if they fall within the criteria listed in table 7. In addition to calibration information, the date, personnel initials, and maintenance activities (for example, battery or probe replacement, cleaning, or wiper repair/replacement) will be documented. Maintenance records of field equipment, including the manufacturer, make, model, and serial or property number will be maintained.
Decontamination
All water-sampling equipment used in the USGS Koocanusa/Kootenai water-quality monitoring program is cleaned (decontaminated) to the extent required for low-level chemical analyses before sample collection (U.S. Geological Survey, 2004). Equipment will be decontaminated to ensure that the equipment is not a source of contaminants that could affect the ambient concentrations of target analytes. Additionally, the proper removal of contaminants from equipment minimizes the likelihood of sample cross-contamination and reduces or eliminates the transfer of contaminants to clean areas. A description of samples collected as part of quality control of the cleaning procedures is included in the “Field Quality Control” section of this report.
Equipment cleaning procedures vary depending on the types of water samples collected and the sensitivities of the analyses. Collection equipment and re-used sample bottles will be thoroughly decontaminated with phosphate-free detergent, a dilute acid (5 percent HCl) solution, and double-distilled water before taking them into the field. Between site visits, equipment will be rinsed at least three times with native water or deionized water before sampling. The sequence for equipment cleaning prior to sample collection for inorganic and (or) organic analytes is as follows:
-
1. Inspect equipment for stains, cuts, or abrasions. Replace parts as needed.
-
2. Wear appropriate disposable, powderless gloves.
-
3. Rinse equipment with deionized water directly after use while equipment is still wet, then use cleaning procedures. Do not allow collection and processing equipment to sit uncleaned in a field vehicle or elsewhere between field trips.
-
4. For equipment used to sample for inorganics and organics: soak in tap water containing 0.1 percent Liquinox detergent and scrub surfaces with a soft bristle brush
-
5. For equipment used to sample for inorganics and organics: rinse thoroughly with tap water
-
6. For equipment used to sample only for inorganics: check equipment for metal parts. Remove and clean metal parts separately, if possible.
-
7. For equipment used to sample only for organics: rinse with pesticide-grade blank water only
-
8. Allow equipment to dry completely on a clean surface.
-
9. Place dried equipment in doubled storage bags. Do not bag wet equipment.
Laboratory Analysis
Laboratories
U.S. Geological Survey National Water Quality Laboratory
The NWQL uses approved methods for determination of organic, inorganic, and radioactive substances in water, sediments, and biological tissues. The methods used by the laboratory include methods approved by the USGS, EPA, the American Public Health Association, the American Water Works Association, the Water Environmental Federation, and the American Society for Testing and Materials.
The NWQL quality-assurance plan is contained in Pritt and Raese (1995). Quality control at the NWQL is monitored by three programs: (1) the internal blind sample program, (2) the external blind sample program, and (3) bench-level QC samples. Information about the internal blind sample program and bench-level QC samples can be obtained by sending an email request to LabHelp@USGS.gov. Information about the external blind sample program can be found at Ludtke and Woodworth (1997). The NWQL participates in performance evaluation studies and laboratory certification programs. A list of the current programs and a description of each can be found by sending an email request to GS-W-COden NWQL LabHelp@USGS.gov. External agencies and customer organizations audit the NWQL to assess analytical methods and QA/QC programs. A table of audits that shows the year reviewed, reviewing agency, and purpose of the review can be obtained by sending an email request to GS-W-COden NWQL LabHelp@USGS.gov.
Brooks Applied Laboratory
The Brooks Applied Laboratory data review process is exhaustive and includes, at minimum, a review by an analyst, quality-assurance specialist, and two project managers. More information can be found at Brooks Applied Labs (2022). In a typical analytical batch, the laboratory performs quality-control analyses, including laboratory duplicate samples, standard reference samples, laboratory blank spike samples, and method blank samples. The laboratory also submits biannual proficiency testing results of water and soil samples to another outside laboratory for evaluation (an interlaboratory split analysis).
Sample Analyses
Laboratory analytical procedures follow approved and standard (when possible) methods, which provide detection limits (listed in app. 1) that are below most regulatory criteria or guidelines (where applicable) and will enable direct comparison of analytical results with these criteria. Sample and QC data will be reported in a standard format, such as USGS Open-File Reports or Scientific Investigations Reports, or as USGS Data Releases. The reports will include a case narrative summarizing any problems encountered in the analyses.
Data-Quality Objectives
The data-quality objectives for this study will follow the guidelines outlined in U.S. Department of the Interior (2008) to ensure that data of known and acceptable quality are obtained. All measurements will be performed, and samples will be collected, to yield consistent results that are representative of the media and conditions measured. In the USGS Koocanusa/Kootenai water-quality monitoring project, water-quality data will be documented to ensure they are meaningful, representative, complete, precise, accurate, comparable, and admissible as legal evidence to meet the scientific, engineering, and regulatory needs of our cooperators. Documentation of basic information, such as compatible monitoring objectives and program design features; metadata (when, where, and how data were collected and who collected and analyzed the data); ancillary information (explanatory variables and study-site characteristics); and legal requirements will be used to evaluate data. Documentation of sufficient QA and QC information to establish the quality and uncertainty in the data and interpretations also will be maintained to determine the comparability and utility of datasets for intended uses.
Data-Quality Assessment
The QC samples will be analyzed along with the corresponding constituents, and the results will be compared with those of the co-collected primary samples. A thorough discussion of the data quality will be included in all written products. These sample comparisons will be based on the relative percent differences calculated for each type of analysis as the absolute value of the difference between the primary and QC sample results divided by the average of the primary and QC sample results (multiplied by 100 to convert to percentage). Other factors considered in each data review will include compliance with sample hold times and receipt conditions (samples arrive at the laboratory at the appropriate temperatures), results of sample blank analyses, detection limits, and adherence to laboratory control standards. Estimated values may be used for evaluation purposes, whereas rejected values will not be used.
Data Management and Reporting
Water-quality data will be recorded electronically and stored in electronic project files to maximize their preservation. Recorded data will include chemical, physical, biological, and ancillary data measured in the field. Analytical results and continuous monitoring data transmitted over the computer network or stored by an electronic data logger also will be stored and securely maintained. Data and metadata that have been reviewed and approved will be stored in NWIS (Dupré and others, 2013). Data that cannot be stored in NWIS are made available through a USGS Data Release.
Data Processing
Sampling information, metadata, and ancillary information will be recorded electronically as field notes that will be considered original record. These data will be combined with analytical data from the laboratory in computer data files.
Continuous Monitoring (Sensor) Data
Continuous monitoring (sensor) data are water-quality records collected onsite by electronic sensors (mounted to sondes) and data loggers. The standard USGS methods for electronically recording data are by (1) transmitting data from a remote location by radio telemetry to a central location, and (2) field personnel recording data at the remote location. A copy of the original data will be retained and archived in the office. Data will not be manipulated by the field instrument or a computer except to convert recorded signals into data in commonly used units or to display data in a convenient format. The transfer of data from the electronic storage medium to NWIS requires thorough checking to ensure that the data have transferred successfully or that as much data as possible have been recovered and errors removed. Data will be adjusted (corrected) to account for calibration drift, (bio)fouling of sensors, interfering factors (from debris or animals, for example), or other errors. These adjustments (corrections) will be applied as constants where corrections are constant over the range of the data (Wagner and others, 2006).
Laboratory Analytical Data
Analytical data are results of field and laboratory chemical, physical, or biological determinations. Each sampling location has been assigned a site identification number (USGS site identifier) for entry into the NWIS database. Field measurements will be entered into NWIS by technical personnel as soon as possible after returning from the sampling field trip. A record number will be assigned by the system and recorded, and samples will be logged before data are transferred to the database. All data from NWQL will be electronically transferred to the NWIS database by the database administrator at least once per week. Hard copies of the analytical reports (known as “WATLISTs”) will be forwarded to the project lead or designated technical personnel for initial data review and storage in project files. The NWIS QWDATA database receives daily incremental backup and weekly full back up by the site administrator.
Data analyzed by the non-NWQL laboratory, Brooks Applied Laboratory, will be entered into NWIS and identified as such using appropriate codes. Data from Brooks Applied Laboratory will be entered and stored in NWIS in the same manner as for data from NWQL.
Data Validation
Data validation is the process whereby water-quality and associated data are checked for completeness and accuracy. After validation, data records will be finalized in NWIS.
Continuous Monitoring (Sensor) Data
Following the entry of continuous monitoring data into NWIS, raw data, and (or) graphs of raw data will be reviewed for anomalous values, dates and times, and preliminary updating will be done. Once the data are edited, the record will be submitted to a designated reviewer.
Laboratory Analytical Data
All field notes and field measurements will be reviewed for completeness and accuracy as soon as possible after returning from the field trip by the field personnel. All chemical analyses will be reviewed for completeness, and questionable values will be noted by the project lead or designated personnel. Prompt review is necessary to allow analytical reanalysis to be performed before sample holding times have been exceeded. Data entered in NWIS QWDATA results in output (WATLIST) that includes a copy of the analysis and a report of general validation checks. If data from more than one sample are available for a site, the analysis also will be compared with previous analyses within a hydrologic context to identify obvious errors, such as decimal errors, and sample anomalies warranting analytical reanalysis. These reports and comparisons will be reviewed and noted on the WATLIST. Constituents for reanalysis are indicated in QWDATA by setting the data-quality-indicator code to “I”, which stands for “in review.”
Data Storage
All data will be stored in NWIS. Supporting project information or metadata that cannot be entered into NWIS will be stored in electronic project files. The USGS WY–MT WSC site administrator maintains backups of all locally stored electronic information. Non-electronic information, if any, will be retained by the project lead or designated personnel. Water-quality data will be disseminated to the public through NWISWeb, USGS Data Releases, interpretive reports, or other published documents.
Health and Safety
A job hazard analysis has been prepared for this study and will be provided to field personnel and reviewed prior to each site visit. The job hazard analysis includes an assessment of job tasks; potential hazards, unsafe acts, or conditions; required personal protective equipment; and telephone contacts. A copy of the job hazard analysis for this study is in appendix 2. Additional health and safety considerations are addressed in the USGS NFM chapter, “Safety in Field Activities” (Lane and Ray, 1998).
Training and Certification
Training is required as described in chapter 6 of the USGS NFM, section 6.0.1.B “Criteria for Performing Field Measurements” (U.S. Geological Survey, 2008). Additional training and refresher training (for example, safety, first-aid, and motorboat operation) are scheduled regularly for field staff to meet USGS training and safety requirements. The project lead or designated personnel will be responsible for ensuring that the training and certifications of the USGS field personnel are successfully completed before field work begins.
References Cited
Arar, E.J., and Collins, G.B., 1997, U.S. Environmental Protection Agency Method 445.0, in vitro determination of chlorophyll a and pheophytin a in marine and freshwater algae by fluorescence, revision 1.2: U.S. Environmental Protection Agency National Exposure Research Laboratory, Office of Research and Development, accessed March 2022 at https://cfpub.epa.gov/si/si_public_record_report.cfm?Lab=NERL&dirEntryId=309417.
Bonde, T.J.H., and Bush, R.M., 1975, Kootenai River water quality investigations, Libby Dam pre-impoundment study, 1967-1972: U.S. Army Corps of Engineers, Seattle District, 124 p., accessed March 2022 at https://cfpub.epa.gov/si/si_public_record_Report.cfm?Lab=REGION%2010&dirEntryID=5947.
British Columbia Ministry of Forests Lands Natural Resource Operations and Rural Development, 2022, BC Water Tool: accessed March 2022 at https://kwt.bcwatertool.ca/watershed.
Brooks Applied Labs, 2022, Quality assurance: accessed March 2022 at https://brooksapplied.com/about/quality-assurance/
Côté, J.M., Hotchkiss, F.S., Martini, M., and Denham, C.R., 2011, Acoustic Doppler current profiler (ADCP) data processing system manual (version 4): U.S. Geological Survey Open-File Report 00–458, 51 p. [Also available at https://doi.org/10.3133/ofr00458.]
Dupré, D.H., Scott, J.C., Clark, M.L., Canova, M.G., and Stoker, Y.E., 2013, User’s manual for the National Water Information System of the U.S. Geological Survey—Water-Quality System, Version 5.0: U.S. Geological Survey Open-File Report 2013–1054, accessed March 2022 at https://doi.org/10.3133/ofr20131054.
Easthouse, K., 2013, Libby Dam—Kootenai River and Lake Koocanusa water quality sampling and analysis plan 2013: U.S. Army Corps of Engineers, Seattle District, Water Management Section, 24 p., accessed March 2022 at https://usace.contentdm.oclc.org/digital/collection/p266001coll1/id/8870.
Easthouse, K., 2018, Libby Dam—Lake Koocanusa water quality summary, 2006 to 2016: U.S. Army Corps of Engineers, Seattle District, Hydraulics and Hydrology Branch, Water Management Section, 400 p., accessed March 2022 at http://kootenaiisrpreview.org/resources/Ecosystem-Restoration-Docs/Saturday-Feb-8/Easthouse2018.pdf.
Edwards, T.K., and Glysson, G.D., 1999, Field methods for measurement of fluvial sediment: U.S. Geological Survey Techniques of Water-Resources Investigations, book 3, chap. C2, 89 p., accessed March 2022 at https://pubs.usgs.gov/twri/twri3-c2/.
Elser, J.J., Fagan, W.F., Denno, R.F., Dobberfuhl, D.R., Folarin, A., Huberty, A., Interlandi, S., Kilham, S.S., McCauley, E., Schulz, K.L., Siemann, E.H., and Sterner, R.W., 2000, Nutritional constraints in terrestrial and freshwater food webs: Nature, v. 408, no. 6812, p. 578–580. [Also available at https://doi.org/10.1038/35046058.]
Federal Interagency Sedimentation Project, 2015, Operating instructions for the US D-96 depth-integrating collapsible bag suspended-sediment sampler: Federal Interagency Sedimentation Project, 14 p., accessed March 2022 at https://water.usgs.gov/fisp/docs/Instructions_US_D-96_Instructions_020709.pdf.
Fishman, M.J., 1993, Methods of analysis by the U.S. Geological Survey National Water Quality Laboratory—Determination of inorganic and organic constituents in water and fluvial sediments: U.S. Geological Survey Open-File Report 93–125, 217 p., accessed March 2022 at https://doi.org/10.3133/ofr93125.
Fishman, M.J., and Friedman, L.C., 1989, Methods for determination of inorganic substances in water and fluvial sediments: U.S. Geological Survey Techniques of Water-Resources Investigations 05–A1, 545 p., accessed March 2022 at https://pubs.er.usgs.gov/publication/twri05A1.
Garbarino, J.R., Kanagy, L.K., and Cree, M.E., 2006, Determination of elements in natural-water, biota, sediment, and soil samples using collision/reaction cell inductively coupled plasma–mass spectrometry: U.S. Geological Survey Techniques and Methods , book 5, chap. B1, 88 p., accessed March 2022 at https://doi.org/10.3133/tm5B1.
Horowitz, A.J., Demas, C.R., Fitzgerald, K.K., Miller, T.L., and Rickert, D.A., 1994, U.S. Geological Survey protocol for the collection and processing of surface-water samples for the subsequent determination of inorganic constituents in filtered water: U.S. Geological Survey Open-File Report 94–539, 63 p., accessed March 2022 at https://doi.org/10.3133/ofr94539.
Lane, S.L., and Ray, R.G., 1998, Chapter A9. Safety in field activities: U.S. Geological Survey Techniques of Water-Resources Investigations 09–A9, 75 p., accessed March 2022 at https://doi.org/10.3133/twri09A9.
Ludtke, A.S., and Woodworth, M.T., 1997, USGS Blind Sample Project—Monitoring and evaluating laboratory analytical quality: U.S. Geological Survey Fact Sheet 0136–97, accessed March 2022 at https://doi.org/10.3133/fs13697.
Montana Department of Environmental Quality, 2020a, Derivation of a site-specific water column selenium standard for Lake Koocanusa, Montana: Helena, Mont., Montana Department of Environmental Quality, 221 p., accessed March 2022 at https://deq.mt.gov/files/Water/WQPB/Standards/Koocanusa/TSD_Lake%20Koocanusa_Sep2020_Final.pdf.
Montana Department of Environmental Quality, 2020b, Selenium standards for Lake Koocanusa and Kootenai River: Administrative Rule 17.30.632, accessed March 2022 at https://rules.mt.gov/gateway/ruleno.asp?RN=17%2E30%2E632.
Patton, C.J., and Gilroy, E.J., 1999, U.S. Geological Survey nutrient preservation experiment—Experimental design, statistical analysis, and interpretation of analytical results: U.S. Geological Survey Water-Resources Investigations Report 98–4118, 73 p., accessed March 2022 at https://pubs.er.usgs.gov/publication/wri984118.
Patton, C.J., and Kryskalla, J.R., 2011, Colorimetric determination of nitrate plus nitrite in water by enzymatic reduction, automated discrete analyzer methods: U.S. Geological Survey Techniques and Methods, book 5, chap. B8, 34 p., accessed March 2022 at https://doi.org/10.3133/tm5B8.
Presser, T.S., and Naftz, D.L., 2020, Understanding and documenting the scientific basis of selenium ecological protection in support of site-specific guidelines development for Lake Koocanusa, Montana, U.S.A., and British Columbia, Canada: U.S. Geological Survey Open-File Report 2020–1098, p. 52., accessed March 2022 at https://doi.org/10.3133/ofr20201098.
Pritt, J.W., and Raese, J.W., 1995, Quality assurance/quality control manual of the National Water Quality Laboratory: U.S. Geological Survey Open-file Report 95–443, 43 p., accessed March 2022 at https://doi.org/10.3133/ofr95443.
Province of British Columbia, 2013, Order of the Minister of Environment, Section 89, Environmental Management Act: Ministerial Order No. M113, accessed March 2022 at https://www.bclaws.gov.bc.ca/civix/document/id/mo/hmo/m0113_2013.
Schroder, L.J., and Shampine, W.J., 1992, Guidelines for preparing a quality assurance plan for district offices of the U.S. Geological Survey: U.S. Geological Survey Open-File Report 92–136, 17 p., accessed March 2022 at https://doi.org/10.3133/ofr92136.
Stanley, D.L., Shampine, W.J., and Schroder, L.J., 1992, Summary of the U.S. Geological Survey National Field Quality Assurance Program from 1979 through 1989: U.S. Geological Survey Open-File Report 92–163, 18 p., accessed March 2022 at https://doi.org/10.3133/ofr92163.
Teck Resources Limited, 2020, 2020 Annual report: Teck Resources Limited, accessed March 2022 at https://www.teck.com/media/2020-Annual-Report.pdf.
U.S. Department of the Interior, 2008, Data quality management guide: Office of the Chief Information Officer, U.S. Department of the Interior, 70 p., accessed March 2022 at https://www.nps.gov/gis/egim/library/DataQuality_2008_0824_DOI%20Data%20Quality%20Management%20Guide.pdf.
U.S. Geological Survey, 2002, Processing of water samples: U.S. Geological Survey Techniques of Water-Resources Investigations 09–A5, 166 p., accessed March 2022 at https://doi.org/10.3133/twri09A5.
U.S. Geological Survey, 2004, Chapter A3. Cleaning of equipment for water sampling: U.S. Geological Survey Techniques of Water-Resources Investigations 09–A3, 68 p., accessed March 2022 at https://doi.org/10.3133/twri09A3.
U.S. Geological Survey, 2006, Chapter A4. Collection of water samples (ver. 2.0): U.S. Geological Survey Techniques of Water-Resources Investigations 09–A4, 166 p., accessed March 2022 at https://doi.org/10.3133/twri09A4.
U.S. Geological Survey, 2008, Chapter A6. Field measurements: U.S. Geological Survey Techniques of Water-Resources Investigations Report 09–A6, 100 p., accessed March 2022 at https://doi.org/10.3133/twri09A6.
U.S. Geological Survey, 2011, National Water Quality Laboratory Technical Memorandum 2011.01: U.S Geological Survey, accessed March 2022 at https://nwql.usgs.gov/tech_memos/nwql.2011-01.pdf.
U.S. Geological Survey, 2023, USGS water data for the Nation: U.S. Geological Survey National Water Information System database, accessed March 2022 at https://doi.org/10.5066/F7P55KJN.
U.S. Geological Survey, variously dated, National field manual for the collection of water-quality data: U.S. Geological Survey Techniques of Water-Resources Investigations 09–A1 to A10, accessed March 2022 at https://pubs.water.usgs.gov/twri9A.
Wagner, R.J., Boulger, R.W., Oblinger, C.J., and Smith, B.A., 2006, Guidelines and standard procedures for continuous water-quality monitors—Station operation, record computation, and data reporting: U.S. Geological Survey Techniques and Methods, book 1, chap. D3, 51 p., accessed March 2022 at https://doi.org/10.3133/tm1D3.
Ward, J.R., and Harr, C.A., 1990, Methods for collection and processing of surface-water and bed-material samples for physical and chemical analyses: U.S. Geological Survey Open-File Report 90–140, 71 p., accessed March 2022 at https://doi.org/10.3133/ofr90140.
Wilde, F.D., and Skrobialowski, S.C., 2011, U.S. Geological Survey protocol for sample collection in response to the Deepwater Horizon oil spill, Gulf of Mexico, 2010—Sampling methods for water, sediment, benthic invertebrates, and microorganisms in coastal environments: U.S. Geological Survey Open-File Report 2011–1098, 101 p., accessed March 2022 at https://doi.org/10.3133/ofr20111098.
Woods, P.F., 1982, Annual nutrient loadings, primary productivity, and trophic state of Lake Koocanusa, Montana and British Columbia, 1972–80: U.S. Geological Survey Professional Paper 1283, 24 p., accessed March 2022 at https://doi.org/10.3133/pp1283.
Appendix 1. Analytes and Methods
Table 1.1.
Analytes, methods, and method descriptions used in the U.S. Geological Survey Koocanusa/Kootenai water-quality monitoring program, 2021.[The analytical method code is the unique analytical method identifier, which is revised when methods are updated. Identical codes indicate the same method is used. CaCO3, calcium carbonate; NWQL, National Water Quality Laboratory; --, not available; clCP-MS, cell inductively coupled plasma-mass spectrometry; µg/L, microgram per liter; N, nitrogen; mg/L, milligram per liter; ICP-MS, inductively coupled plasma-mass spectrometry; ICP-AES, inductively coupled plasma-atomic emission spectrometry; IC, ion chromatography; ICP, inductively coupled plasma; BAL, Brooks Analytical Laboratory; IC-ICP-MS, ion chromatography-inductively coupled plasma-mass spectrometry; NA, not applicable; P, phosphorus; ICP-OES, inductively coupled plasma-optical emission spectrometry; µS/cm at 25 °C, microsiemens per centimeter at 25 degrees Celsius]
| Analyte | Analyzing laboratory | Analytical method | Method description | Method reporting level | Reporting level unit | Reference |
|---|---|---|---|---|---|---|
| Alkalinity as CaCO3 | NWQL | TT040 | Inflection-point titration | -- | -- | NWQL1 |
| Aluminum | NWQL | PLM10 | clCP-MS | 3.0 | µg/L | Garbarino and others (2006) |
| Ammonia, as N | NWQL | 00048 | Salicylate-hypochlorite, colorimetry, discrete analyzer | 0.026 | mg/L | Patton and Gilroy (1999) |
| Cadmium | NWQL | PLM43 | ICP-MS | 0.03 | µg/L | Garbarino and others (2006) |
| Calcium | NWQL | PLA11 | ICP-AES | 0.022 | mg/L | Fishman (1993) |
| Chloride | NWQL | IC022 | IC | 0.02 | mg/L | Fishman and Friedman (1989) |
| Chlorophyll a | NWQL | EPA 445.0 | Chromatography-fluorometry | 0.1 | µg/L | Arar and Collins (1997) |
| Cobalt | NWQL | PLM10 | clCP-MS | 0.03 | µg/L | Garbarino and others (2006) |
| Copper | NWQL | PLM10 | clCP-MS | 0.4 | µg/L | Garbarino and others (2006) |
| Dissolved organic carbon | NWQL | CMB15 | High-temperature catalytic oxidation | 0.46 | mg/L | NWQL1 |
| Iron | NWQL | PLA11 | ICP | 5.0 | µg/L | Fishman (1993) |
| Magnesium | NWQL | PLA11 | ICP-AES | 0.011 | mg/L | Fishman (1993) |
| Manganese | NWQL | PLM43 | ICP-MS | 0.4 | µg/L | Garbarino and others (2006) |
| Methylseleninic acid | BAL | BAL-4201 | IC-ICP-MS | NA2 | -- | BAL1 |
| Nickel | NWQL | PLM10 | clCP-MS | 0.2 | µg/L | Garbarino and others (2006) |
| Nitrite, as N | NWQL | 00049 | Diazotization, colorimetry, discrete analyzer | 0.001 | mg/L | Fishman and Friedman (1989) |
| Nitrite-plus-nitrate, as N | NWQL | RED02 | Enzyme reduction-diazotization, colorimetry | 0.02 | mg/L | Patton and Kryskalla (2011) |
| Nitrogen (alkaline persulfate) | NWQL | AKP01 | Acidified alkaline persulfate digestion, colorimetry | 0.015 | mg/L | Patton and Kryskalla (2011) |
| Orthophosphate, as P | NWQL | 00048 | Phosphomolybdate, colorimetry, discrete analyzer | 0.004 | mg/L | Fishman (1993) |
| Pheophytin a | NWQL | EPA 445.0 | Chromatography-fluorometry | 0.1 | µg/L | Arar and Collins (1997) |
| Phosphorus | NWQL | CL020 | Acid persulfate digestion; colorimetry | 0.007 | mg/L | Patton and Kryskalla (2011) |
| Potassium | NWQL | PLOO3 | ICP-OES | 0.03 | mg/L | Fishman and Friedman (1989) |
| Selenate | BAL | BAL-4201 | IC-ICP-MS | NA2 | -- | BAL1 |
| Selenite | BAL | BAL-4201 | IC-ICP-MS | NA2 | -- | BAL1 |
| Selenium | NWQL | PLM10 | clCP-MS | 0.05 | µg/L | Garbarino and others (2006) |
| Selenocyanate | BAL | BAL-4201 | IC-ICP-MS | NA2 | -- | BAL1 |
| Selenomethionine | BAL | BAL-4201 | IC-ICP-MS | NA2 | -- | BAL1 |
| Sodium | NWQL | PLA11 | ICP-AES | 0.06 | mg/L | Fishman (1993) |
| Specific conductance, laboratory | NWQL | WHT03 | Wheatstone bridge, laboratory | 5.0 | µS/cm at 25 °C | Fishman and Friedman (1989) |
| Sulfate | NWQL | IC022 | IC | 0.02 | mg/L | Fishman and Friedman (1989) |
| Total organic carbon | NWQL | COMB9 | High-temperature catalytic oxidation | 1.4 | mg/L | NWQL1 |
| Zinc | NWQL | PLM10 | clCP-MS | 2.0 | µg/L | Garbarino and others (2006) |
References Cited
Arar, E.J., and Collins, G.B., 1997, U.S. Environmental Protection Agency Method 445.0, in vitro determination of chlorophyll a and pheophytin a in marine and freshwater algae by fluorescence, revision 1.2: U.S. Environmental Protection Agency National Exposure Research Laboratory, Office of Research and Development, accessed March 2022 at https://cfpub.epa.gov/si/si_public_record_report.cfm?Lab=NERL&dirEntryId=309417.
Fishman, M.J., 1993, Methods of analysis by the U.S. Geological Survey National Water Quality Laboratory—Determination of inorganic and organic constituents in water and fluvial sediments: U.S. Geological Survey Open-File Report 93–125, 217 p., accessed March 2022 at https://doi.org/10.3133/ofr93125.
Fishman, M.J., and Friedman, L.C., 1989, Methods for determination of inorganic substances in water and fluvial sediments: U.S. Geological Survey Techniques of Water-Resources Investigations 05–A1, 545 p., accessed March 2022 at https://pubs.er.usgs.gov/publication/twri05A1.
Garbarino, J.R., Kanagy, L.K., and Cree, M.E., 2006, Determination of elements in natural-water, biota, sediment, and soil samples using collision/reaction cell inductively coupled plasma–mass spectrometry: U.S. Geological Survey Techniques and Methods , book 5, chap. B1, 88 p., accessed March 2022 at https://doi.org/10.3133/tm5B1.
Patton, C.J., and Gilroy, E.J., 1999, U.S. Geological Survey nutrient preservation experiment—Experimental design, statistical analysis, and interpretation of analytical results: U.S. Geological Survey Water-Resources Investigations Report 98–4118, 73 p., accessed March 2022 at https://pubs.er.usgs.gov/publication/wri984118.
Patton, C.J., and Kryskalla, J.R., 2011, Colorimetric determination of nitrate plus nitrite in water by enzymatic reduction, automated discrete analyzer methods: U.S. Geological Survey Techniques and Methods, book 5, chap. B8, 34 p., accessed March 2022 at https://doi.org/10.3133/tm5B8.
Appendix 2. Job Hazard Analysis for Koocanusa Reservoir and Upper Kootenai River, Montana, Water-Quality Monitoring Program, 2021
Emergency Contacts
Dial 911 or contact the Lincoln County Sheriff, Libby, Montana, 406–293–4112. For help needed, non-emergency, call the U.S. Geological Survey (USGS) Helena office at 406–457–5900, supervisor cell phone, or attempt marine band radio or cell phone communication with Abayance Bay/Mariners Haven Marina (channel 16 is monitored by marinas; phone number is 406–297–0160). If the situation requires law enforcement, contact the Lincoln County Sheriff’s Satellite Office in Eureka, Montana (406–297–2121). If cellular coverage is unavailable, contact supervisor via text using Garmin InReach global positioning system tracker and satellite communicator.
Safety Equipment
Required safety equipment includes the following: Coast Guard-approved personal flotation device (PFD), cable cutters for sounding cable, throw bags, throwable PFD, very high frequency (VHF) marine radio, air horn, first-aid kit, fire extinguishers, flares, and Garmin InReach global positioning system tracker and satellite communicator. The boat also will be equipped with overnight emergency supplies including food, water, and shelter. PFDs must always be worn while the boat is underway.
Recommended safety equipment includes the following: hard hat, gloves, safety glasses, back support, and sun protection.
Potential Hazards
Servicing Field Equipment.—Electrical and battery hazards. Rocky materials can be hazardous to navigate and is extremely slippery when icy or wet. Bats and mice in the gage can present hantavirus hazard. Make sure you have hantavirus protection before attempting to clean up rodent droppings. Algae on rocks near the water’s edge can be slippery, even if it looks dry. River regulation by the U.S. Army Corps of Engineers (USACE) can bring water levels up quickly at the gage. Concrete steps down to the lower level of the gage can become very icy and slippery. Be extremely careful when walking on slippery rocks. If rocks are snow covered, consider just using binoculars to read the staff from the gage house at higher stages. Notify the USACE at Libby Dam if the gagehouse needs maintenance.
Cableway Measurement.—Back strain moving heavy equipment to and from the cableway. 75–100-pound weights are required. Pinching/crushing fingers. Falling from cable tower or car. Watch for fishing lures hanging from the cable when over the water. Always wear PFD on the cableway. Wear back support when moving heavy equipment to and from the cableway. Always watch ahead for fishing lures hanging from the cable when moving the car. Always make a thorough visual inspection before using the cable. Make sure doors to the shelter are propped open before moving the car so they don't blow shut and hinder re-entrance to the shelter. Notify the USACE at Libby Dam if the cableway needs maintenance. Additional safety recommendations specific to this site: Road to the gage can be shady and very icy in winter. It is best to come to the site from the west side during the winter to avoid driving the steep hill to the east.
Motorboat operation in Koocanusa Reservoir.—Traffic accident during commute, mechanical problems (boat trailer and boat), poor weather. Check boat maintenance and user records. File float plan. Check weather forecast before workday begins. Boat operator must evaluate weather forecast and approve lake work. Boat operator must be a USGS Certified Motorboat Operator within the last five years. Use extreme caution when towing boat to and from reservoir. Vehicle driver must have completed USGS Defensive Driving Course within last 3 years and have experience towing a boat. Verify boat trailer is securely connected to tow vehicle (trailer tongue locked down to ball mount on tow vehicle, trailer safety chains attached to tow vehicle, emergency trailer brake chain attached to tow vehicle; trailer winch strap attached to bow; trailer winch safety chain attached to bow), grease trailer bearings every trip. Check spare, jack, and lug wrench. File written or verbal float plan with supervisor. If float plan changes due to factors in the field, be sure to notify supervisor. Check boat trailer lights and stern straps. Ensure boat is in good running condition with adequate fuel and oil for the day. Boat Operator will check boat safety supplies before launching and brief crew on use and location of safety equipment. Boat Operator will verify the stern plug is installed in boat. Be aware of hand placement when lifting, use proper lifting techniques (lift with legs instead of back, and get assistance as necessary). Perform all equipment loading in parking area, not at the ramp. A PFD is required to be worn when working in, on, or over any body of water. PFD’s will be equipped with reflective tape in accordance with 46 CFR 25.25-15. Boat Operator will perform a radio check with marina before departing harbor. The radio check will include estimated return time. The Boat Operator will radio the marina upon returning to the harbor. Boat Operator and crew must watch for obstacles in water and indications of shallow water (water color change, breaking waves). Use global positioning system (GPS) and available maps to navigate to each monitoring site. Obey boating regulations. Stay clear of sail boats because they have right of way. Use caution when approaching and attaching to monitoring platform. All crew members will watch for changing weather conditions.
Dock Use.—Damage to boat or motor. Lines and anchors should be safely stored and inspected prior to use. Watch fingers when tying off to the dock. Boat should be secured at the bow and stern. Motor should be raised to prevent damage to the prop.
Fueling the Boat and Loading/Unloading.—Fuel spills or fire. If available, use non-skid surface while loading and unloading. Enter slowly and only at operators’ command. No smoking in or around watercraft while refueling or while fuel is aboard the watercraft.
Winter Driving.—Roadway conditions cannot be controlled by employers, but they can promote safe-driving behaviors of employees: train drivers for winter weather conditions and recognize the hazards of winter weather driving (snow/ice covered roads). Maintenance, inspection, and winterization of vehicles should be performed before winter trips. Tires are checked for tread depth and proper inflation, and winter tires installed if needed. Brakes have proper level of fluid and are evenly balanced. Visibility systems are inspected to ensure all exterior lights, defrosters, and wipers are working properly. Recommended emergency kit is included with each field vehicle including ice scraper, flashlight with batteries, tow chain, road maps, jumper cables, emergency flares, traction aids (bag of sand), water, and blankets.
If you are stranded in a vehicle, stay inside the vehicle. Response times may be slow during severe weather conditions. Call to notify supervisor and emergency services (911), if needed. Display a brightly colored cloth off the antenna to make passersby aware of distress. Turn on vehicle periodically each hour and run to keep warm. Keep exhaust pipe clear of snow and beware of carbon monoxide poisoning. Do minor exercise to maintain good circulation and watch for signs of frostbite and hypothermia.
Medical Emergencies
All field crewmembers will be responsible for necessary medications and personal requirements. USGS personnel are required to be current in CPR and first aid. Field crew members must be aware of each other’s potential medical conditions or treatments for existing medical conditions. Examples of these conditions include severe allergic reactions, diabetes, and coronary problems. If a medical emergency happens, it will be most efficient to call 911 via cell phone and request to meet an emergency crew at the nearest marina. If cell phone service is not available, try using the marine band radio to contact the nearest marina and request to meet an emergency crew.
Extreme Emergency Procedures (Sinking Boat, Uncontrollable Boat Fire)
-
1. Press SOS button on the Garmin InReach global positioning system tracker and satellite communicator (this will broadcast rescue request and GPS location to local search and rescue team) and keep Garmin InReach dry with screen facing up.
-
2. Request help on marine band radio by calling out “Mayday” three times and providing location coordinates (use boat GPS system to obtain coordinates) or verbal description of location.
-
3. Launch flares.
-
4. Abandon boat. If cell phone is operational, call 911 (cell phone coverage is only available at the international boundary site and marina).
Appendix 3. Quality-Control Samples Collected
Table 3.1.
Summary of quality-control samples collected in the U.S. Geological Survey Koocanusa/Kootenai water-quality monitoring program, 2021.[P, phosphorus; N, nitrogen]
Conversion Factors
U.S. customary units to International System of Units
International System of Units to U.S. customary units
Temperature in degrees Celsius (°C) may be converted to degrees Fahrenheit (°F) as follows:
°F = (1.8 × °C) + 32
Temperature in degrees Fahrenheit (°F) may be converted to degrees Celsius (°C) as follows:
°C = (°F – 32) / 1.8
Datum
Vertical coordinate information is referenced to the North American Vertical Datum of 1988 (NAVD 88).
Horizontal coordinate information is referenced to the North American Datum of 1983 (NAD 83).
Altitude, as used in this report, refers to distance above the vertical datum.
Supplemental Information
Specific conductance is given in microsiemens per centimeter at 25 degrees Celsius (µS/cm at 25 °C).
Concentrations of chemical constituents in water are given in either milligrams per liter (mg/L) or micrograms per liter (µg/L).
Abbreviations
ADCP
acoustic Doppler current profiler
ASR
analytical service request
CASRN
Chemical Abstract Service Registry Numbers
CoC
chain of custody
DCP
data-collection platform
EPA
U.S. Environmental Protection Agency
HCl
hydrochloric acid
JHA
job hazard analysis
MTDEQ
Montana Department of Environmental Quality
N
nitrogen
NELAC
National Environmental Laboratory Accreditation Conference
NELAP
National Environmental Laboratory Accreditation Program
NFM
National Field Manual for the Collection of Water-Quality Data
NFQA
National Field Quality Assurance
NWIS
National Water Inventory System
NWQL
National Water Quality Laboratory
P
phosphorus
PVC
polyvinyl chloride
QA
quality assurance
QC
quality control
QMS
quality management system
QSP
Quality Systems Branch
SAP
sampling and analysis plan
USACE
U.S. Army Corps of Engineers
USGS
U.S. Geological Survey
For more information about this publication, contact:
Director, USGS Wyoming-Montana Water Science Center
162 Bozeman Avenue
Helena, MT 59601
406–457–5900
For additional information, visit: https://www.usgs.gov/centers/wy-mt-water/
Publishing support provided by the
Rolla Publishing Service Center
Disclaimers
Any use of trade, firm, or product names is for descriptive purposes only and does not imply endorsement by the U.S. Government.
Although this information product, for the most part, is in the public domain, it also may contain copyrighted materials as noted in the text. Permission to reproduce copyrighted items must be secured from the copyright owner.
Suggested Citation
Caldwell Eldridge, S.L., Schaar, M.A., Reese, C.B., Bussell, A.M., and Chapin, T., 2023, Sampling and analysis plan for the Koocanusa Reservoir and upper Kootenai River, Montana, water-quality monitoring program, 2021: U.S. Geological Survey Open-File Report 2022–1113, 32 p., https://doi.org/10.3133/ofr20221113.
ISSN: 2331-1258 (online)
Study Area
| Publication type | Report |
|---|---|
| Publication Subtype | USGS Numbered Series |
| Title | Sampling and analysis plan for the Koocanusa Reservoir and upper Kootenai River, Montana, water-quality monitoring program, 2021 |
| Series title | Open-File Report |
| Series number | 2022-1113 |
| DOI | 10.3133/ofr20221113 |
| Publication Date | January 25, 2023 |
| Year Published | 2023 |
| Language | English |
| Publisher | U.S. Geological Survey |
| Publisher location | Reston, VA |
| Contributing office(s) | Crustal Geophysics and Geochemistry Science Center, Wyoming-Montana Water Science Center |
| Description | ix, 32 p. |
| Country | United States |
| State | Montana |
| Other Geospatial | Koocanusa Reservoir, Upper Kootenai River |
| Online Only (Y/N) | Y |