Community for Data Integration 2019 Project Report
Links
- Document: Report (15.0 MB pdf) , HTML , XML
- Download citation as: RIS | Dublin Core
Acknowledgments
The authors would like to thank Kevin T. Gallagher, Tim Quinn, and Anne Kinsinger (all U.S. Geological Survey) for supporting the projects described in this report.
Abstract
The U.S. Geological Survey Community for Data Integration annually supports small projects focusing on data integration for interdisciplinary research, innovative data management, and demonstration of new technologies. This report provides a summary of the 14 projects supported in fiscal year 2019 and outlines their goals, activities, and accomplishments. Proposals in 2019 were encouraged to address the optional disciplinary theme of biosurveillance of emerging invasive species and health threats.
Introduction
The U.S. Geological Survey (USGS) Community for Data Integration (CDI; Hsu and Liford, 2021) annually funds projects focusing on data integration for interdisciplinary research, innovative data management, and demonstration of new technologies. Since 2010, the CDI has funded more than 100 projects. The CDI supports projects that focus on targeted efforts that yield near-term benefits to Earth and biological science; leverage existing capabilities and data; implement and demonstrate innovative solutions (for example, methodologies, tools, or integration concepts) that could be used or replicated by others at scales from project to enterprise; preserve, expose, and improve access to Earth and biological science data, models, and other outputs; and develop, organize, and share knowledge and best practices in data integration.
In 2019, the CDI solicited proposals that addressed one or more of the following themes:
-
• Producing findable, accessible, interoperable, and reusable (FAIR) data and tools for integrated predictive science capacity,
-
• Reusing or repurposing modular tools such as those developed by previous CDI projects, including the CDI Risk Map (Wood and others, 2018),
-
• Building authoritative national datasets for hazards or assets (integrating data and assessing data quality),
-
• Developing tools and methods for biosurveillance of emerging invasive species and health threats.
This report provides a summary of the 14 projects funded in fiscal year 2019 and outlines the goals, activities, and accomplishments of each project.
Community for Data Integration Projects—Fiscal Year 2019
Projects funded in 2019 covered remote sensing, grassland productivity forecasting, subsidence susceptibility, FAIR data, climate projections, hazards mitigation, biosurveillance, non-native and invasive species, cloud computing, environmental deoxyribonucleic acid (eDNA), and Internet of Things (IoT). In this section, summaries of the 14 projects funded in fiscal year 2019 are provided. A comprehensive list of each project funded in fiscal years 2010–2022 can be found on the CDI website (https://www.usgs.gov/centers/community-for-data-integration-cdi/science/all-funded-projects).
“Open-Source and Open-Workflow Climate Futures Toolbox for Adaptation Planning”
Principal Investigator—Aparna Bamzai-Dodson, abamzai@usgs.gov (USGS)
Coinvestigators and partners—Brian R. Johnson (University of Colorado-Boulder), Travis M. Williams (National Renewable Energy Laboratory), Brian W. Miller (USGS), Imtiaz Rangwala (USGS), and Maxwell B. Joseph (USGS)
Global climate models are a key source of climate information and produce large amounts of spatially explicit data for various physical parameters. However, these projections have substantial uncertainties associated with them, and the datasets themselves can be difficult to work with because of their size and complexity. The project team created the first version of the Climate Futures Toolbox (originally Climate Scenarios Toolbox). The Climate Futures Toolbox is an open-source workflow in the R programming language that allows users to access downscaled climate projection data, clip data by spatial boundaries using shapefiles, save the output, and generate summary tables and plots (fig. 1). A detailed R vignette guides users to easily generate derived variables to answer specific questions about their region of interest (for example, how will the daytime high temperature in the month of June change by midcentury?). Managers and scientists can use the Climate Futures Toolbox to evaluate the potential effects of climate change and identify appropriate and robust adaptation strategies.
-
Related links—
-
• See project page at https://www.sciencebase.gov/catalog/item/5cd1ff88e4b09b8c0b7a59a2
-
• Climate Futures Toolbox Guide: https://www.earthdatascience.org/cft/index.html
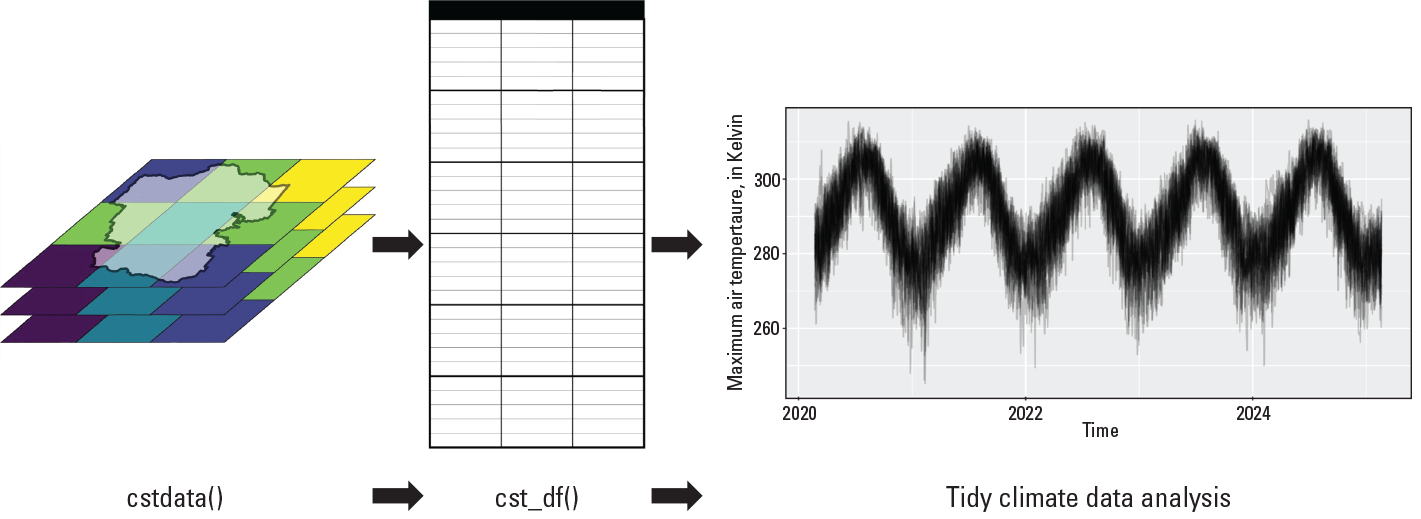
Overview of the two main functions of the Climate Futures Toolbox (CFT) package (from Bamzai-Dodson, 2019). The cstdata() function streams downscaled, multivariate adaptive constructed analogs climate data for spatial regions of interest, which can be summarized into data.frame objects with daily climate data using the cst_df() function, shown in the figure as a blank table. This function enables subsequent tidy climate data analysis, including generation of derived climate variables and data visualizations. Tidy data is a concept described in Wickham (2014) and refers to the process of organizing and cleaning raw data to make them ready for analyses. In this case, tidy climate data analysis means that CFT enables users to cut directly to the analysis by reducing the amount of effort needed generate tidy climate data.
“Extending ScienceBase for Disaster Risk Reduction”
Principal Investigator—Joseph A. Bard, jbard@usgs.gov (USGS)
Coinvestigators and partners—John (Dell) L. Long, Drew A. Ignizio, Scott E. Graham, and Dave W. Ramsey (all USGS)
Access to up-to-date geospatial data is critical for responding to natural hazards-related crises, such as volcanic eruptions. To address the need to reliably provide access to near real-time USGS datasets, the project team developed a process to allow data managers within the USGS Volcano Hazard Program to programmatically publish geospatial webservices to a cloud-based instance of GeoServer hosted on Amazon Web Services, using ScienceBase. To accomplish this, the project team developed a new process in the ScienceBase application (fig. 2), added new functionality to the ScienceBase Python library (sciencebasepy, https://doi.org/10.5066/P9X4BIPR), and assembled a Python workflow demonstrating how users can gather data from a web application programming interface (API) and publish these data as a cloud-based ScienceBase web service using a code-based process. These tools improve the capabilities of the USGS to rapidly share updated datasets with collaborators to provide necessary situational awareness during disaster responses and hazard mitigation efforts.
-
Related links—
-
• See project page at https://www.sciencebase.gov/catalog/item/5cd20028e4b09b8c0b7a59a8
-
• See example geospatial services on a ScienceBase item at https://www.sciencebase.gov/catalog/item/5dcf38dde4b06957976277de
-
• Python script: https://code.usgs.gov/cascades-volcano-observatory/sb_python_shapefile_update (GitLab login required)
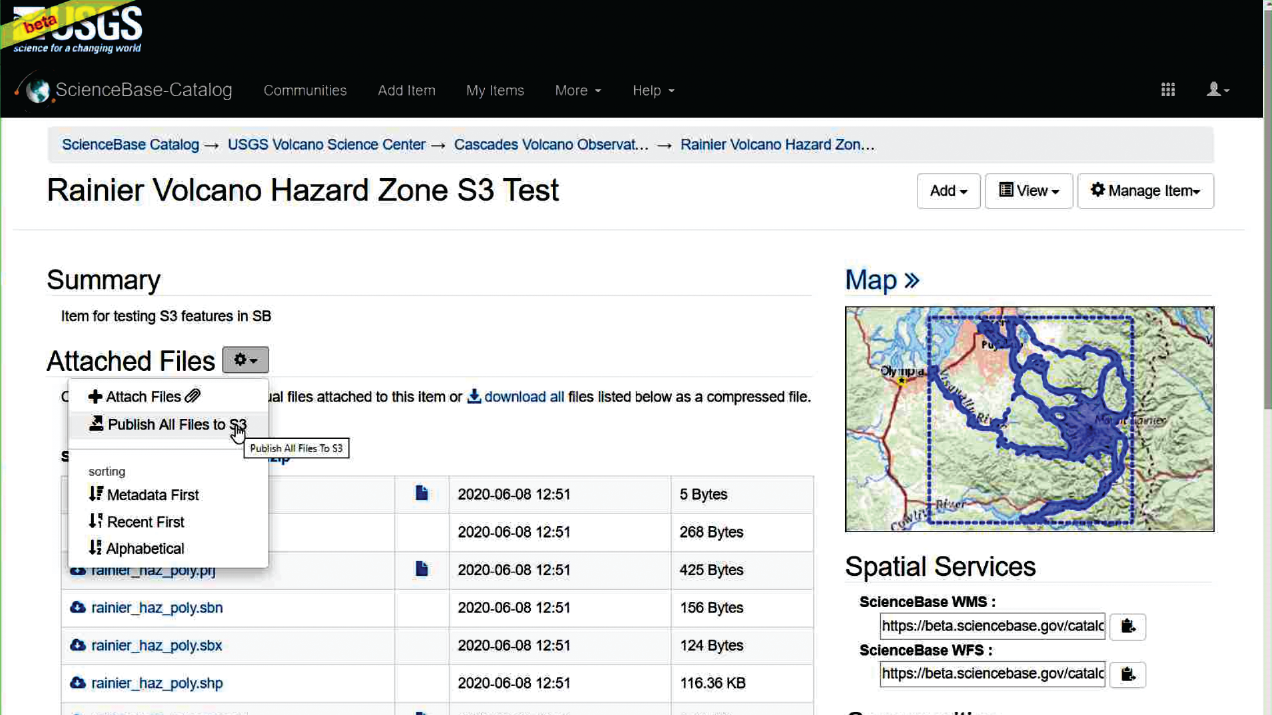
Screenshot of ScienceBase webpage (beta version). User is hovering their mouse over the button to publish their geospatial data files, stored on ScienceBase, to Amazon Simple Storage Service (Amazon S3) for creating a cloud-hosted geospatial web service.
“Transforming Biosurveillance by Standardizing and Serving 40 Years of Wildlife Disease Data”
Principal Investigator—David S. Blehert, dblehert@usgs.gov (USGS)
Coinvestigators and partners—Ali H. Rahama, Stephanie C. Sparrow, Matthew G. Noojin, Neil V. Baertlein, and C. LeAnn White (all USGS)
Throughout the past 40 years, the USGS National Wildlife Health Center has collected wildlife health information from around the United States and beyond, amassing the world’s largest repository of wildlife disease surveillance data. This project identified, characterized, and documented the locally stored wildlife health datasets from the National Wildlife Health Center. This documentation was a critical first step to migrating them to a new laboratory information management system and public-facing data systems, such as the Wildlife Health Information Sharing Partnership-event reporting system (WHISPers; fig. 3). To accomplish this migration, the project team developed a systematic, standardized approach for collaborating with laboratory scientists to locate, define, and classify their long-term datasets so that they can be prepared, archived, and mapped to new wildlife disease data systems. The process that was developed and implemented to define, classify, and cleanse data is being used to produce a guide for creating findable, accessible, interoperable, and reusable (FAIR) laboratory data applicable for use across USGS science centers.
-
Related links—
-
• See project page at https://www.sciencebase.gov/catalog/item/5cd200d6e4b09b8c0b7a59ac
-
• Wildlife Health Information Sharing Partnership-event reporting system (WHISPers): https://whispers.usgs.gov/home
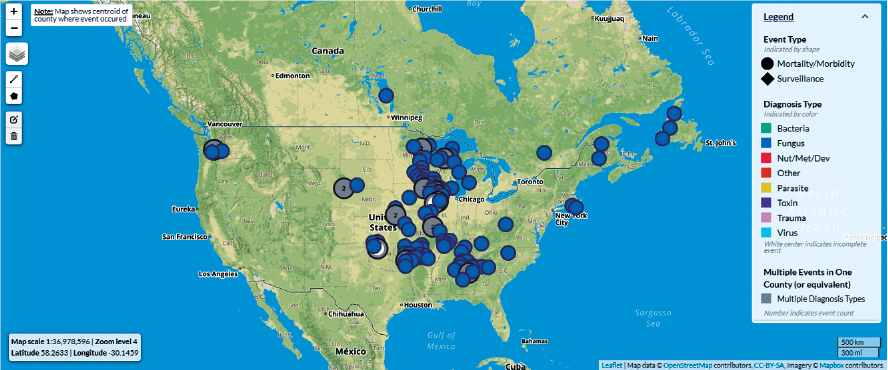
Screenshot of the Wildlife Health Information Sharing Partnership-event reporting system (WHISPers) platform (from Blehert, 2019), showing a map of bat white-nose syndrome outbreaks in the United States from 2015-20. Data from various wildlife disease surveillance efforts have historically been maintained as disparate, undocumented datasets. Following application of the processes developed through this project, wildlife disease surveillance data from multiple sources (such as for bat white-nose syndrome surveillance) can be readily migrated to the publicly available WHISPers platform. mi, miles; km, kilometers.
“Integrating Short-term Climate Forecasts into a Restoration Management Support Tool”
Principal Investigator—John B. Bradford, jbradford@usgs.gov (USGS)
Coinvestigators and partners—Caitlin M. Andrews, David Pilliod, Justin Welty, Michelle Jeffries, and Linda Schueck (all USGS)
Natural resources managers are regularly required to make decisions regarding restoration without the data to make informed predictions. To assist in the process for making evidence-based restoration choices, the project team created a tool that predicts site-specific soil moisture and climate based on short-term (1-year) forecasts. This tool resides within the Land Treatment Exploration Tool, which is an explorer that increases accessibility to restoration monitoring datasets. The short-term forecaster allows users to explore historical climate and soil moisture for reference, and access multi-month forecasts that provide specific quantitative guidance about what these metrics indicate for the likelihood of seeding and planting success (fig. 4). With this added functionality to the the Land Treatment Exploration Tool managers are provided a suite of tools that deliver site-specific reference of conditions and treatments and potential upcoming conditions that could guide decision making for greater restoration success; benefitting the ecosystem health of public lands and all those who access it.
-
Related links—
-
• See project page at https://www.sciencebase.gov/catalog/item/5cd20265e4b09b8c0b7a59af
-
• USGS website for the Land Treatment Exploration Tool: https://www.usgs.gov/centers/forest-and-rangeland-ecosystem-science-center/science/land-treatment-exploration-tool
-
• Land Treatment Exploration Tool: https://chsapps.usgs.gov/apps/land-treatment-exploration-tool/
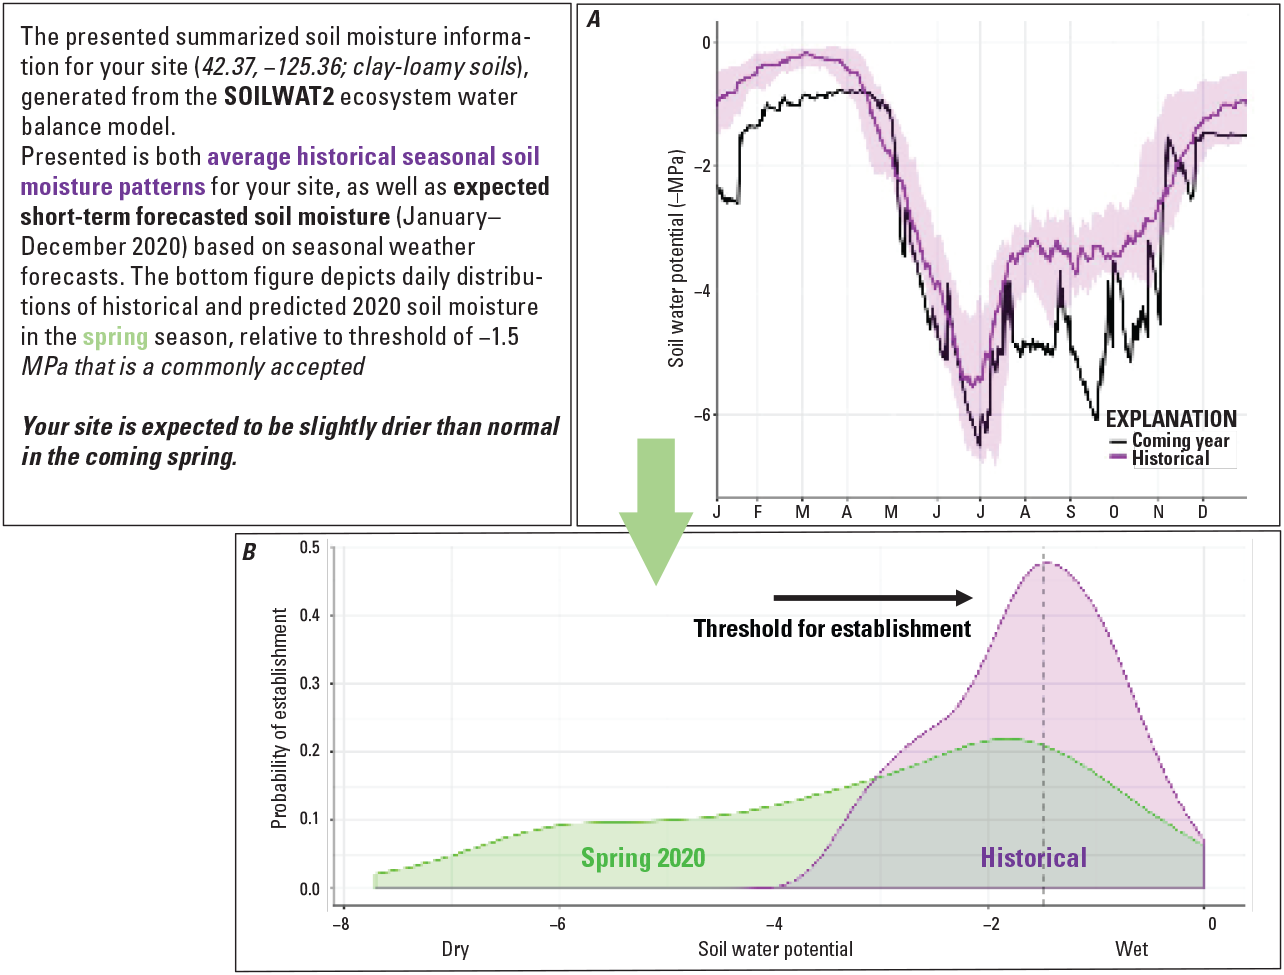
Screenshot of the Land Treatment Exploration Tool, showing the incorporated short-term forecasts of soil moisture for a specific site. A, Graph showing one trend line with average historical soil moisture (purple) and one trend line with expected short-term forecast (black) plotted against month of the year (January–December). B, Soil water potential graph that depicts distributions of historical (purple shading) and predicted (green shading) spring soil moisture, indicating that it will likely be drier than normal. The vertical dashed line indicates a species-specific establishment threshold. MPa, Megapascals.
“National Public Screening Tool for Invasive and Non-native Aquatic Species Data”
Principal Investigator—Wesley M. Daniel, wdaniel@usgs.gov (USGS)
Coinvestigator and partners—Gary Whelan (National Fish Habitat Partnership), Craig Martin (U.S. Fish and Wildlife Service), and Peter M. Ruhl (USGS)
Identifying the leading edge of a biological invasion can be difficult. Many management and research entities have biological samples or surveys that may unknowingly contain data on nonindigenous species. The new Nonindigenous Aquatic Species (NAS) database automated online tool “Screen and Evaluate Invasive and Non-native Data” (SEINeD) allows a user to search for occurrences of nonindigenous aquatic species quickly and easily. This new tool enables stakeholders to upload a dataset of fish, invertebrates, amphibians, reptiles, or aquatic plants collected anywhere in a U.S. state or territory and screen that data for non-native aquatic species occurrences. In addition, the tool checks for the nativity of species in the dataset as determined by the NAS database program. The tool also reviews the spatial accuracy of the given coordinates with the potential to flag erroneous global positioning system coordinates. The SEINeD tool and all required information about its use can be found on the NAS website (see “Related links” section), which became active in February 2020 (fig. 5; Daniel, 2019).
-
Related links—
-
• See project page at https://www.sciencebase.gov/catalog/item/5cd20414e4b09b8c0b7a59b7
-
• NAS website SEINed tool: https://nas.er.usgs.gov/SEINED/
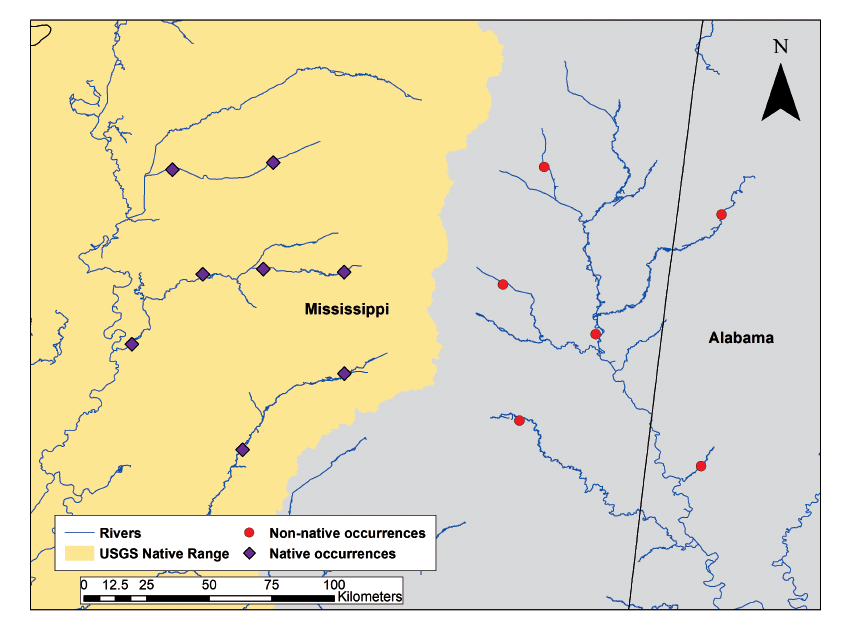
Screenshot of the Nonindigenous Aquatic Species (NAS) database map of species data after being processed by the “Screen and Evaluate Invasive and Non-native Data (SEINeD)” tool. The map shows an area on the Missisippi-Alabama border with native and non-native species occurrences (from Daniel, 2019). N, north; USGS, U.S. Geological Survey.
“High-Resolution, Interagency Biosurveillance of Threatened Surface Waters in the United States”
Principal Investigator—Sara L. Eldridge, seldridge@usgs.gov (USGS)
Coinvestigator and partners—Josh Gage (Gage Cartographics), Elliott P. Barnhart (USGS), and Adam J. Sepulveda (USGS)
Advances in information technology now provide large volume, high-frequency data collection that may improve real-time biosurveillance and forecasting. These big data streams present challenges for data management and timely analysis. As a first step in creating a data science pipeline for translating large datasets into meaningful interpretations for evidence-based decision making, the project team created a cloud-hosted PostgreSQL database. The database collates climate data served from the Parameter elevation Regression on Independent Slopes Model (PRISM; available at https://climatedataguide.ucar.edu/climate-data/prism-high-resolution-spatial-climate-data-united-states-maxmin-temp-dewpoint) and water-quality data from the National Water Quality Portal (available at https://www.waterqualitydata.us/) and the National Water Information System (available at https://waterdata.usgs.gov/nwis or https://doi.org/10.5066/F7P55KJN; fig. 6). Using Python-based code, these data streams are queried and updated every 24 hours, and the spatial and temporal components of these data are delineated by the locations and frequencies of environmental deoxyribonucleic acid (eDNA) sampling (for example, Tetracapsuloides, bryosalmonae, freshwater parasite, and Escherichia coli) at USGS streamgages in the Yellowstone River, Montana. Following additional processing, the data are formatted for Bayesian hierarchical occupancy analysis to estimate eDNA detection probabilities and to relate these probabilities to attributes from the different data streams.
-
Related links—
-
• See project page at https://www.sciencebase.gov/catalog/item/5cd2055ee4b09b8c0b7a59ba
-
• PostgreSQL database: https://aiswaterquality.net/cdi
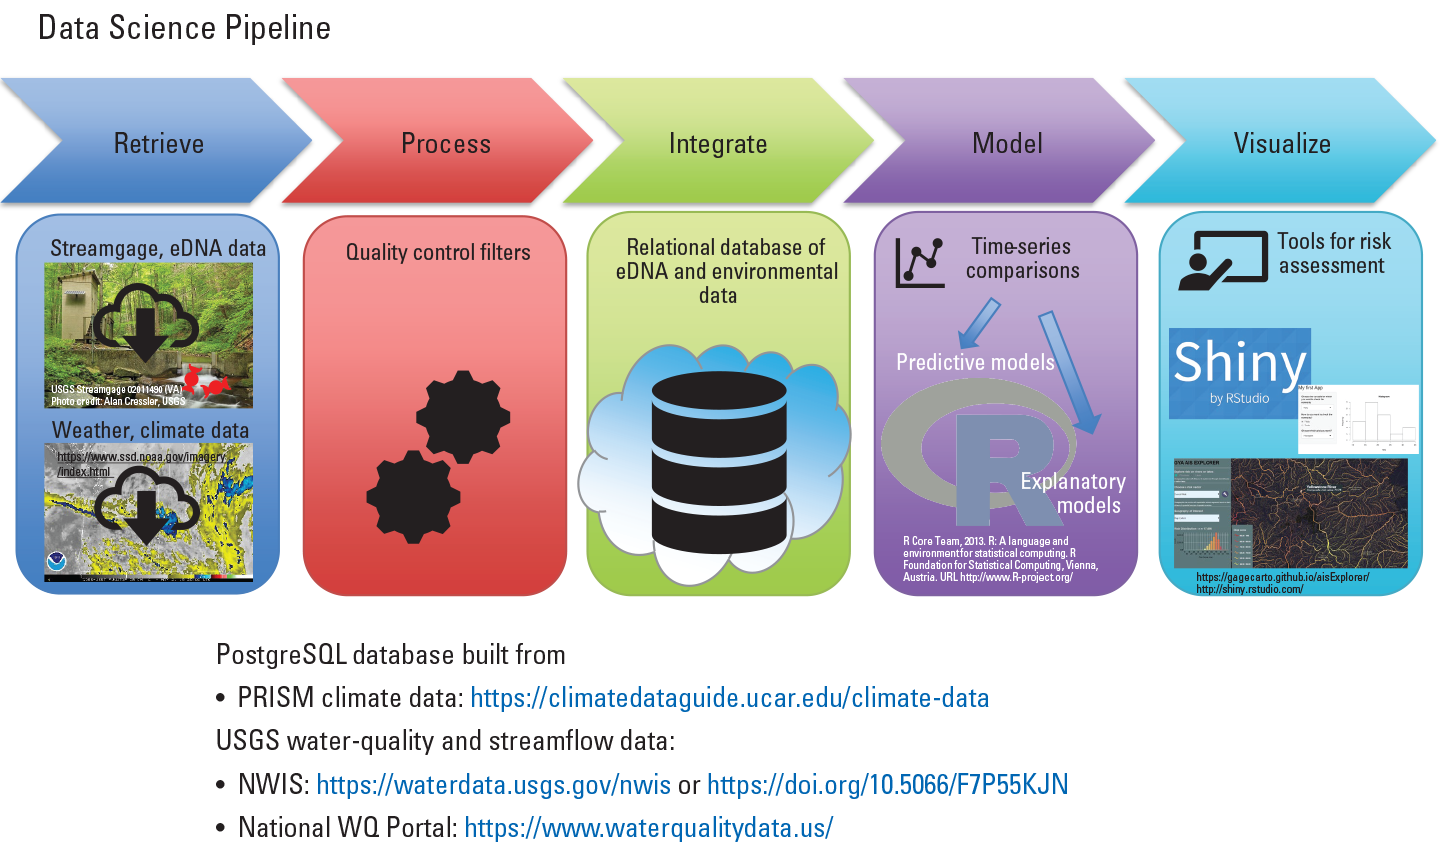
Representation of the data science pipeline used to create a Digital Ocean PostgreSQL database for users to synthesize and analyze large and disparate environmental data streams. eDNA, environmental DNA; NWIS, National Water Information System; PRISM, Parameter elevation Regression on Independent Slopes Model; USGS, U.S. Geological Survey; WQ, water quality.
“Develop Cloud Computing Capability at Streamgages using Amazon Web Services GreenGrass Internet of Things Framework for Camera Image Velocity Gaging”
Principal Investigator—Frank L. Engel, fengel@usgs.gov (USGS)
Coinvestigator and partners—Antoine Patalano (Consejo Nacional de Investigaciones Cientificas y Técnicas (CONICET [National Council for Scientific and Technical Research]), C. Marcelo Garcia (National University of Córdoba, Centro de Estudios de Tecnología de la Arquitectura [Center for Architecture Technology Studies]), John Parks (USGS), Jennifer Erxleben (USGS), Jay Cederberg (USGS), and David Donato (USGS)
As of 2018, the USGS maintained a network of 10,330 real-time streamgages in the United States, Puerto Rico, and Virgin Islands (Eberts and others, 2019). This network includes hundreds of cameras installed at or near streamgages for a variety of uses. Most of these cameras transmit images or video to a local water science center information technology infrastructure, creating hundreds of files that need to be managed. Current imagery related information technology infrastructure varies but may include on-premises or distributed computer hardware and software for managing incoming camera data. This information technology infrastructure is generally not interlinked, uses varied and inconsistent software and hardware, and does not undergo enterprise cybersecurity and architecture review or oversight. As such, the need for a consistent, cloud-based approach for managing camera-based imagery data and metadata was identified as a priority need for the USGS Water Resources Mission Area.
To meet this need, the project team developed an Internet of Things (IoT) prototype and associated cloud infrastructure for camera-based data collection and initial processing of river streamflow using the cloud. The pilot successfully created a hardware and cloud infrastructure to collect and upload video from a camera gage at San Pedro Creek in San Antonio, Texas (fig. 7). Using a ThingLogix Foundry instance in the Amazon Webservices Cloud, the project team has created a cloud framework that can auto provision new camera-based gaging equipment, as well as process incoming videos into image frames for the computation of streamflow. Additionally, the team began testing of serving timeseries data from a camera gage (for example, water level and central processing unit temperature) using real-time telemetry. These data are displayed in a secure web dashboard that was developed within ThingLogix Foundry. This preliminary work has been expanded and will incorporate several camera-enabled gages in the Water Mission Area Next Generation Water Observing Systems Delaware River Basin.
-
Related links—
-
• See project page at https://www.sciencebase.gov/catalog/item/5cd2063ae4b09b8c0b7a59bd
-
• San Pedro Creek at Furnish Street, San Antonio, Texas streamgage: https://waterdata.usgs.gov/tx/nwis/uv/?site_no=08178500&PARAmeter_cd=00065,00060 and https://waterdata.usgs.gov/monitoring-location/08178500/#parameterCode=00065&period=P7D
-
• Delaware River Basin dashboard: https://webapps.usgs.gov/odrm/
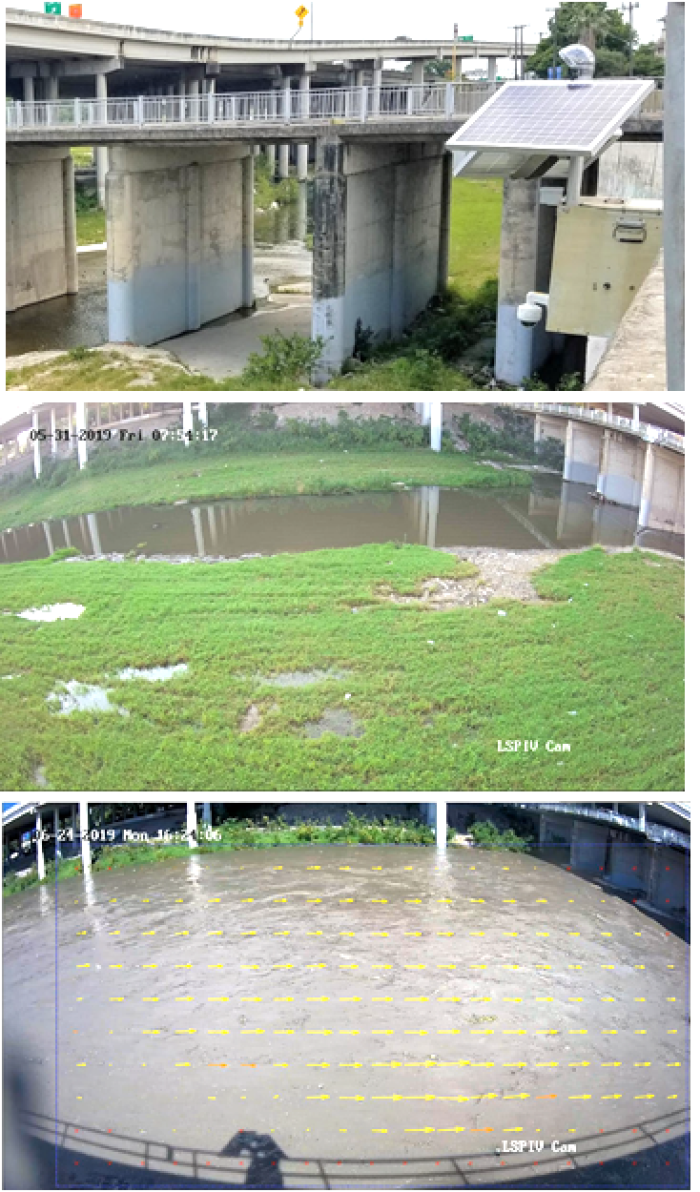
Ground photos (modified from Engel, 2019) of the installed equipment (top) and two example camera feed images (bottom two).
“Serving the U.S. Geological Survey’s Geochronological Data”
Principal Investigators—Amy K. Gilmer, agilmer@usgs.gov, and Leah E. Morgan, lemorgan@usgs.gov (USGS)
Coinvestigator and partners—Noah M. McLean (The University of Kansas), and David R. Soller (USGS)
Geochronological data provide essential information necessary for understanding the timing of geologic processes and events, as well as quantifying rates and timescales key to geologic mapping, mineral and energy resources, and hazard assessments. The USGS National Geochronological Database contains over 30,000 radiometric ages, but no formal update has occurred in over 20 years.
The project team developed a database with a web-based user interface and sustainable workflow to host all USGS-generated geochronological data. This new geochronological database consists of (1) data from the existing National Geochronological Database, (2) data generated by the USGS and published in the literature, and (3) more recent data extracted from ScienceBase tables using automated scripts to migrate the data into the new database. The project ensures that valuable legacy and recently generated data are discoverable and usable by the scientific community. The database also provides a template for state geological surveys to integrate their data with the new database, enhancing this national dataset (fig. 8; Gilmer, 2019).
-
Related links—
-
• See project page at https://www.sciencebase.gov/catalog/item/5cd2e8dfe4b09b8c0b7a5c53
-
• National Geochronological Database (NGDB)
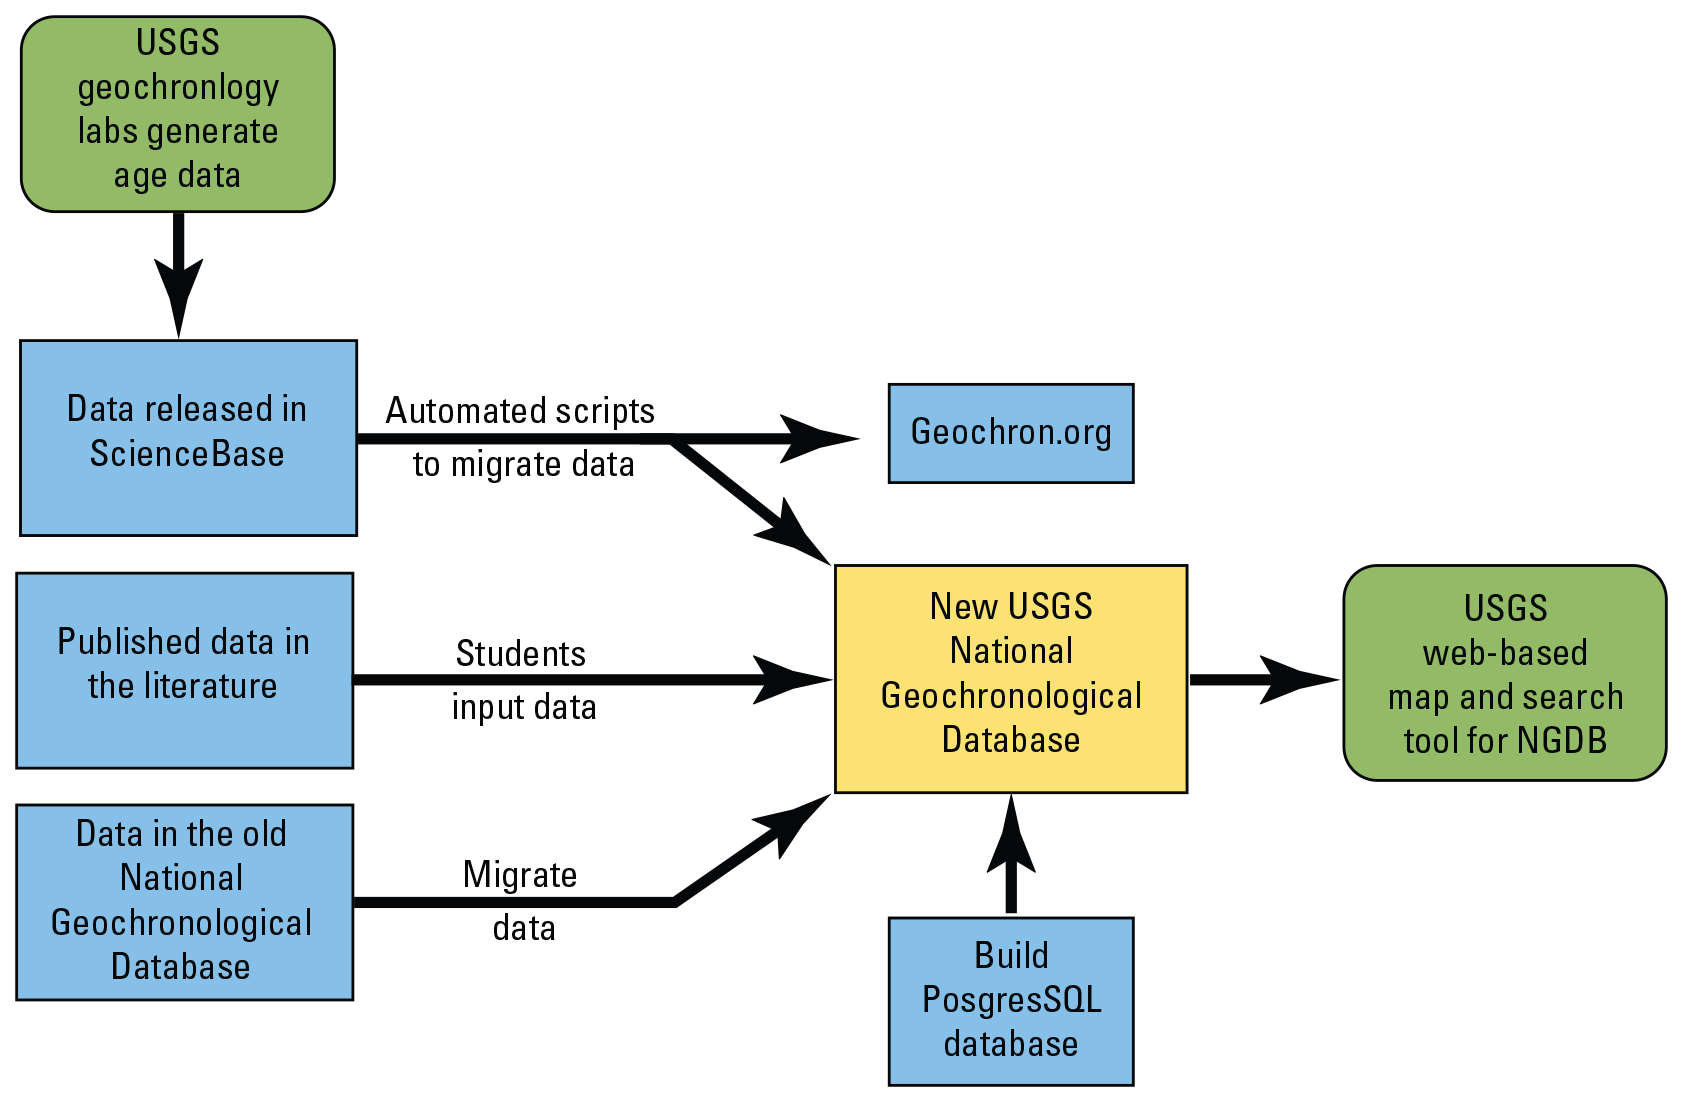
Project workflow (from Gilmer, 2019) showing how different vintages of geochronological data can be integrated and served with the new National Geochronological Database (NGDB). USGS, U.S. Geological Survey.
“Establishing Standards and Integrating Environmental DNA (eDNA) Data into the U.S. Geological Survey Nonindigenous Aquatic Species Database”
Principal Investigator—Margaret E. Hunter, mhunter@usgs.gov (USGS)
Coinvestigator and partners—Jason A. Ferrante (USGS), Matthew E. Neilson (USGS), and Wesley M. Daniel (USGS)
Testing environmental deoxyribonucleic acid (eDNA) allows for high-sensitivity monitoring efforts of cryptic species in large, remote systems and is performed by investigating water and soil samples for sloughed DNA. Having access to eDNA datasets across multiple taxa and ecosystems can improve coordination among researchers and management. The team has been working within the invasive species and eDNA communities to produce a conservative set of standards to verify eDNA geospatial occurrence data. This process will make it possible for eDNA data to be displayed on the USGS Nonindigenous Aquatic Species (NAS) database, which currently maps and displays visual identification or physical capture data for non-native aquatic species (fig. 9). The final product is an online map displaying both visual and eDNA data detections for a target invasive species, which allows for improved predictions of species spread and corridor use.
-
Related links—
-
• See project page at https://www.sciencebase.gov/catalog/item/5cd2e991e4b09b8c0b7a5c56
-
• Publication: https://doi.org/10.3391/mbi.2022.13.4.15 (Ferrante and others, 2022)
-
• The USGS NAS database: https://nas.er.usgs.gov/
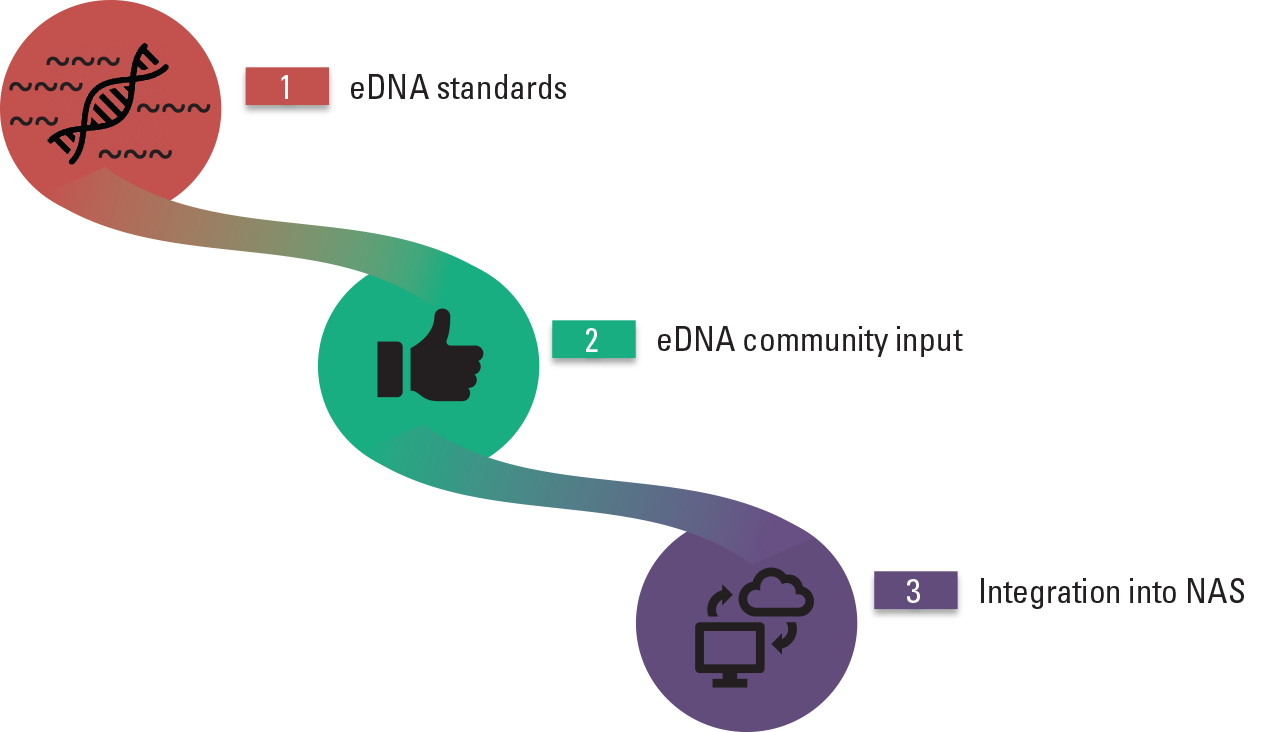
Flow diagram (from Hunter, 2019) illustrating the development of community consensus derived standards for submission and public display of environmental deoxyribonucleic acid (eDNA) data on the U.S. Geological Survey Nonindigenous Aquatic Species (NAS) database.
“Subsidence Susceptibility Map for the Conterminous United States”
Principal Investigator—Jeanne M. Jones, jmjones@usgs.gov (USGS)
Coinvestigator and partners—Daniel H. Doctor (USGS), Nathan J. Wood (USGS), Jeff T. Falgout (USGS), and Natalya I. Rapstine (USGS)
Subsidence is the sinking of the land surface caused by natural or human processes. Our project examined subsidence in the form of sinkholes that form naturally in areas of karst geology. Sinkholes present hazards by creating instability in the foundations of buildings, roads, and other infrastructure, resulting in damage and in some cases, loss of life. This project created a prototype nationwide subsidence susceptibility map using established USGS research, existing USGS authoritative data (National Elevation Dataset, National Hydrography Dataset), and innovative processing techniques using the USGS Yeti supercomputer. The project team created a national dataset of sinkhole features and a heatmap of regions characterized by dense clustering of sinkholes in karst areas across the conterminous United States (fig. 10). These datasets can be used for (1) assessment of sinkhole hazard susceptibility to infrastructure, (2) analysis of sinkholes for groundwater contamination and recharge, and (3) identification of sinkholes as landscape resources in sensitive ecosystems.
-
Related links—
-
• See project page at https://www.sciencebase.gov/catalog/item/5cd2ea33e4b09b8c0b7a5c59
-
• Conference paper: https://doi.org/10.5038/9781733375313.1003 (Doctor and others, 2020)
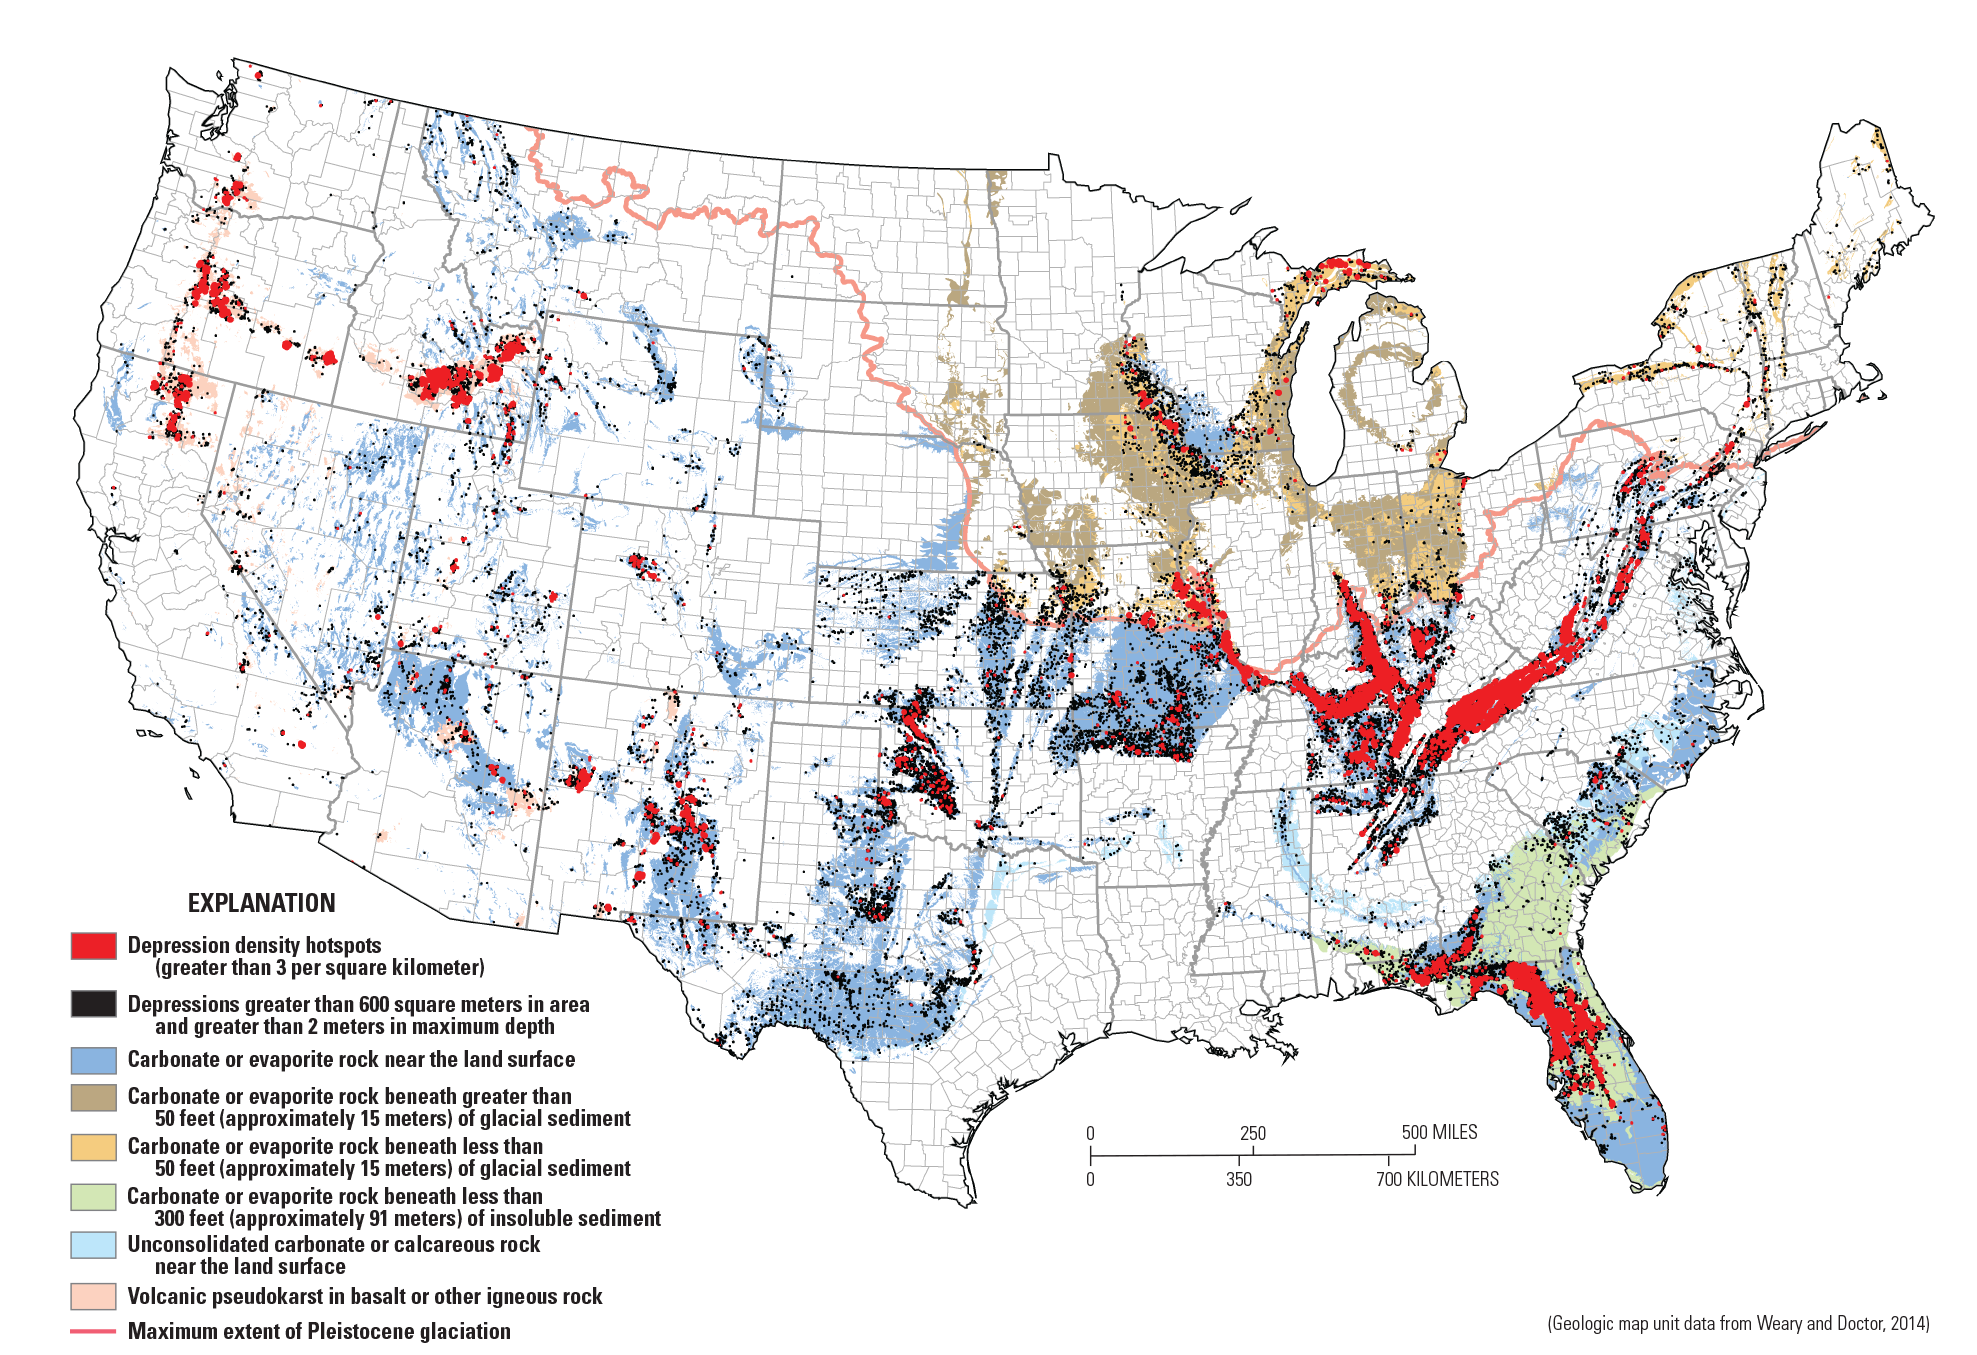
Map showing closed depression hot spots located in areas having bedrock potential for karst within the conterminous United States (from Doctor and others, 2020). Note the high density of depressions along the southern Atlantic coastal plain, in glaciated regions of the Midwest and northeastern United States, and in volcanic pseudokarst regions of the western United States (geologic map unit data from Weary and Doctor, 2014). Additional work would be beneficial to determine where in these regions the depressions result from karst processes versus other geomorphic processes.
“A Generic Web Application to Visualize and Understand Movements of Tagged Animals”
Principal Investigator—Benjamin H. Letcher, bletcher@usgs.gov (USGS)
Coinvestigator and partners—Jeff D. Walker (Walker Environmental Research LLC)
Animal tagging data are resource intensive. The tags themselves are expensive, and it takes a lot of time to tag and track the animals. The goal of this project was to maximize the value of existing animal tagging data. The project team developed an interactive web application to help scientists understand patterns in their own tagging datasets and to help scientists, funders, and agencies communicate information from tagging data to decision-makers and the general public. Interactive visualizations have recently emerged as a valuable tool for identifying patterns in complex datasets that are typical of ecological tagging studies. To make it easier and faster for users to gain access to interactive movement visualizations, the team developed the algorithms and web-based software platform to allow users to upload their own data into a data visualization showing dynamic movement of tagged individuals across habitats (fig. 11). The algorithms were developed to be flexible enough to accommodate any animal tagging data and provide a user-friendly interface that encourages users to learn about their data. Six test cases were used, ranging from one-dimensional networks to three-dimensional habitats, to test the application and to get feedback from data owners on application usability.
-
Related links—
-
• See project page at https://www.sciencebase.gov/catalog/item/5cd30962e4b09b8c0b7a5cad
-
• Tagged Animal Movement Explorer: https://www.usgs.gov/apps/ecosheds/tame/
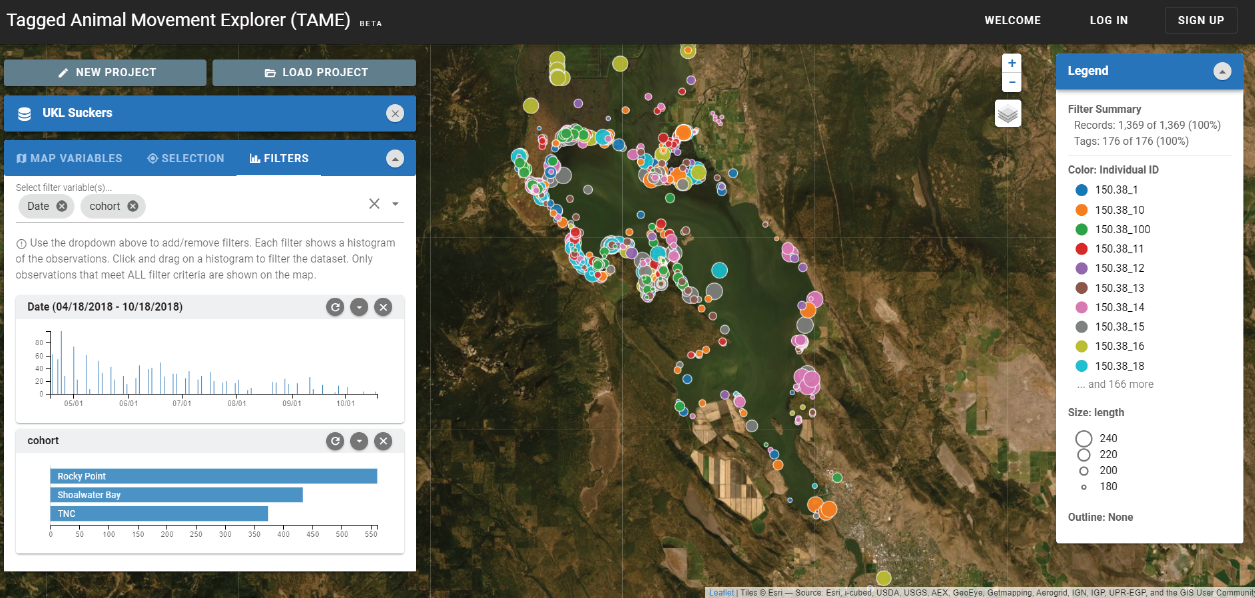
Screenshot of the Tagged Animal Movement Explorer (TAME) web interface showing locations of tagged fish in Upper Klamath Lake, Oregon (from Letcher, 2019). Individual fish are coded by color, and their body size in millimeters is coded by circle radius. Interactive filters for any variable in the dataset are in the panel on the left. Filtering allows dynamic selection of data subsets, for example, filtering by date selects observations within a time window. ID, identification; TNC, The Nature Conservancy.
“Building a Roadmap for Making Data Findable, Accessible, Interoperable, and Reusable (FAIR) in the U.S. Geological Survey”
Principal Investigator—Frances L. Lightsom, flightsom@usgs.gov (USGS)
Coinvestigator and partners—Bradley Wade Bishop (University of Tennessee), Shelley Stall (American Geophysical Union), Vivian B. Hutchison (USGS), Natalie Latysh (USGS), Linda M. Debrewer (USGS), and David L. Govoni (USGS, Emeritus)
FAIR is an international set of principles for improving the findability, accessibility, interoperability, and reusability (FAIR) of research data and other digital products. The project team planned and hosted a workshop of USGS stakeholders, scientists, data experts, and managers of USGS data systems from across the Bureau (fig. 12). Workshop participants shared case studies that fostered collaborative discussions, resulting in recommended actions and goals to make USGS research data align with FAIR. The project team is using the workshop results to produce a roadmap for adopting FAIR principles in the USGS.
The FAIR roadmap was foundational to the fiscal year 2021 CDI activities to ensure the persistence and usability of USGS-funded research products and to demonstrate successful data integration through application of FAIR principles.
-
Related links—
-
• See project page at https://www.sciencebase.gov/catalog/item/5cd30aade4b09b8c0b7a5cbb
-
• Publication of FAIR data roadmap (Lightsom and others, 2022): https://doi.org/10.3133/ofr20221043
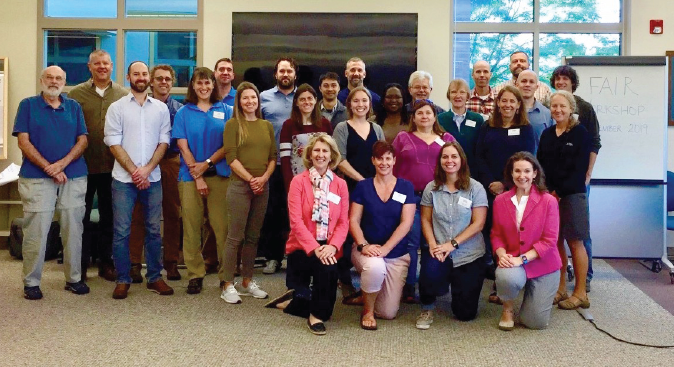
Photograph of participants in the findability, accessibility, interoperability, and reusability (FAIR) roadmap workshop at the John Wesley Powell Center for Analysis and Synthesis in Fort Collins, Colorado, September 9–11, 2019 (from Lightsom, 2019). Attendees included: Neil Baertlein, Tara Bell, Tom Burley, Linda Debrewer, Jon Dewitz, Angie Diefenbach, Jason Ferrante, David Govoni, Michelle Guy, Viv Hutchison, Drew Ignizio, Mikki Johnson, Keith Kirk, Natalie Latysh, Fran Lightsom, Tom Murray, Daniel Pearson, Emily Read, Carma San Juan, Jason Sherba, Rich Signell, Chris Skinner, Nancy Sternberg, Roland Viger, and Lisa Zolly from USGS, Wade Bishop from University of Tennessee, Ray Plante from National Institute of Standards and Technology, and Shelley Stall from American Geophysical Union. Photograph by Leah Colasuonno (USGS).
“Coupling Hydrologic Models with Data Services in an Interoperable Modeling Framework”
Principal Investigator—Richard McDonald, rmcd@usgs.gov (USGS)
Coinvestigator and partners—Mark Piper (University of Colorado), Eric Hutton (University of Colorado), Steve Markstrom (USGS), and Parker Norton (USGS)
Computational models are important tools that aid process understanding, hypothesis testing, and data interpretation. The ability to easily couple models from various domains, such as from surface-water and groundwater models, advances water resources research by allowing multiple parameters to be examined together. This project investigated the use of the Community Surface Dynamics Modeling System Modeling Framework (CMF) to couple existing USGS hydrologic models into integrated models. The CMF provides a Basic Model Interface (BMI) in a range of common computer languages that enables model coupling. The CMF also provides a Python wrapper for any model that adopts the BMI. In this project, the Precipitation-Runoff Modeling System (PRMS) was split into four BMIs for the following domains: surface, soil, groundwater, and streamflow. In a simple test of the CMF coupling ability, the four domain BMIs were coupled into a single model and successfully compared with PRMS itself (fig. 13; McDonald, 2019).
-
Related links—
-
• See project page at https://www.sciencebase.gov/catalog/item/5cd30b8de4b09b8c0b7a5cc1
-
• FORTRAN BMIs developed from PRMS6
-
• bmi-prms6-surface: https://code.usgs.gov/wma/national-iwaas/nhm/prms-bmi/bmi-prms6-surface
-
• bmi-prms6-soil: https://code.usgs.gov/wma/national-iwaas/nhm/prms-bmi/bmi-prms6-soil
-
• bmi-prms6-groundwater: https://code.usgs.gov/wma/national-iwaas/nhm/prms-bmi/bmi-prms6-groundwater
-
• bmi-prms6-streamflow https://code.usgs.gov/wma/national-iwaas/nhm/prms-bmi/bmi-prms6-streamflow
-
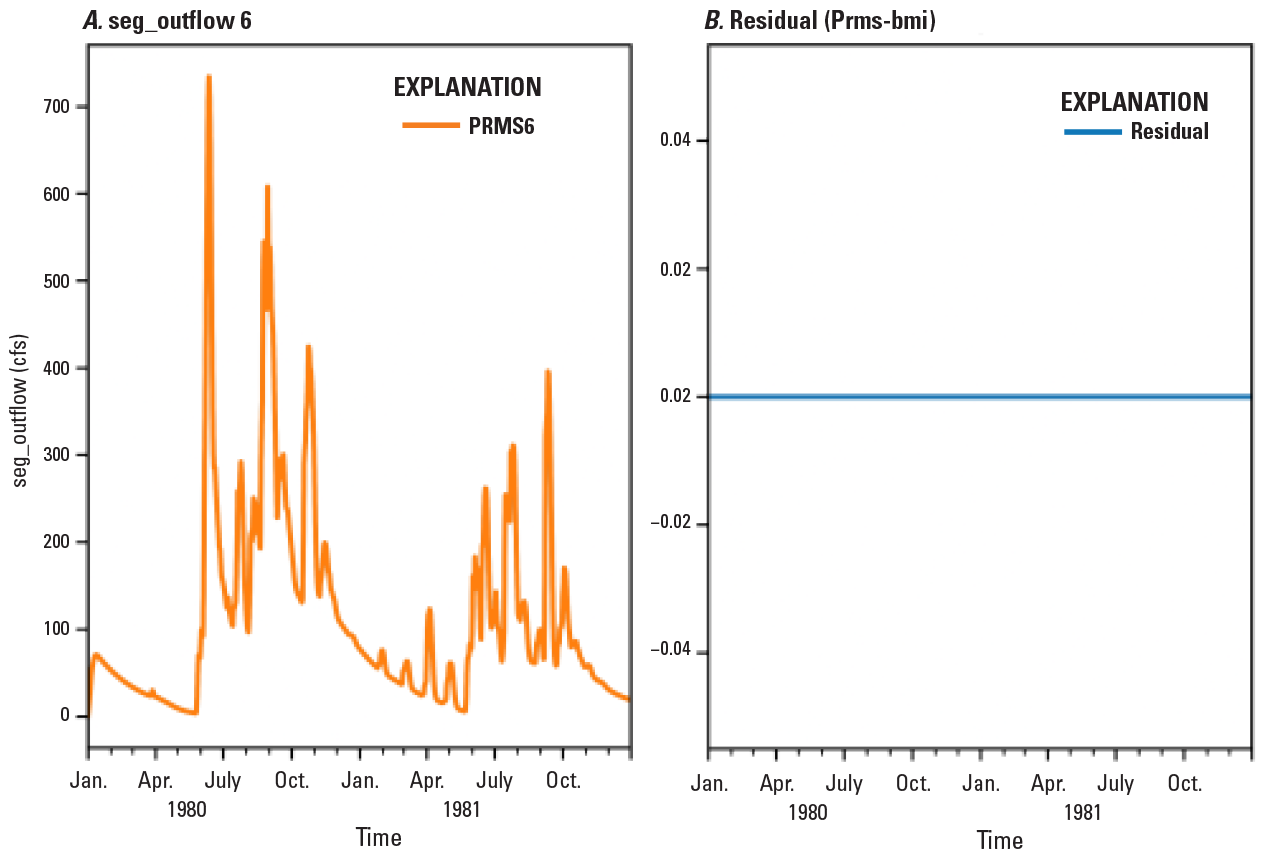
Screenshot (modified from McDonald, 2019) of example output from a FORTRAN program that couples the four PRMS6 basic model interfaces (BMIs). For the last stream segment in the model, the resulting segment outflow is compared to PRMS6 and shows the coupled outflow equals the PRMS6 outflow. Apr, April; cfs, cubic feet per second; Jan, January; Jul, July; Oct, October; seg, segment.
“GrassCast: Implementing a Grassland Productivity Forecast Tool for the United States Southwest”
Principal Investigator—Sasha C. Reed, screed@usgs.gov (USGS)
Coinvestigator and partners—Bill K. Smith (University of Arizona), Brian A. Fuchs (National Drought Mitigation Center), Bill A. Parton (Colorado State University), Emile H. Elias (U.S. Department of Agriculture Southwest Climate Hub), and Brian D. Wardlow (Center for Advanced Land Management Information Technologies)
Rangeland systems are some of our Nation’s largest providers of agro-ecological services, sustaining plant productivity that is highly variable across seasons and years. The ability to predict rangeland productivity of the next growing season has enormous economic and management value for making decisions about cattle stocking rates, fire, restoration, and wildlife. However, the ability to provide these forecasts to stakeholders has remained inadequate. New remote sensing and modeling technologies allow for substantial improvements to near-term forecasts of rangeland productivity. The multidisciplinary project team has shown that, compared with traditional remote sensing greenness indices, near-infrared reflectance of terrestrial vegetation-based productivity assessments are a large improvement. The project team has joined this new remote sensing product with productivity models to create a forecasting toolkit for the southwestern United States (fig. 14). The larger goal is an online tool that integrates remote sensing, climate, and modeling data to visualize and forecast grassland and rangeland productivity for the upcoming growing season (Reed, 2019).
On May 14, 2020, a virtual stakeholder and collaborator meeting was held to discuss GrassCast Southwest with partners, clients, and stakeholders. The half-day, virtual event had over 80 participants from the Bureau of Land Management, the Bureau of Indian Affairs, and the U.S. Fish and Wildlife Service (Department of the Interior), and from the National Resources Conservation Service (U.S. Department of Agriculture). Participants showed exceptional interest and had suggestions for improving this powerful tool. An online beta application of GrassCast Southwest is available and being tested by key stakeholders. The application will be improved based on stakeholder feedback. A quarterly virtual meeting for collaborators working on similar topics has been scheduled to share expertise and look for additional opportunities.
-
Related links—
-
• See project page at https://www.sciencebase.gov/catalog/item/5e5d7809e4b01d50924f2d79
-
• Grass-Cast: https://grasscast.unl.edu/
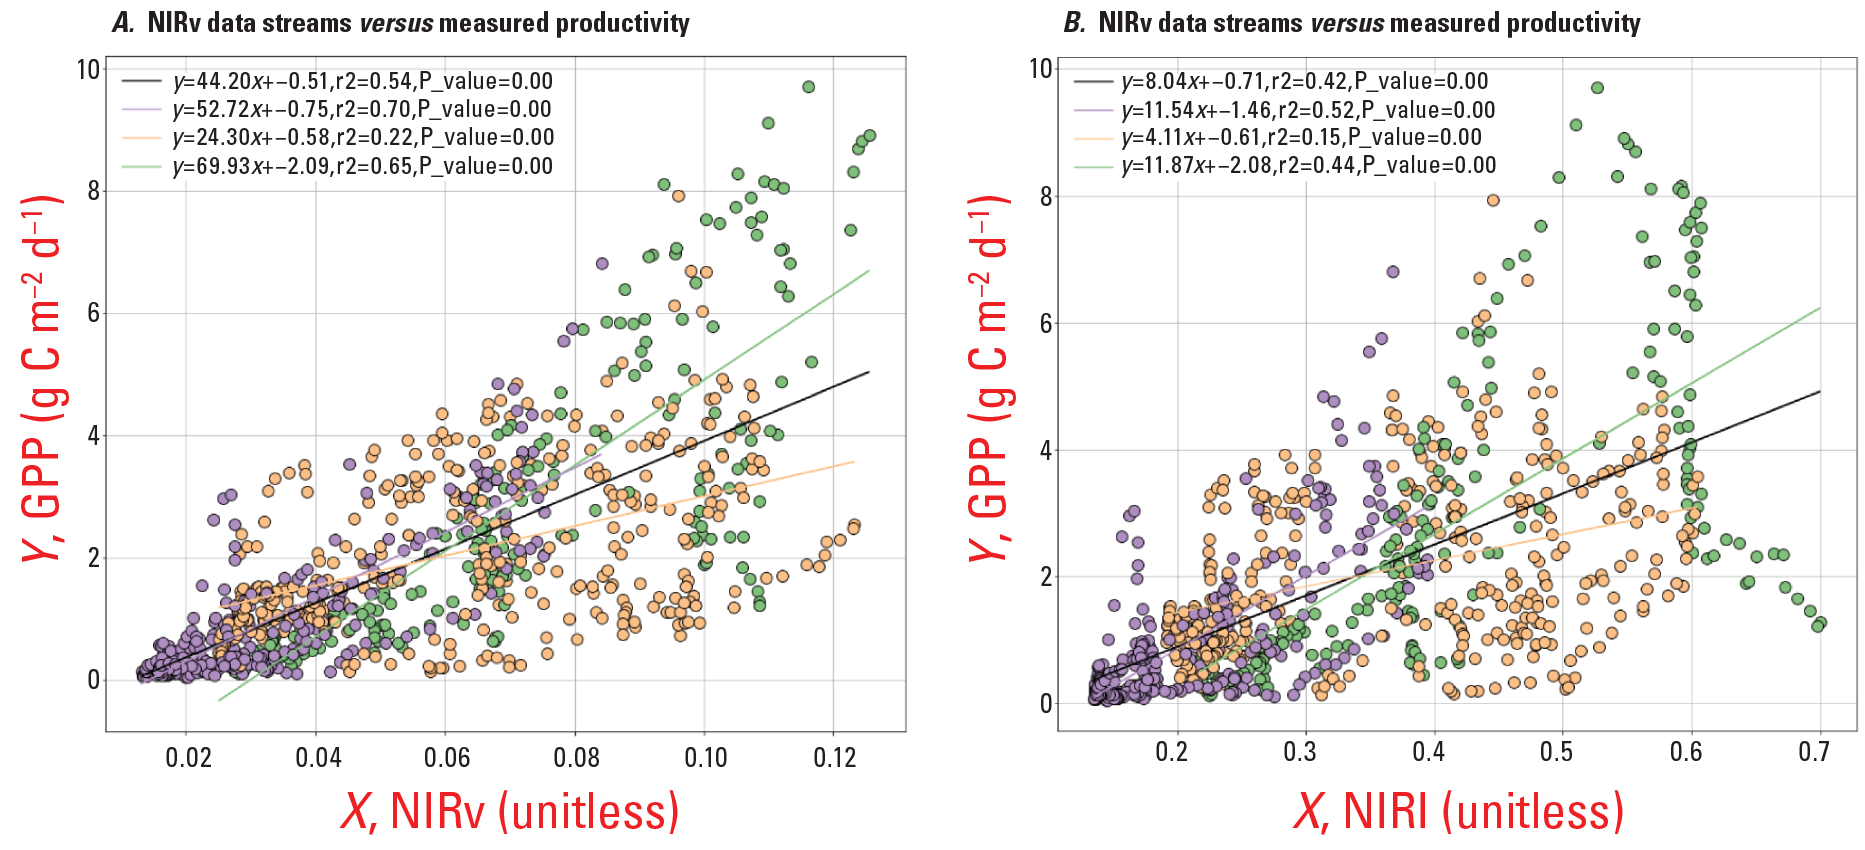
The graphs show that, for diverse dryland ecosystems, A, Near-infrared reflectance of terrestrial vegetation (NIRv) remote sensing data may be a better tool for assessing dryland plant productivity compared with B, traditional remote sensing greenness indices (Normalized Difference Vegetation Index). Accordingly, the use of near-infrared reflectance of terrestrial vegetation data products could substantially improve near-term forecasts of plant productivity for grasslands and rangelands of the southwestern United States (gross primary productivity, GPP). Gross primary producticity data (available at https://grasscast.unl.edu/) are from eddy covariance tower sites in the southwestern United States and link assessments of GPP with remotely sensed data. Colors and regression lines represent the types of ecosystems: Purple symbols are grassland sites; Orange symbols are savanna/shrubland sites; and green symbols are evergreen forest sites. Black lines represent regressions where all data are included. g C m-2 d-1, grams of carbon per square meter per day; r2, coefficient of determination.
Conclusion
Community for Data Integration projects in fiscal year 2019 covered a wide variety of themes, including projects involving remote sensing, grassland productivity forecasting, subsidence susceptibility, FAIR data, climate projections, hazards mitigation, biosurveillance, non-native and invasive species, cloud computing, environmental deoxyribonucleic acid (eDNA), and internet of things (IoT). Outputs from these projects ranged from code repositories and publications to web applications and web services. CDI releases a request for proposals each year. CDI projects from every fiscal year beginning in 2010 can be viewed at https://www.usgs.gov/centers/community-for-data-integration-cdi/science/all-funded-projects.
References Cited
Bamzai-Dodson, A., 2019, Open-source and open-workflow climate futures toolbox for adaptation planning: U.S. Geological Survey ScienceBase Catalog web page, accessed September 21, 2022, at https://www.sciencebase.gov/catalog/item/5cd1ff88e4b09b8c0b7a59a2.
Blehert, D.S., 2019, Transforming biosurveillance by standardizing and serving 40 years of wildlife disease data: U.S. Geological Survey ScienceBase Catalog web page, accessed September 21, 2022, at https://www.sciencebase.gov/catalog/item/5cd200d6e4b09b8c0b7a59ac.
Daniel, W.M., 2019, National public screening tool for invasive and non-native aquatic species data: U.S. Geological Survey ScienceBase Catalog web page, accessed September 21, 2022, at https://www.sciencebase.gov/catalog/item/5cd20414e4b09b8c0b7a59b7.
Doctor, D.H., Jones, J., Wood, N., Falgout, J., and Rapstine, N.I., 2020, Progress toward a preliminary karst depression density map for the conterminous United States, in Land. L., Kromhout, C., and Byle, M., eds., Proceedings of the 16th Multidisciplinary Conference on Sinkholes and the Engineering and Environmental Impacts of Karst, San Juan, Puerto Rico April 20–24, 2020: National Cave and Karst Research Institute, accessed November 6, 2020, at https://doi.org/10.5038/9781733375313.1003.
Engel, F.L., 2019, Develop cloud computing capability at streamgages using Amazon Web Services GreenGrass IoT framework for camera image velocity gaging: U.S. Geological Survey ScienceBase Catalog web page, accessed September 21, 2022, at https://www.sciencebase.gov/catalog/item/5cd2063ae4b09b8c0b7a59bd.
Ferrante, J.A., Daniel, W.M., Freedman, J.A., Klymus, K.E., Neilson, M.E., Passamaneck, Y., Rees, C.B., Sepulveda, A., and Hunter, M.E., 2022, Gaining decision-maker confidence through community consensus: developing environmental DNA standards for data display on the USGS Nonindigenous Aquatic Species database: Management of Biological Invasions, v. 13 no. 4, p. 809–832, accessed September 21, 2022, at https://doi.org/10.3391/mbi.2022.13.4.15.
Gilmer, A.K., 2019, Serving the U.S. Geological Survey’s geochronological data: U.S. Geological Survey ScienceBase Catalog web page, accessed September 21, 2022, at https://www.sciencebase.gov/catalog/item/5cd2e8dfe4b09b8c0b7a5c53.
Hsu, L., and Liford, A.N., 2021, Community for data integration 2019 annual report: U.S. Geological Survey Open-File Report 2021–1016, 19 p., accessed April 12, 2022, at https://doi.org/10.3133/ofr20211016.
Hunter, M.E., 2019, Establishing standards and integrating environmental DNA (eDNA) data into the USGS Nonindigenous Aquatic Species database: U.S. Geological Survey ScienceBase Catalog web page, accessed September 21, 2022, at https://www.sciencebase.gov/catalog/item/5cd2e991e4b09b8c0b7a5c56.
Lightsom, F.L., 2019, Building a roadmap for making data FAIR in the U.S. Geological Survey: U.S. Geological Survey ScienceBase Catalog web page, accessed September 21, 2022, at https://www.sciencebase.gov/catalog/item/5cd30aade4b09b8c0b7a5cbb.
Lightsom, F.L., Hutchison, V.B., Bishop, B., Debrewer, L.M., Govoni, D.L., Latysh, N., and Stall, S., 2022, Opportunities to improve alignment with the FAIR Principles for U.S. Geological Survey data: U.S. Geological Survey Open-File Report 2022–1043, 23 p., accessed March 14, 2023, at https://doi.org/10.3133/ofr20221043.
Letcher, B., 2019, A generic web application to visualize and understand movements of tagged animals: U.S. Geological Survey ScienceBase Catalog web page, accessed September 21, 2022, at https://www.sciencebase.gov/catalog/item/5cd30962e4b09b8c0b7a5cad.
McDonald, R., 2019, Coupling hydrologic models with data services in an interoperable modeling framework: U.S. Geological Survey ScienceBase Catalog web page, accessed September 21, 2022, at https://www.sciencebase.gov/catalog/item/5cd30b8de4b09b8c0b7a5cc1
Reed, S., 2019, GrassCast SW—Implementing a grassland productivity forecast tool for the U.S. Southwest: U.S. Geological Survey ScienceBase Catalog web page, accessed September 21, 2022, at https://www.sciencebase.gov/catalog/item/5cd30cc7e4b09b8c0b7a5cc6.
Weary, D.J., and Doctor, D.H., 2014, Karst in the United States—A digital map compilation and database: U.S. Geological Survey Open-File Report 2014–1156, 23 p., accessed April 12, 2022, at https://doi.org/10.3133/ofr20141156.
Wickham, H., 2014, Tidy data: Journal of Statistical Software, v. 59, no. 10, p. 1–23, accessed September 21, 2022 https://doi.org/10.18637/jss.v059.i10.
Wood, N.J., Jones, J.M., Henry, K.D., Sherba, J.T., and Ng, P., 2018, CDI Risk Map: U.S. Geological Survey ScienceBase Catalog web page, accessed September 21, 2022, at https://www.sciencebase.gov/catalog/item/5b91a0c2e4b0702d0e808bb2.
Abbreviations
BMI
Basic Model Interface
CDI
Community for Data Integration
CMF
Community Surface Dynamics Modeling System Modeling Framework
eDNA
environmental deoxyribonucleic acid
FAIR
findable, accessible, interoperable, and reusable
IoT
Internet of Things
NAS
Nonindigenous Aquatic Species
SEINeD
Screen and Evaluate Invasive and Non-native Data
USGS
U.S. Geological Survey
WHISPers
Wildlife Health Information Sharing Partnership-event reporting system
Disclaimers
Any use of trade, firm, or product names is for descriptive purposes only and does not imply endorsement by the U.S. Government.
Although this information product, for the most part, is in the public domain, it also may contain copyrighted materials as noted in the text. Permission to reproduce copyrighted items must be secured from the copyright owner.
Suggested Citation
Liford, A.N., Andrews, C.M., Bamzai, A., Bard, J.A., Blehert, D.S., Bradford, J.B., Daniel, W.M., Eldridge, S.L., Engel, F., Ferrante, J.A., Gilmer, A.K., Hunter, M.E., Jones, J.M., Letcher, B., Lightsom, F.L., McDonald, R.R., Morgan, L.E., Reed, S.C., and Hsu, L., 2023, Community for Data Integration 2019 project report: U.S. Geological Survey Open-File Report 2022–1120, 17 p., https://doi.org/10.3133/ofr20221120.
ISSN: 2331-1258 (online)
| Publication type | Report |
|---|---|
| Publication Subtype | USGS Numbered Series |
| Title | Community for data integration 2019 project report |
| Series title | Open-File Report |
| Series number | 2022-1120 |
| DOI | 10.3133/ofr20221120 |
| Publication Date | April 17, 2023 |
| Year Published | 2023 |
| Language | English |
| Publisher | U.S. Geological Survey |
| Publisher location | Reston, VA |
| Contributing office(s) | Central Mineral and Environmental Resources Science Center, Core Science Analytics and Synthesis, Geosciences and Environmental Change Science Center, National Wildlife Health Center, Southwest Biological Science Center, Texas Water Science Center, Volcano Science Center, Western Geographic Science Center, Woods Hole Coastal and Marine Science Center, Wetland and Aquatic Research Center, Science Analytics and Synthesis |
| Description | vi, 17 p. |
| Online Only (Y/N) | Y |


