

Monitoring of Wave, Current, and Sediment Dynamics Along the Chincoteague Living Shoreline, Virginia
Links
- Document: Report (3.22 MB pdf) , HTML , XML
- Data Releases:
- NGMDB Index Page: National Geologic Map Database Index Page (html)
- Download citation as: RIS | Dublin Core
Acknowledgments
This report was prepared as a part of a multiple year project funded by the National Fish and Wildlife Foundation (project number 55032) to collect ecological data and models of living shoreline restoration projects for the effectiveness assessment of living shoreline structures across northeast and mid-Atlantic coasts. This study is conducted in collaboration with Northeastern University, U.S. Fish and Wildlife Service, The Nature Conservancy, Louisiana State University, and Shippensburg University. We are grateful to Mike Brownley (U.S. Geological Survey) and Reza Salatin (Northeastern University) for their assistance in field data collection and Leslie Valentine for laboratory analysis. We thank Davina L. Passeri and Melissa M. Baustian (U.S. Geological Survey) for their constructive reviews of this report.
Abstract
Nature-based features, also called living shorelines, are increasingly applied in coastal protection and restoration. However, the processes and mechanisms (feedbacks and interactions) of wave attenuation, current velocity change, and sediment deposition and erosion along the living shoreline remain unclear, thus limiting the adaptive management of living shoreline restoration projects for coastal shoreline resilience under future storm conditions. In this study, wave, current, and sediment dynamics along the Little Toms Cove living shoreline, Chincoteague National Wildlife Refuge, Virginia, a low wave energy environment, were investigated during a 2-month winter period in 2019 to examine the effects of living shoreline structures on shoreline protection and oyster habitat enhancement. It was found that wave attenuation by the living shoreline structures (oyster castles or constructed oyster reefs) is dependent on water depth, wind speed, wind direction, and local bathymetry. Analysis of observed data indicate that the oyster castles along the Little Toms Cove living shoreline play a limited role in wave attenuation in this low wave energy environment. During the 2-month winter period, wave energy was attenuated by 39.7 percent when oyster castles were emergent or slightly submerged with southwest winds. In contrast, when the oyster castles were fully submerged, wave energy behind the oyster castles increased by 38.6 percent. The construction of oyster castles affected circulation patterns with increase or decrease in velocity at nearshore waters protected by the castles depending on locations of measurements in relation to the oyster castles. Bottom shear stress analysis indicates that tidal currents play a larger role than waves on shoreline and marsh edge erosion along the Little Toms Cove shoreline during the 2 months of field monitoring. The oyster castles protecting the marsh edge and tidal flat from erosion resulted in higher fine sediment concentration in the water column landward of the castles because more sediment was retained in the lee side of the castles. It is important to maximize sediment within the wetlands and adjacent mudflats behind the oyster castles. Erosion from the marsh edge and interior serves as the major source of sediment for this wetland system due to the limited sediment supply in Assateague Channel. Furthermore, it was found that the oyster castles along the Little Toms Cove living shoreline were inundated more than 60 percent of the time, leading to the enhanced oyster habitat as evidenced by suitable velocity (less than 10 centimeters per second) and mean grain size (less than 0.08 millimeters) for oyster feeding and the increased oyster shell density and growth in the intertidal zone protected by the castles than in the control area. More field data (for example, concurrent monitoring of sediment concentration and salinity) over other seasons (for example, summer) could help examine the long term and combined engineering and ecological benefits of living shoreline restoration projects under seasonal and enhanced future storm conditions.
Introduction
Over the past 2 decades, natural or nature-based features (NNBF) have been used in coastal erosion control, water quality improvement, restoration of habitat for fish and wildlife species, and maintaining coastal processes and functions (Scyphers and others, 2011; Sutton-Grier and others, 2015; Sharma and others, 2016; Polk and Eulie, 2018; Safak and others, 2020; Morris and others, 2021). The shorelines protected by these NNBF are called living shorelines, and NNBF are also termed as living shoreline structures (LSS), soft structure, and green infrastructure. Coastal habitats include, but are not limited to, intertidal flats, salt marshes, beaches, and dunes. LSS are nature-based features. Many LSS such as oyster castles have been constructed along the U.S. northeast Atlantic coast after Hurricane Sandy (2012) to restore and protect coastal shorelines from damage of future storms (Abt Associates, 2019; Babson and others, 2020). Two primary goals of these living shoreline restoration projects were to mitigate shoreline erosion and to maintain or enhance critical habitat for economically and ecologically essential fish, shellfish, marine plants, and animals (Holcomb and Lusk, 2016; Sharma and others, 2016; Theuerkauf and others, 2017; Polk and Eulie, 2018; Chowdhury and others, 2019; Morris and others, 2019; Wiberg and others, 2019; Safak and others, 2020; Zhu and others, 2020; Morris and others, 2021). Materials for constructing LSS are diverse and include, but are not limited to, rocks, coir logs, shells, reef balls, and oyster castles. Oyster castles (a method for living shoreline restoration) are made of concrete blocks and assembled as constructed oyster reefs (COR).
LSS, especially COR, are intended for wave attenuation (Chowdhury and others, 2019; Wiberg and others, 2019; Safak and others, 2020; Zhu and others, 2020). Wave energy is a major driving force of coastal wetland lateral erosion (Marani and others, 2011; Leonardi and others, 2016). It is therefore assumed that the greater the amount of wave attenuation caused by the LSS, the greater the reduction of the erosion rates. Nevertheless, studies found that annual rates of coastal erosion in salt marshes behind LSS (for example, oyster reefs) could still be high compared with that using hard/gray infrastructures such as rock breakwaters (for example, Scyphers and others [2011]), suggesting that LSS may be effective in wave attenuation and erosion reduction and (or) sediment deposition under certain wind, wave, and tidal conditions, but may not be effective in other conditions such as high wave- and surge-induced overtopping, large tidal ranges, and deep water depth (Wiberg and others, 2019; Zhu and others, 2020; Morris and others, 2021). The efficacy of LSS in attenuating waves and thus reducing erosion is dependent upon not only the type, size (height and width), and layout (location, orientation, and assembly) of living structures, but also the wave conditions (incident wave height, period, and direction), water depth, tidal range, bathymetry, vegetation and soil features of the shore, and sediment texture of the tidal flat (Chowdhury and others, 2019; Wiberg and others, 2019; Zhu and others, 2020; Fivash and others, 2021; Wang and others, 2021). However, very few studies have examined the processes and mechanisms of wave and current attenuation by LSS, resulting in the lack of information and data on how much wave and current energy can be attenuated by LSS and under what conditions, and on the linkage of sedimentation and shoreline change with storm-induced wave and current dynamics. Such information is critical for the effectiveness assessment of the LSS and adaptive management of living shoreline restoration projects.
Furthermore, there is a tradeoff between maximum reduction of shoreline erosion and maximum growth of oyster and other fishery species for living shoreline restoration projects (Morris and others, 2019, 2021). This is because the duration and depth of inundation influence both wave attenuation and oyster recruitment, survival, and growth. To achieve the shoreline protection goal (reduction of erosion), LSS should be placed nearshore at a vertical position higher than the mean sea level and with the crest elevation similar to or higher than the vegetation platform along the shore to keep LSS emergent greater than (>) 50 percent of the time. This is due to the large decrease in LSS capacity in wave energy attenuation when the LSS are submerged. For example, it was found that significant wave height can be reduced by as much as 52 percent from an offshore wave gage location to a site behind an oyster castle along Gandys Beach, New Jersey, when the oyster castles were emergent in contrast to less wave height reduction or even increase in wave height when the oyster castles were submerged (Zhu and others, 2020; Wang and others, 2021; Bredes and others, 2022). Conversely, to create the most suitable habitat, oyster reef based LSS should be placed in the lower spectrum of the intertidal zone to ensure that the structure is submerged >50 percent of the time. For eastern oyster (Crassostrea virginica) along the east coast of the United States, a 60–80 percent inundation is required for optimal oyster recruitment, survival, and growth (Morris and others, 2021). A greater submergence time can enhance feeding, and therefore growth of oysters, and reduce desiccation stress (Solomon and others, 2014; Marshall and La Peyre, 2020; Morris and others, 2021). Therefore, the location, configuration, orientation, and three-dimensional features (crest, width, and length) of oyster reef based LSS in relation to water depth could affect the realization of optimal ecological benefits of living shoreline restoration projects, which are to reduce erosion by wave attenuation and sediment trapping and to enhance oyster production by providing optimal conditions for oyster recruitment, survival, and growth.
A living shoreline restoration project on the Virginia coast was studied to analyze the effects of oyster castles on waves, current patten, and sedimentation. The specific research objectives were to (1) conduct field measurements of wave and current regimes and sedimentation with and without LSS, (2) understand the magnitude, mechanism, and processes in controlling wave, current, and sediment dynamics, (3) understand the processes of sediment deposition and erosion and the linkage between sediment dynamics (erosion, transport, and deposition) and varying wave and current actions along the living shoreline, and (4) examine the potential relationship between hydrodynamic-geomorphological forces (wave, current, and sediment dynamics) and oyster population dynamics. Data and information provided by this study can be useful for the assessment of the effectiveness of living shoreline restoration projects along the east coast and the implementation of new and optimal LSS design under future climate change and rising sea level.
Methods
Site Description
The U.S. Fish and Wildlife Service, The Nature Conservancy, and Virginia Marine Resources Commission constructed 3,550 linear feet (1,082 meters [m]) of living shoreline using oyster castles at Little Toms Cove and Assateague Bay, Chincoteague National Wildlife Refuge, Virginia (fig. 1A, B), in 2016 (Holcomb and Lusk, 2016). Toms Cove covers about 8 square kilometers and is a shallow embayment with an average depth of 2.5 m and salinity of approximately (~) 28 parts per thousand (fig. 1B). Tide is semidiurnal with a tidal range of about 0.7 m near the Chincoteague Inlet. The oyster castles at the Little Toms Cove within Toms Cove (fig. 1C, D) were selected for this study after a site visit in July 2017. The criteria for selecting a representative living shoreline section included (1) the presence of an elevation gradient for capturing wave transformation from offshore to nearshore with oyster castles, (2) the existence of a control area along the shore that has similar wind/wave fields and bathymetric features to the shoreline protected by the oyster castles but no oyster castles implemented on ground, (3) the presence of a shoreline with salt marshes well distributed and protected by the oyster castles, and (4) a location outside of Virginia Marine Resources Commission’s shellfish ground lease boundaries.
Each oyster castle consists of 28 four-pronged concrete blocks (0.3 m x 0.3 m) and acts as an artificial oyster reef to provide a substrate for oyster spat to settle and grow (fig. 1D). It measures approximately 1.9 m long, 0.7 m wide, and 0.5 m tall, and is composed of three stacked layers of concrete blocks. There are around 70 oyster castles at the study site (fig. 1C). These oyster castles were constructed in two staggered rows with a distance of ~0.7 m between them. The two rows of oyster castles run parallel to the marsh edge with an average to-marsh distance of ~10 m. There are gaps (~1.9 m) between two oyster castles in each row (fig. 1C). The double-row oyster castle layout blocks the direct exchange of tidal flow from southwest to marsh area, but still allows exchange of tidal flow through gaps between oyster castles and from directions such as southeast to marsh area.
These oyster castles were constructed to attenuate wave energy and to protect salt marsh from wind-wave and current-induced erosion, accumulate sediment, and reduce storm surge impact on vegetation distribution and growth and to provide suitable habitat for oyster recruitment, survival, and growth. Salt marsh vegetation in the study area consists almost entirely of Spartina alterniflora. A recent study found that salt marshes in Assateague Island National Seashore, including Chincoteague National Wildlife Refuge, expanded by 4.01 hectares per year from 1962 to 1994 as a result of the recovery of the reclaimed salt marsh area but retracted at a rate of −3.4 hectares per year from 1994 to 2016 due to interior loss and edge erosion (Campbell and Wang, 2020).
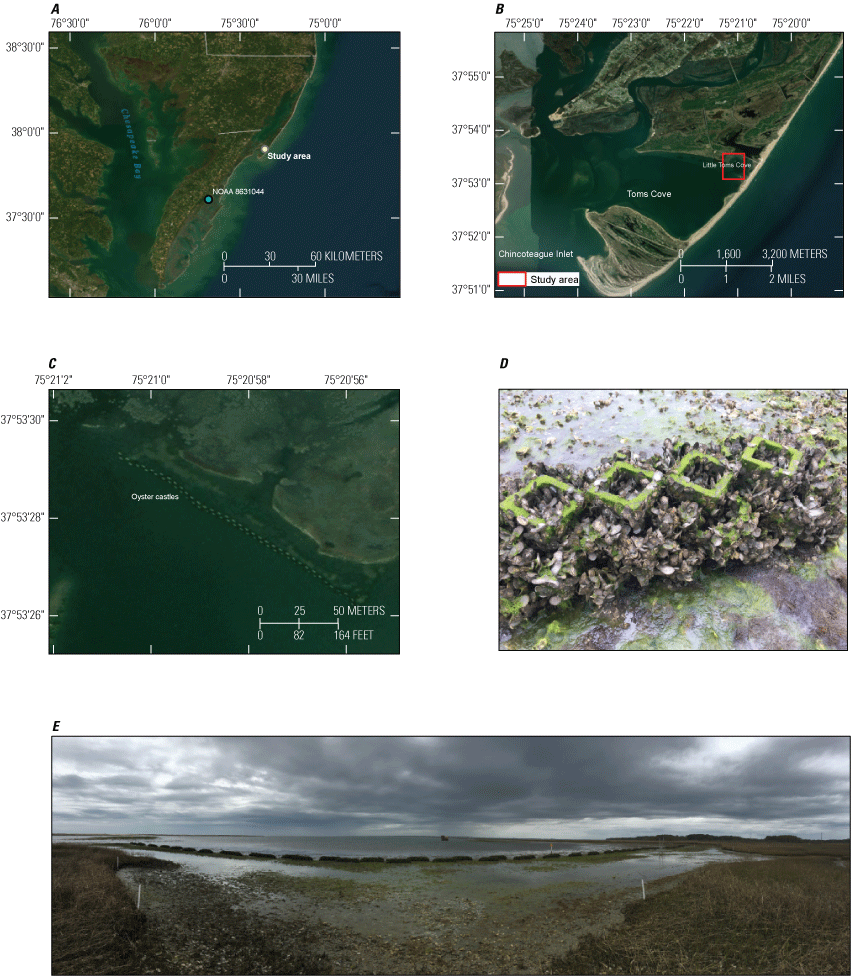
Selected living shoreline A, location on the coast of Virginia, B, location in the study area in Toms Cove, C, oyster castles in Little Toms Cove, D, oyster castle covered with oysters (photograph taken in February 2019 by William Capurso, U.S. Geological Survey) and E, panoramic view of the oyster castles in Little Toms Cove (photograph taken in February 2019 by Hongqing Wang, U.S. Geological Survey). Map images are the intellectual property of Esri and are used herein under license. Copyright 2022 Esri and its licensors. All rights reserved. World Geodetic System 1984.
Field Monitoring and Data Processing
Multiple locations were selected to capture the spatial and temporal variations in wave dissipation, current velocity, and sediment deposition and erosion both horizontally and vertically with and without oyster castles along the shoreline at Little Toms Cove. Sensors for the hydrodynamic forcing (waves, currents, and water level) and instruments for sedimentation were deployed February 27–28, 2019, and retrieved April 29–May 3, 2019.
The wind conditions at Toms Cove were obtained from the National Oceanic and Atmospheric Administration station in Wachapregue, Va. (station ID: 8631044, fig. 1A), which is 40 miles southwest of the project site. During the deployment period, the largest wind speed was 14.7 meters per second (m/s) coming from south-southwest and northeast, and about 1 percent of the wind had a speed >10 m/s (see “wind rose” in figure 1.1). In 2018, the largest wind came from northeast (nor’easter) with a speed of 16.5 m/s, and about 1.5 percent of the wind had a speed >10 m/s. Considering that the fetch is short when winds come from northeast, nor’easters should not have a large impact on the wave height at the wave gage sites. Therefore, the recorded 2-month wave data are sufficiently representative for analyzing the influence of the oyster castles on wave propagation at Toms Cove.
Six pressure transducers or wave gages (WGs) (Ocean Sensors Systems, Inc., OSSI–010–003C) were deployed, but one (WG1, 765 m southwest of the oyster castles) for offshore wave monitoring was lost; therefore, wave data were available at five locations. At a water depth of approximately 1.2 m, WG2 was placed in front (or bayside) of the oyster castles during low tide when sites were exposed, WG5 and WG6 were placed behind (or leeside of) the oyster castles, whereas WG3 and WG4 were installed near the vegetated shore without the protection of the oyster castles as control locations (figs. 2A and 3A). These wave gages were sampled continuously at 10 hertz to take a 20-minute (min) burst every 30 min. The recorded raw gage pressure data was converted to desired wave characteristics (for example, water depth, wave heights, and periods) following the protocol described in Wang and others (2021). The instrument measured a different atmospheric pressure from the reference pressure (in this study, it is the atmospheric pressure recorded at the National Oceanic and Atmospheric Administration station [station ID: 8631044] on calm days). The difference is considered as the instrument's offset. Then, the gage pressure (p) was achieved by subtracting the atmospheric pressure (patm) from the corrected water pressure data (ṕ) as p = ṕ − patm. The gage pressure was then converted to the water depth (h) as h = p/ρg, where ρ (= 1,014 kilograms per cubic meter) is the seawater density and g (= 9.81 meter per second squared) is the gravitational acceleration. Lastly, each burst of water depth was converted to free surface elevation based on linear wave theory and transformed to a wave energy spectrum through the Ocean Wave Analyzing Toolbox (OCEANLYZ, version 1.4) (Karimpour and Chen, 2017). From the wave energy spectrum (Sηη), bulk wave characteristics such as zero-moment wave height (Hm0) and peak wave period (Tp) were extracted using the following equation:
wherem0
is the zeroth moment of the wave energy spectrum,
f
is the frequency,
fp
is the peak frequency associated with the maximum value of Sηη (f),
fmin-cutoff
is the minimum cut-off frequency, and
fmax-cutoff
is the maximum cut-off frequency.
The accuracy of wave height measurements is plus or minus (±) 0.05 percent. Therefore, wave heights smaller than 0.01 m were removed from further analysis. In this study, wave attenuation is determined by comparing wave height values at a nearshore station behind COR (WG5) or in the control area (WG4) to wave height values at the offshore location (WG2) measured during the study period.
Eleven tilt current meters (TCMs; Lowell Instruments, LLC; six long TCMs [LTCMs], range of 0–80 centimeters per second [cm/s], and five short TCMs [STCMs], range of 0–75 cm/s), consisting of a tilt-corrected compass in a buoyant casing and attached to a concrete tile at the sediment-water interface, were installed to measure the flow speed and direction along the gradient from offshore to nearshore in areas with and without the oyster castles (figs. 2B and 3B, C). One acoustic Doppler current meter (ADV; SonTek, Argonaut-ADV) was deployed behind the oyster castles in the middle of the oyster castle rows (next to STCM4, fig. 2B) to capture the circulation pattern change and confirm the compatibility of TCMs in measuring current velocity in the shallow embayment (fig. 3B, C). These TCMs and the ADV were sampled at 16 hertz in bursts of 20 seconds. The offshore WGs and TCMs were deployed by boat. The current data at STCM4 from March 1 to April 3, 2019, were missing, and the data at the ADV from April 14 to May 2, 2019, were missing. The current meters also recorded data when the current meters were not completely submerged, leading to some recorded data beyond the recommended range. The raw current data were processed by (1) time averaging over 30 min and (2) capping the time-averaged current speed with 80 and 60 cm/s for the LTCMs and STCMs, respectively. In this study, the flood and ebb tides are defined based on the water depth changes at the offshore WG2. The flood and ebb tides are determined as the time when the water depth at WG2 continuously increases and decreases in 3 hours, respectively. The bearing angle (θ) is defined as the angle relative to true north (clockwise). The mean current speeds and directions during flood and ebb tides are calculated at all TCMs.
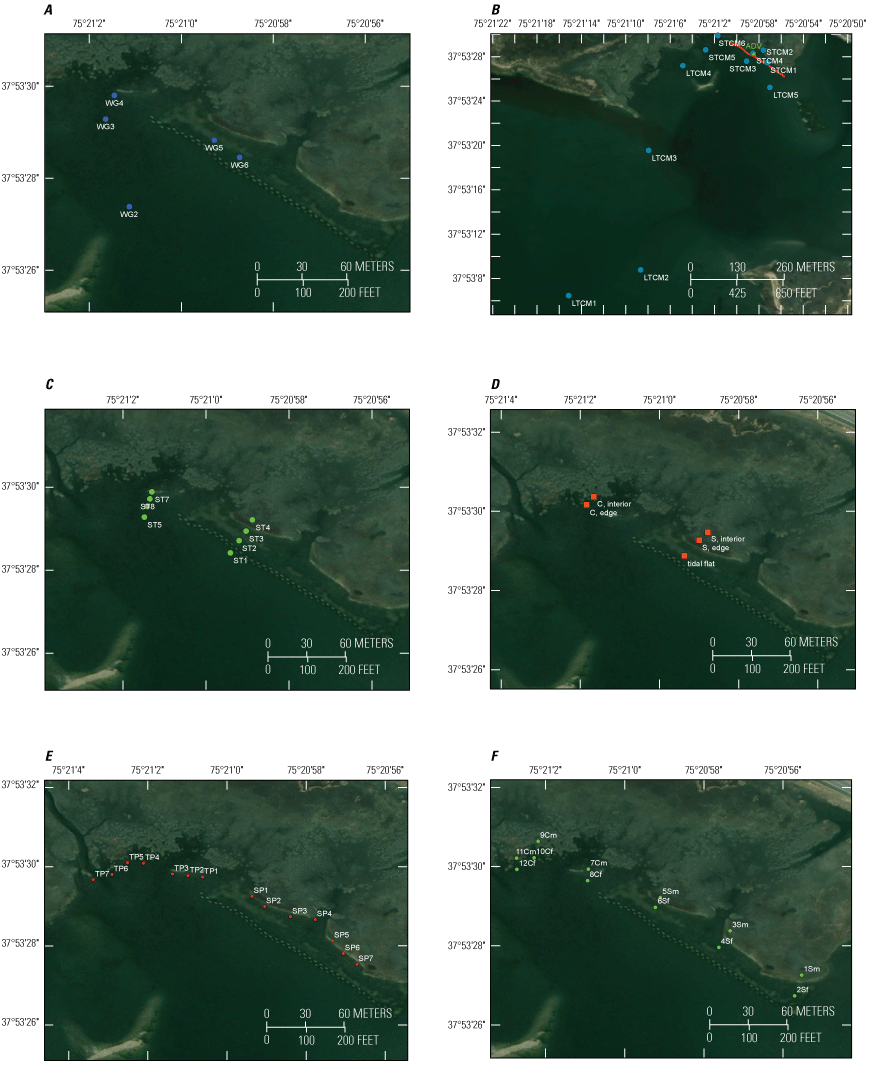
Locations of A, wave gages, B, tilt current meters and acoustic Doppler current meter (ADV), C, sediment traps, D, sediment tiles, E, marsh edge erosion pins, and F, marsh/tidal flat cores along the living shoreline in the Little Toms Cove, Chincoteague National Wildlife Refuge. Map images are the intellectual property of Esri and are used herein under license. Copyright 2022 Esri and its licensors. All rights reserved. World Geodetic System 1984.
Sediment accumulation on marsh surface and in the water column (~0.3 m [1 foot (ft)] above bed surface) was measured by the sediment pin/trap set approach (Wang and others, 2021). Eight sediment pin/trap sets (STs) were placed in the study area: four along the oyster castle transect (ST1 in the front of the oyster castles, ST2 and ST3 on the tidal flat behind the oyster castles, and ST4 on marsh surface behind the oyster castles), and four along the control transect (ST5, ST6, and ST7 on the tidal flat and ST8 on marsh surface in the control area) (figs. 2C and 3D). The installation, measurements of the coordinates of the pin/trap set, and the elevation of the top of the traps were conducted following the method designed specifically for the National Fish and Wildlife Foundation funded living shoreline restoration monitoring and modeling project (Wang and others, 2021). During deployment and retrieval, the distance from the pin top to sediment surface was measured so that the vertical sedimentation (accretion or erosion) during the 2-month monitoring could be determined. Sediments accumulated in the traps were collected and put into 500-milliliter bottles and shipped to Louisiana State University (LSU) Department of Geology and Geophysics for laboratory analysis of sediment mass and grain size distribution.
Five sites were selected in the study area to measure sediment accumulation during the 2 winter months. At each site, three ceramic tiles (15.24 centimeters [cm] x 15.24 cm) were placed as replicates. Three sites were selected behind the oyster castles: one in the tidal flat, one on the marsh edge, and one in the marsh interior. Two sites were selected in the control area: one on the marsh edge and the other in the marsh interior (figs. 2D and 3E). The marsh edges and marsh interiors were at approximately the same elevation thus having similar hydroperiod. The tiles and the sediments accumulated during the monitoring period were collected, put into plastic bags, and shipped to the LSU laboratory for analysis of sediment mass and grain size distribution.
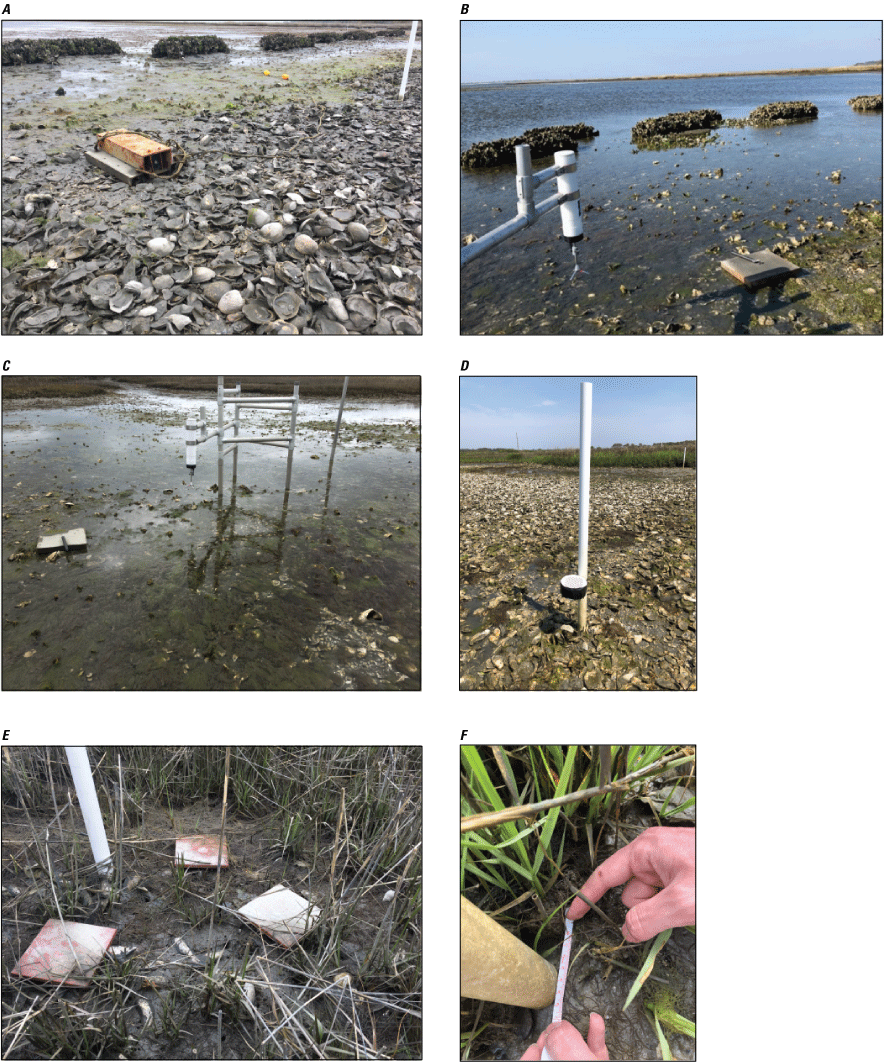
A, Deployed wave gage (photograph taken in February 2019 by Lukasz Niemoczynski, U.S. Geological Survey), B, tilt current meter and the acoustic Doppler velocimeter (ADV; photograph taken in February 2019 by Qin Chen, Northeastern University, used with permission), C, tilt current meter and the ADV (photograph taken in February 2019 by Qin Chen, Northeastern University, used with permission), D, sediment pin/trap (photograph taken in February 2019 by William Capurso, U.S. Geological Survey), E, sediment tiles (photograph taken in May 2019 by Hongqing Wang, U.S. Geological Survey), and F, marsh edge erosion pin along the shoreline in the Little Toms Cove, Chincoteague National Wildlife Refuge (photograph taken in May 2019 by Hongqing Wang, U.S. Geological Survey).
Fourteen marsh erosion pins (1.25-inch PVC pipes) were placed in the study area to measure marsh edge horizontal translation during the 2-month monitoring period. Seven pins were placed at the marsh edge behind the oyster castles and seven at the marsh edge in the control area (figs. 2E and 3F). These pins were installed next to the identified marsh edge and were pushed down 0.91–1.22 m (3–4 ft) in sediment. The coordinates of these marsh edge pins were measured by Global Positioning System (GPS). During the retrieval, the distances from marsh edge to pins were measured in three directions (perpendicular, 45 degrees [°], and 225° from marsh edge) to determine if marsh edge erosion occurred during the monitoring period (Wang and others, 2021).
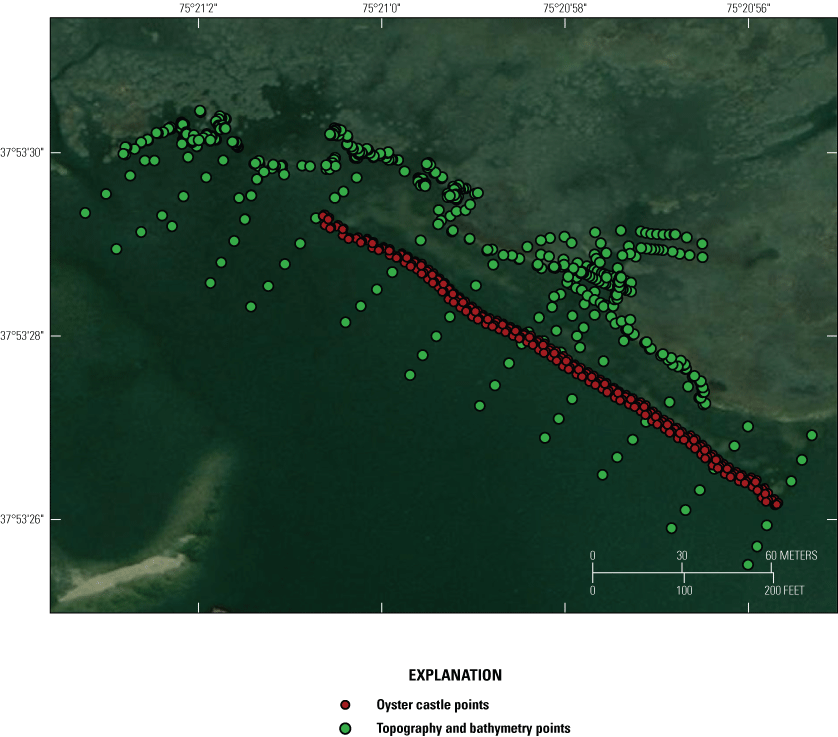
Locations of topographic-bathymetric survey of the study area and the oyster castles in the Little Toms Cove, Chincoteague National Wildlife Refuge. Map image is the intellectual property of Esri and is used herein under license. Copyright 2022 Esri and its licensors. All rights reserved. World Geodetic System 1984.
During the retrieval, a total of 12 sediment cores to a depth of 10 cm were also collected using a 2.54-cm diameter soil corer to determine any variation in sediment grain size distribution in soil/sediment with and without the protection of the oyster castles. Six cores were taken from the area behind the oyster castles (three in mudflat and three on marsh surface) and six in the control area (also three in mudflat and three on marsh surface) (fig. 2F). Samples were placed in vials, packed, and shipped to the LSU laboratory for analysis of sediment mass and grain size distribution.
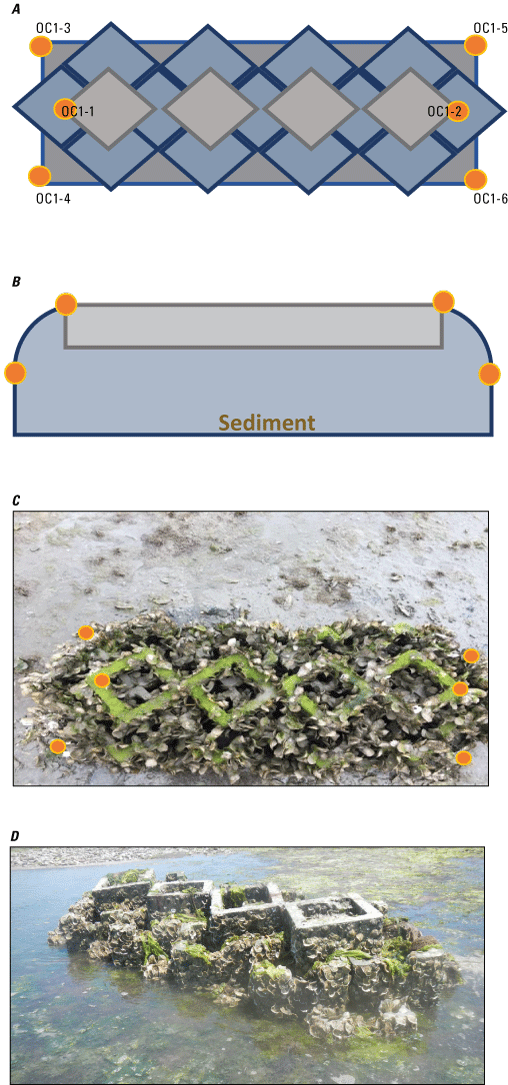
Oyster castle designations, A, top-down view, B, simplified side view, C, onsite view with settled oysters covering most of the surface area (photograph taken in February 2019 by William Capurso, U.S. Geological Survey), and D, constructed oyster castles prior to oyster settlement (photograph taken in 2017 by Bowdoin Lusk, The Nature Conservancy, used with permission). Symbol oc#–# represents the ith oyster castle and number of six measurement points on that oyster castle with 1–2 representing the highest line or crest of the oyster castle and 3–6 representing the footprint. Each castle has a well-defined top layer (gray diamonds) and middle layer (blue diamonds). Additionally, these castles have significant oyster growth, which results in more of a “mound” shape shown in the simplified side view as opposed to the tiered rectangles. OC, oyster castle.
The coordinates and elevations of WGs, TCMs, ADV, STs, sediment tiles, and marsh erosion pins were measured using GPS during the deployment. Additionally, the topographic and bathymetric data in the study area and the elevation data (in meters; North American Vertical Datum of 1988) of the oyster castles at selected points on the oyster castles were also collected during the retrieval (figs. 4 and 5A, B). Topobathymetric surveys were conducted using trigonometric and global navigation satellite system (GNSS) methods (Wang and others, 2021).
Results
Wave Dynamics
The measured zero-moment wave heights (Hm0) and peak wave periods (Tp) along the Little Toms Cove, Chincoteague living shoreline, from March to April 2019 ranged between 0 and 0.26 m and between 1 and 3 seconds (s), respectively. The time series of water depth, Hm0, and Tp at WG2 during the monitoring period are shown in figure 6 as an example, and wave data are available in Wang and others (2022a). The wave height was mostly smaller than 0.05 m during the 2 winter months. Large waves were observed at the five wave gages on March 12, March 15–16, March 22, April 15, and April 18–20 with Hm0 larger than 0.1 m.
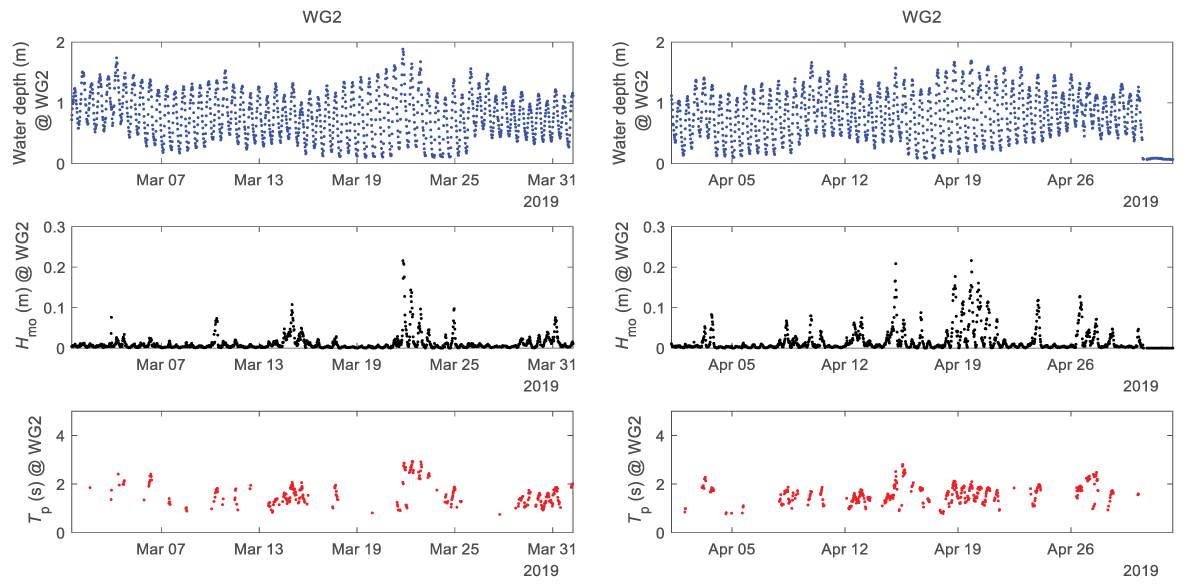
Time series of water depth, Hm0, and Tp at wave gage 2 (WG2) during March and April 2019 along the Little Toms Cove, Chincoteague National Wildlife Refuge, Virginia. m, meter; Mar, March; Apr, April; Hm0, zero-moment wave height; Tp, peak wave period; s, seconds; @, at.
Wave generation and propagation in this shallow cove are controlled by wind directions and water levels. Thus, the wave dynamics along the shoreline and the effect of oyster castles on wave attenuation were assessed in terms of wind direction sections (0–90, 90–180, 180–270, and 270–360°) and water levels, as well as the oyster castle crest freeboard (Rc, defined as the distance from the water surface to the crest of the oyster reefs) (fig. 7).
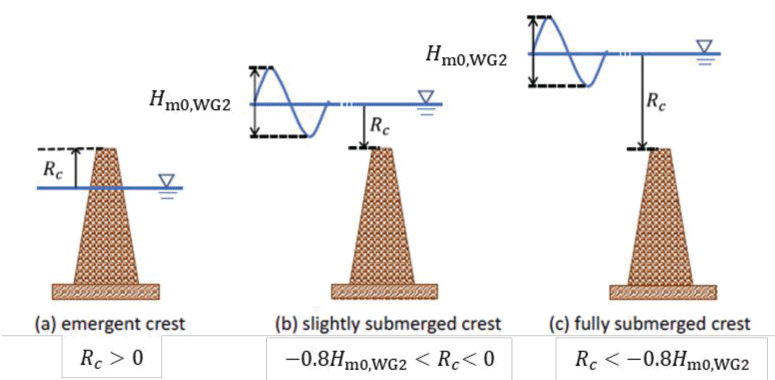
Sketches of freeboard under different tide conditions. Hm0, zero-moment wave height; WG2, wave gage 2; Rc, crest freeboard; >, greater than; <, less than.
The results showed that wave parameters (that is, Hm0 and Tp) measured at WG5 and WG6 (both behind the oyster castles) were similar. For WG3 and WG4, both in the control area, the measured Hm0 and Tp also presented a similar pattern. The results showed that when winds came from the northeast, wave heights were lowest due to the limited fetch and sheltering of the shoreline (fig. 8). When winds came from the southwest, wave heights were larger (~0.25 m). Most wave attenuation happened when winds came from northwest. During low tides (Rc> −0.8Hm0,WG2), an average reduction rate of 39.7 percent in wave height (reduction rate = (Hm0, WG2 – Hm0, WG5) / Hm0, WG2) was observed from the most offshore station (WG2) to the nearshore station behind the oyster castles (WG5); during high tides, the wave height from WG2 to WG5 had an average rate of 23.5 percent reduction to 38.6 percent amplification during the deployment period (fig. 8).
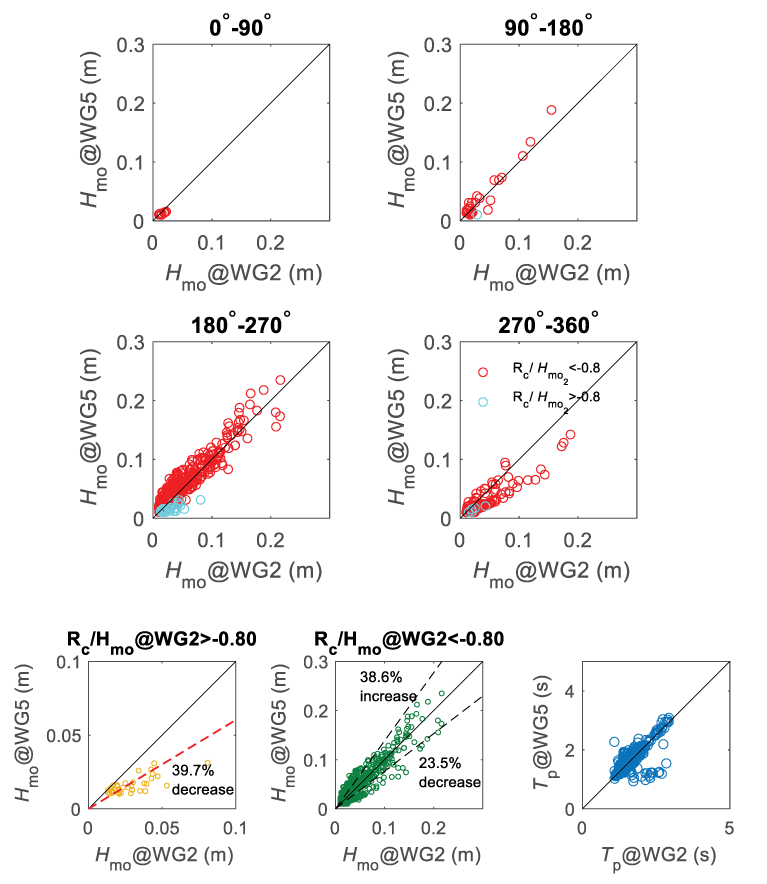
Scatterplots of the zero-moment wave heights and peak wave period measured at wave gage (WG) 2 and WG5 separated by wind directions and water levels. m, meter; Hm0, zero-moment wave height; Rc, crest freeboard; Tp, peak wave period; s, seconds; °, degree; @, at; <, less than; >, greater than; %, percent.
The WG2-WG4 paired comparison showed that wave heights were also reduced from the offshore location (WG2) to the control location nearshore even without oyster castle protection because of the bathymetric effect or depth-limited breaking. Wave heights were reduced by an average of 37.7 percent from WG2 to WG4 (fig. 9). Peak wave periods at all the five wave gage locations were short and in the range of 1–3 seconds, indicating waves along the Little Toms Cove living shoreline were generated by local winds with limited fetches. Overall, field-measured wave data indicate that the oyster castles along the Little Toms Cove living shoreline play a limited role in wave attenuation in this low wave energy environment. Wave height could be attenuated by less than (<) 40 percent when oyster castles are emergent or slightly submerged with southwest winds (fig. 9). Such wave attenuation is also seen in the control area without oyster castles. When the oyster castles are fully submerged, wave energy behind the structure is less likely to decrease; instead, wave energy increased mainly owing to the effect of wave shoaling.
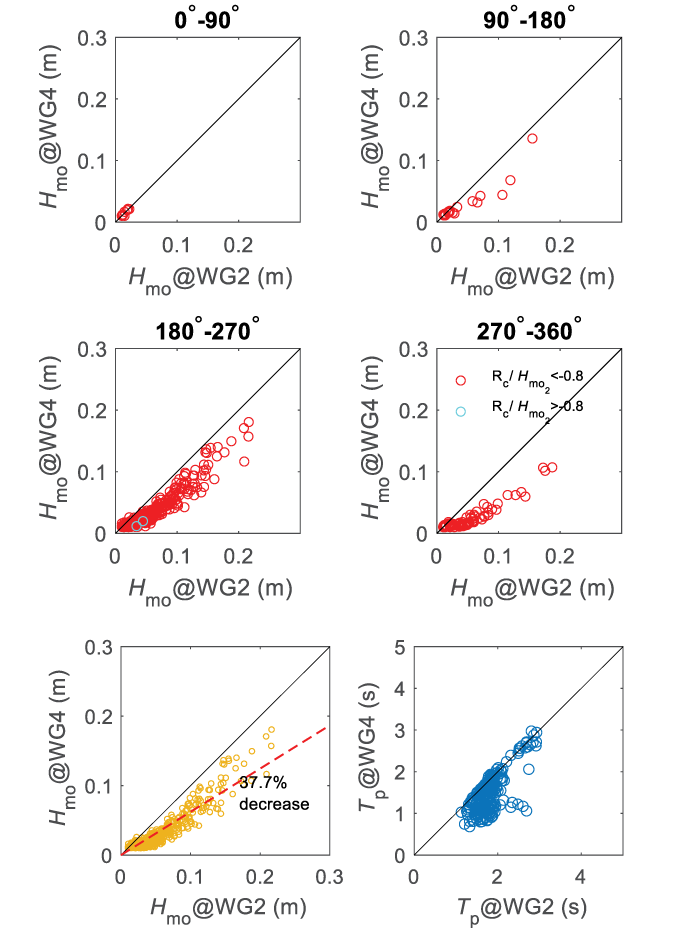
Scatterplots of the zero-moment wave heights and peak wave period measured at wave gage (WG) 2 and WG4 separated by wind directions and water levels. m, meter; Hm0, zero-moment wave height; Tp, peak wave period; Rc, crest freeboard; s, seconds; °, degree; @, at; <, less than; >, greater than; %, percent.
Current Dynamics
The temporal variations of current direction, current speed, and water depth during flood and ebb tides were recorded at all the TCM locations. Velocity data are available in Wang and others (2022b). The data at STCM3 (fig. 2B) were shown in figure 10 as an example for the measured current dynamics along the Little Toms Cove, Chincoteague living shoreline. The time series of the vectors showed the circulation pattern of currents. The mean flood and ebb current speed were low at locations near the oyster castles (STCM3 and STCM4) and in the control area (STCM5 and STCM6) (fig. 2B) with an average velocity value smaller than 5 cm/s. STCM1 and STCM2, behind the oyster castles, had relatively stronger currents. The offshore (LTCM1 to LTCM3, fig. 2B) current speed was even higher. The average speed was around 10 cm/s at LTCM1 and LTCM2, and the maximum averaged current speed recorded was up to 25 cm/s at these two sites.
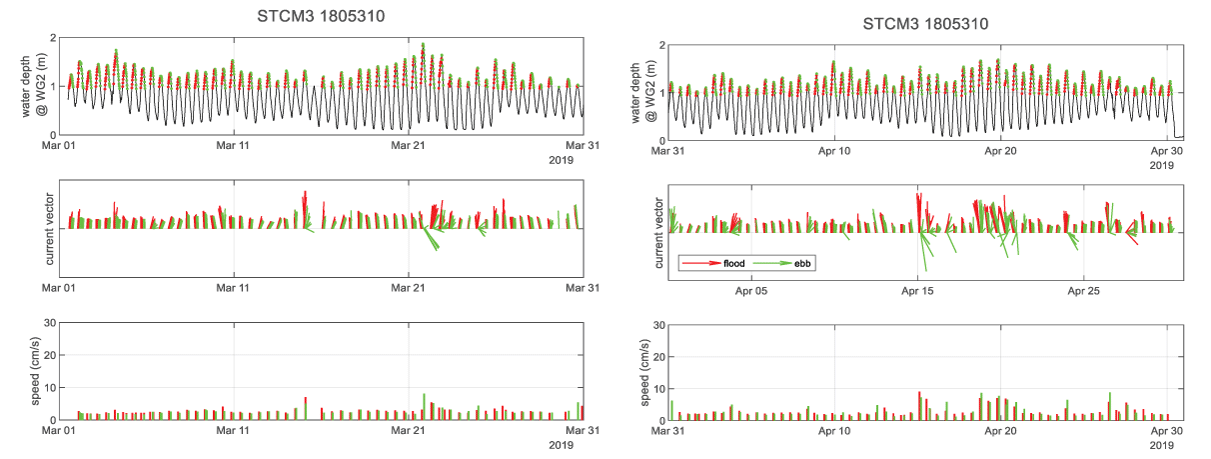
The water depth, current vectors, and current speed measured at short tilt current meter 3 (STCM3) during March and April 2019 along the Little Toms Cove, Chincoteague living shoreline, Virginia. The vector plots show the current directions (pointing upwards means true north). The red and green dots correspond to the flood and ebb tides, respectively, defined based on the water level changes at wave gage 2 (WG2). m, meter; Mar, March; Apr, April; cm/s, centimeter per second; @, at.
During flood tides, the currents at LTCM1, STCM1, STCM3, STCM4, and STCM5 were generally oriented onshore, while the currents at LTCM3 and LTCM4 were mostly oriented offshore. By contrast, LTCM2, LTCM5, STCM2, and STCM6 did not have a consistent tendency of orientations during flood tides. A snapshot of currents at all TCMs during flood tide (21–Mar–2019 06:00:00) is provided in figure 11.
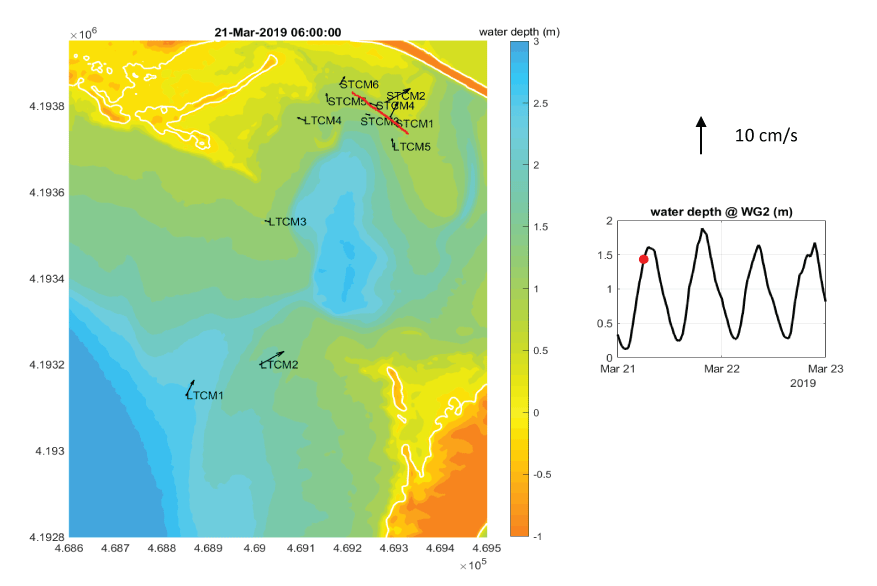
A snapshot of currents at all tilt current meters (TCMs) during a flood tide on March 21, 2019, at 6 a.m. Mar, March; m, meter; cm/s, centimeter per second; WG, wave gage; LTCM, long tilt current meter; STCM, short tilt current meter; @, at.
During ebb tides, the currents at LTCM1, LTCM4, LTCM5, STCM5, and STCM6 generally moved offshore. The currents at LTCM3, STCM1, STCM3, and STCM4 generally moved onshore due to the flow circulation in the small cove. LTCM2 and STCM2 did not have an obvious tendency of orientations during ebb tides. A snapshot of currents at all TCMs during an ebb tide (21–Mar–2019, 09:00:00) is provided in figure 12. Overall, the circulation pattern at the nearshore TCMs can be quite complicated, greatly affected by the surrounding bathymetry and shoreline geometry, and the oyster castles tended to alter the circulation (velocity and direction) nearby, either increasing or decreasing the velocity, depending on the location.
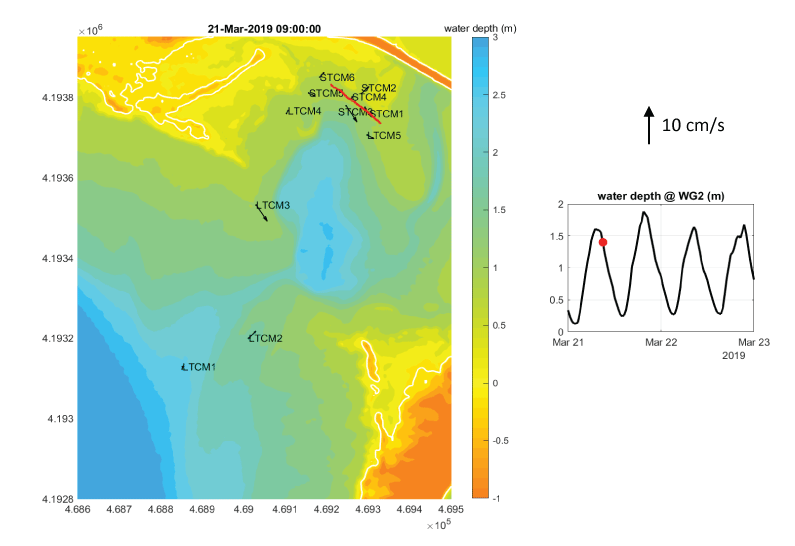
A snapshot of currents at all tilt current meters (TCMs) during an ebb tide on March 21, 2019, at 9 a.m. Mar, March; m, meter; cm/s, centimeter per second; WG, wave gage; LTCM, long tilt current meter; STCM, short tilt current meter; @, at.
The ADV was deployed close to STCM4 (fig. 2B). The magnitude and pattern measured by STCM4 were in good agreement with that from the ADV (fig. 13). The north components of the current direction measured at STCM4 and the ADV were a bit different, which might be caused by the different positions of STCM4 and the ADV and the small sampling volume the ADV contributed. Specifically, STCM4 was placed behind the gap of the oyster castle, while the ADV was set behind the oyster castles (figs. 2B and 3B, C). As the oyster castles can change the direction of current propagation towards the shoreline, it is reasonable to observe that current velocities were similar in the longshore direction and different in the cross-shore direction.
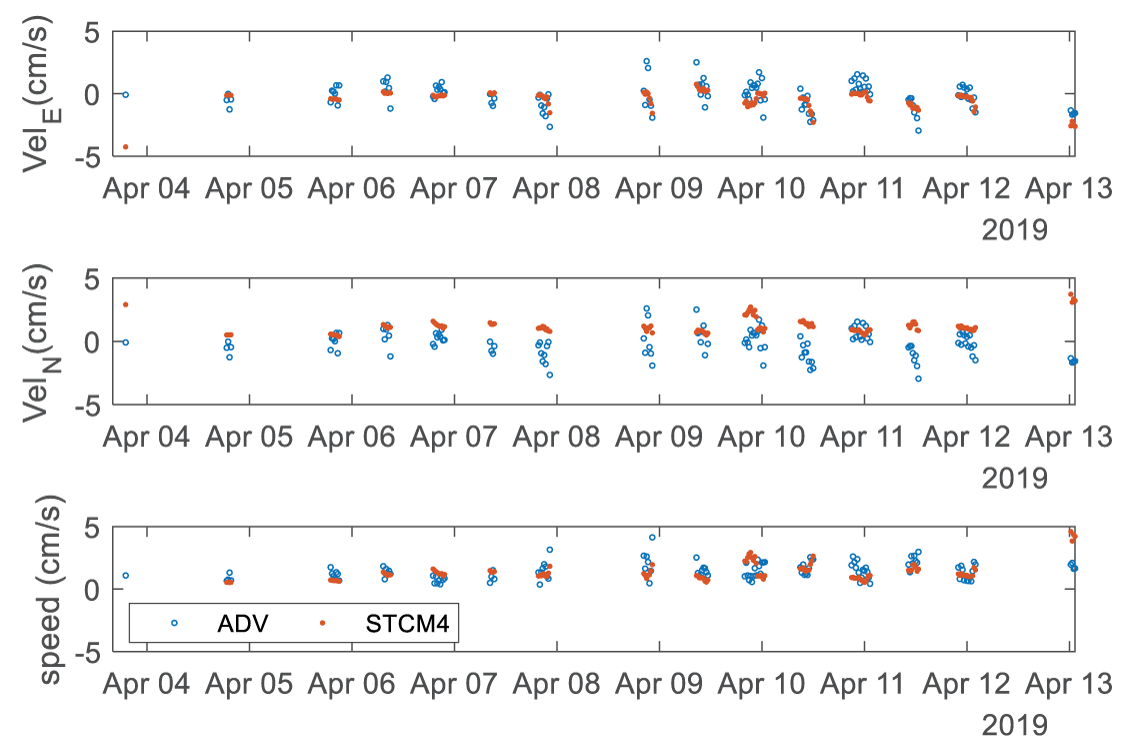
Current measured by short tilt current meter 4 (STCM4) and acoustic Doppler velocimeter (ADV) along the Little Toms Cove, Chincoteague living shoreline, Virginia. VelE and VelN represent the current velocities in the east and north direction, respectively. Apr, April; cm/s, centimeter per second.
To assess the spatial variations of current velocity from offshore to nearshore along the Chincoteague living shoreline, current velocities measured at different TCM locations were compared over the 2 winter months, including STCM3 (in front of oyster castles), STCM4 (behind oyster castles but at the middle of the linear structure), and STCM1 (behind oyster castles but at the end of the linear structure) (fig. 2B). The results showed that the COR could change the circulation pattern by increasing the current velocity at locations near the boundaries of the oyster castles but have limited influence on the current velocity at locations behind the gaps between the oyster castles (fig. 14). Also, it was found that the measured current velocities at LTCM1, LTCM2, and LTCM3 were larger than the velocities measured at nearshore (for example, LTCM4 and LTCM5) due to the local bathymetry effects (fig. 15). The comparisons between LTCM and STCM pairs (fig. 16) showed that (1) the current velocities could be increased or decreased from offshore (LTCM4) to nearshore (STCM5 and STCM6) in the control area, (2) velocities were similar at locations in front of the oyster castles (LTCM5 and STCM3) or could be increased at STCM3 compared to LTCM4, especially with the large current speed (>7 cm/s), (3) velocities at locations behind the oyster castles (STCM1: <2 m away from the oyster reefs) could be enhanced compared to the velocity at LTCM5, especially for large current speed (>5 cm/s), and (4) velocities at locations behind the oyster castles (STCM2: close to the nearby tidal creek and open water) were similar to the ones at LTCM5.
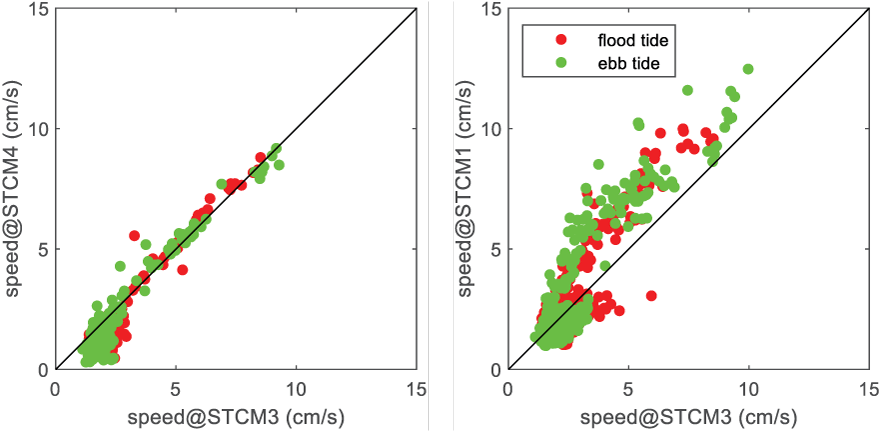
Comparison between the current speed measured at different short tilt current meters (STCMs) during flood and ebb tides. cm/s, centimeter per second; @, at.
Overall, results show that there is a natural gradient of decreasing current velocities from offshore to nearshore locations along the Little Toms Cove, Chincoteague living shoreline owing to the effects of the wetlands or land boundary. The construction of the oyster castles does affect circulation patterns, but it is heterogenous with velocity increase or decrease in nearshore depending on the position relative to the oyster castles.
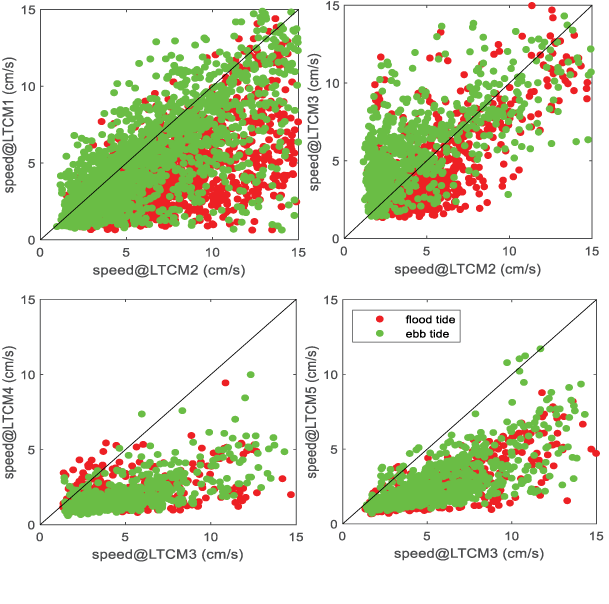
Comparison between the current speed measured at different long tilt current meters (LTCMs) during flood and ebb tides. cm/s, centimeter per second; @, at.
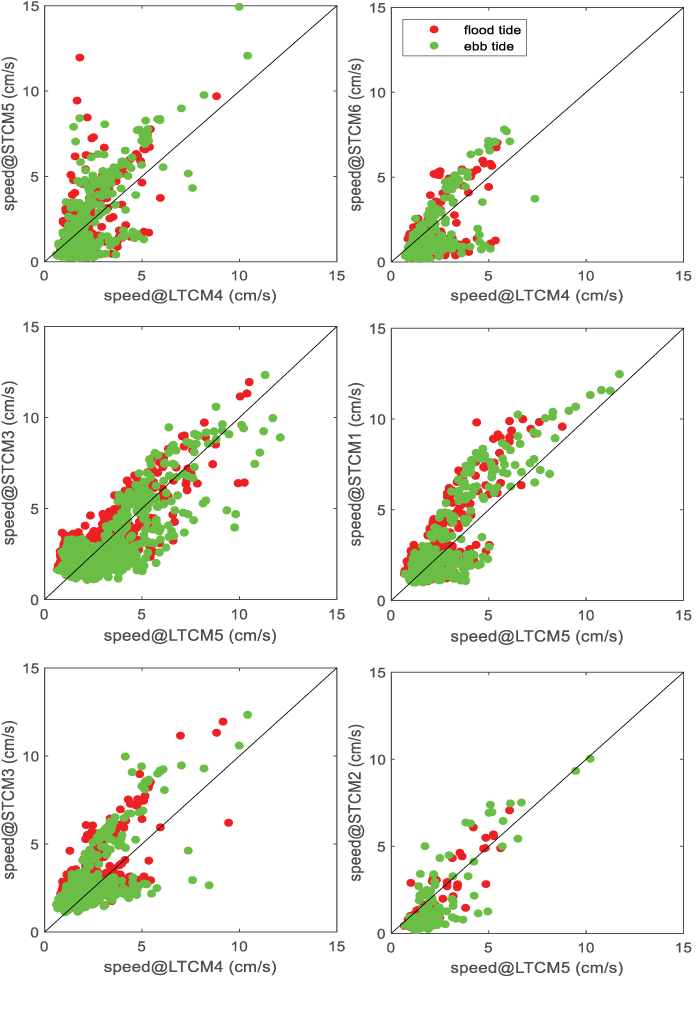
Comparison between the current speed measured at different long tilt current meters (LTCMs) and short tilt current meters (STCMs) during flood and ebb tides. cm/s, centimeter per second; @, at.
Sediment Dynamics
Field sediment pin measurements (table 1) showed that sediment vertical elevation loss occurred during the 2 winter months consistently at both the oyster castle transect and the control transect. However, because of the GNSS vertical accuracy of 3 cm (Wang and others, 2021) for surface elevation change measurements, it would be difficult to quantify with high confidence the magnitude of vertical surface elevation changes at the sites with and without oyster castle protection. Nevertheless, it appeared that the oyster castles in front of the marsh edge along Toms Cove could not mitigate vertical sediment surface elevation loss (table 1: elevation loss of 3.96 cm behind the oyster castles versus loss of 2.97 cm in the control area, student t-test, p = 0.4). This finding is opposite to our expectation that the oyster castles would play an active role in reducing elevation loss and associated sediment erosion at marsh edge and tidal flat behind them.
Table 1.
Sediment pin measurements and surface elevation change during February–April 2019.[No land subsidence detected during the 2 months by GPS measures on top of traps during deployment and retrieval. Change = retrieval−deployment, distance from pin top, greater than 0: erosion, less than 0: accretion. #, number; H1, distance from pin top in south direction; H2, distance from pin top in west direction; H3, distance from pin top in north direction; S, south; W, west; N, north; cm, centimeter; Ave, average; Std, standard deviation]
Marsh edge lateral erosion pin measurements (six behind oyster castles and seven in the control area) showed that marsh edge behind oyster castles tended to have less lateral erosion (mean ± standard deviation: 0.53 ± 1.04 cm) than marsh edge in the control area (1.33 ± 1.21 cm) during the study period (February–April 2019) although the difference was not statistically significant (student t-test, p = 0.18).
Sediment trap measurements showed that sites at marsh edge and tidal flat protected by oyster castles tended to trap more sediment than sites along the control transect during the 2 winter months. In addition, the grain size of the trapped sediment behind the oyster castles tended to be finer than that in control sites, and trapped sediment behind the oyster castles tended to have a higher fraction of clay and less fractions of silt and sand (table 2). It should be noted that because sediment trap samples were limited over a short winter storm period, more sediment trap samples across the shoreline with and without the oyster castles and over a longer period are needed to determine the actual impact of oyster castles on sediment dynamics near the shoreline.
Table 2.
Total sediment mass accumulated in sediment traps and sediment grain size distribution during February–April 2019.[g, gram; µm, micrometer; %, percent; St, sediment trap; Ave, average; SE, standard error; D50, median sediment particle size]
Sediment tile measurements showed that during the 2 winter months, interior marsh area tended to accumulate more sediment (mean ± standard error: 185.01 ± 88.55 grams per square meter [g/m2]) than tidal flat (128.08 ± 54.71 g/m2) and marsh edge (33.01 ± 0.94 g/m2) behind the oyster castles whereas marsh edge tended to accumulate more sediment (357.10 ± 224.57 g/m2) than interior marsh (6.26 ± 3.37 g/m2) in the control area (table 3). The clay fraction tended to increase from interior marsh in the control area (26.77 ± 1.53 percent) to interior marsh behind oyster castles (32.47 ± 0.29 percent) whereas the sand fraction tended to decrease from interior marsh in the control area (8.74 ± 2.47 percent) to interior marsh behind oyster castles (2.02 ± 0.28 percent) with smaller grain size (mean D50 = 6.97 micrometer [µm]) in the interior marsh behind oyster castles than that in the control area (10.10 µm) (table 3). The marsh edge sites behind oyster castles and in the control area also showed a similar pattern in grain size distribution with interior marsh, or finer sediment tended to be accumulated at marsh edge behind oyster castles.
Table 3.
Total sediment mass accumulated on sediment tiles and sediment grain size distribution during February–April 2019.[g, gram; m2, square meter; µm, micrometer; %, percent; Ave, average; SE, standard error; D50, median sediment particle size]
The analysis of soil/sediment cores in the top 10 cm surface of marsh edge and tidal flat showed that there was no difference in bulk density and organic matter content between sites behind oyster castles and sites in the control area (table 4). These results clearly demonstrate that although sediment bulk density and organic matter content were not affected by the oyster castles, sediment texture is affected by the construction of the LSS due to the finer sediment (silt and clay) that is accumulated in the soil (D50: 56 µm versus 97 µm; mud fraction: 67 percent versus 48 percent).
Table 4.
Sediment properties of the marsh/tidal flat cores collected on May 1, 2019.[g/cm3, gram per cubic centimeter; %, percent; µm, micrometer; S, location behind oyster castles; C, location in control area; m, marsh cores; f, tidal flat cores; Ave, average; SE, standard error; D50, median sediment particle size]
Topobathymetric Survey
Topobathymetric survey was conducted during deployment along the Little Toms Cove living shoreline project area using GNSS surveys and total station trigonometric leveling. Both real-time network and static satellite techniques were utilized to determine the elevation of survey points across the study area with a horizontal accuracy of ± 0.015 m (0.05 ft) and a vertical accuracy of ± 0.03 m (0.10 ft). Topobathymetric data from this study (2019) were combined with the U.S. Geological Survey (USGS) Coastal National Elevation Database (CoNED prior to 2014 for the study area) to create a high-resolution (0.2 m) topobathymetric dataset (fig. 17) incorporating the oyster castles for future high-resolution wave, hydrodynamic, and sediment transport modeling. The integrated modeling results can be used for adaptive shoreline management under future climate change with increased frequency and intensity of storms. The elevation survey data are available in Capurso and others (2022).
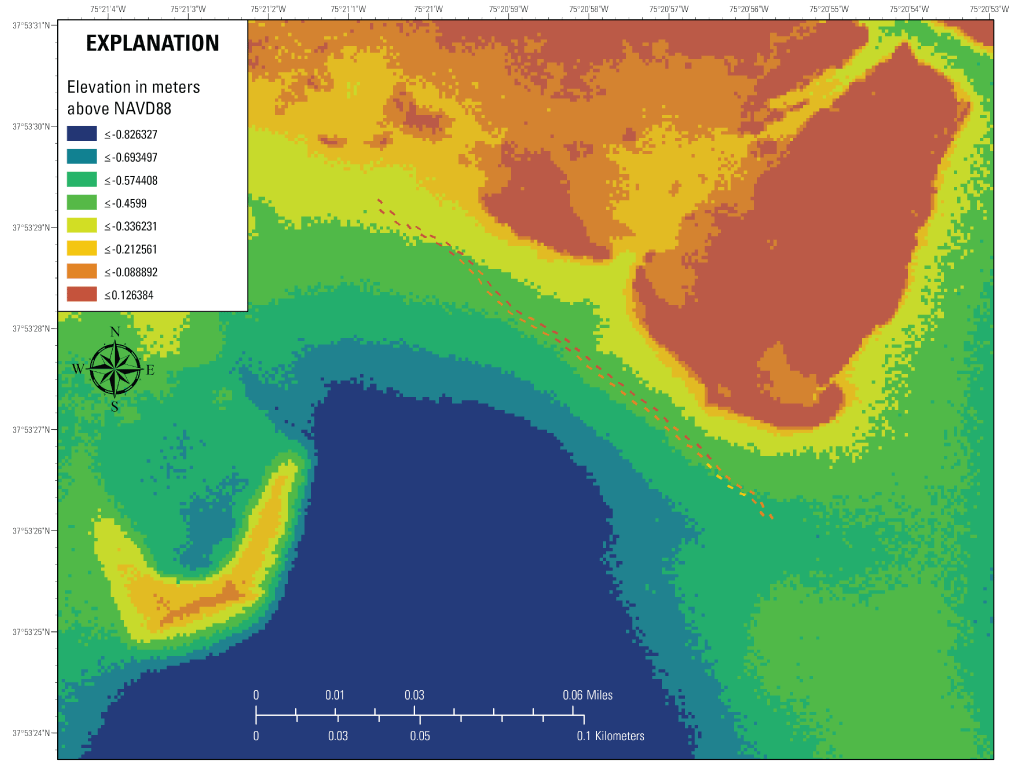
Topographic and bathymetric map of the study area and oyster castles in the Little Toms Cove, Chincoteague, Virginia. The map was updated using field elevation survey and U.S. Geological Survey (USGS) Coastal National Elevation Database (CoNED) data. Image generated from USGS CoNED data. NAVD 88, North American Vertical Datum of 1988; ≤, less than or equal to.
Discussion
Effect of Oyster Castles on Attenuation of Wave and Current Velocity
Monitoring data indicate that the oyster castles along the Little Toms Cove living shoreline play a limited role in wave attenuation in this microtidal (0.7 m), low wave energy (wave height <0.25 m) environment. Wave height attenuated by up to 40 percent when oyster castles were emergent or slightly submerged. When the oyster castles were fully submerged, however, wave energy behind the structure tended to be increased by up to 38.6 percent; therefore, instead of reducing wave energy, submergence supported an increase in wave energy. Using the same methodology for wave monitoring and data analysis in Gandys Beach, New Jersey, in upper Delaware Bay, a high wave energy environment where the tidal range is 1.72 m and shoreline is exposed to Delaware Bay, wave height behind the oyster castles (as high as >1 m) was reduced by 52 percent when oyster castles are emergent or slightly submerged (Zhu and others, 2020; Wang and others, 2021). One common finding at both low and high wave energy shorelines is that oyster castles would not reduce wave energy when the castles are fully submerged. Instead, wave height could be increased under such structure inundation conditions by as high as 70 percent and 39 percent at the Gandys Beach (Zhu and others, 2020; Wang and others, 2021) and Little Toms Cove (fig. 8) living shorelines, respectively. Wave breaking by shallow water depth can be responsible for wave height reduction behind oyster castles, whereas wave shoaling, wave diffraction, and wave focusing can be responsible for wave height amplification (Zhu and others 2020; Wang and others, 2021).
Further evidence for the limited role of oyster castles in wave attenuation along the Little Toms Cove living shoreline is provided by the finding that wave heights were reduced by 38 percent along a transect in the control area (from WG2 to WG4, fig. 9). Such wave attenuation may be attributed to the geomorphological conditions of the control site (WG4). The control site is protected by the salt marshes in the west and a nearby offshore shoal. In contrast, sites behind the oyster castles would have large wind fetch under the same water level conditions (fig. 8), resulting in the reduction of wave height at WG5, especially when winds come from the southwest, a direction associated with the highest wave heights in the study. In addition, it was found that mats of macroalgae (Gracilaria sp.), distributed more in the control area than in front of the oyster castles during the 2 winter months, might have had the same effects on wave energy dissipation as seagrass (for example, Paul and others [2012]). It should be noted that a section of the Little Toms Cove living shoreline without the protection of oyster castles could not serve as qualified control/reference sites with similar topographic and bathymetric features. Better determination of oyster castle influence on wave attenuation along the living shoreline could be investigated with numerical wave models or physical wave models where the topographic and bathymetric features and the wave heights can be controlled.
Wave data analysis indicates that wave height reduction along the Little Toms Cove living shoreline is dependent on the ratio between the freeboard of the oyster castles and the offshore (incoming) wave height. This observation is consistent with the finding from the Gandys Beach living shoreline (Zhu and others, 2020; Wang and others, 2021). Regardless of tidal ranges and wave heights of the living shorelines for both low and high wave energy conditions, wave attenuation capacity of the LSS will decrease with increasing water depth above the crest of the structure and increased incident wave height (Ysebaert and others, 2011; Chowdhury and others, 2019; Wiberg and others, 2019; Converse and others, 2020; Zhu and others, 2020; Morris and others, 2021; Polk and others, 2022; Spiering and others, 2021; Wang and others, 2021). Since the height of the oyster castles is closely related to the freeboard and water depth, oyster castle height will be one of the critical factors that determine the wave attenuation capacity of oyster castles (Wiberg and others, 2019; Converse and others, 2020). Moreover, changes in the length and width of the oyster castles and their configurations can be considered in improving the wave attenuation capacity (Chowdhury and others, 2019; Morris and others, 2019; Polk and others, 2022).
There are few studies on the impact of LSS on the current velocity field in shallow areas along coastal shorelines. This study showed that the effect of LSS on nearshore circulation and current velocity varied in space and time and was dependent upon wind and wave conditions, tidal phase (ebb versus flood), location of measurement in relation to living structures, and geomorphological features. Measured current velocities at multiple locations with and without oyster castles along the Little Toms Cove living shoreline indicate that the construction of oyster castles affects circulation patterns with velocity increase or decrease depending on locations of measurements. Current velocities tend to be reduced at locations behind oyster castles but along the middle of the structures, whereas velocities could be increased at locations behind the oyster castles but near the boundary between the structures and open water especially during ebb tides. Without the construction of the oyster castles, circulation patterns and current velocities in the study area are also dependent on local bathymetry, distance to the tidal creek and (or) open water, tidal forcing, and wind.
Previous studies also found that depth-averaged mean current velocity was more reduced in the landward side of the oyster reef than the seaward side and alongshore flow and current velocity varied in and around the oyster reef areas (for example, Chowdhury and others [2019]). Whitman and Reidenbach (2012) found that current velocity over mudflats along the Virginia coastline could be reduced by a factor of two compared with flows over adjacent oyster reefs. It was found that the tidal current was relatively stronger in ebb tide compared to flood tide (Chowdhury and others, 2019). Nardin and others (2020) also found that along the microtidal shoreline in the Virginia Coast Reserve, the maximum flow velocity was greater during ebb tides than during flood tides for each tidal cycle, and the alongshore current velocity was at the maximum value when the relative wave direction was around 45°. Another factor contributing to reduced current velocity at the locations behind the middle of the oyster castles may be the existence of shells of dead oysters and mussels placed behind the oyster castles. Shells of oysters and mussels could increase the bottom drag and dissipation on current via increased bed roughness, thus reducing current velocity and wave height (Kitsikoudis and others, 2020; Spiering and others, 2021).
Effect of Oyster Castles on Sediment Deposition and Marsh Edge Erosion
In this study, field sediment pin measurements, although limited in sample size and confidence, indicate that oyster castles along the Little Toms Cove shoreline are unlikely to mitigate soil elevation loss and sediment vertical erosion during the 2-month study period compared to the shoreline section in the control area. This finding is different from previous studies (Wang and others, 2021; Polk and others, 2022). Polk and others (2022) studied 17 living shoreline projects along the North Carolina coasts and found that living shorelines with sills composed of bagged oyster shells, rock, oyster reef balls, or a mixture of these materials can promote both horizontal and vertical sediment accumulation after the passage of a Category 1 storm compared to unaltered marshes and bulkheaded shorelines. Using the same sediment pin method for the Gandys Beach living shoreline, also equipped with oyster castles, Wang and others (2021) found that oyster castles protected the marsh and mudflat behind them from erosion by either reduced vertical erosion or increased deposition during a 2-month winter storm period compared to locations in the control area. Marsh edge erosion pin measurements in this study reveal that oyster castles along the Little Toms Cove shoreline can prevent marsh edge from lateral erosion due to storms. This finding is consistent with previous living shoreline studies. Chowdhury and others (2019) found that salt marsh retreat rate along a subtropical coast during monsoon season (high wind and wave condition) was significantly reduced at the oyster castle sites compared to the control sites. Wang and others (2021) found that oyster castles along the Gandys Beach living shoreline reduced the lateral salt marsh edge erosion protected by the structures from four nor’easters.
In this study, the sediment distribution in the control area was assumed to represent the preconstruction grain size distribution. Sediment measurements (mass and grain size) showed that marsh edge and tidal flat protected by the oyster castles along the Little Toms Cove living shoreline trapped more and finer sediments from the water column than their counterparts in the control area, suggesting that marsh edge and tidal flat behind the living structures had a higher amount of sediment that can be accumulated. This finding is consistent with previous similar studies, where oyster reefs were found to trap and accumulate fine sediments compared to preconstruction conditions (Colden and others, 2016; Chowdhury and others, 2019). Wang and others (2021) found that salt marsh and mudflat behind oyster castles along the Gandys Beach living shoreline trapped more and coarser sediments (sand) than their counterparts in the control area during winter months. Nevertheless, sediment measurements using the tiles showed that marsh edge in the control area accumulated more than 10 times the sediments that marsh edge behind the oyster castles accumulated (table 3). This could partially explain the tendency of higher vertical surface erosion in marsh edge behind the oyster castles due to wave amplification when oyster castles were submerged. This pattern suggests that more suspended sediments in the water column behind the oyster castles would not settle down and deposit in the marsh edge and tidal flat. Instead, these sediments may have been transported and deposited in the interior marsh area as indicated by the higher accumulated sediment amount than marsh edge and tidal flat behind the oyster castles (table 3). In the control area, marsh edge accumulated more sediment than interior marsh, suggesting that the suspended sediment would not transport and deposit in the interior marsh for marsh vertical accretion. Although more sediments were found to be accumulated in the marsh edge location in the control area than in the marsh edge behind the structure, a higher lateral edge erosion was measured in the control area than in the marsh edge protected by the oyster castles, suggesting that sediment in marsh edge in the control area was prone to losing sediment under the impacts of wind, wave, and tidal forcing.
Analysis of soil samples in the top 10 cm depth showed that finer sediment (silt and clay) accumulated in soils behind the oyster castles, consistent with the finding of finer sediment from the water column deposited in the surface of marsh edge and tidal flat along the Little Toms Cove living shoreline. This observation is inconsistent with Wang and others (2021), who found that salt marsh and mudflat area in the leeward side of the oyster castles in the Gandys Beach living shoreline accumulated large grain size sediment in the soils. There are very few studies that examine the changes in soil properties, including bulk density, organic matter, total organic carbon, and nitrogen in soils protected by using oyster reefs, oyster shell bags, or oyster castles. In this study, there tended to be no difference in soil bulk density and organic matter content, suggesting that the construction of oyster castles would not change these soil properties in a period of <2.5 years. This finding is of ecological importance as it was found that living shoreline marshes tend to have lower soil organic content, higher bulk density, and lower soil carbon, nitrogen, and phosphorus than their natural marsh counterparts (Chambers and others, 2021). The sediment organic matter content and bulk density in marshes behind the oyster castles were maintained, thus allowing marshes to continue providing needed soil conditions (for example, nutrients) for marsh to grow and trap mineral sediment. Dutta and others (2021) found that living shoreline project sites located near Dauphin Island, Alabama, had significantly higher organic matter content and associated carbon and nitrogen but lower bulk density (a depth of 30 cm) than the hardened shoreline sites and that living shoreline treatments over time facilitate conditions that favor organic-matter rich and fine-grained sediments and approach the conditions found in the natural shoreline. Spiering and others (2021) found that organic content within sediments of the oyster shell-bag-based restored shoreline increased by threefold and shoreline sediments became finer relative to pre-restoration values. Safak and others (2020) also found that organic matter, silt, and clay content all increased in sediments collected in the living shorelines compared to paired control treatments. Additionally, it was found that the effect of LSS including oyster reefs in controlling shoreline erosion is quite variable over time (significant efficacy during storm-induced erosion) (Chowdhury and others, 2019). Shoreline erosion rates were found to vary in space and weakly depend on the spatial distribution of wave energy (Priestas and others, 2015). Therefore, long-term monitoring (>3 years) of changes in shoreline and marsh edge erosion along the Little Toms Cove can be helpful for the assessment of LSS’s long-term benefits.
Linkage Between Wave, Current, and Sediment Dynamics
Shoreline retreat and marsh edge erosion are determined by multiple factors, including waves, current, sediment texture, and soil strength (Marani and others, 2011; Priestas and others, 2015; Sanford and Gao, 2018). Bottom shear stress can be generated by both waves and currents, both of which can contribute to sediment deposition and erosion, resulting in gain or loss of shoreline over time (Wang and others, 2021). In high wave energy coastal areas such as Gandys Beach in the upper Delaware Bay, wave-induced bottom shear stress was found to play a larger role than current-induced shear stress (Wang and others, 2021). In this study, wave induced, current induced, and wave-current induced bottom shear stresses at the wave gage and current velocity measurement locations along the Little Toms Cove shoreline were calculated according to Soulsby and others (1993) and Swart (1974). It was found that values of the current-induced shear stress had ranges of 0–0.06 Newton per square meter (N/m2) (STCMs) and 0–0.9 N/m2 (LTCMs), whereas the values of wave-induced shear stress had a range of 0–0.25 N/m2, suggesting that tidal current is the major factor rather than waves in determining shoreline erosion, although both tidal current and waves played a role on shoreline and marsh edge erosion along the shoreline during the 2 months of field monitoring.
Due to the geophysical setting of the study area (for example, along the shoreline in Toms Cove, protected from large wave energy entering from the Chincoteague Inlet, fig. 1B), the shoreline in Toms Cove is affected by low wave energy (for example, significant wave height is normally <0.2 m, although it can reach about 0.4 m during a storm period). Small waves, although more frequent, were found to have little effect on bay bottom and adjacent marshes (Wiberg and others, 2019). Therefore, it is understandable that although the oyster castles can still reduce wave height under emergent and slight inundation conditions, vertical surface erosion in marsh edge and mudflat behind the oyster castles tends to be higher than sites in the control area during submerged conditions. In contrast, our current data showed that current velocity behind the oyster castles could be enhanced by the constructed structure in the area near the end of the oyster castles, where marsh edge scours were observed. This study indicates that LSS such as the oyster castles in low wave energy shallow coastal shoreline areas will change the circulation pattern (velocity field) in and around the area protected by the LSS, but the change in direction (increase, no change, or decrease in velocity) and magnitude will depend on local topography, structure characteristics (shape and configuration), and wind and tidal conditions (Kitsikoudis and others, 2020).
It was found that shear stress comparisons at locations on both lee side and ocean side of the oyster castles showed that bottom shear stress increased from the location (STCM3) in front of the oyster castles to the locations (STCM1 and STCM4) behind the oyster castles (fig. 18). This pattern could be responsible for the potential increased vertical surface erosion in the marsh edge and mudflat area behind the oyster castles.
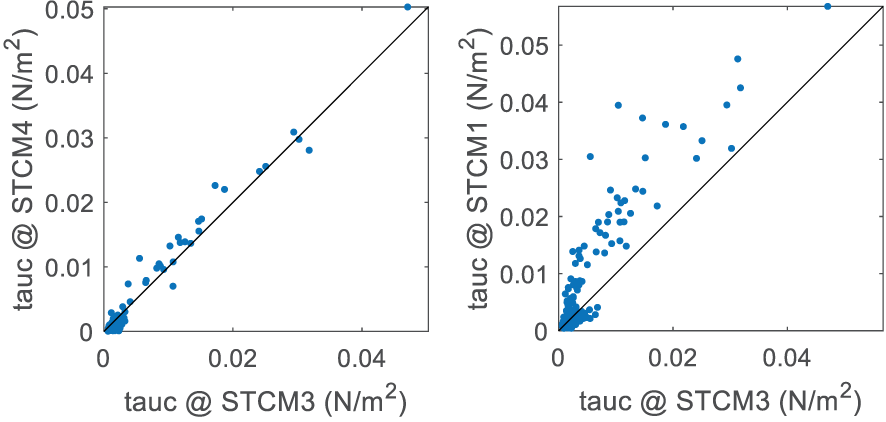
Comparison of current-induced bottom shear stress at nearshore locations along the Little Toms Cove living shoreline, Chincoteague, Virginia. STCM, short tilt current meter; tauc, bottom shear stress; N/m2, Newton per square meter; @, at.
As with other coastal shorelines, such as those in the Virginia Coast Reserve (Nardin and others, 2020) and within Chincoteague Bay (Priestas and others, 2015), there is very limited sediment supply and delivery to the salt marshes from the river and offshore sources. Most of the sediment transport, erosion, and depositional processes along the Little Toms Cove shoreline are also related to sediment redistribution within the system. The erosion of sediment from marsh edges can lead to the suspension of finer grained sediments (Carruthers and others, 2011), which may explain the accumulation of finer sediment in the marsh edge and mudflat area behind the oyster castles. Considering the limited protection of the Little Toms Cove shoreline from erosion driven mainly by tidal current induced shear stress and limited sources of sediment supply, it is necessary to utilize mineral sediment from other sources, such as beneficial use of dredged materials, to bring mineral sediment into this study area for shoreline restoration as a critical component of this living shoreline restoration.
Contributions of Oyster Castles to Shoreline Protection and Oyster Habitat Enhancement
The goals of the living shoreline restoration in Chincoteague Bay include not only increasing resiliency of salt marsh habitat and adjacent infrastructure to withstand future storms, but also providing ecosystem services such as nutrient removal, uptake of sediments, water filtration, and habitat for other marine organisms (Holcomb and Lusk, 2016). It was found that the oyster castles play a limited role in reducing wave and current energy thus reducing shoreline and marsh edge erosion along the Little Toms Cove shoreline. Although the oyster castles may not be capable of reducing elevation loss and sediment erosion in marsh edge and mudflat behind them, reduced lateral marsh edge erosion was found in this study at locations protected by the structures. Studies found that the effect of oyster reefs could be enhanced by extending the width and height of the reefs depending on immersion time in the investigated site (Chowdhury and others, 2019). For oyster castles along the Little Toms Cove living shoreline, crest height is at the design upper limit (~0.5 m). Although placing the oyster castles closer to the shore (that is, making the oyster castle crest elevation slightly higher than the marsh edge toe) to protect marsh edge erosion, their role in protecting shoreline erosion will still be limited based on this study’s analysis of wave and current dynamics with and without the structures. Alternatively, studies found that oyster reefs need to be inundated at 60–80 percent in the intertidal zone for optimal recruitment, growth, and survival (Solomon and others, 2014; Marshall and La Peyre, 2020; Morris and others, 2021). The oyster castle inundation duration was found to be 61 percent (49–65 percent using highest and lowest castle crest elevation), suggesting that oyster castles constructed along the Little Toms Cove shoreline meet the habitat requirement of the oyster population. In this study, field observation showed that oysters had grown on almost all of the castles from the bare blocks 2 years after castle construction (fig. 5). Field oyster monitoring data using 0.25 m x 0.25 m quadrats collected on the castles by The Nature Conservancy and Shippensburg University showed that spat shell growth increased 50.6 percent from 9.2 millimeters (mm) in August 2016 to 18.7 mm in September 2017, and adult oyster growth increased 12.1 percent from 41.5 mm in September 2017 to 47.2 mm in August 2018. Results of this study clearly demonstrate that the oyster castles along the Little Toms Cove shoreline play a limited role in shoreline protection; however, they do play a significant role in enhancing oyster habitat suitability. Even during the period when current velocity increased due to the impact of the oyster castles, velocities around the oyster castles (in front of and behind) were <10 cm/s, a velocity threshold above which oyster feeding could be inhibited (Wang and others, 2021).
Another indication of enhanced oyster habitat by the LSS is that the mean grain size of sediment to a depth of 10 cm at the marsh edge and mudflat protected by oyster castles was reduced to 0.064 mm compared to 0.094 mm in the control area (table 4), and mean sediment grain sizes in the traps and on the tiles were all <0.05 mm (most of them in the range of 0.01–0.02 mm). A mean grain size of 0.08 mm was identified as a critical threshold for reef growth to outpace mortality from sediment accumulation-induced burying (Housego and Rosman, 2016). Note that with enhanced oyster growth on these oyster castles over time, it is predicted that the effect of oyster castles in reducing shoreline and marsh edge erosion will be increased or be maintained in the face of rising sea level as a result of the positive feedback between oyster reef growth and reduction of shoreline erosion as the system evolves (Morris and others, 2019).
Future Research Opportunities
This study collected data on wave, current, and sediment dynamics over 2 winter months along the Little Toms Cove living shoreline, a low wave energy coastal area. Since the goals of living shoreline projects are to promote long-term coastal sustainability under future climate change and sea level rise by combining engineering (shoreline protection) and ecological (habitat enhancement) benefits, more research can help to examine the long-term engineering and ecological benefits of living shoreline restoration projects. Sustainable living shoreline using oyster reefs under future climate change and sea level rise is achievable (Rodriguez and others, 2014; Morris and others, 2021; Salatin and others, 2022). Based on the lessons learned from this study, future research could be conducted including:
-
1 Expand the monitoring of wave, current, and sediment dynamics into other seasons (for example, summer or hurricane season) and multiple years.
-
2 Add concurrent and continuous monitoring of water column total suspended solid concentration and salinity in areas with and without LSS to fully understand the relation between hydrodynamic forcing and sediment transport, deposition, and erosion since sediment traps do not provide accurate information about the fluxes of particles in motion (Storlazzi and others, 2011).
-
3 Add locations on the submerged oyster castle crest to measure wave height, current velocity (depth profile), and sediment concentration to the monitoring plan to examine hydrodynamic forcing change and oyster biological processes (such as recruitment, growth, and mortality) with and without LSS.
-
4 Couple wave, hydrodynamic, and sediment transport models to better examine the effect of LSS on wave attenuation, current pattern change, and sediment deposition and erosion with sufficient spatial resolution of model grids to resolve the small LSS because it is almost impossible to select control sites in field studies with the same spatial varying estuarine environment.
-
5 Add field measurements of aboveground and belowground marsh productivity to understand the contribution of both organic matter and mineral sediments to marsh elevation change and sediment deposition and erosion along living shorelines.
-
6 Couple physical and ecological models (for example, coupled hydrodynamic, water quality, and oyster population modeling system) to understand and optimize both engineering and ecological benefits of different designs of living shoreline restoration projects under future storm conditions.
Summary
-
1 Wave attenuation by oyster castles in Chincoteague living shoreline project area, a low wave energy environment, is dependent on water depth, wind speed, wind direction, and local bathymetry. This is consistent with the finding in a high wave energy environment such as Gandys Beach, New Jersey. Wave attenuation potential along the living shorelines is limited especially during high tide under both energy environments.
-
2 Living shoreline structures such as oyster castles could affect local current velocity and its spatial and temporal patterns as a result of the combined wind-induced waves and tidal forcing. Nevertheless, in a low wave energy environment such as the Little Toms Cove living shoreline area, tidal current is the major factor rather than waves in determining shoreline erosion.
-
3 Living shoreline restoration projects are complex coupled ecological and engineering systems. In situ measurements with limited spatial and temporal coverages are not sufficient to quantify the total effects of living shoreline projects. It is challenging to define a true “control site” for comparison due to the complex, heterogenous morphodynamical and ecological processes.
-
4 Numerical models validated by the short-term field data may serve as a tool to predict the long-term impact of living shoreline projects. The data collected at Toms Cove can be valuable for further studies, particularly the calibration and validation of wave, hydrodynamic, and sediment transport numerical models.
References Cited
Abt Associates, 2019, Case study—Cost-effectiveness of reducing coastal erosion through living shorelines in the Hurricane Sandy coastal resilience program: National Fish and Wildlife Foundation and U.S. Department of the Interior, prepared by Abt Associates, Rockville, Maryland, 25 p. [Also available at https://www.nfwf.org/sites/default/files/hurricanesandy/Documents/hurricane-sandy-living-shoreline-case-study.pdf.]
Babson, A.L., Bennett, R.O., Adamowicz, S., and Stevens, S., 2020, Coastal impacts, recovery, and resilience post-Hurricane Sandy: Estuaries and Coasts, v. 43, no. 7, p. 1603−1609, accessed June 5, 2022, at https://doi.org/10.1007/s12237-020-00809-x.
Bredes, A.L., Miller, J.K., Kerr, L., and Brown, D.R., 2022, Observations of wave height amplification behind an oyster castle breakwater system in a high-energy environment—Gandys Beach, NJ: Frontiers in Built Environment, v. 8, article 884795, accessed September 20, 2022, at https://doi.org/10.3389/fbuil.2022.884795.
Campbell, A., and Wang, Y., 2020, Assessment of salt marsh change on Assateague Island national seashore between 1962 and 2016: Photogrammetric Engineering and Remote Sensing, v. 86, no. 3, p. 187–194, accessed June 2, 2022, at https://doi.org/10.14358/PERS.86.3.187.
Capurso, W.D., Niemoczynski, L.M., Chen, Q., Wang, H., Snedden, G.A., Holcomb, K.S., Wang, N., and Zhu, L., 2022, Topographic and bathymetry survey (2019) along the Chincoteague Living Shoreline, Virginia: U.S. Geological Survey data release, https://doi.org/10.5066/P9I0B0X4.
Carruthers, T., Beckert, K., Dennison, B., Thomas, J., Saxby, T., Williams, M., Fisher, T., Kumer, J., Schupp, C., Sturgis, B., and Zimmerman, C., 2011, Assateague Island National Seashore Natural Resource Condition Assessment, Maryland, Virginia: U.S. Department of the Interior, National Park Service, Natural Resource Report NPS/ASIS/NRR—2011/405, 182 p.
Chambers, R., Gorsky, A.L., Isdell, R., Mitchell, M., and Bilkovic, D.M., 2021, Comparison of nutrient accrual in constructed living shoreline and natural fringing marshes: Ocean and Coastal Management, v. 199, article 105401, accessed July 9, 2022, at https://doi.org/10.1016/j.ocecoaman.2020.105401.
Chowdhury, M.S.N., Walles, B., Sharifuzzaman, S.M., Shahada Hossain, M., Ysebaert, T., and Smaal, A.C., 2019, Oyster breakwater reefs promote adjacent mudflat stability and salt marsh growth in a monsoon dominated subtropical coast: Scientific Reports, v. 9, no. 1, article 8549, accessed June 10, 2022, at https://doi.org/10.1038/s41598-019-44925-6.
Colden, A.M., Fall, K.A., Cartwright, G.M., and Friedrichs, C.T., 2016, Sediment suspension and deposition across restored oyster reefs of varying orientation to flow—Implications for restoration: Estuaries and Coasts, v. 39, no. 5, p. 1435–1448, accessed July 18, 2022, at https://doi.org/10.1007/s12237-016-0096-y.
Converse, J., Wengrove, M., and Lomonaco, P., 2020, Observations of wave attenuation, scour, and subsurface pore pressures across three marsh restoration sill structures on a sandy bed: Shore and Beach, v. 88, no. 3, p. 14–30, accessed June 8, 2022, at https://doi.org/10.34237/1008832.
Dugan, J.E., Emery, K.A., Alber, M., Alexander, C.R., Byers, J.E., Gehman, A.M., McLenaghan, N., and Sojka, S.E., 2018, Generalizing ecological effects of shoreline armoring across soft sediment environments: Estuaries and Coasts, v. 41, no. S1, p. 180–196, accessed June 10, 2022, at https://doi.org/10.1007/s12237-017-0254-x.
Dutta, S., Biber, P.D., and Boyd, C.A., 2021, Nearshore sediment comparisons among natural, living, and armored shorelines in Mobile Bay, Alabama: Southeastern Naturalist, v. 20, no. 1, p. 135–151, accessed June 10, 2022, at https://aquila.usm.edu/fac_pubs/18492.
Fivash, G.S., Stüben, D., Bachmann, M., Walles, B., van Belzen, J., Didderen, K., Temmink, R.J.M., Lengkeek, W., van der Heide, T., and Bouma, T.J., 2021, Can we enhance ecosystem-based coastal defense by connecting oysters to marsh edges?—Analyzing the limits of oyster reef establishment: Ecological Engineering, v. 165, article 106221, accessed September 10, 2022, at https://doi.org/10.1016/j.ecoleng.2021.106221.
Holcomb, K., and Lusk, B., 2016, Oyster reef restoration at Chincoteague National Wildlife Refuge, VA, in National Summit on Coastal and Estuarine Restoration, 8th, and The Coastal Society, 25th Biennial Meeting, New Orleans, Louisiana, December 10–15, 2016, Proceedings: Arlington, Virginia, Restore America’s Estuaries [RAE], 1 p.
Housego, R.M., and Rosman, J.H., 2016, A model for understanding the effects of sediment dynamics on oyster reef development: Estuaries and Coasts, v. 39, no. 2, p. 495–509, accessed August 10, 2022, at https://doi.org/10.1007/s12237-015-9998-3.
Karimpour, A., and Chen, Q., 2017, Wind wave analysis in depth limited water using OCEANLYZ, a MATLAB toolbox: Computers & Geosciences, v. 106, p. 181–189, accessed May 10, 2022, at https://doi.org/10.1016/j.cageo.2017.06.010.
Kitsikoudis, V., Kibler, K.M., and Walters, L.J., 2020, In-situ measurements of turbulent flow over intertidal natural and degraded oyster reefs in an estuarine lagoon: Ecological Engineering, v. 143, article 105688, accessed June 10, 2022, at https://doi.org/10.1016/j.ecoleng.2019.105688.
Leonardi, N., Ganju, N.K., and Fagherazzi, S., 2016, A linear relationship between wave power and erosion determines salt-marsh resilience to violent storms and hurricanes: Proceedings of the National Academy of Sciences of the United States of America, v. 113, no. 1, p. 64–68, accessed May 10, 2022, at https://doi.org/10.1073/pnas.1510095112.
Marani, M., D’Alpaos, A., Lanzoni, S., and Santalucia, M., 2011, Understanding and predicting wave erosion of marsh edges: Geophysical Research Letters, v. 38, no. 21, article L21401, 5 p., accessed September 15, 2022, at https://doi.org/10.1029/2011GL048995.
Marshall, D.A., and La Peyre, M.K., 2020, Effects of inundation duration on southeastern Louisiana oyster reefs: Experimental Results, v. 1, p. e30, accessed October 5, 2022, at https://doi.org/10.1017/exp.2020.35.
Morris, R.L., Bilkovic, D.B., Boswell, M.K., Bushek, D., Cebrian, J., Goff, J., Kibler, K.M., La Peyre, M.K., McClenachan, G., Moody, J., Sacks, P., Shinn, J.P., Sparks, E.L., Temple, N.A., Walters, L.J., Webb, B.M., and Swearer, S., 2019, The application of oyster reefs in shoreline protection—Are we over-engineering for an ecosystem engineer?: Journal of Applied Ecology, v. 56, no. 7, p. 1703–1711, accessed September 10, 2022, at https://doi.org/10.1111/1365-2664.13390.
Morris, R.L., La Peyre, M.K., Webb, B.M., Marshall, D.A., Bilkovic, D.M., Cebrian, J., McClenachan, G., Kibler, K.M., Walters, L.J., Bushek, D., Sparks, E.L., Temple, N.A., Moody, J., Angstadt, K., Goff, J., Boswell, M., Sacks, P., and Swearer, S.E., 2021, Large-scale variation in wave attenuation of oyster reef living shorelines and the influence of inundation duration: Ecological Applications, v. 31, no. 6, article e02382, 15 p., accessed September 9, 2022, at https://doi.org/10.1002/eap.2382.
Nardin, W., Lera, S., and Nienhuis, J., 2020, Effect of offshore waves and vegetation on the sediment budget in the Virginia Coast Reserve (VA): Earth Surface Processes and Landforms, v. 45, no. 12, p. 3055–3068, accessed July 26, 2022, at https://doi.org/10.1002/esp.4951.
Paul, M., Bouma, T.J., and Amos, C.L., 2012, Wave attenuation by submerged vegetation—Combining the effect of organism traits and tidal current: Marine Ecology Progress Series, v. 444, p. 31–41, accessed July 8, 2022, at https://doi.org/10.3354/meps09489.
Polk, M.A., and Eulie, D.O., 2018, Effectiveness of living shorelines as an erosion control method in North Carolina: Estuaries and Coasts, v. 41, no. 8, p. 2212–2222, accessed June 1, 2022, at https://doi.org/10.1007/s12237-018-0439-y.
Polk, M.A., Gittman, R.K., Smith, C.S., and Eulie, D.O., 2022, Coastal resilience surges as living shorelines reduce lateral erosion of salt marshes: Integrated Environmental Assessment and Management, v. 18, no. 1, p. 82–98, accessed June 8, 2022, at https://doi.org/10.1002/ieam.4447.
Priestas, A., Mariotti, G., Leonardi, N., and Fagherazzi, S., 2015, Coupled wave energy and erosion dynamics along a salt marsh boundary, Hog Island Bay, Virginia, USA: Journal of Marine Science and Engineering, v. 3, no. 3, p. 1041–1065, accessed June 20, 2022, at https://doi.org/10.3390/jmse3031041.
Rodriguez, A.B., Fodrie, F.J., Ridge, J.T., Lindquist, N.L., Theuerkauf, E.J., Coleman, S.E., Grabowski, J.H., Brodeur, M.C., Gittman, R.K., Keller, D.A., and Kenworthy, M.D., 2014, Oyster reefs can outpace sea-level rise: Nature Climate Change, v. 4, no. 6, p. 493–497, accessed August 15, 2022, at https://doi.org/10.1038/nclimate2216.
Safak, I., Norby, P.L., Dix, N., Grizzle, R.E., Southwell, M., Veenstra, J.J., Acevedo, A., Coooper-Kolb, T., Massey, L., Sheremet, A., and Angelini, C., 2020, Coupling breakwalls with oyster restoration structures enhances living shoreline performance along energetic shorelines: Ecological Engineering, v. 158, article 106071, 11 p., accessed June 5, 2022, at https://doi.org/10.1016/j.ecoleng.2020.106071.
Salatin, R., Wang, H., Chen, Q., and Zhu, L., 2022, Assessing wave attenuation with rising sea levels for sustainable oyster reef-based living shorelines: Frontiers in Built Environment, v. 8, article 884849, accessed September 10, 2022, at https://doi.org/10.3389/fbuil.2022.884849.
Sanford, L.P., and Gao, J., 2018, Influences of wave climate and sea level on shoreline erosion rates in the Maryland Chesapeake Bay: Estuaries and Coasts, v. 41, no. S1, p. 19–37, accessed June 8, 2022, at https://doi.org/10.1007/s12237-017-0257-7.
Scyphers, S.B., Powers, S.P., Heck, K.L., and Byron, D., 2011, Oyster reefs as natural breakwaters mitigate shoreline loss and facilitate fisheries: PLoS One, v. 6, no. 8, article e22396, accessed June 5, 2022, at https://doi.org/10.1371/journal.pone.0022396.
Sharma, S., Goff, J., Cebrian, J., and Ferraro, C., 2016, A hybrid shoreline stabilization technique—Impact of modified intertidal reefs on marsh expansion and nekton habitat in the northern Gulf of Mexico: Ecological Engineering, v. 90, p. 352–360, accessed July 20, 2022, at https://doi.org/10.1016/j.ecoleng.2016.02.003.
Solomon, J.A., Donnelly, M.J., and Walterst, L.J., 2014, Effects of sea level rise on the intertidal oyster Crassostrea virginica by field experiments: Journal of Coastal Research, v. 68, p. 57–64, accessed October 10, 2022, at https://doi.org/10.2112/SI68-008.1.
Soulsby, R.L., Hamm, L., Klopman, G., Myrhaug, D., Simons, R.R., and Thomas, G.P., 1993, Wave-current interaction within and outside the bottom boundary layer: Coastal Engineering, v. 21, no. 1–3, p. 41–69, accessed July 28, 2022, at https://doi.org/10.1016/0378-3839(93)90045-A.
Spiering, D.W., Kibler, K.M., Kitsikoudis, V., Donnelly, M.J., and Walters, L.J., 2021, Detecting hydrodynamic changes after living shoreline restoration and through an extreme event using a Before-After-Control-Impact experiment: Ecological Engineering, v. 169, article 106306, accessed October 8, 2022, at https://doi.org/10.1016/j.ecoleng.2021.106306.
Storlazzi, C.D., Elias, E., Field, M.E., and Presto, M.K., 2011, Numerical modeling of the impact of sea-level rise on fringing coral reef hydrodynamics and sediment transport: Coral Reefs, v. 30, S1, p. 83–96, accessed June 8, 2022, at https://doi.org/10.1007/s00338-011-0723-9.
Sutton-Grier, A.E., Wowk, K., and Bamford, H., 2015, Future of our coasts: The potential for natural and hybrid infrastructure to enhance the resilience of our coastal communities, economies and ecosystems: Environmental Science & Policy, v. 51, p. 137–148, accessed September 5, 2022, at https://doi.org/10.1016/j.envsci.2015.04.006.
Swart, D.H., 1974, Offshore sediment transport and equilibrium beach profiles: Delft, Netherlands, W.D. Meinema, Delft University of Technology, Ph.D. dissertation, 323 p. [Also available at https://repository.tudelft.nl/islandora/object/uuid%3A057cb136-5f5b-484a-878d-5616fbaeda4e.]
Theuerkauf, S.J., Eggleston, D.B., Puckett, B.J., and Theuerkauf, K.W., 2017, Wave exposure structures oyster distribution on natural intertidal reefs, but not on hardened shorelines: Estuaries and Coasts, v. 40, no. 2, p. 376–386, accessed September 3, 2022, at https://doi.org/10.1007/s12237-016-0153-6.
Wang, H., Capurso, W., Chen, Q., Zhu, L., Niemoczynski, L., and Snedden, G., 2021, Assessment of wave attenuation, current patterns and sediment deposition and erosion during winter storms by living shoreline structures in Gandys Beach, New Jersey: U.S. Geological Survey Open-File Report 2021–1040, 37 p. [Also available at https://doi.org/10.3133/ofr20211040.]
Wang, H., Chen, Q., Capurso, W.D., Niemoczynski, L.M., Wang, N., Zhu, L., Snedden, G.A., and Holcomb, K.S., 2022a, Field observation of wind waves (2019) along the Chincoteague Living Shoreline, Virginia: U.S. Geological Survey data release, https://doi.org/10.5066/P9CUF4UZ.
Wang, H., Chen, Q., Capurso, W.D., Niemoczynski, L.M., Wang, N., Zhu, L., Snedden, G.A., and Holcomb, K.S., 2022b, Field observation of current velocities (2019) along the Chincoteague Living Shoreline, Virginia: U.S. Geological Survey data release, https://doi.org/10.5066/P903FIH7.
Whitman, E.R., and Reidenbach, M.A., 2012, Benthic flow environments affect recruitment of Crassostrea virginica larvae to an intertidal oyster reef: Marine Ecology Progress Series, v. 463, p. 177–191, accessed June 6, 2022, at https://doi.org/10.3354/meps09882.
Wiberg, P.L., Taube, S.R., Ferguson, A.E., Kremer, M.R., and Reidenbach, M.A., 2019, Wave attenuation by oyster reefs in shallow coastal bays: Estuaries and Coasts, v. 42, no. 2, p. 331–347, accessed June 10, 2022, at https://doi.org/10.1007/s12237-018-0463-y.
Ysebaert, T., Yang, S., Zhang, L., He, Q., Bouma, T.J., and Herman, P.M.J., 2011, Wave attenuation by two contrasting ecosystem engineering salt marsh macrophytes in the intertidal pioneer zone: Wetlands, v. 31, no. 6, p. 1043–1054, accessed August 1, 2022, at https://doi.org/10.1007/s13157-011-0240-1.
Zhu, L., Chen, Q., Wang, H., Capurso, W., Niemoczynski, L., Hu, K., and Snedden, G., 2020, Field observations of wind waves in upper Delaware Bay with living shorelines: Estuaries and Coasts, v. 43, no. 4, p. 739–755, accessed August 18, 2022, at https://doi.org/10.1007/s12237-019-00670-7.
Appendix 1. Wind Rose at Toms Cove, Virginia
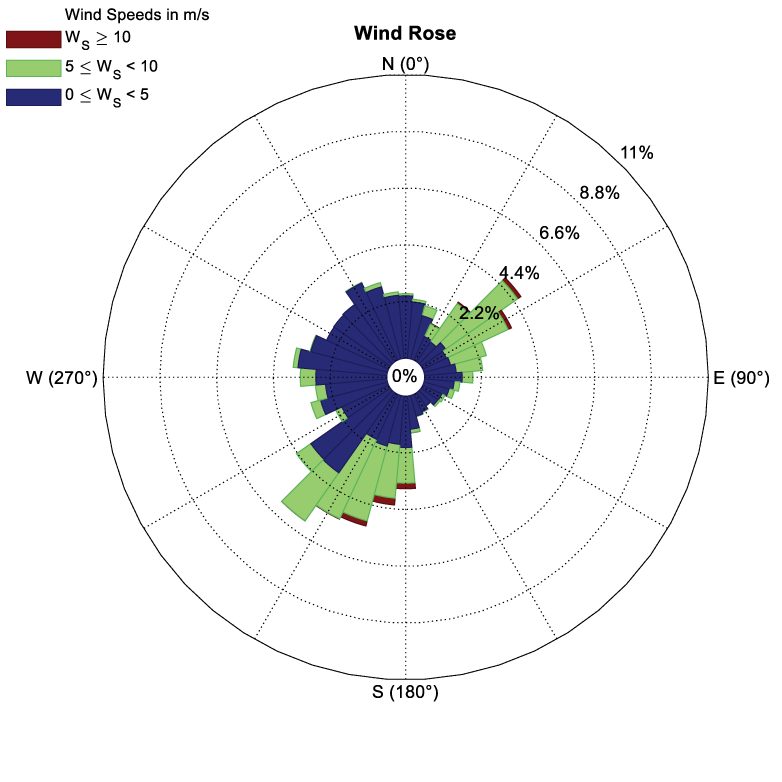
The wind rose shows the wind directions and wind speeds during March 1–May 2, 2019, at Toms Cove, Chincoteague National Wildlife Refuge, Virginia. m/s, meter per second; Ws,wind speed; N, north; E, east; S, south; W, west; ≥, greater than or equal to; ≤, less than or equal to; <, less than; °, degree; %, percent.
Conversion Factors
International System of Units to U.S. customary units
Temperature in degrees Celsius (°C) may be converted to degrees Fahrenheit (°F) as follows: °F = (1.8 × °C) + 32.
Temperature in degrees Fahrenheit (°F) may be converted to degrees Celsius (°C) as follows: °C = (°F – 32) / 1.8.
Datums
Vertical coordinate information is referenced to the North American Vertical Datum of 1988 (NAVD 88).
Horizontal coordinate information is referenced to the North American Datum of 1983 (NAD 83), unless otherwise noted.
Elevation, as used in this report, refers to distance above the vertical datum.
For more information about this publication, contact
Director, Wetland and Aquatic Research Center
U.S. Geological Survey
7920 NW 71st St.
Gainesville, FL 32653
For additional information, visit
https://www.usgs.gov/centers/wetland-and-aquatic-research-center-warc
Publishing support provided by
Lafayette Publishing Service Center
Disclaimers
Any use of trade, firm, or product names is for descriptive purposes only and does not imply endorsement by the U.S. Government.
Although this information product, for the most part, is in the public domain, it also may contain copyrighted materials as noted in the text. Permission to reproduce copyrighted items must be secured from the copyright owner.
Suggested Citation
Wang, H., Chen, Q., Wang, N., Capurso, W.D., Niemoczynski, L.M., Zhu, L., Snedden, G.A., Holcomb, K.S., Lusk, B.W., Wilson, C.A., and Cornell, S.R., 2023, Monitoring of wave, current, and sediment dynamics along the Chincoteague living shoreline, Virginia: U.S. Geological Survey Open-File Report 2023–1020, 32 p., https://doi.org/10.3133/ofr20231020.
ISSN: 2331-1258 (online)
Study Area
| Publication type | Report |
|---|---|
| Publication Subtype | USGS Numbered Series |
| Title | Monitoring of wave, current, and sediment dynamics along the Chincoteague living shoreline, Virginia |
| Series title | Open-File Report |
| Series number | 2023-1020 |
| DOI | 10.3133/ofr20231020 |
| Publication Date | April 13, 2023 |
| Year Published | 2023 |
| Language | English |
| Publisher | U.S. Geological Survey |
| Publisher location | Reston, VA |
| Contributing office(s) | New York Water Science Center, Wetland and Aquatic Research Center |
| Description | Report: viii, 32 p.; 2 Data Releases |
| Country | United States |
| State | Virginia |
| Other Geospatial | Assateague Bay, Chincoteague National Wildlife Refuge, Little Tom's Cove |
| Online Only (Y/N) | Y |