

Distribution of Chlorinated Volatile Organic Compounds and Per- and Polyfluoroalkyl Substances in Groundwater and Surface Water at the former Naval Air Warfare Center, West Trenton, New Jersey, 2018
Links
- Document: Report (11.2 MB pdf) , HTML , XML
- Data Release: USGS data release - Concentrations of chlorinated volatile organic compounds and per- and polyfluoroalkyl substances in groundwater and surface water, former Naval Air Warfare Center, West Trenton, New Jersey
- NGMDB Index Page: National Geologic Map Database Index Page (html)
- Download citation as: RIS | Dublin Core
Abstract
Groundwater wells and surface-water storm sewers contaminated with volatile organic compounds (VOCs) and per- and polyfluoroalkyl substances (PFASs) at the former Naval Air Warfare Center (NAWC) site in West Trenton, New Jersey were sampled in 2018 as part of the Navy’s long-term monitoring program. Trichloroethene (TCE), cis-1,2-dichloroethene (cisDCE), and vinyl chloride concentrations were plotted in map view and selected cross sections to elucidate the vertical and horizontal extent and distribution of contamination, along with a tabular comparison between 2018 and previous analytical results. The 2018 data showed that the areas of VOC contamination (>1 microgram per liter) decreased slightly on the north and east sides of the NAWC site from previous sampling dates; these decreases are attributed to the influence of the pump-and-treat system, natural attenuation processes, and various engineered bioaugmentation experiments that have occurred onsite. Off-site groundwater samples indicate the VOC contaminated groundwater is likely hydraulically constrained by the pump-and-treat system and appears to not be moving offsite to the south and west of NAWC. Only one offsite well, 50BR, located along the eastern margin of the site, was found to have detectable TCE and cisDCE concentrations, indicating that VOC contamination continues to migrate a short distance offsite to the east. Detectable VOC contamination was found in wells as deep as 200 and 221 feet on both the east and west sides of the NAWC site. Comparisons of present-day data to data from past sampling efforts indicate that TCE concentrations in most wells have decreased slowly over time.
Results from surface-water samples indicate that VOCs enter surface water predominantly through the West Ditch drainage system. Concentrations and fluxes of VOCs are higher when groundwater levels are higher, indicating contaminated groundwater discharges into the surface water system. Higher VOC concentrations at the Interceptor site relative to other sites in the West Ditch indicate the contamination in the West Ditch system is likely caused by contaminated groundwater discharging to the West Ditch storm sewer near manhole MH-140 when water table levels are high.
The pump-and-treat extraction wells at the former NAWC site were sampled for per- and polyfluoroalkyl substances (PFAS) in 2018. The suite of reported PFAS include perfluorooctane sulfonate (PFOS), perfluorooctanoic acid (PFOA), perfluorononanoic acid, and perfluorobutane sulfonate. Concentrations were plotted in map view to determine the areal extent of the PFAS contamination at the site. Extraction well 48BR sampled on the eastern half of the site was found to have PFOS and PFOA concentrations greater than the New Jersey Department of Environmental Protection Drinking Water maximum contaminant levels (MCLs), which is consistent with the distribution of highest PFAS concentrations in surface water in the OF-4 storm sewer system that drains that area, as well as previously collected PFAS concentrations in monitoring wells. On the western half of the site, the extraction well 08BR sample exceeded MCLs for PFOA and PFOS and the extraction well 22BR sample exceeded the MCL for PFOA, but samples from all other extraction wells were below the MCLs or other criteria for all PFAS analyzed. Concentrations of PFOA exceeded concentrations of PFOS on the west side of NAWC in both groundwater and surface water, which contrasts with the conditions on the east side of NAWC where PFOS concentrations exceeded PFOA concentrations. However, this observation was based on a limited number of samples on the west side of NAWC from 2018 and previous years, so more PFAS sampling is needed on the west side to assess this further.
Introduction
The former Naval Air Warfare Center (NAWC) in West Trenton, New Jersey, was a facility operated by the U.S. Navy (Navy) for testing jet aircraft engines. Activities conducted at the 65-acre site from the mid-1950s to the late 1990s involved operating jet engines under different temperatures and pressures. This operation used a heating/cooling system for adjusting the temperature of the air delivered to the engine test cells. The system reportedly used more than 25,000 gallons of trichloroethene (TCE) as the refrigerant (International Technology Corporation, 1994). During 40 years of operation, TCE was spilled or leaked from the system and subsequently seeped into the fractured bedrock aquifer beneath the NAWC site. As a result, groundwater at the NAWC site became highly contaminated with TCE and its degradation products. In addition, to prepare for the possibility of aircraft engine fires during testing, the base fire-department practiced fire-abatement using aqueous film-forming foam (AFFF). Between 1960 and the early 1990s, AFFFs contained high concentrations of per- and polyfluoroalkyl substances (PFAS). Recently, PFAS contamination was identified at NAWC with the highest concentrations in water from the wells and storm sewers on the east side of the site (Tetra Tech, 2018; Imbrigiotta and Fiore, 2021).
The volatile organic compound (VOC) contamination in groundwater and surface water at NAWC has been monitored extensively over the past 25 years by the Navy, its contractors, and the U.S. Geological Survey (USGS). The Navy and the New Jersey Department of Environmental Protection (NJDEP) use these data to determine the extent and migration of contamination and whether contaminated groundwater is hydraulically contained by the onsite pump-and-treat system. PFAS concentrations in the groundwater have only been monitored since 2015. The USGS supports the Navy monitoring efforts by evaluating the areal and vertical extent of contaminant concentrations and interpreting the temporal changes in contamination across the NAWC site. Published USGS interpretations of site-scale water quality and contamination conditions at NAWC include Lacombe (2000), Chapelle and others (2012), and Imbrigiotta and Fiore (2021).
Purpose and Scope
This report presents the concentrations of VOCs and PFAS in samples collected in 2018 at the NAWC site. Concentrations of TCE, cis-1,2-dichloroethene (cisDCE), vinyl chloride (VC), PFOS (perfluorooctane sulfonate), PFOA (perfluorooctanoic acid), PFNA (perfluorononanoic acid), and PFBS (perfluorobutane sulfonate) in groundwater and surface-water samples collected during 2018 at NAWC were tabulated and evaluated. The areal and vertical distributions of contamination are presented on maps and cross sections. Concentrations measured in samples collected in 2018 are compared to those reported for the most recent previous sampling date.
Background
Geology and Groundwater Hydrology at NAWC
The geology of NAWC is described by Lacombe (2000) and Lacombe and Burton (2010). The upper 7–10 feet (ft) of surficial sediments at NAWC are composed primarily of soil and fill material brought in for leveling the site. Bedrock weathering created a layer of unconsolidated saprolite present to depths of 25 to 40 ft below land surface. Below this weathered layer, a fractured sedimentary bedrock aquifer exists, composed primarily of mudstones and siltstones of the Lockatong Formation and sandstones of the Stockton Formation (fig. 1). The Lockatong Formation contains thin, fissile mudstones that appear black from a high organic carbon content, and which are the primary water-bearing units at the site. There are six of these fissile mudstone units mapped at NAWC (fig. 1; appendix 1; Lacombe and Burton, 2010; Fiore and Lacombe, 2020): BlkFis-159, BlkFis-172, BlkFis-190, BlkFis-233, BlkFis-246, and BlkFis-262. Both formations are composed of a series of sloping beds that dip to the northwest and strike northeast-southwest. The Stockton Formation and Lockatong Formation are separated by a fault that strikes about N 65° E and dips at least 70° SW. This fault is a zone of offset discontinuous geologic beds of the Lockatong and Stockton Formations whose attitudes range from flat-lying to overturned. The fault zone is heavily brecciated and is highly weathered, containing considerable amounts of clay that create a low-permeability barrier to groundwater flow between the formations.
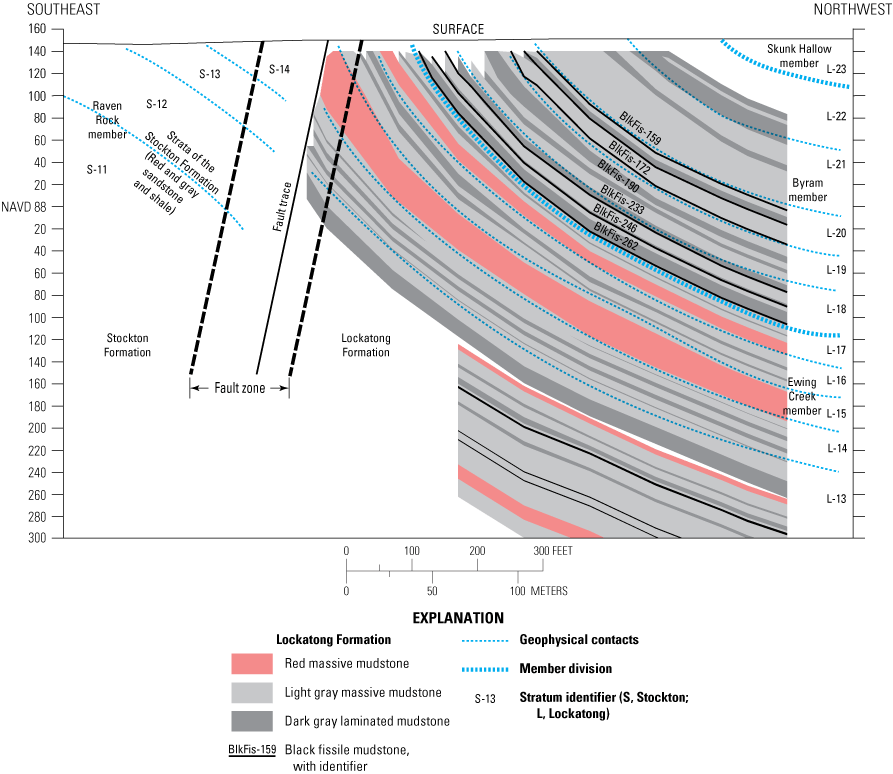
Conceptual dip-aligned geologic cross section of the former Naval Air Warfare Center, West Trenton, New Jersey. Modified from Lacombe and Burton (2010).
Most groundwater flow at NAWC occurs through fractures parallel to the bedding plane along strike, and through dip-aligned fractures between the sloping beds (Lacombe, 2000; Lacombe, 2002; Fiore and Lacombe, 2020). Most of the bedrock deeper than 250 ft is unfractured with a low yield of water (Lacombe and Burton, 2010). When unstressed by the pump-and-treat well pumping, the shallow groundwater flow direction in the unconsolidated overburden and saprolite is generally towards Gold Run Spring located west of NAWC, and to a lesser extent, the West Ditch Spring located within NAWC (Fiore and Lacombe, 2020; appendix 1). Gold Run Spring then flows toward the ancestral west branch of Gold Run (currently culverted beneath Parkway Avenue south of NAWC) and ultimately discharges into the Delaware River (Lacombe, 2000). In the northeastern part of NAWC, Fiore and Lacombe (2020) indicate groundwater in the shallow unconsolidated subsurface may flow off-site toward the east (appendix 1). In the fractured bedrock, the general groundwater flow direction is toward the pump-and-treat wells along bedding plane fractures and dip-aligned fractures, primarily among the fissile mudstone units (Lacombe and Burton, 2010; Fiore and Lacombe, 2020). The main exception is in the eastern part of the Stockton Formation, which flows off-site toward the southeast (appendix 1). The pump-and-treat-system consists of 10 extraction wells; these wells are located throughout the site but are dominantly located in the southwestern part of the site. Pumping of the extraction wells stresses the groundwater gradients and changes the local flow directions at NAWC, thereby acting to hydraulically contain the contaminated groundwater and prevent offsite migration (Lacombe, 2000; Lacombe, 2002; Fiore and Lacombe, 2020).
VOC Contamination at NAWC
TCE was initially detected in groundwater at NAWC in the late 1980s (International Technology Corporation, 1994). Subsequent investigations determined that TCE contamination in the groundwater was located in two main areas: (1) Site 1, on the west side of the site, which included the area between Building 40 that contained the heating/cooling system and Building 41 that contained the jet engine test cells; and (2) Site 3, on the northeast side of the site, which included a former wastewater lagoon and a sludge disposal area (fig. 2). Historically, wells in the Site 1 area were found to have maximum TCE concentrations >100,000 micrograms per liter (μg/L), whereas Site 3 was characterized as having maximum TCE concentrations of <1,500 µg/L (International Technology Corporation, 1994). Breakdown products of TCE, specifically cisDCE and VC, were also detected in both areas at concentrations that exceeded the NJDEP Drinking Water maximum contaminant levels (MCLs) for TCE (1 μg/L), cisDCE (70 μg/L), and VC (1 μg/L) (New Jersey Department of Environmental Protection, 2020). NJDEP Surface Water Quality Standards for TCE and VC are 1.0 and 0.082 µg/L, respectively, but there is no regulatory limit for cisDCE in surface water.
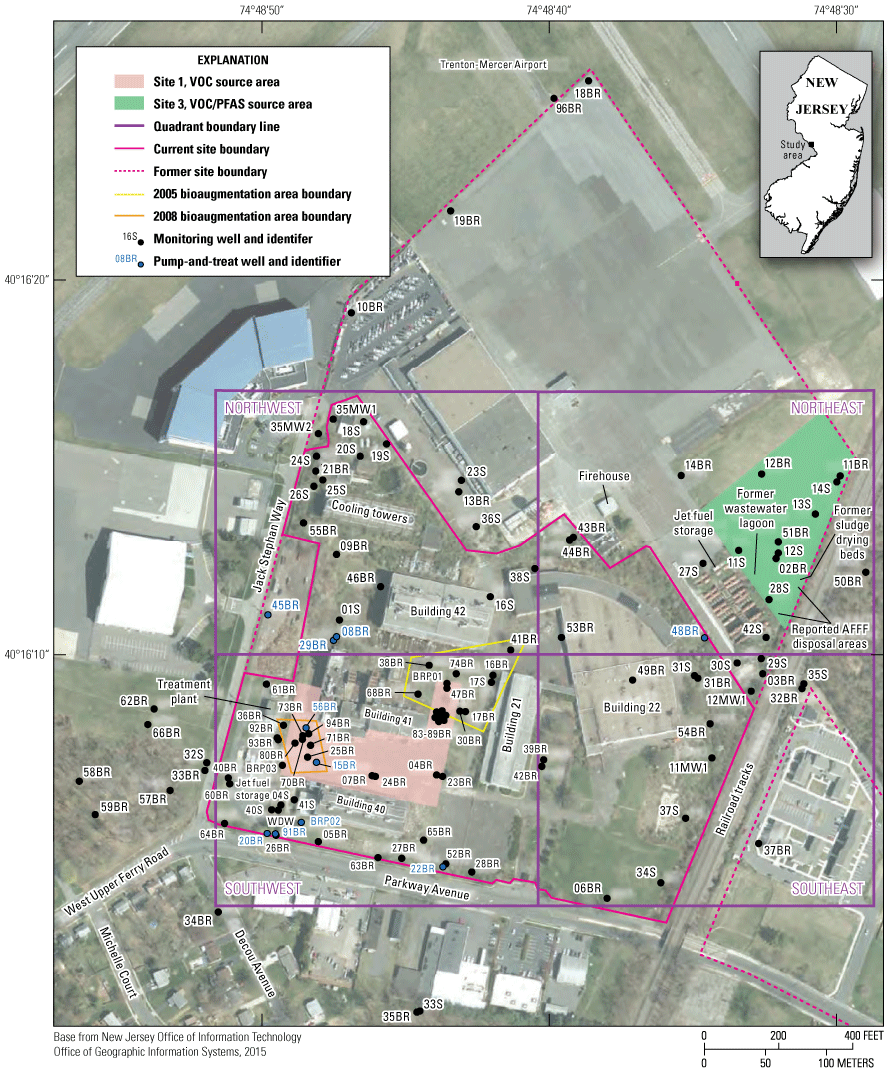
Well locations and source areas of volatile organic compounds and per- and polyfluoroalkyl substances at the former Naval Air Warfare Center, West Trenton, New Jersey. AFFF, aqueous film-forming foam; VOC, volatile organic compound; PFAS, per- and polyfluoroalkyl substances.
The Navy and its contractors established a long-term water quality monitoring program in the late 1990s (EA Engineering, Science, and Technology, Inc., 2000) in which selected wells and storm sewers at the NAWC site are sampled on a quarterly to quadrennial basis. The most recent results from years 2014 through 2017 are presented by Imbrigiotta and Fiore (2021).
Fate and Transport of VOCs at NAWC
The VOC contamination at NAWC evolved over the life of the facility in a similar manner to many sites that overlie fractured rock aquifers. The TCE used at the site was in its pure liquid form, a dense non-aqueous phase liquid (DNAPL). Since DNAPL is denser than water, when it is spilled onto the ground, it seeps into the subsurface and sinks in the aquifer under the influence of gravity (Cohen and Mercer, 1993). DNAPL TCE physically travels downward along sloping bedding partings and vertical fractures until it becomes trapped in dead-end fractures or is blocked by a low permeability layer (Cohen and Mercer, 1993). Once in the aquifer, the DNAPL TCE slowly dissolves, as it is somewhat soluble (1,100 milligrams per liter [mg/L]) (National Institute for Occupational Safety and Health, 2007), and begins traveling with the flowing groundwater. This is the scenario that undoubtedly occurred with the spilled TCE at NAWC.
Once dissolved, the concentration and distribution of TCE is affected by many natural processes (Mackay and others, 1985; Vogel and others, 1987; Wiedemeier and others, 1998). TCE is advectively transported downgradient and eventually discharges into streams, storm sewers, or extraction wells (Lacombe, 2000; Tiedeman and others, 2018). TCE may diffuse into the primary porosity of the rock matrix or sorb onto the organic materials present in the geologic formation (Goode and others, 2014). Because TCE has a high vapor pressure (National Institute for Occupational Safety and Health, 2007), TCE in shallow groundwater may volatilize into the soil gas in the unsaturated zone. TCE may be biodegraded by natural bacteria or by nonnative bacteria that have been injected into the aquifer. Biodegradation dechlorinates TCE to form products including cisDCE, VC, and ethene (Wilson and Wilson, 1985; Barrio-Lage and others, 1986; Wilson and others, 1995; Lorah and Olsen, 1999; Shapiro and others, 2018). Given that TCE was the original VOC contaminant spilled at the site, the presence of cisDCE and VC in the groundwater indicates that anaerobic biodegradation continues to occur in the aquifer at NAWC. Since spillage of TCE stopped when NAWC closed in the late 1990s, the only continuing sources of TCE to the fractured rock aquifer are possible pockets of residual DNAPL in fractures, desorption of TCE from organic materials in the aquifer, and diffusion of TCE from the primary porosity of the rock matrix.
PFAS Contamination at NAWC
Firefighting foams were reportedly used during the early 1990s along the east side of the former NAWC site during firefighting training exercises. The AFFF likely contained PFOS, PFOA, PFNA, PFBS, and other PFAS compounds (Interstate Technology & Research Council, 2018b). PFOS, PFOA, PFNA, and PFBS are highly soluble in water, have low vapor pressures that limit volatilization, have a high affinity to sorb onto soil organic matter in the geologic substrate (Interstate Technology & Research Council, 2018a), and are mostly resistant to biodegradation, though some may potentially biodegrade in certain environments (Huang and Jaffé, 2019).
Once an aquifer has been contaminated with PFAS compounds, remediation to meet Federal and state water-quality standard levels is difficult. Currently (2023), NJDEP MCLs for PFAS are 13 nanograms per liter (ng/L) for PFNA, 13 ng/L for PFOS, and 14 ng/L for PFOA (New Jersey Department of Environmental Protection, 2020). PFBS is not regulated by NJDEP, so the U.S. Environmental Protection Agency (EPA) Regional Screening Level of 400,000 ng/L is used.). When this sampling was conducted (2018), the EPA did not have MCLs for PFAS compounds but had a proposed health advisory limit (HAL) of 70 ng/L for the individual or combined concentrations of PFOS and PFOA (U.S. Environmental Protection Agency, 2016) There are no surface water-specific regulatory limits for PFAS at the state or Federal level, so PFAS concentrations in surface water are discussed with regards to the NJDEP drinking water MCLs described above (New Jersey Department of Environmental Protection, 2020).
Well Network
The NAWC well network consists of 130 wells or well zones that are located on and around the former Navy property (fig. 2; appendix 2, table 2.1). Of these wells, 85 were sampled in 2018 (appendix 3, table 3.1). Construction details of all wells at or near the NAWC site are available in Fiore (2019). These wells are used for routine monitoring of water levels (Lacombe, 2000; Lacombe, 2002; Fiore and Lacombe, 2020) as well as scheduled sampling for VOCs and inorganics. Currently (2023), 10 of the wells also serve as extraction wells for the remedial pump-and-treat system operating at the site. For the purpose of discussion in this report, the wells have been assigned to five groups on the basis of the quadrant of the site in which they are located, (1) Northeast (NE), (2) Southeast (SE), (3) Northwest (NW), (4) Southwest (SW), and (5) offsite. Wells in the offsite group are outside the quadrant boundaries on figure 2. Two areas of VOC contamination have been delineated at the NAWC site: a large area in the SW quadrant (Site 1) and a smaller area in the NE quadrant (Site 3). The wells with their respective quadrants and construction information are listed in appendix 2. The wells range from 15 ft to more than 410 ft in depth.
In 2018, 85 wells were sampled at NAWC including 16 wells in the NE quadrant, 16 wells in the SE quadrant, 11 wells in the NW quadrant, 31 wells in the SW quadrant, and 11 offsite wells. These totals include one extraction well in the NE quadrant, three extraction wells in the NW quadrant, and six extraction wells in the SW quadrant. Wells 04BR, 05BR, 16BR, 31S, 41BR, and WDW are reserve extraction wells that are not actively used as pump-and-treat extraction wells and are discussed as monitoring wells in this report. There are 16 designated “research” wells installed for specific research projects conducted at the site: 68BR, 70BR-10, 70BR-72, 71BR, 73BR, 80BR, 83BR, 84BR, 85BR, 86BR, 87BR, 88BR, 89BR, 92BR, 93BR, and 94BR. Wells 70BR-10 and 70BR-72 were constructed after dividing a corehole into two separate vertical zones. Wells 71BR, 73BR, and 80BR contain multiple depth intervals isolated by pneumatic packers. These intervals (71BR-F, 71BR-G, 71BR-H, 73BR-A, 73BR-BC, 73BR-D1, 73BR-D2, 73BR-E, 80BR-A, 80BR-B, 80BR-C, and 80BR-D) are discussed as separate monitoring wells in this report. Monitoring well 36BR is also divided into two depth intervals separated by a pneumatic packer, 36BR-A and 36BR-B, which are also discussed as separate wells in this report.
Surface Water and Storm Water Drains
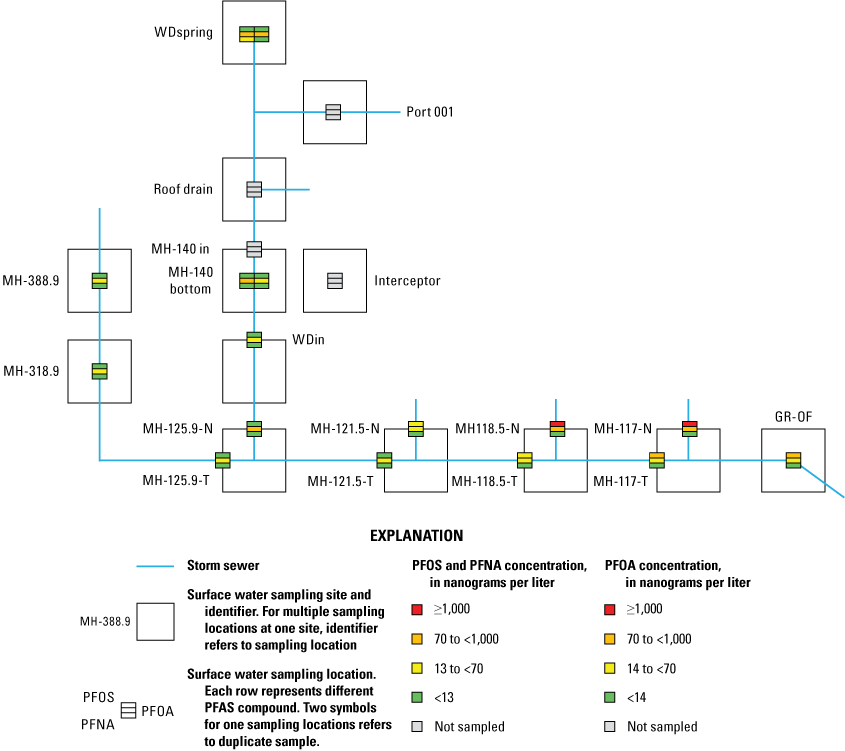
The surface water system at NAWC was briefly described by Lacombe (2000). Figure 3 shows the location of underground storm sewer lines, manholes, springs, and surface water sites that have been identified and sampled at the NAWC site. The spring that feeds the ancestral branch of Gold Run (hereafter referred to as West Branch Gold Run) occurs near the intersection of Parkway Avenue, Jack Stephan Way, and West Upper Ferry Road (fig. 3). Approximately 3,000 ft to the east of the site perimeter, the West Branch Gold Run culvert combines with the outflow of another culvert that carries storm sewer runoff from an eastern branch of Gold Run; at this location, the flow from these two culverts forms the main stem stream of Gold Run, which runs to the south.
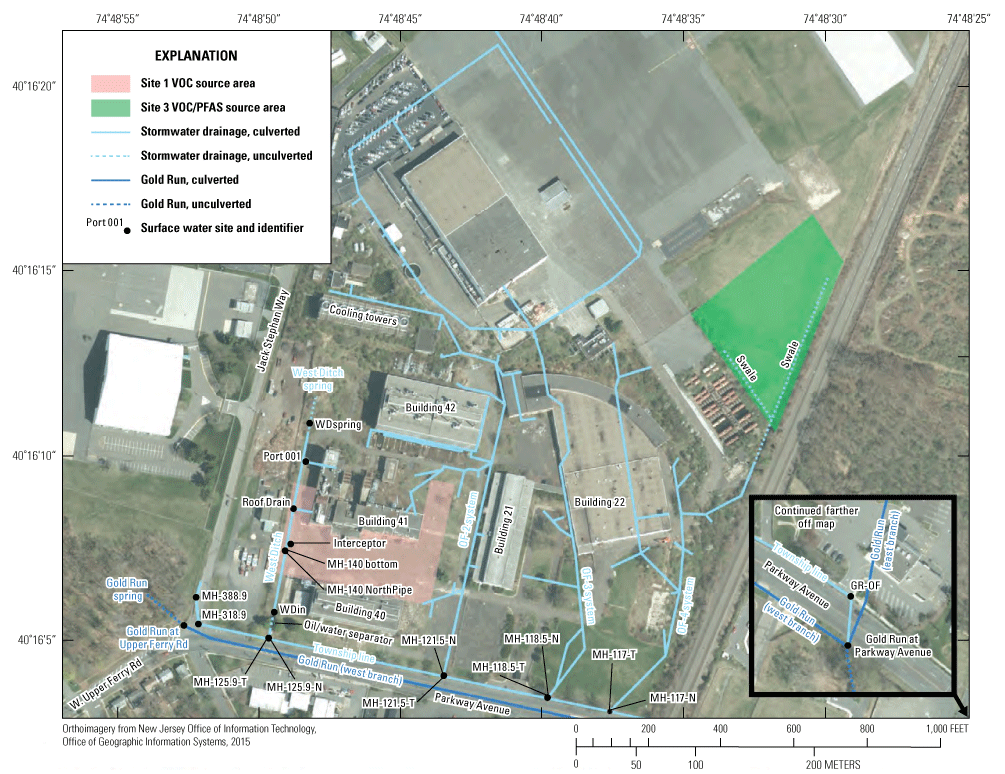
Surface water and storm drainage sampling locations at the former Naval Air Warfare Center, West Trenton, New Jersey. VOC, volatile organic compound; PFAS, per- and polyfluoroalkyl substances.
Four stormwater collection systems exist at NAWC (fig. 3): the West Ditch system, Outfall 2 system (OF-2), Outfall 3 system (OF-3), and Outfall 4 system (OF-4). The West Ditch system originates at a spring just south of the cooling towers (WDspring), before being routed into a culvert that discharges into manhole MH-140, and then into an oil-water separator (WDin). Outflow from the separator flows through a culvert and then enters manhole MH-125.9 where it discharges into the Township Line storm sewer that runs east underneath Parkway Avenue. The Township Line is separate from the West Branch Gold Run culvert that also runs under Parkway Avenue. During reconstruction of the West Ditch in 2017, additional connections that discharged into the West Ditch were removed (Tetra Tech, 2018).
The OF-2 system originates north of the cooling towers and runs south towards the Township Line storm sewer. The OF-2 system has several branch connections along it, and ultimately discharges into manhole MH-121.5 where the effluent enters the Township Line storm sewer that runs underneath Parkway Avenue. The OF-3 system originates around a large former hanger building on the airport north of NAWC. The OF-3 system is entirely culverted and has multiple connections along its path, eventually discharging into manhole MH-118.5 and the Township Line storm sewer. The OF-4 system originates in the northeast quadrant of the site as swales in the grassy area located on the airport property. The swales flow into an open-air concrete-lined ditch before joining the OF-4 culvert. The OF-4 system eventually reaches manhole MH-117 where it discharges into the Township Line storm sewer that runs under Parkway Ave. The OF-4 culvert and swales are discussed further in this report with regard to PFAS sources.
The Township Line storm sewer originates along Jack Stephan Way somewhere north of manhole MH-388.9, however, the starting point of this stormwater drainage is unknown. After reaching MH-318.9, the Township Line storm sewer turns southeast and intersects manholes MH-125.9, MH-121.5, MH-118.5, and MH-117, where it receives stormwater originating from the NAWC site. Eventually the Township Line storm sewer reaches manhole GR-OF (approximately 1,650 ft southeast of MH-117) where it discharges into Gold Run at the same location as the West Branch Gold Run culvert, to eventually flow to the Delaware River.
Methods
Groundwater and surface-water samples described in this report were collected from the existing wells and the storm-sewer network at NAWC by Navy contractors (Koman Government Solutions, 2020). Groundwater field sampling protocols used at this site included purging techniques and diffusion sampling methods; surface-water samples were grab-sampled directly into sample bottles. Laboratory analytical methods were the same as those used in previous sampling efforts. This section describes the general methods used to collect and analyze the samples.
Sampling Frequency
A subset of wells across the NAWC site are sampled each year as part of the U.S. Navy’s long-term monitoring program. The sampling frequency for each well varies according to the schedule detailed in the annual Sampling and Analysis Plan (SAP) produced and agreed upon by the Navy, private contractors, and the USGS (appendix 2; Koman Government Solutions, 2018). In 2018, a total of 85 wells were sampled for VOCs and 10 wells were sampled for PFAS. Samples for inorganic constituents were also analyzed during this sampling event but are not discussed in this report. The surface water and manhole sites were sampled for VOCs on a quarterly basis and for PFAS only once during the spring (appendix 4). Sampling frequency listed in this report may be obsolete at the time of publication of this report.
Groundwater Field Sampling Methods
VOC sampling techniques varied by well according to the protocols laid out in the SAP (Koman Government Solutions, 2018). Some wells were purged before being sampled using a hybrid technique whereby a variable-speed stainless-steel submersible pump was used to first remove 1.5 casing volumes of water from the well. The pumping rate was then lowered to <1 liter per minute (L/min) and field parameters (temperature, pH, specific conductance, dissolved oxygen, redox potential, and turbidity) were monitored using a multiparameter water-quality sonde in a flow-through cell until all parameters reached stable values. Samples were collected unfiltered directly into 40-milliliter VOC vials. Some wells were low-flow purged entirely at a rate of <1 L/min. Regardless of technique, purging and sampling was completed using Teflon-lined polyethylene tubing dedicated to each well. A total of 49 wells were sampled in 2018 using regenerated cellulose dialysis membrane passive samplers following the methods of Imbrigiotta and others (2007), Imbrigiotta and Trotsky (2011), and Imbrigiotta and Harte (2020) (appendix 3). The passive samplers were deployed and allowed to equilibrate for approximately 2 weeks before being retrieved and subsampled. Extraction wells were sampled from a tee in the discharge line of the dedicated submersible pump installed in each well; samples were collected after field parameters had reached stable values.
PFAS samples were collected after purging using a low-flow method that utilizes a peristaltic pump and precleaned high-density polyethylene tubing. Sampling was conducted on a separate date from the VOC sampling to avoid cross-contamination from the Teflon-lined tubing used to collect VOC samples. Purging and sampling was conducted at a flow rate of <1 L/min after field parameters had reached stable values. Unfiltered PFAS samples were collected directly into high density polyethylene bottles.
Surface Water Sampling Methods
For the purpose of this report, water in drains and in storm water sewers (sampled at manholes) will be termed “surface water.” The surface waters were sampled for chemical analysis by the Navy contractor on a quarterly basis. Methods of grab-sample collection and analysis, and concentrations were reported to the Navy through contractor reports (Koman Government Solutions, 2018, 202019). Sampling was conducted only if precipitation had not occurred within the preceding 72 hours and after the pump-and-treat system discharging treated effluent into OF-2 was operating continuously for 72 hours prior to being shut down the morning of sampling. This ensured that the surface-water samples were composed primarily of groundwater seepage.
The surface-water sites sampled in 2018 and parameters that were measured at each site are listed in appendix 4 (table 4.1). At some manholes, two grab samples were collected, one from the pipe entering from the north (leaving from the NAWC site), and a second sample at the incoming pipe of the Township Line storm-sewer pipe (flowing from the west). Immediately after Navy contractors conducted the sampling, the USGS measured volumetric discharge (Q) at six sites by directly collecting water into a 2-liter (L) graduated cylinder and measuring the time to collect certain volumes of effluent. The cylinder was placed below the lip of the discharge pipes or at site WDspring, immediately downstream of the weir. Chemical samples and discharge measurements were made four times in 2018: February 27 (winter), June 15 (spring), August 10 (summer), and December 11 (fall). Fluxes (mass per time) were calculated for TCE, cisDCE, VC, PFOA, PFOS, and PFNA. The flux of contaminants was calculated as the discharge multiplied by the concentration in the associated chemical sample. Fluxes could not be calculated for sites where discharge was not measured. When the VOC or PFAS concentration was less than the method detection limit (MDL) and Q was measured, the flux was calculated using the MDL and given a "less than" value.
Analytical Methods
VOC and PFAS concentrations in samples collected by the Navy contractors were analyzed by a Navy- and NJDEP-certified lab (Koman Government Solutions, 2020). VOC analyses were performed using EPA Method 8260 (U.S. Environmental Protection Agency, 2018a). PFAS analyses were run using a modification of EPA Method 537 (U.S. Environmental Protection Agency, 2018b). Analytical results were sent to the Navy contractors for quality assurance and quality control review. The approved data were forwarded, with permission from the Navy, to the USGS, and are available in a USGS data release (Fiore and Imbrigiotta, 2021).
Table 1.
Summary of volatile organic compound results in wells sampled in 2018 at the former Naval Air Warfare Center, West Trenton, New Jersey.[TCE, trichloroethene; cisDCE, cis-1,2-dichloroethene; VC, vinyl chloride; µg/L, micrograms per liter; MDL, method detection limit; MCL, drinking water maximum contaminant level; ≥ greater than or equal to; <, less than; --, not applicable; nd, not detected; NE, northeast; NW, northwest; SE, southeast; SW, southwest; NJDEP, New Jersey Department of Environmental Protection]
The NJDEP MCL values for VOC compounds are 1 µg/L for TCE, 70 µg/L for cisDCE, and 1 µg/L for VC (New Jersey Department of Environmental Protection, 2020).
Distribution of VOC and PFAS Contamination in Groundwater
This section presents summaries of the concentrations of TCE, cisDCE, VC, and three PFAS compounds in groundwater and surface-water samples collected in 2018. Concentration values are available in appendixes 3 and 4. All reported data were rounded to two significant figures. A full tabulation of the analytical results of all TCE, cisDCE, VC, PFOS, PFOA, and PFNA concentrations in samples collected at NAWC from previous years through 2018 can be found in Fiore and Imbrigiotta (2021).
VOC concentration ranges measured in wells in each of the four quadrants and offsite are summarized in table 1. The highest concentrations of TCE, cisDCE, and VC were found in wells located in the SW quadrant, followed by the wells in the NW quadrant. In the SW quadrant, wells 56BR, 36BR-A, and 73BR-A showed the highest concentrations of TCE, cisDCE, and VC, respectively. In the NW quadrant, well 29BR had the highest concentration of TCE and 45BR had the highest concentrations of cisDCE and VC. Note that wells 56BR, 29BR, and 45BR are extraction wells, well 36BR-A is an isolated zone in a monitoring well, and 73BR-A is an isolated zone in a research well. The presence of high concentrations in these wells is consistent with results of previous sampling efforts (Imbrigiotta and Fiore, 2021). The presence of high concentrations of VOCs in extraction wells is expected because these wells were placed in areas of known high concentrations and because they draw VOC contamination into their cone of influence. Well 73BR was drilled for a research project and is open to the bedrock at different depth intervals. Zone A is the shallowest zone open in this well, between depths of 25 and 34 ft. Presumably, the high TCE concentrations in this well are a result of the desorption of TCE from contaminated sediments below the area where much of the TCE was originally spilled at the surface.
PFAS compounds have been sampled at the NAWC site beginning with 1 well in 2015 (48BR), 19 wells in 2016, and 27 wells in 2017. In 2018, only the extraction wells were sampled for PFAS compounds. Since sampling began, 39 wells have been sampled for PFAS: 13 in the NE quadrant, 5 in the NW, 18 in the SW, and 3 offsite. The highest concentrations of PFAS compounds measured in 2018 were found in well 48BR, an extraction well located in the NE quadrant of the site, and in extraction well 08BR, located in the NW quadrant of the site. In past sampling efforts (2015–17), the highest concentrations were found in wells located in the NE quadrant. For example, in 2017, 8 of the 13 wells sampled for PFAS compounds were in the NE quadrant and the highest concentrations of PFAS were reported in the NE quadrant in wells 11S and 27S (Imbrigiotta and Fiore, 2021). These wells were not sampled in 2018.
Areal Extent of VOC Contamination in Groundwater
The areal distribution of TCE, cisDCE, and VC contamination during 2018 were plotted on maps (figs. 4–6) using color-coded symbols to indicate the range in measured concentrations. Table 1 summarizes the number of wells in each quadrant as a function of these ranges in concentrations, and the number of wells having concentrations that exceed the NJDEP MCLs.
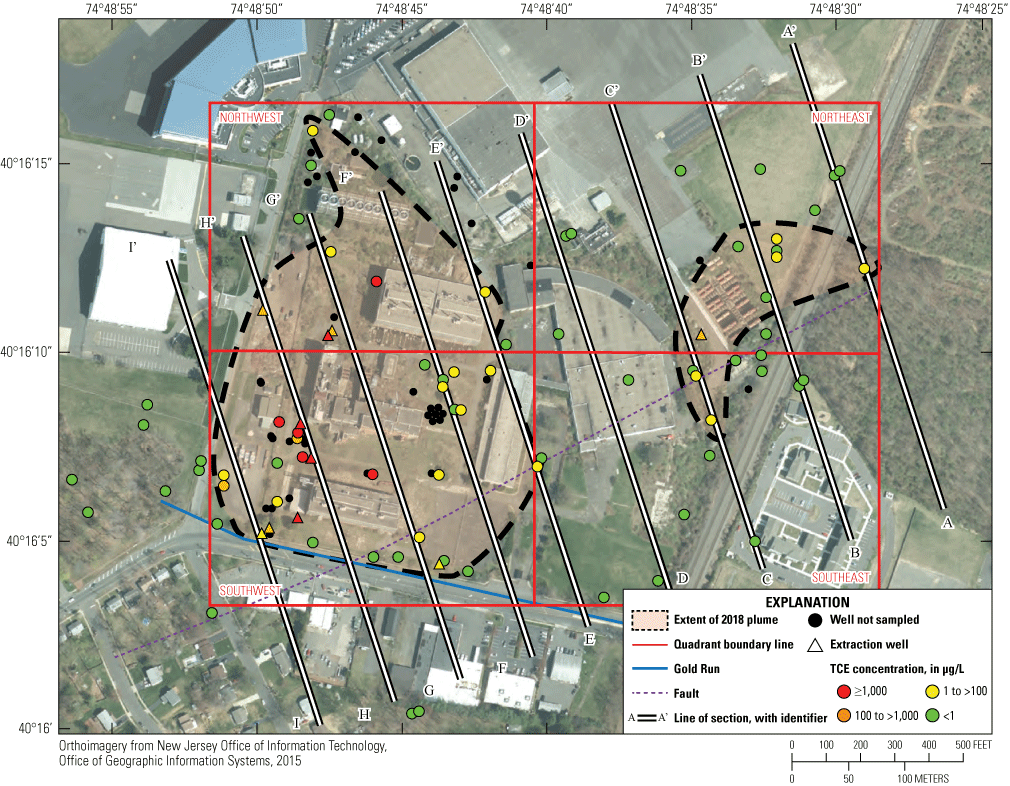
Distribution of trichloroethene (TCE) concentrations in wells at the former Naval Air Warfare Center, West Trenton, New Jersey, 2018.µg/L, micrograms per liter.
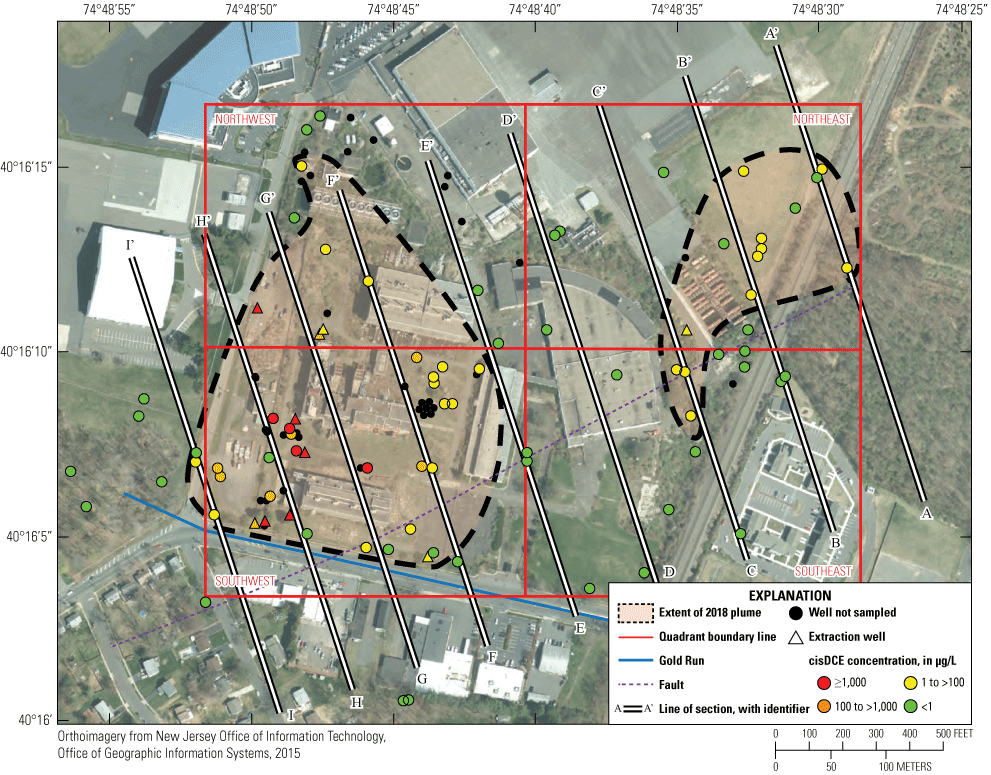
Distribution of cis-1,2-dichloroethene (cisDCE) concentrations in wells at the former Naval Air Warfare Center, West Trenton, New Jersey, 2018. µg/L, micrograms per liter.
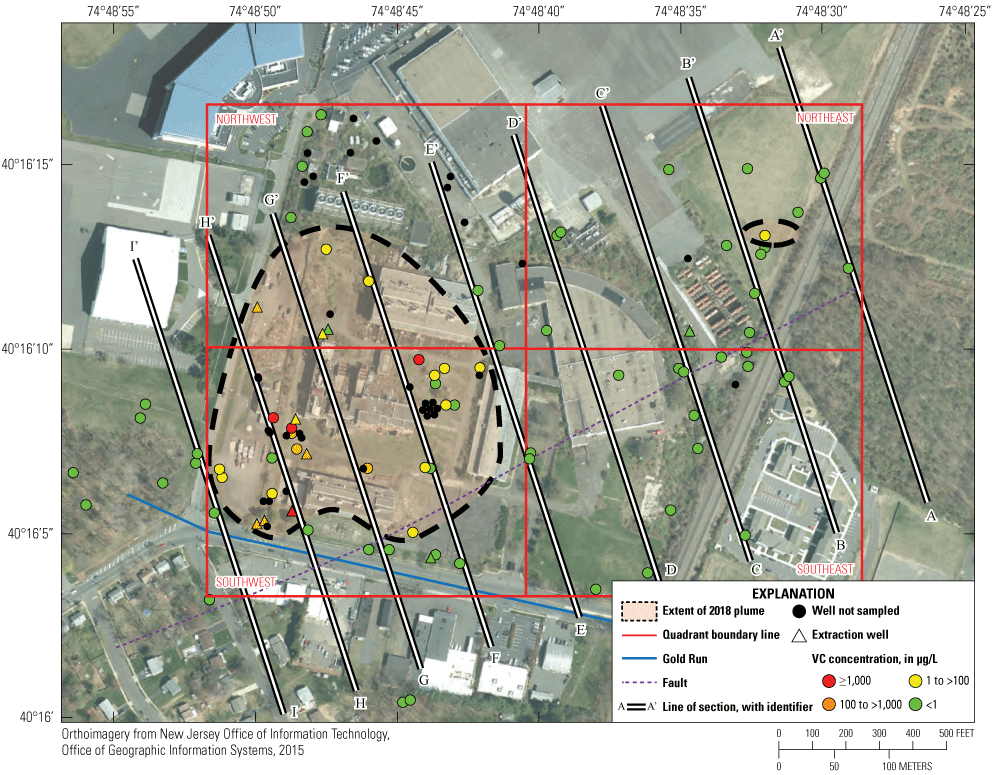
Distribution of vinyl chloride (VC) concentrations in wells at the former Naval Air Warfare Center, West Trenton, New Jersey, 2018. µg/L, micrograms per liter.
Inspection of these maps shows that two areas exist at the site where concentrations of VOCs exceed 1 μg/L. A small area in the NE quadrant (historically called Site 3), and a larger area in the NW and SW quadrants (historically called Site 1) have multiple wells with concentrations that exceed the NJDEP MCLs of 1 µg/L for TCE and VC and 70 µg/L for cisDCE. Most TCE spillage occurred in Site 1; Site 3 once contained a wastewater lagoon and sludge drying beds that provided a secondary source of TCE to the aquifer below them. These areas are delineated on figures 2 and 3 as the pink and green shaded areas. These maps do not differentiate concentrations at different depths in the aquifer.
Areal Distribution of TCE
The 2018 sampling results showed nine wells had TCE concentrations >1,000 μg/L (red symbols) in the Site 1 area (fig. 4; table 1). These wells are located in the SW quadrant of the site, with the highest TCE concentration measured during 2018 in well 56BR (14,000 µg/L), followed by well 24BR (6,600 µg/L). Other wells in this quadrant having TCE concentrations >1,000 µg/L were 15BR, 25BR, 36BR, 73BR-A, and BRP02. Wells 56BR and BRP02 are extraction wells, whereas the other wells are monitoring or research wells. In the NW quadrant, two wells were found to have concentrations of TCE >1,000 µg/L: well 29BR (an extraction well) and well 46BR (a monitoring well). As summarized in table 1, 37 samples were found to have TCE concentrations exceeding the NJDEP MCL of 1 μg/L in 2018; 24 of these samples were in the SW quadrant associated with Site 1.
Areal Distribution of cisDCE
The distribution of cisDCE concentrations measured in 2018 generally matched the distribution of TCE concentrations, with the highest concentrations being found in wells in the SW quadrant (fig. 5). The highest cisDCE concentration was found in well 36BR-A, where cisDCE was measured at 41,000 µg/L, followed by well 73BR-A at 20,000 µg/L. Other wells in the SW quadrant with concentrations >1,000 µg/L of cisDCE included 15BR, 20BR, 24BR, 25BR, 56BR, and BRP02. Only one well outside of the SW quadrant had a concentration >1,000 µg/L, extraction well 45BR, located in the NW quadrant, (3,400 µg/L). In total, 20 samples were found to have cisDCE concentrations exceeding the NJDEP MCL of 70 µg/L; 18 of these samples are in the SW quadrant (Site 1).
Areal Distribution of VC
In the 2018 samples, the highest concentrations of VC were found in wells in the SW quadrant, where well 73BR-A had a concentration of 6,100 µg/L, followed by well 36BR-A at 5,100 µg/L (fig. 6). Other wells in the SW quadrant with measurable VC concentrations include BRP02 (1,800 µg/L), well 38BR (1,100 µg/L), 25BR (520 µg/L), 15BR (120 µg/L), and 24BR (130 µg/L). In the NW quadrant, five samples were found to contain VC in excess of the NJDEP MCL of 1 μg/L, with well 45BR having the highest concentration (420 µg/L). In the NE quadrant only one well exceeded the VC MCL. In total, 30 samples were found to exceed the NJDEP MCL, 24 of which were in the SW quadrant.
Areal Extent of PFAS Contamination in Groundwater
Maps showing the distribution of the PFOS, PFOA, and PFNA concentrations in the wells at the site are shown in figures 7–9. All PFBS detections were below the EPA Regional Screening Level; therefore, a map was not created for PFBS. Because only the 10 extraction wells were sampled in 2018, the distribution shown on these maps does not fully delineate the distribution of these chemicals across the site. Most of the wells sampled were in the SW (six wells) and NW (three wells) quadrants with only one well sampled in the NE quadrant. For a more in-depth analysis of the previously defined PFAS distribution, see Imbrigiotta and Fiore (2021).
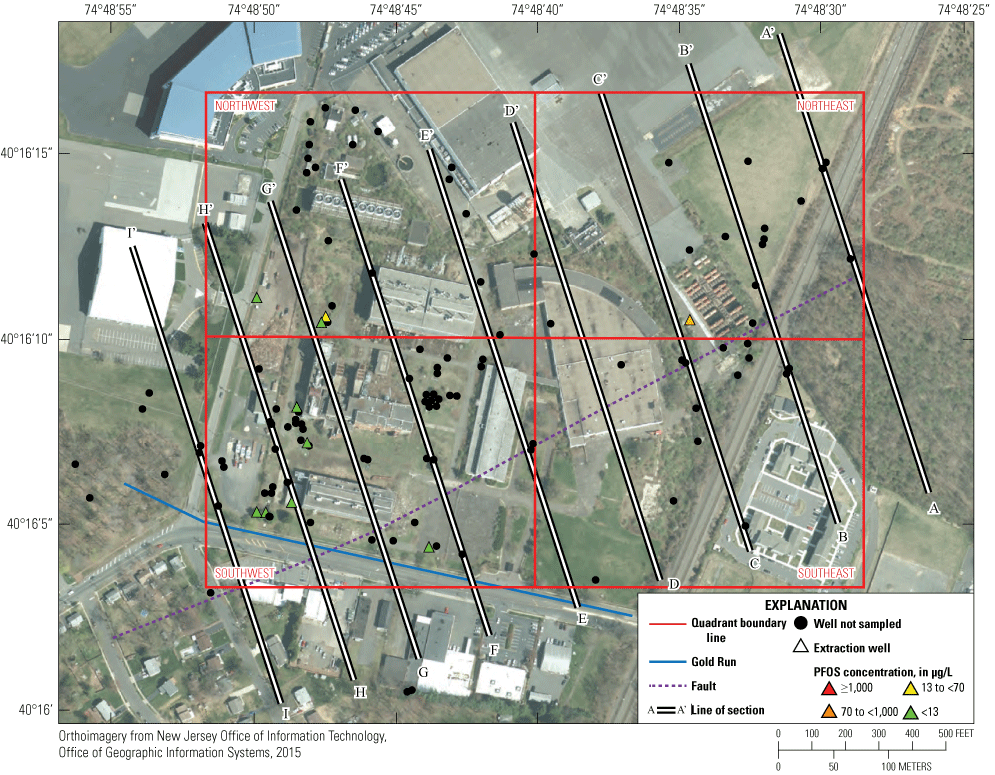
Distribution of perfluorooctane sulfonate (PFOS) concentrations in wells at the former Naval Air Warfare Center, West Trenton, New Jersey, 2018. µg/L, micrograms per liter.
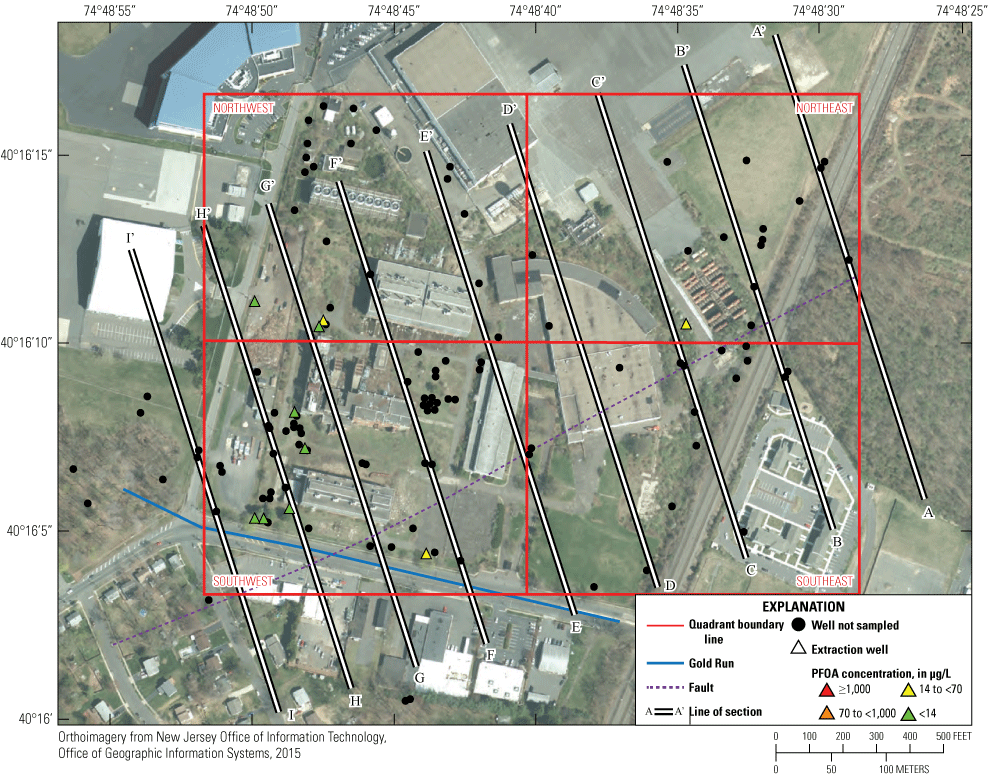
Distribution of perfluorooctanoic acid (PFOA) concentrations in wells at the former Naval Air Warfare Center, West Trenton, New Jersey, 2018. µg/L, micrograms per liter.
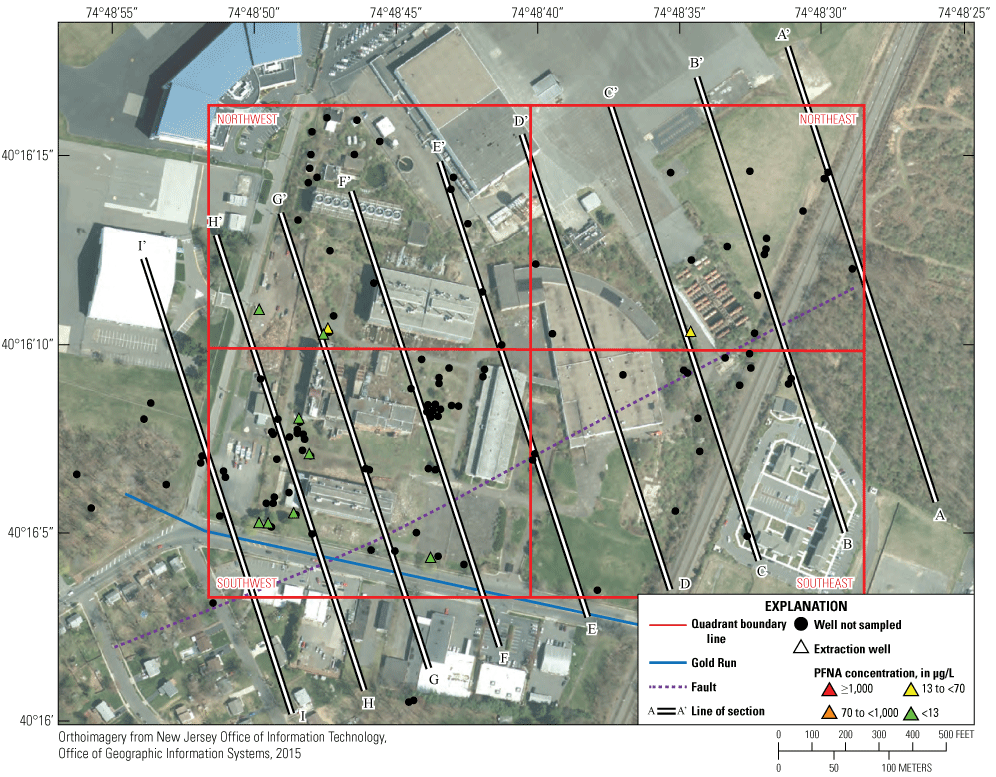
Distribution of perfluorononanoic acid (PFNA) concentrations in wells at the former Naval Air Warfare Center, West Trenton, New Jersey, 2018. µg/L, micrograms per liter.
During 2018, only one well had a PFOS concentration greater than its NJDEP MCL of 13 ng/L, well 48BR in the NE quadrant (470 ng/L) and was only found above the detection limit in one other well, 08BR in the NW quadrant (11 ng/L). Two wells had PFOA concentrations greater than or equal to its NJDEP MCL of 14 ng/L, well 48BR (54 ng/L) and well 08BR (14 ng/L). PFOA was only found above the detection limit in four other wells, 22BR (11 ng/L), 15BR (5.2 ng/L), 91BR (4.6 ng/L), and BRP02 (3.3 ng/L), all in the SW quadrant. No wells had PFNA concentrations greater than the NJDEP MCL of 13 ng/L, and PFNA was only detected in 48BR (9.8 ng/L) and 08BR (4.3 ng/L). No wells had PFBS concentrations exceeding the EPA Regional Screening Level of 400,000 ng/L. PFBS was only found above the detection limit in two wells, 48BR (89 ng/L) and 45BR (3.1 ng/L).
Tetra Tech (2018) and Imbrigiotta and Fiore (2021) discuss high concentrations of PFAS in the NE quadrant, with detected concentrations as far east as well 50BR, which indicates that PFAS may be migrating offsite to the east. The high concentrations of PFAS in the storm sewers that drain the NE quadrant (discussed below) and the interpreted groundwater flow directions (Fiore and Lacombe, 2020) indicate that 48BR, the only extraction well on the entire east side of NAWC, is likely not sufficient to capture all of the dissolved PFAS contamination.
Vertical Distribution of VOC Contamination in Groundwater
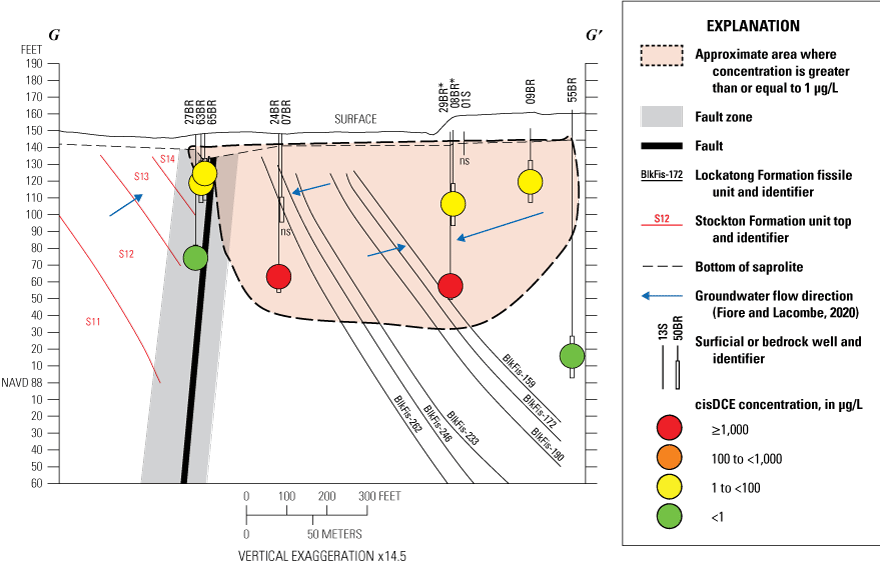
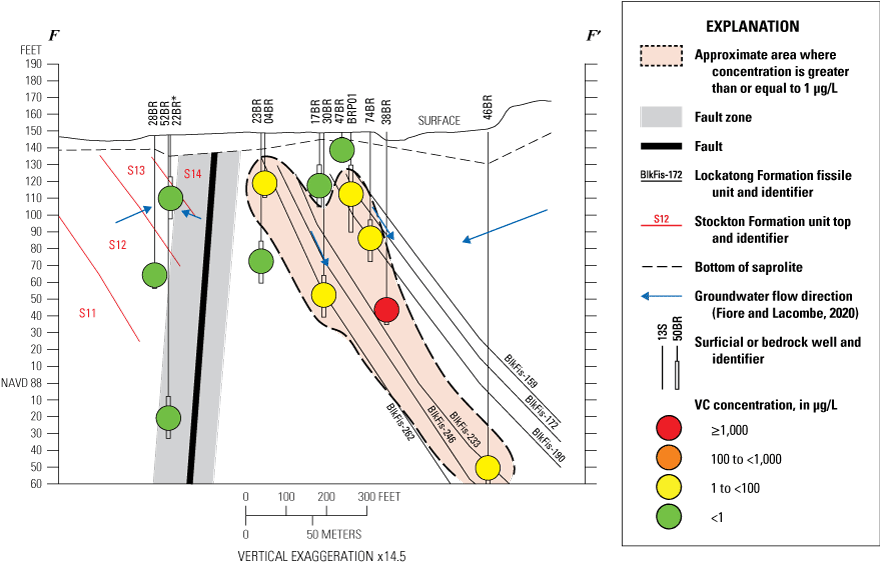
To show the extent of VOC contamination at depth below the surface, nine lines of section were drawn across the site (figs. 10–36); the locations of sections A-I are shown on figures 4–9. Sections are dip-aligned and drawn from southeast to northwest. Wells are projected onto cross sections and shown as vertical lines scaled to the depth of each of the wells. Cross sections A-D cover the NE and SE quadrants where Site 3 is located. Cross sections E-I pass through the wells in the Site 1 area. Also shown on the cross sections are the approximate locations and depths of the Lockatong Formation fissile units (black lines), the top of the Stockton Formation layers (red lines), and the bottom of the weathered surface bedrock (gray lines), based on cross sections by Lacombe and Burton (2010) and Fiore and Lacombe (2020). The fault zone separating the Lockatong and Stockton Formations is also shown on the cross sections in figures 10–36. This fault zone strikes northeast to southwest across the site. The general direction of groundwater flow inferred from the measured 2018 groundwater elevations (Fiore and Lacombe, 2020) is also shown.
Sections A-D
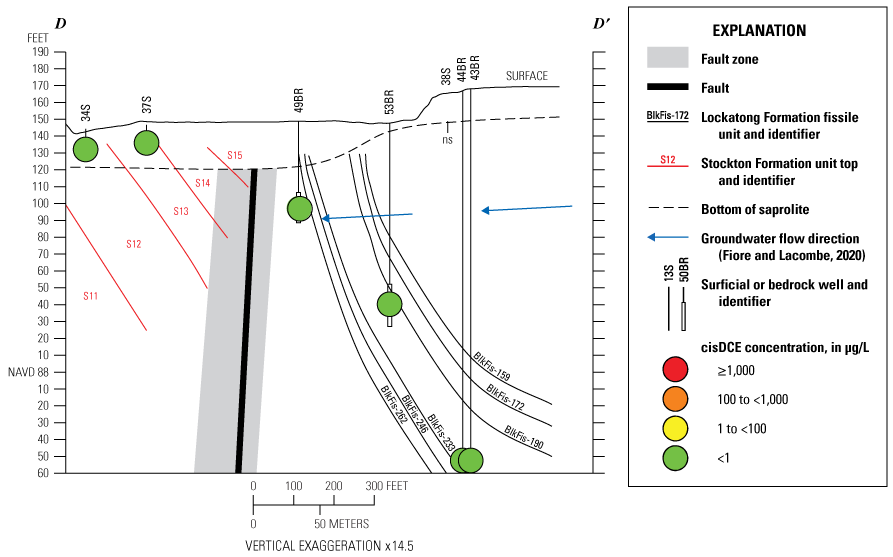
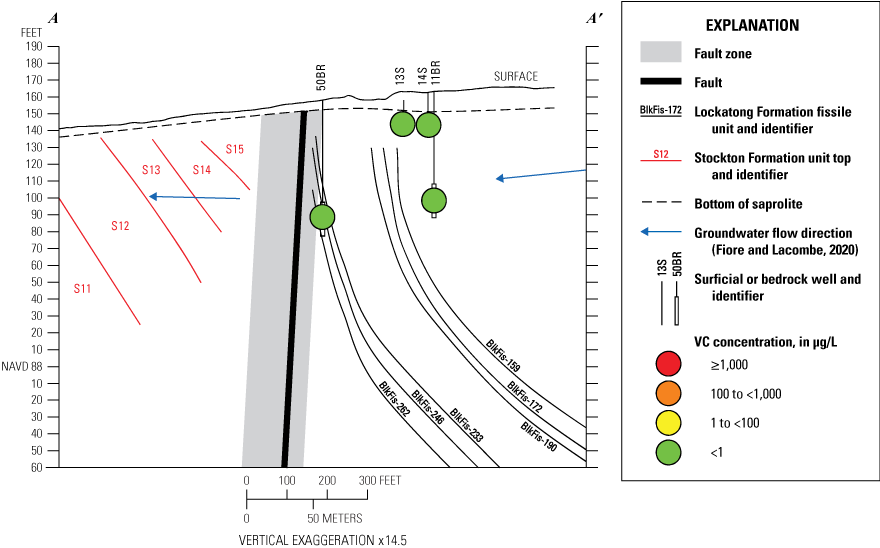
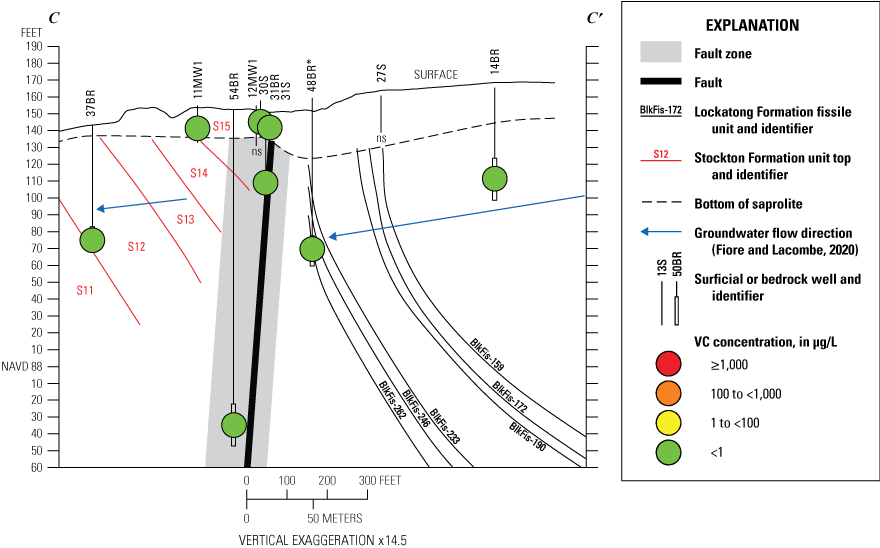
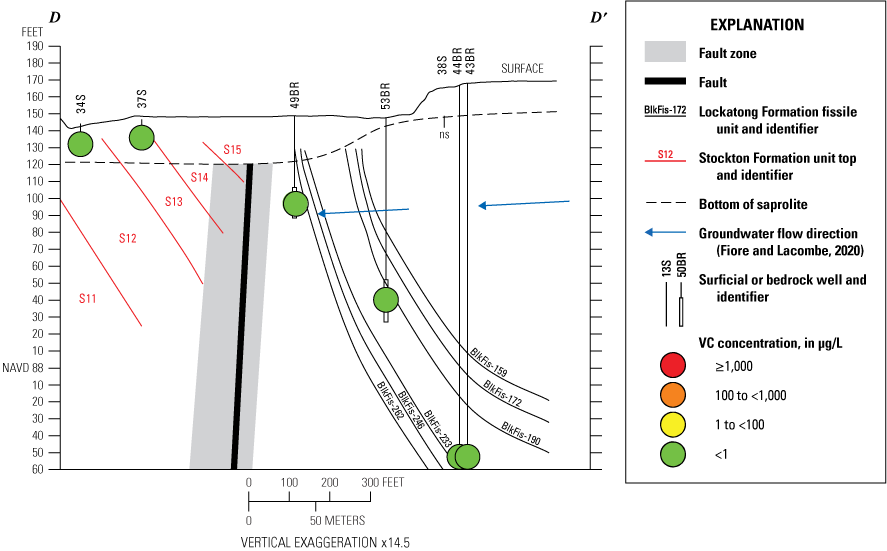
VOC concentrations at depth in the bedrock along section A-D (Site 3) in 2018 are shown in figures 10–21. In section A-A', concentrations of TCE were <1 μg/L in all wells except well 50BR, where the concentration was <3.0 µg/L. A concentration of half the reported value was assumed for color coding 50BR (fig. 10), per Imbrigiotta and Fiore (2021). Likewise, in cross section B-B', concentrations of TCE in the shallow wells were all <1 µg/L but were higher in the deep wells 02BR (98 μg/L) and 51BR (1.9 μg/L) (fig. 11). Along section C-C', (fig. 12) TCE concentrations were <1 µg/L in five of the wells but were higher in wells 48BR (530 μg/L), 54BR (29 μg/L), and 31BR (4.4 μg/L). It was noteworthy that well 48BR is the lone extraction well and has the highest TCE concentration of all wells on the east side of the NAWC property. Also, well 54BR was the deepest well (200 ft) on the east side of NAWC that had TCE contamination above the MCL. All wells falling on cross section D-D' had TCE concentrations <1 µg/L, including the two deepest wells at NAWC, 43BR and 44BR (fig. 13).
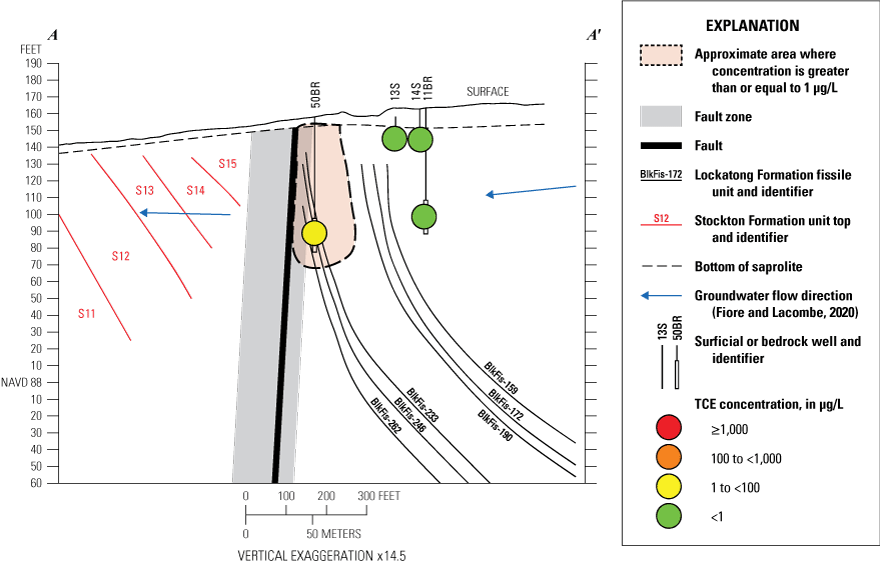
Concentrations of trichloroethene in wells along cross section A-A' at the former Naval Air Warfare Center, West Trenton, New Jersey, 2018. TCE, trichloroethene; μg/L, micrograms per liter.
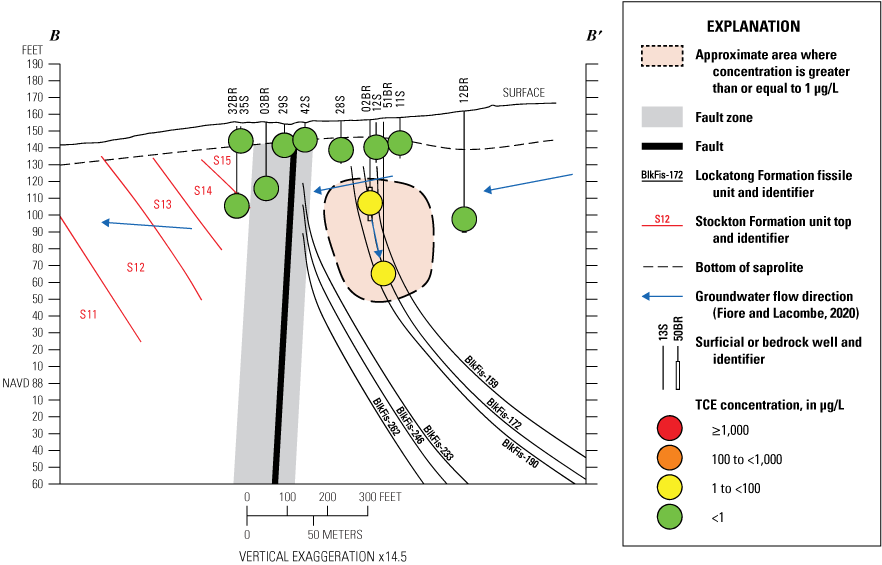
Concentrations of trichloroethene in wells along cross section B-B' at the former Naval Air Warfare Center, West Trenton, New Jersey, 2018. TCE, trichloroethene; μg/L, micrograms per liter.
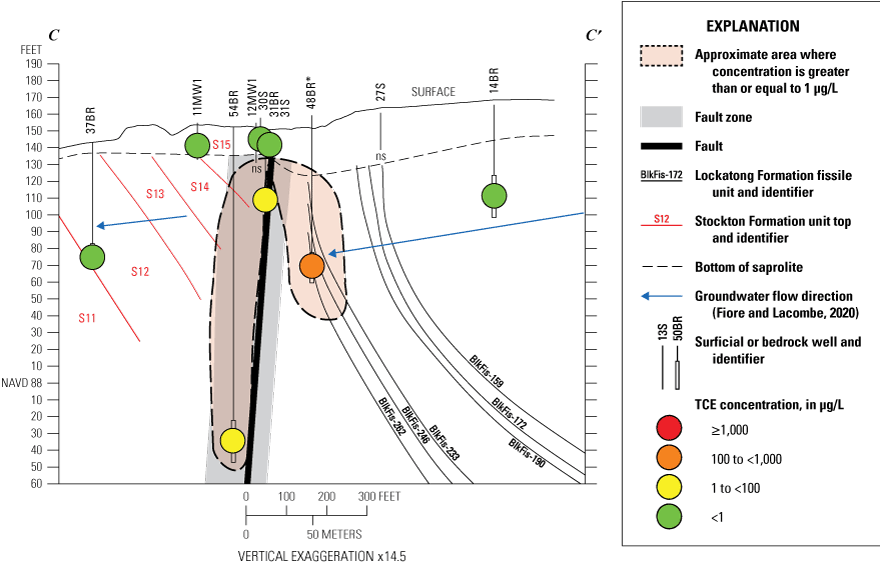
Concentrations of trichloroethene in wells along cross section C-C' at the former Naval Air Warfare Center, West Trenton, New Jersey, 2018. TCE, trichloroethene; μg/L, micrograms per liter; ns, not sampled; *, pump-and-treat well.
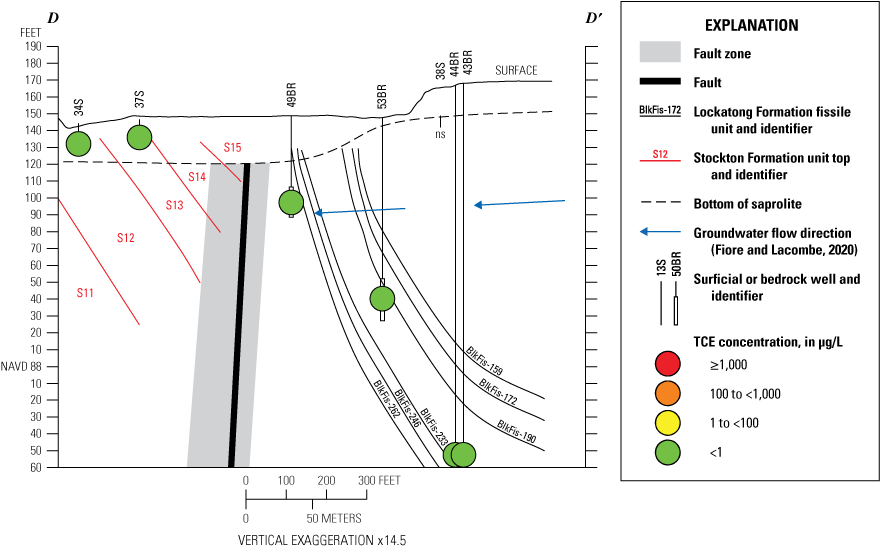
Concentrations of trichloroethene in wells along cross section D-D' at the former Naval Air Warfare Center, West Trenton, New Jersey, 2018. TCE, trichloroethene; μg/L, micrograms per liter; ns, not sampled.
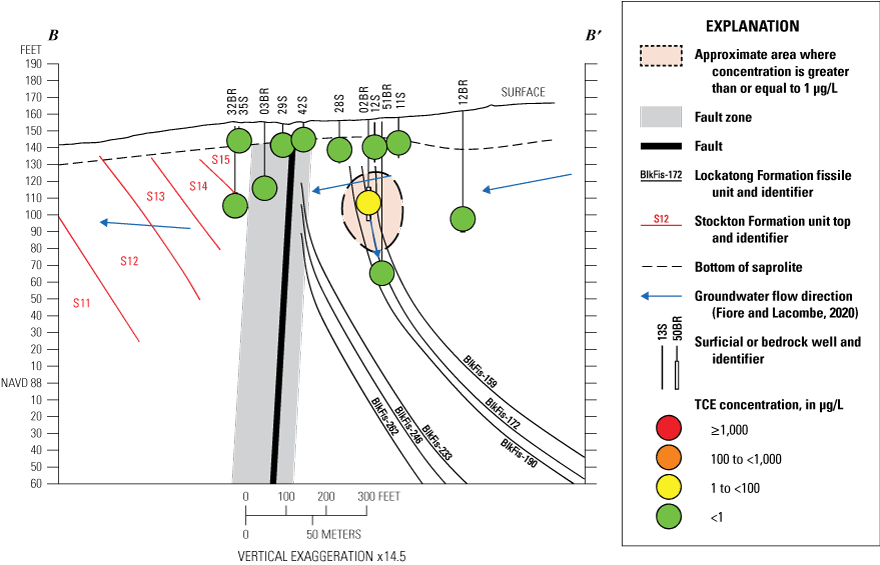
The vertical extent of cisDCE was similar to that of TCE. Because cisDCE is a biodegradation product of TCE, elevated concentrations of this compound tend to occur in areas where TCE was introduced into the aquifer, and where conditions are suitable for anaerobic biodegradation. There were, however, a few differences between the distribution of TCE and cisDCE. For example, two wells (50BR and 11BR) on section A-A' (fig. 14) and four wells (02BR, 12BR, 28S, and 51BR) on section B-B' (fig. 15) show cisDCE at concentrations ranging from 1 to 99 µg/L. Section B-B' showed a larger cisDCE contamination area than the TCE contamination area shown in figure 11, indicating the larger size of the zone in which TCE degradation was occurring. The distribution of cisDCE with depth in sections C-C' and D-D' was nearly identical to that of TCE (figs. 16 and 17).
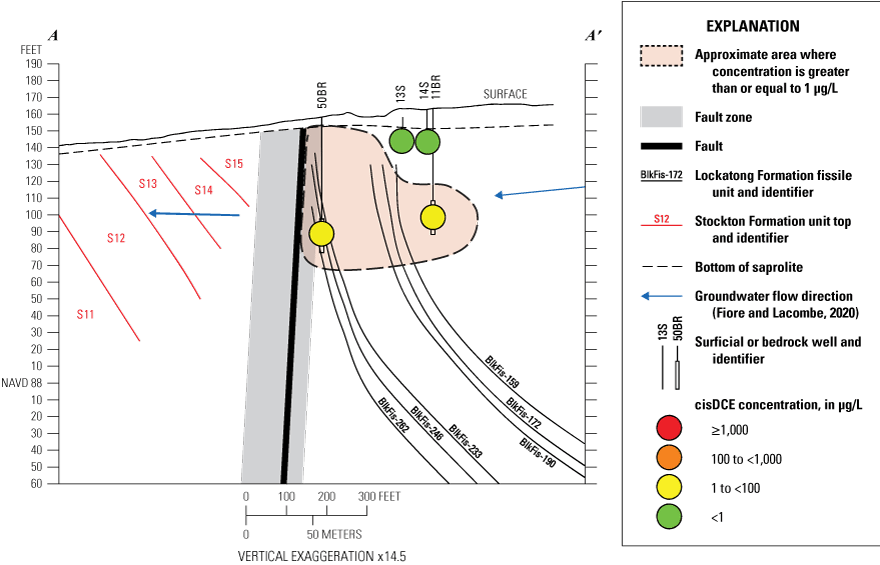
Concentrations of cis-1,2-dichloroethene (cisDCE) in wells along cross section A-A' at the former Naval Air Warfare Center, West Trenton, New Jersey, 2018. μg/L, micrograms per liter.
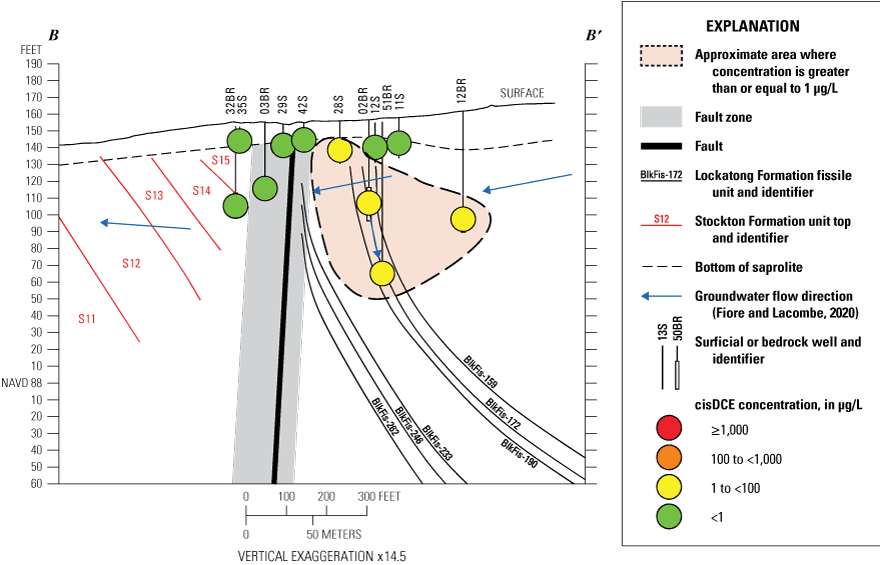
Concentrations of cis-1,2-dichloroethene (cisDCE) in wells along cross section B-B' at the former Naval Air Warfare Center, West Trenton, New Jersey, 2018. μg/L, micrograms per liter.
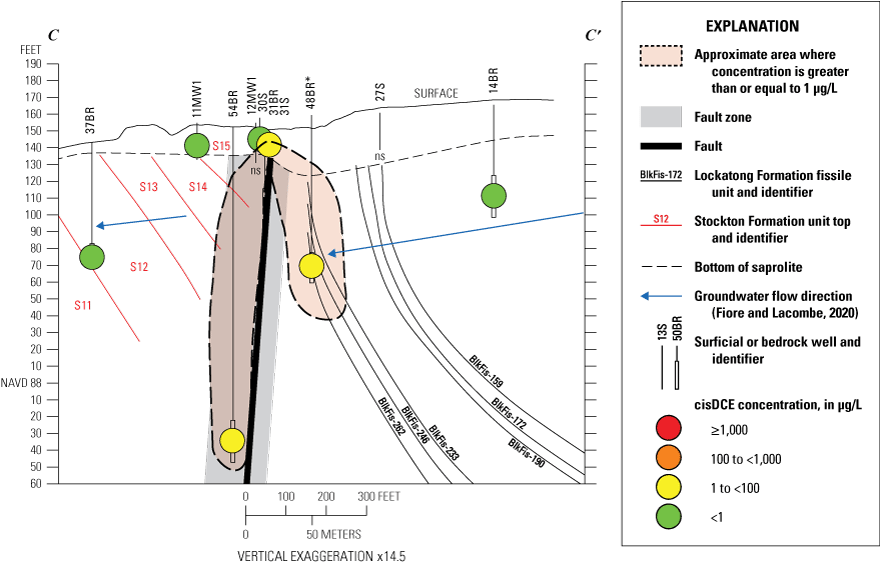
Concentrations of cis-1,2-dichloroethene (cisDCE) in wells along cross section C-C' at the former Naval Air Warfare Center, West Trenton, New Jersey, 2018. μg/L, micrograms per liter; ns, not sampled; *, pump-and-treat well.
Concentrations of cis-1,2-dichloroethene (cisDCE) in wells along cross section D-D' at the former Naval Air Warfare Center, West Trenton, New Jersey, 2018. μg/L, micrograms per liter; ns, not sampled.
The vertical extent of VC was plotted on the cross sections shown in figures 18–21. A VC concentration >1 µg/L was found in only well 02BR on section B-B' (fig. 19) at 1.7 μg/L. Like cisDCE, VC is present in the areas where high TCE concentrations occur and where subsurface conditions likely favor anaerobic biodegradation.
Concentrations of vinyl chloride (VC) in wells along cross section A-A' at the former Naval Air Warfare Center, West Trenton, New Jersey, 2018. μg/L, micrograms per liter.
Concentrations of vinyl chloride (VC) in wells along cross section B-B' at the former Naval Air Warfare Center, West Trenton, New Jersey, 2018. μg/L, micrograms per liter.
Concentrations of vinyl chloride (VC) in wells along cross section C-C' at the former Naval Air Warfare Center, West Trenton, New Jersey, 2018. μg/L, micrograms per liter; ns, not sampled; *, pump-and-treat well.
Concentrations of vinyl chloride (VC) in wells along cross section D-D' at the former Naval Air Warfare Center, West Trenton, New Jersey, 2018. μg/L, micrograms per liter; ns, not sampled.
The distribution of the VOCs in sections A-A' through D-D' show the influence of past source areas, the induced groundwater flow to the extraction well 48BR, and possibly the presence of the impermeable fault that passes through the site. The TCE concentrations in extraction well 48BR presumably originated from TCE-laden water and sludge disposed in a wastewater lagoon and sludge-drying beds that once existed in Site 3 in the NE quadrant, that has infiltrated into the subsurface and has been drawn toward the extraction well. The presence of elevated TCE and cisDCE in well 54BR indicates that TCE has moved vertically downward to a depth of 175–200 ft below land surface, and that contamination has migrated deep into the Stockton side of the fault in the SE quadrant along section C-C'. This is likely caused by contaminant flow through the surficial materials, across the fault—which is not a barrier to groundwater flow near land surface (Fiore and Lacombe, 2020)—and then by downward migration. Although the hydraulic head was higher at 54BR than near land surface in 2018 (Fiore and Lacombe, 2020), the heads have indicated downward gradients at other times (Lacombe, 2002).
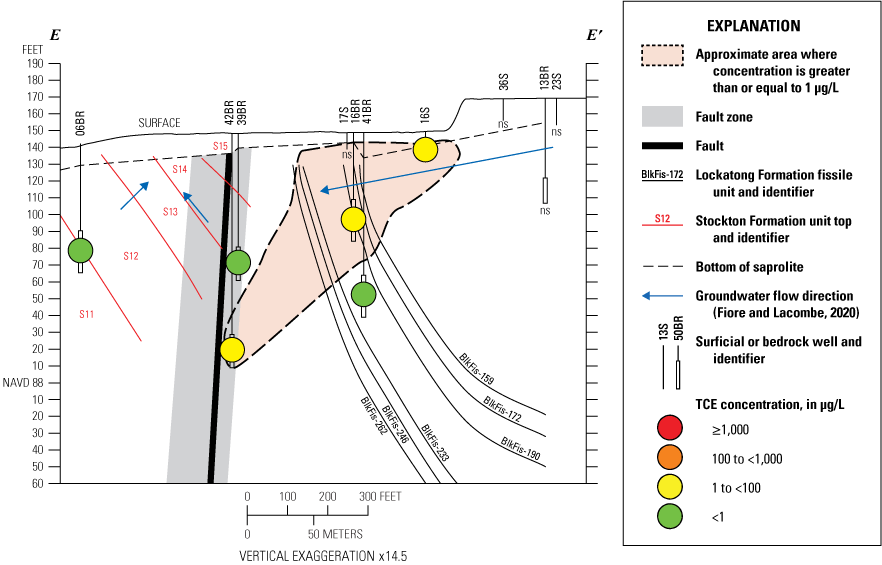
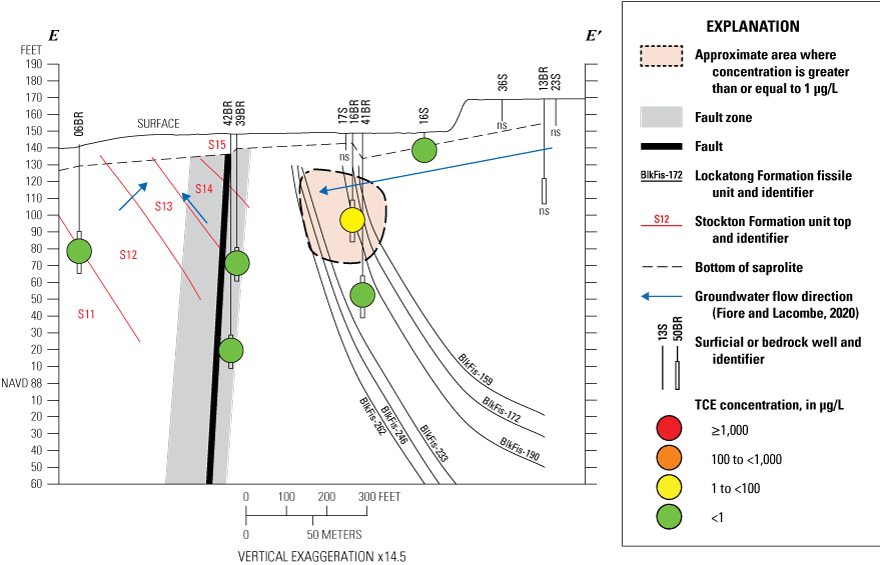
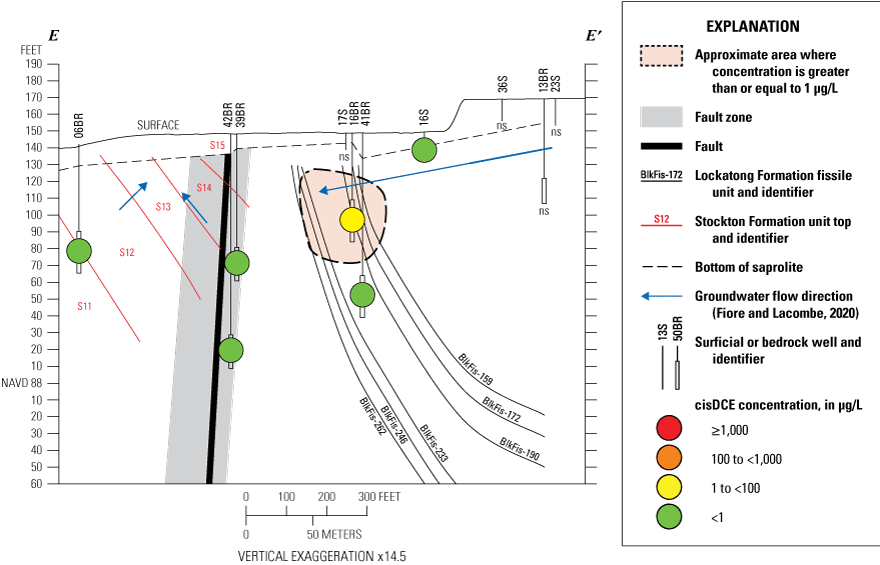
Concentrations of trichloroethene (TCE) in wells along cross section E-E' at the former Naval Air Warfare Center, West Trenton, New Jersey, 2018. μg/L, micrograms per liter; ns, not sampled.
Section F-F' (fig. 23) showed TCE contamination to a depth of more than 200 ft in well 46BR, located on the northwest side of the site. This distribution was likely caused by the TCE contamination flowing downward along dipping bedding partings to this depth from the Site 1 area where TCE was introduced at the surface. Well 46BR was the deepest well (221 ft) found to be contaminated with TCE (1,600 μg/L) at NAWC in 2018.
Sections E-I
Cross sections E-E' through I-I' pass through the NW and SW quadrants where Site 1 is located. The vertical distribution of the VOCs is shown in figures 22 to 36. Considerably more wells exist in these two quadrants, as this is the area where substantial releases of TCE occurred. There are nine extraction wells present in these quadrants, with the majority in the SW quadrant. The cross sections show the influence of pumping at the extraction wells on the vertical distribution of VOCs.
Cross section E-E' (fig. 22) is located along the east boundary of Site 1, and had three wells (16BR, 16S, and 42BR) with TCE concentrations between 1 and 1.5 µg/L. The distribution of TCE on this cross section indicated a possible downward migration of TCE in this area as groundwater nears the fault zone. However, negligible vertical hydraulic head change occurs at this location (Lacombe, 2002; Fiore and Lacombe, 2020). Typical TCE concentrations in 42BR have been <1 µg/L (Fiore and Imbrigiotta, 2021), including in a subsequent sampling of that well (Tetra Tech, written commun., 2020), so the contamination in 42BR may have resulted from a sampling error.
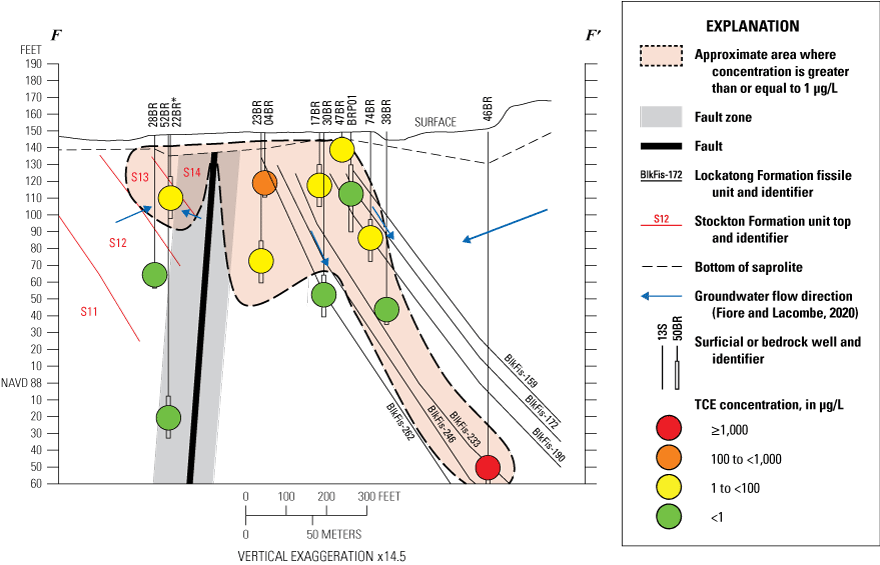
Concentrations of trichloroethene (TCE) in wells along cross section F-F' at the former Naval Air Warfare Center, West Trenton, New Jersey, 2018. μg/L, micrograms per liter; ns, not sampled; *, pump-and-treat well.
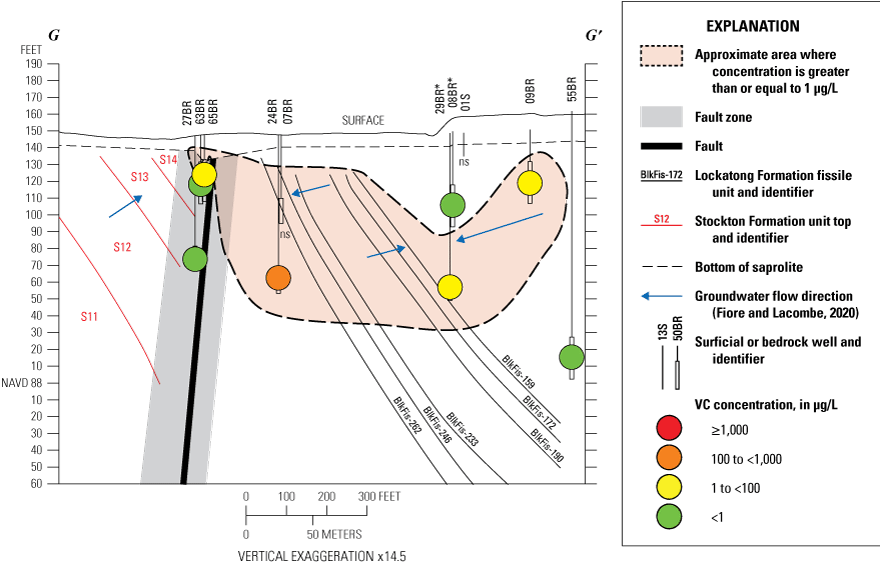
Along section G-G' (fig. 24), the three wells with the highest TCE concentrations were well 24BR (6,200 μg/L), well 29BR (3,200 μg/L), and well 08BR (480 μg/L). Well 24BR is located in the Site 1 area and is hydraulically connected to the BlkFis-233, BlkFis-246, and BlkFis-262 suite of black fissile mudstones (Fiore and Lacombe, 2020) where the highest levels of groundwater contamination are present. Historically, well 07BR has had concentrations greater than 1,000 μg/L (Imbrigiotta and Fiore, 2021), but 07BR was not sampled in 2018 owing to an ongoing research experiment in that well. Wells 29BR and 08BR are extraction wells that draw contamination and groundwater from the BlkFis-159, BlkFis-172, and BlkFis-190 suite of mudstones in the Site 1 area (Fiore and Lacombe, 2020). Well 55BR located to the north and wells 63BR and 27BR located south of the fault zone were all uncontaminated (<1 μg/L). Well 65BR, located on the Stockton Formation side the fault zone, had a detectable concentration of TCE (1.9 μg/L) in its 2018 sample.
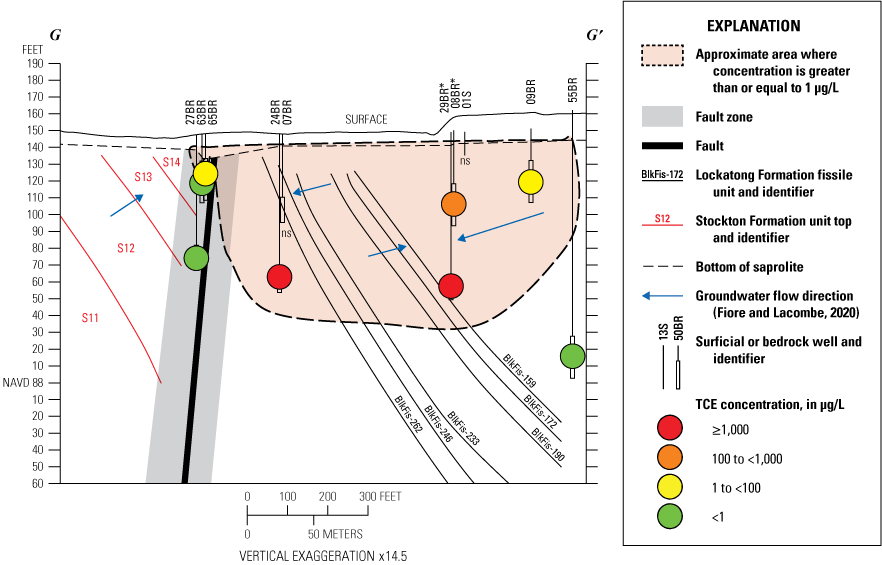
Concentrations of trichloroethene (TCE) in wells along cross section G-G' at the former Naval Air Warfare Center, West Trenton, New Jersey, 2018. μg/L, micrograms per liter; ns, not sampled; *, pump-and-treat well.
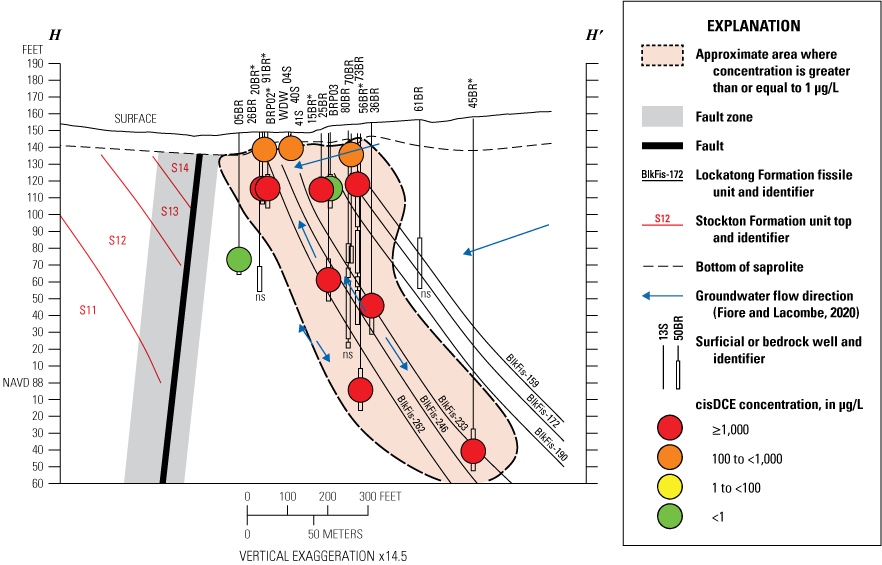
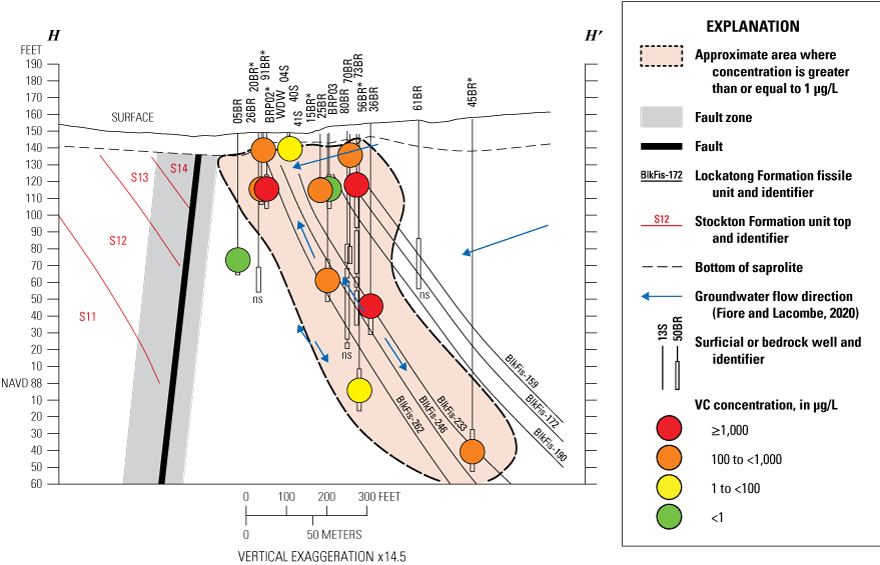
Wells along section H-H' (fig. 25) contained the highest TCE concentrations at the NAWC site in previous years and again in 2018. All of the wells along this section were located on the Lockatong Formation side of the fault in the area where most of the TCE contamination was historically introduced at the surface. The distribution of TCE along this section is very complex owing to the presence of extraction wells. Contaminated groundwater flowed upward towards extraction wells 20BR, 91BR, BRP02, and 15BR, but downward towards extraction wells 56BR and 45BR (Fiore and Lacombe, 2020). The downward flow resulted in the highest TCE concentration at NAWC in 2018 being found in well 56BR (14,000 μg/L) at a depth of 160 ft.
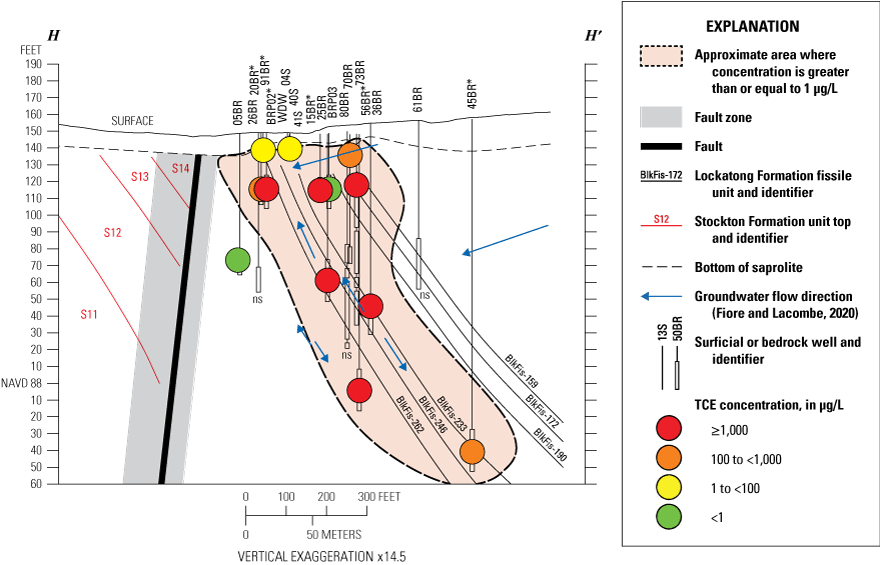
Concentrations of trichloroethene (TCE) in wells along cross section H-H' at the former Naval Air Warfare Center, West Trenton, New Jersey, 2018. μg/L, micrograms per liter; ns, not sampled; *, pump-and-treat well.
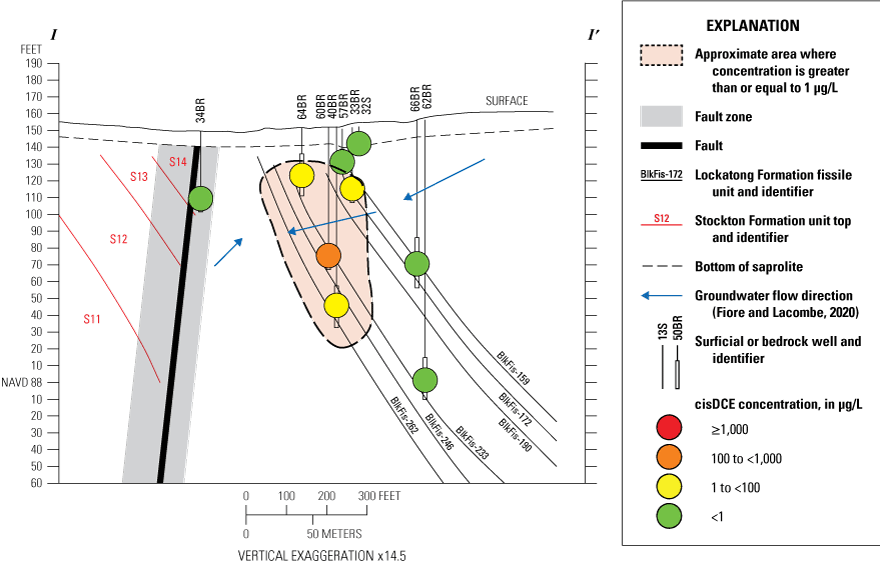
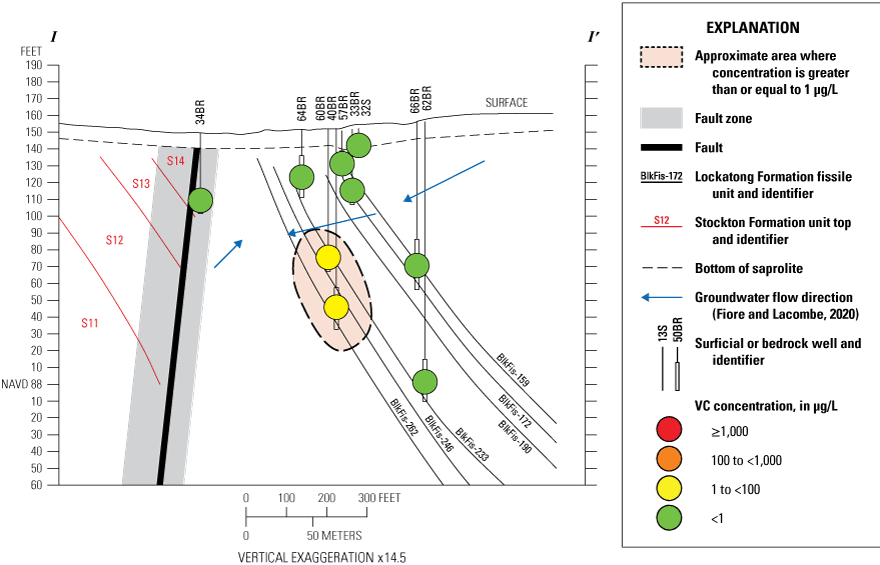
In section I-I' (fig. 26) in 2018, concentrations of TCE >1 μg/L were observed only in samples from wells 40BR (7.5 μg/L) and 60BR (130 μg/L). All other wells on this section had TCE concentrations <1 μg/L, including all offsite wells west of Jack Stephan Way. These results indicate that the pump-and-treat system is limiting offsite contaminant migration to the west and containing the plume onsite.
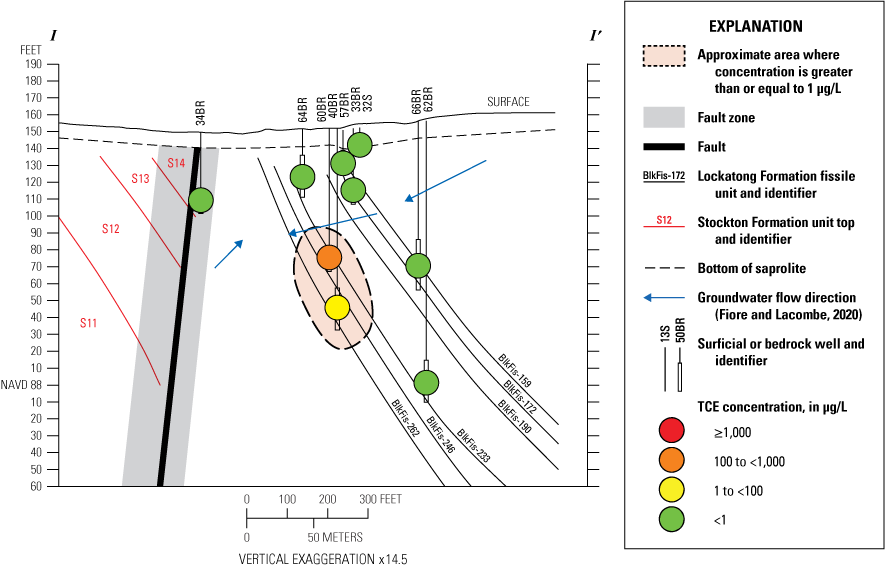
Concentrations of trichloroethene (TCE) in wells along cross section I-I' at the former Naval Air Warfare Center, West Trenton, New Jersey, 2018. μg/L, micrograms per liter.
The vertical distribution of cisDCE contamination (figs. 27–31) roughly followed the distribution of TCE contamination shown in figures 22–26. Along section E-E' (fig. 27), cisDCE was generally present in lower concentrations than those found for TCE (fig. 22). One difference was that cisDCE was above detection only in well 16BR (6.4 μg/L) on this section. Another difference was evident on section I-I' (fig. 31), where elevated concentrations of cisDCE were found in wells 60BR (350 μg/L) and 40BR (180 μg/L), and concentrations slightly above detection limits in well 64BR (3.3 μg/L) (fig. 26). The measured result for well 33BR was <2.9 μg/L, so it is unclear whether the concentration was truly above 1 μg/L. The highest cisDCE concentration at NAWC in 2018 was found in well 36BR-A at 41,000 μg/L. This well was used as the injection well for the 2008 bioaugmentation experiment to enhance the biodegradation of TCE (Tiedeman and others, 2018; Shapiro and others, 2018), which explains the higher cisDCE concentration. The deepest well with cisDCE contamination at NAWC in 2018 was extraction well 45BR (210 ft) with 3,400 μg/L.
Concentrations of cis-1,2-dichloroethene (cisDCE) in wells along cross section E-E' at the former Naval Air Warfare Center, West Trenton, New Jersey, 2018. μg/L, micrograms per liter; ns, not sampled.
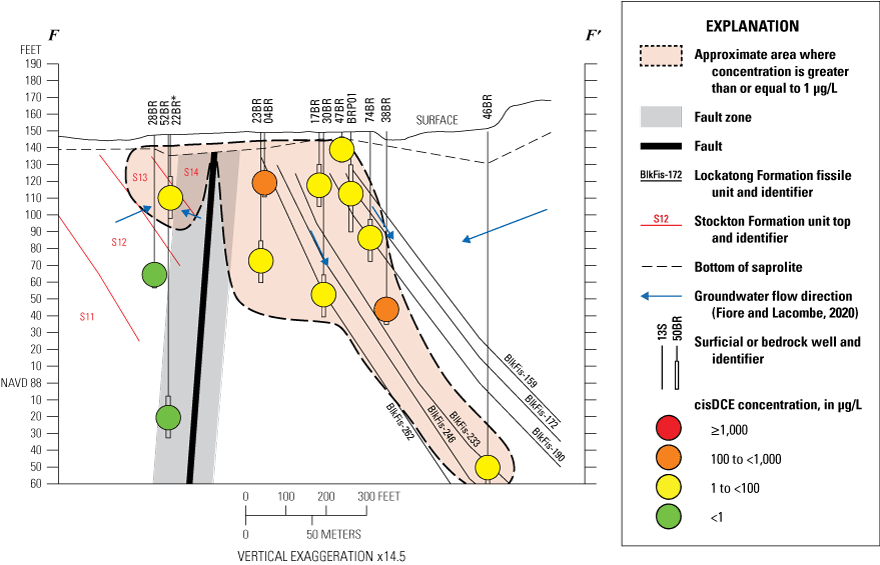
Concentrations of cis-1,2-dichloroethene (cisDCE) in wells along cross section F-F' at the former Naval Air Warfare Center, West Trenton, New Jersey, 2018. μg/L, micrograms per liter; *, pump-and-treat well.
Concentrations of cis-1,2-dichloroethene (cisDCE) in wells along cross section G-G' at the former Naval Air Warfare Center, West Trenton, New Jersey, 2018. μg/L, micrograms per liter; ns, not sampled; *, pump-and-treat well.
Concentrations of cis-1,2-dichloroethene (cisDCE) in wells along cross section H-H' at the former Naval Air Warfare Center, West Trenton, New Jersey, 2018. μg/L, micrograms per liter; ns, not sampled; *, pump-and-treat well.
Concentrations of cis-1,2-dichloroethene (cisDCE) in wells along cross section I-I' at the former Naval Air Warfare Center, West Trenton, New Jersey, 2018. μg/L, micrograms per liter.
The vertical distribution of VC also followed that of TCE in cross sections E-E' to I-I' (figs. 32–36). One difference was that fewer shallow wells were contaminated with VC than TCE on cross sections F-F' (fig. 33) and G-G' (fig. 34). This lower VC contamination may be a result of the volatility of VC or the lack of anerobic conditions needed for complete biodegradation of cisDCE to VC at shallow depths in the aquifer. The highest VC concentrations at NAWC in 2018 were found in wells 73BR-A (6,100 μg/L) and 36BR-A (5,100 μg/L), both on section H-H'. Similar to cisDCE, the high VC concentrations in this area may stem from enhanced biodegradation following the 2008 bioaugmentation experiment (Tiedeman and others, 2018; Shapiro and others, 2018). The deepest wells where VC contamination was found in 2018 were wells 46BR (221 ft, 1.2 μg/L) and 45BR (210 ft, 3,400 μg/L).
Concentrations of vinyl chloride (VC) in wells along cross section E-E' at the former Naval Air Warfare Center, West Trenton, New Jersey, 2018. μg/L, micrograms per liter; ns, not sampled.
Concentrations of vinyl chloride (VC) in wells along cross section F-F' at the former Naval Air Warfare Center, West Trenton, New Jersey, 2018. μg/L, micrograms per liter; *, pump-and-treat well.
Concentrations of vinyl chloride (VC) in wells along cross section G-G' at the former Naval Air Warfare Center, West Trenton, New Jersey, 2018. μg/L, micrograms per liter; ns, not sampled; *, pump-and-treat well.
Concentrations of vinyl chloride (VC) in wells along cross section H-H' at the former Naval Air Warfare Center, West Trenton, New Jersey, 2018. μg/L, micrograms per liter; ns, not sampled; *, pump-and-treat well.
Concentrations of vinyl chloride (VC) in wells along cross section I-I' at the former Naval Air Warfare Center, West Trenton, New Jersey, 2018. μg/L, micrograms per liter.
Controls on the Distribution of VOCs in Groundwater
The distributions of VOCs at the NAWC site are determined by the location of the chemical releases, the migration of DNAPL, and the direction in which the groundwater flows. Groundwater flow direction is controlled by the regional flow patterns, the structure of the bedrock and fracture patterns, and the influence of the extraction well pumping. The general regional groundwater gradient is from the northwest to southeast (Lacombe, 2000), but the groundwater flow in the fractured bedrock at the site has been established as flowing perpendicular to this gradient, toward the southwest, and is controlled by the strike of the bedding partings in the bedrock (Lacombe, 2000; Fiore and Lacombe, 2020). The flow direction at NAWC is also greatly influenced by the cone-of-influence around each of the 10 extraction wells. The horizontal flow of water in the unconsolidated overburden of the site is toward the swales, ditches, and storm sewers (Fiore and Lacombe, 2020). Because no wells offsite to the west or south have TCE concentrations >1 μg/L, this is a good indication that the pump-and-treat system continues to keep the VOC contaminated groundwater from flowing offsite to the west. The presence of only a few affected wells in the Stockton Formation further indicates that the fault acts to hinder southerly flow within the bedrock. Contamination in the Stockton Formation is likely caused by groundwater flow within the shallow overburden from the Lockatong Formation into the Stockton across the fault and then migration downward into the bedrock.
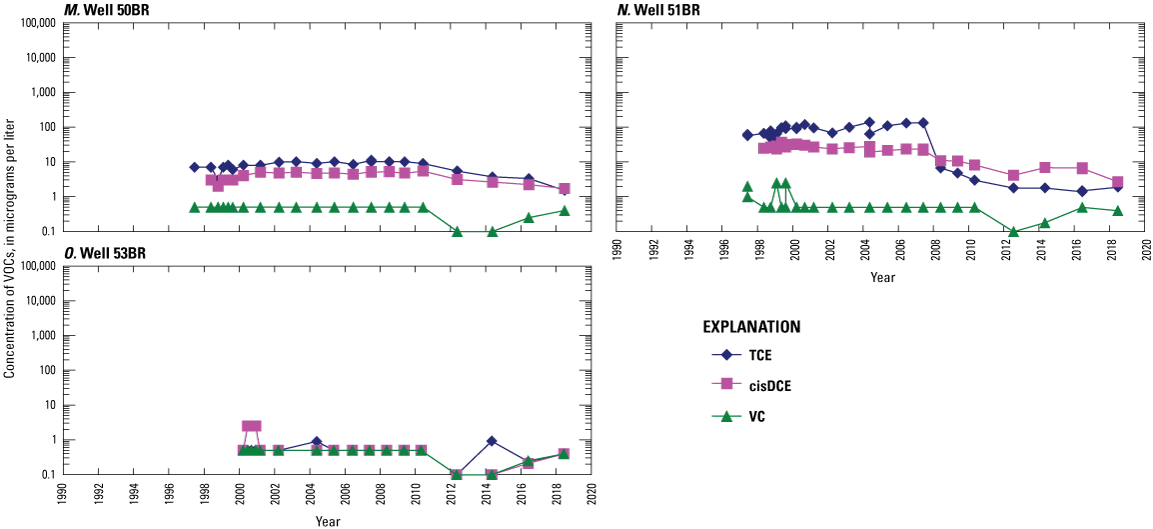
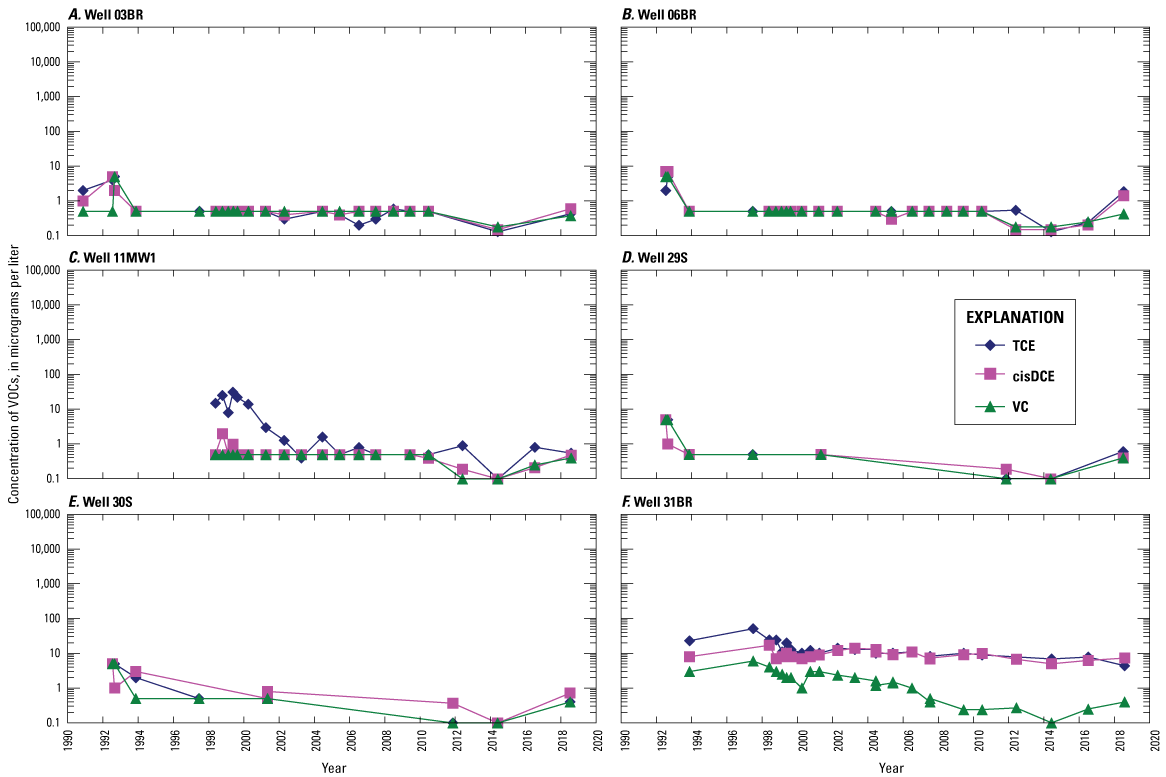
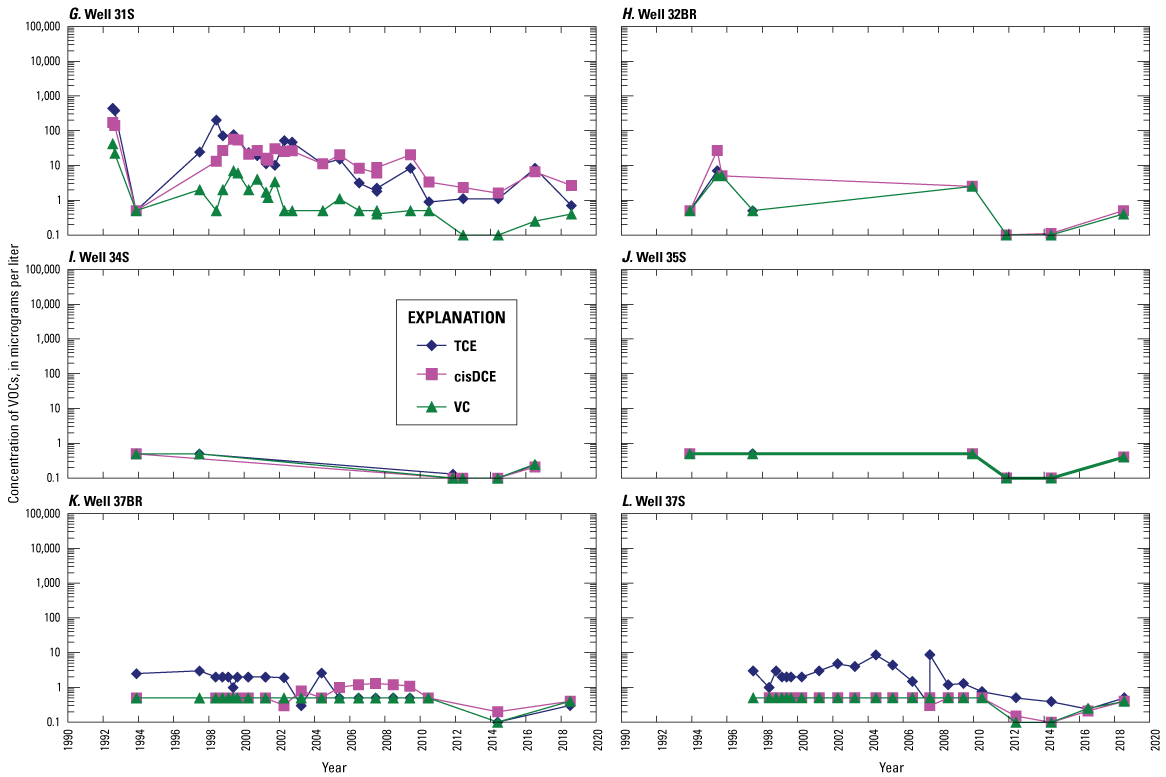
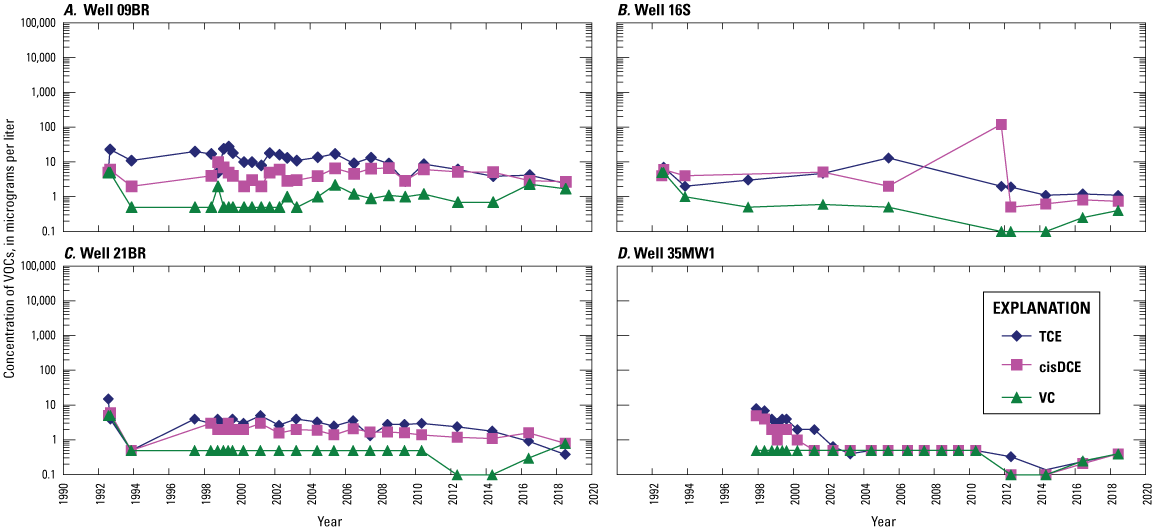
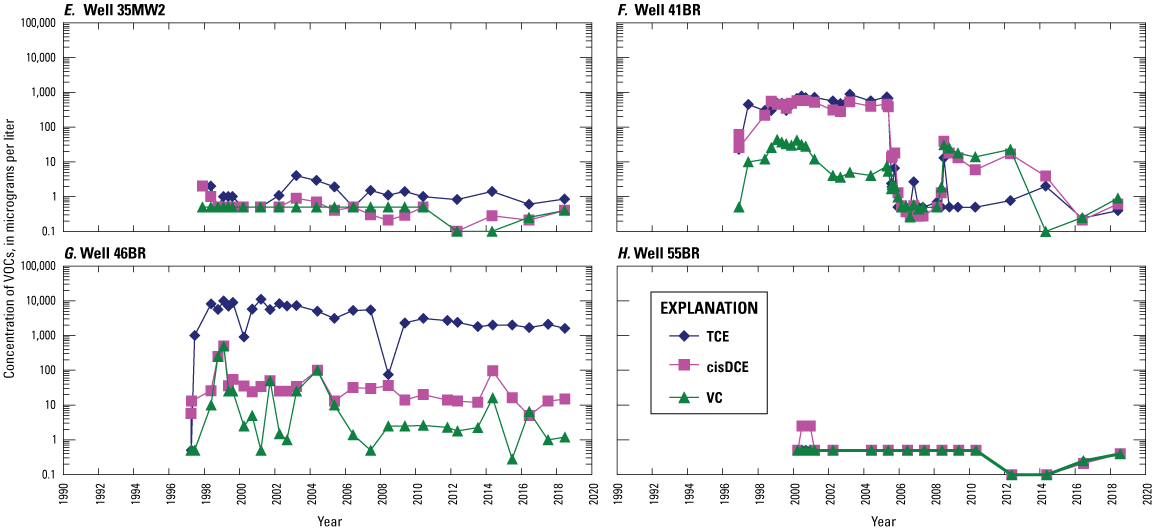
Temporal Change in VOC Concentrations in Groundwater
To evaluate the temporal changes in VOC concentrations, the concentration of TCE, cisDCE, and VC in each well sampled in 2018 was compared to the concentration measured in the most recent sample prior to 2018, as well as the overall long-term trends (appendix 3; figs. 37–43). In table 3.1 the relative direction of change in the 2018 sample is indicated as “+” if the concentration increased in 2018, “-” if the concentration decreased in 2018, and “0” if there was no change in concentration or the change could not be determined because one or both sample analyses reported the concentration as being below their respective MDL. The data do not permit determining if the change in concentration was statistically significant, so a change was considered substantial only if the difference was at least double (if an increase), or at least half (if a decrease), of the concentration found in the previous sample. For a more thorough discussion on trends of VOC concentrations over a longer time period prior to 2018, see Imbrigiotta and Fiore (2021).
The only extraction well in that showed a notable change in VOC concentrations between 2017 and 2018 was well 45BR (appendix 3). This well had decreasing TCE and increasing cisDCE and VC concentrations from the previous sample (fig. 37). Since mid-2010, the TCE concentrations and cisDCE and VC concentrations have varied inversely. The increasing cisDCE and VC concentrations trends may be caused by an increase in anaerobic biodegradation in well 45BR itself or within its cone of depression from which it is now drawing in groundwater with higher concentrations of the TCE biodegradation byproducts.
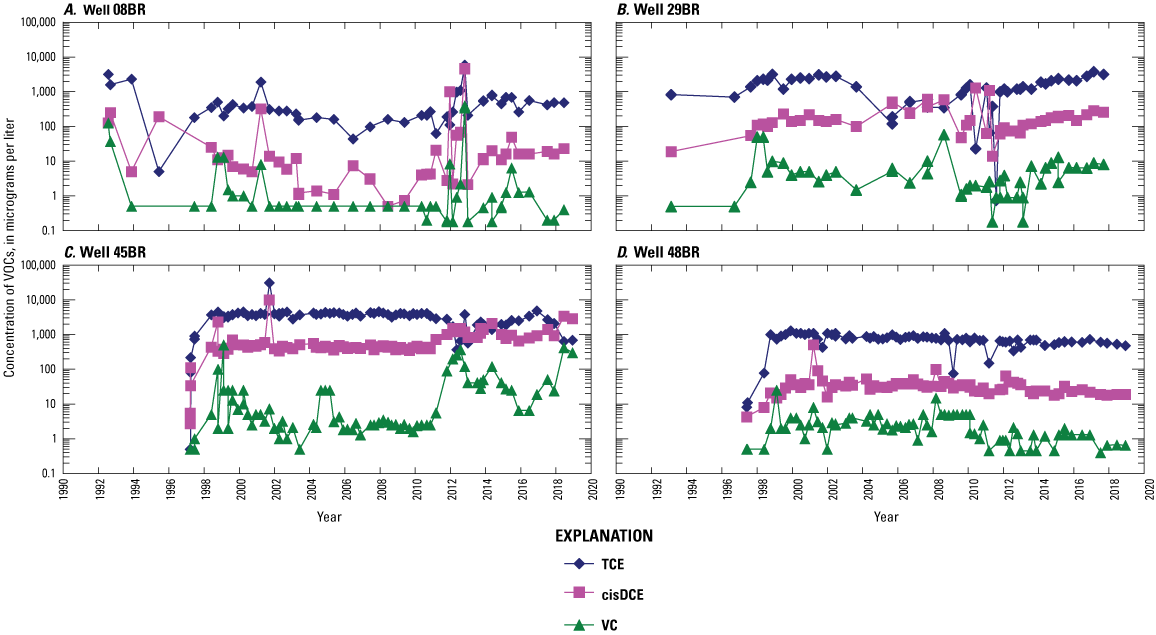
Volatile organic compound (VOC) concentrations in extraction wells in the northwest, northeast, and southeast quadrants, former Naval Air Warfare Center, West Trenton, New Jersey, 1992–2018. TCE, trichloroethene; cisDCE, cis-1,2-dichloroethene; VC, vinyl chloride.
Extraction well 91BR showed a small increase in all VOC compounds between 2017 and 2018 (fig. 38) though not high enough to be considered substantial (appendix 3). TCE and cisDCE have shown increasing trends since its installation in 2014, so an increase in VOC concentrations may be expected as its cone of influence expands and draws in more contaminated groundwater from greater distances. For all other extraction wells, no substantial change in VOC concentrations were noted from 2017 to 2018 (figs. 37–38). The longer-term trends for these extraction wells remain unchanged and were discussed by Imbrigiotta and Fiore (2021).
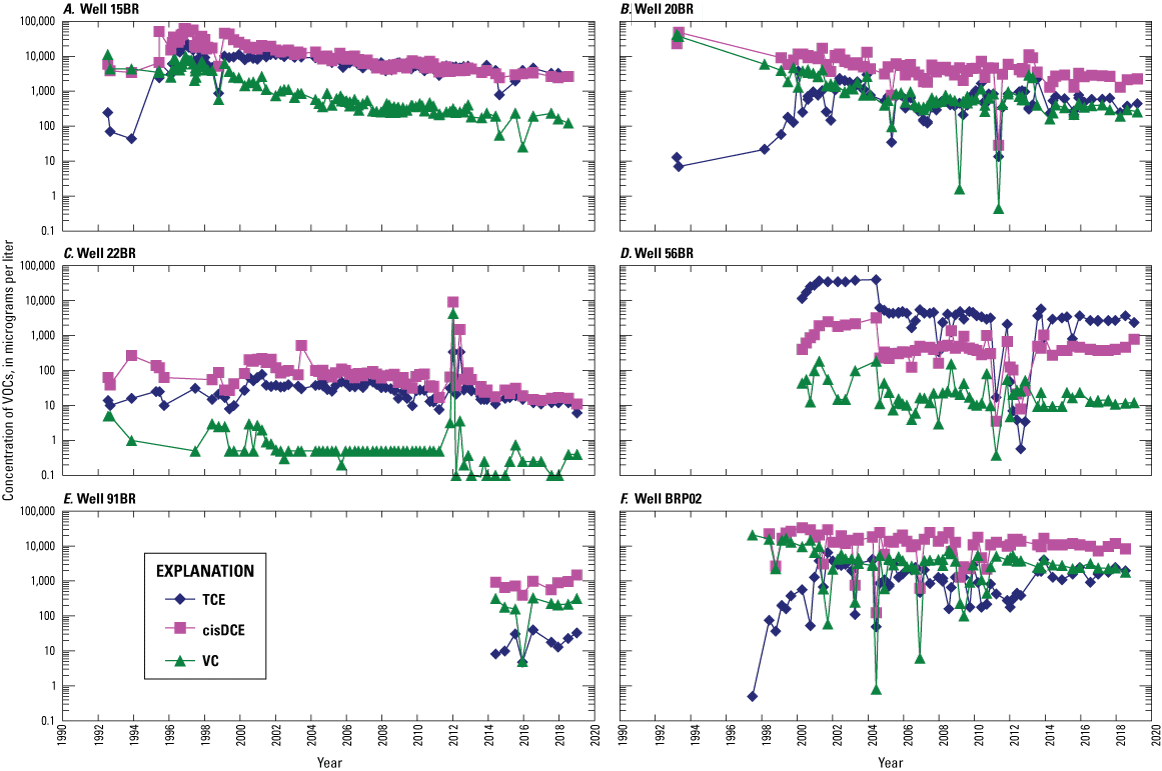
Volatile organic compound (VOC) concentrations in extraction wells in the southwest quadrant, former Naval Air Warfare Center, West Trenton, New Jersey, 1992–2018. TCE, trichloroethene; cisDCE, cis-1,2-dichloroethene; VC, vinyl chloride.
Inspection of the VOC concentration data in monitoring wells in the SW quadrant showed that TCE increased in concentration in one well (36BR-A) and decreased in six wells (24BR, 40S, 70BR-10, 73BR-A, 74BR, BRP01), cisDCE increased in five wells (30BR, 36BR-A, 60BR, 65BR, 73BR-A) and decreased in three wells (24BR, 70BR-10, BRP01), and VC increased in two wells (40BR, 73BR-A) and decreased in six wells (04BR, 16BR, 24BR, 70BR-10, 74BR, BRP01) (appendix 3, fig. 39). The SW quadrant includes the Site 1 contamination area as well as the locations of the bioaugmentation experiments performed in 2005 (Geosyntec Consultants, 2010) and 2008 (Tiedeman and others, 2018; Shapiro and others, 2018). Wells 30BR, 73BR-A, 74BR, and BRP01 are located in the bioaugmentation experiment areas and their trends in concentrations are likely caused by continued reductive dechlorination occurring in these areas. These wells have all had stable to gradually decreasing VOC concentrations over the longer term (fig. 39). Well 38BR in the 2005 bioaugmentation area, despite showing negligible change from its previous sample, has had long-term trends of decreasing TCE concentrations and increasing cisDCE and VC concentrations that are likely a result of continued biodegradation in this well (fig. 39). Well 16BR had negligible TCE and cisDCE changes from the previous year, but has shown a general decreasing trend in cisDCE and VC since 2012 (fig. 39). Well 70BR-10 is located in the 2008 bioaugmentation area but its shallow depth and generally decreasing VOC concentrations may also be related to volatilization to the unsaturated zone. Well 36BR-A was the injection well for the 2008 bioaugmentation study and TCE concentrations have remained low since the experiment concluded, so the three orders-of-magnitude increase in TCE concentration between 2017 and 2018 was unexpected (fig. 39). This observation may mean that anaerobic biodegradation has slowed in this well (cisDCE and VC were relatively unchanged) or that either desorption of TCE from contaminated aquifer materials or dissolution of DNAPL TCE from dead-end pore spaces has occurred near this well to cause this increase.
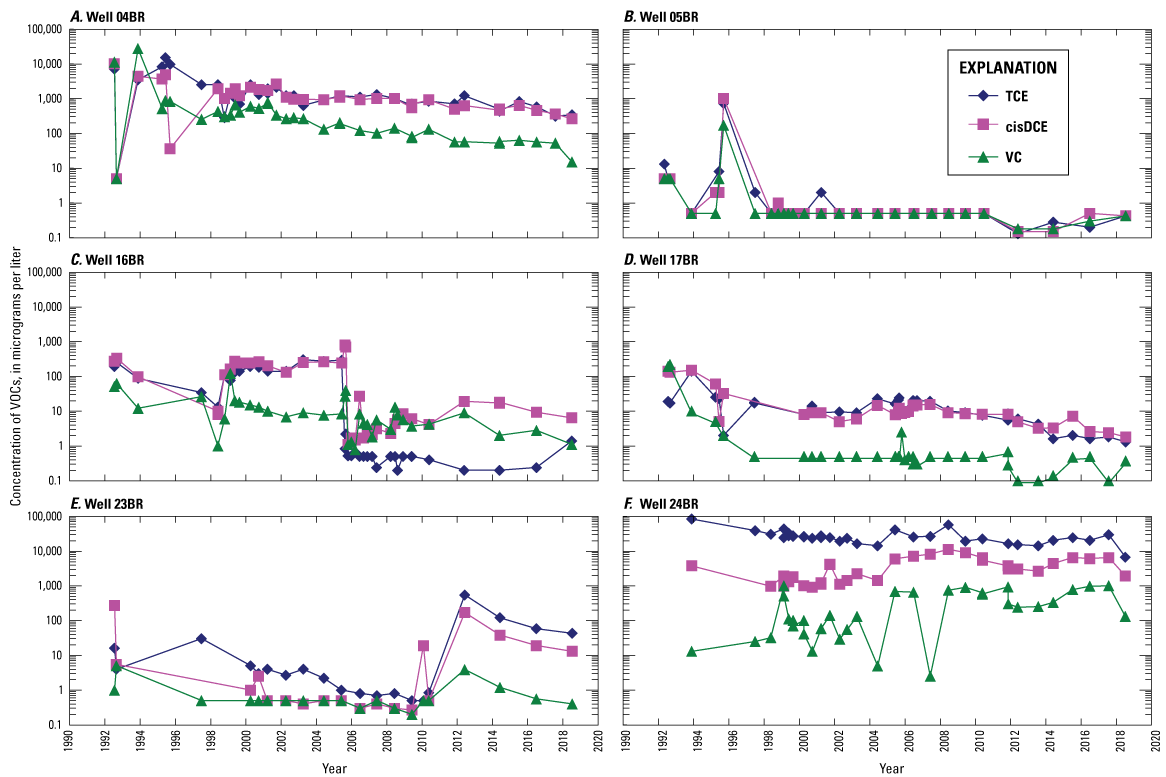
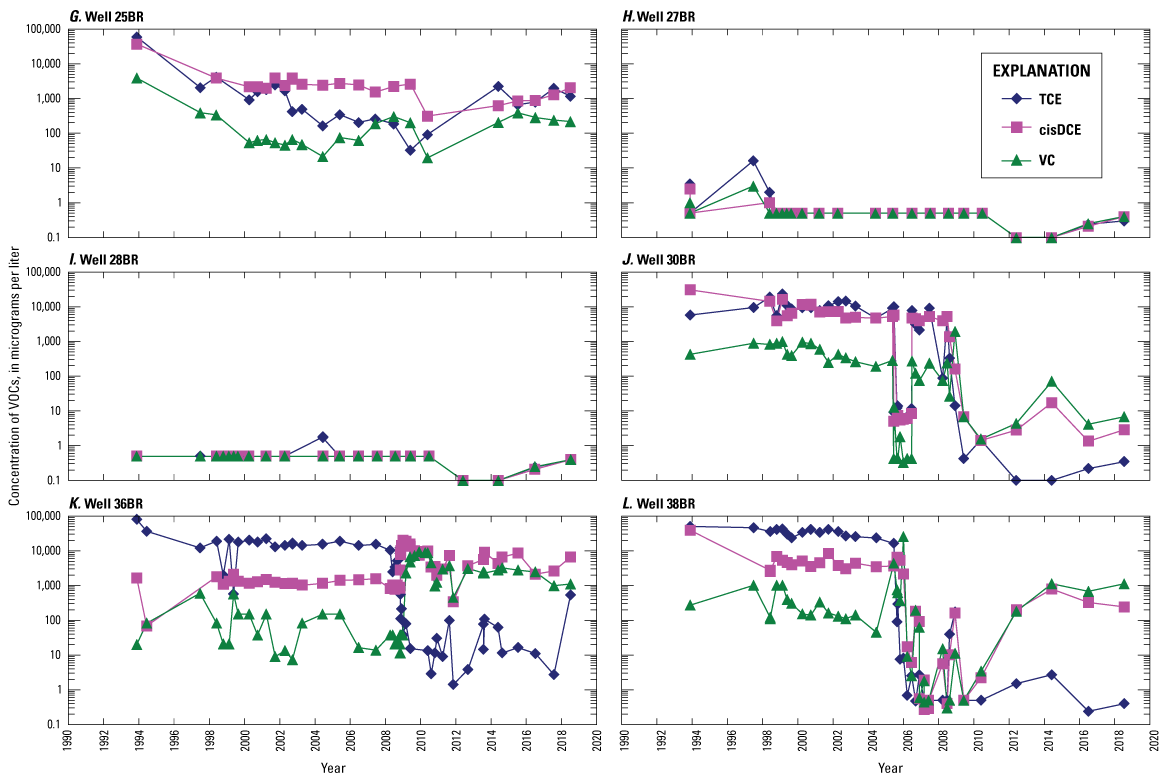
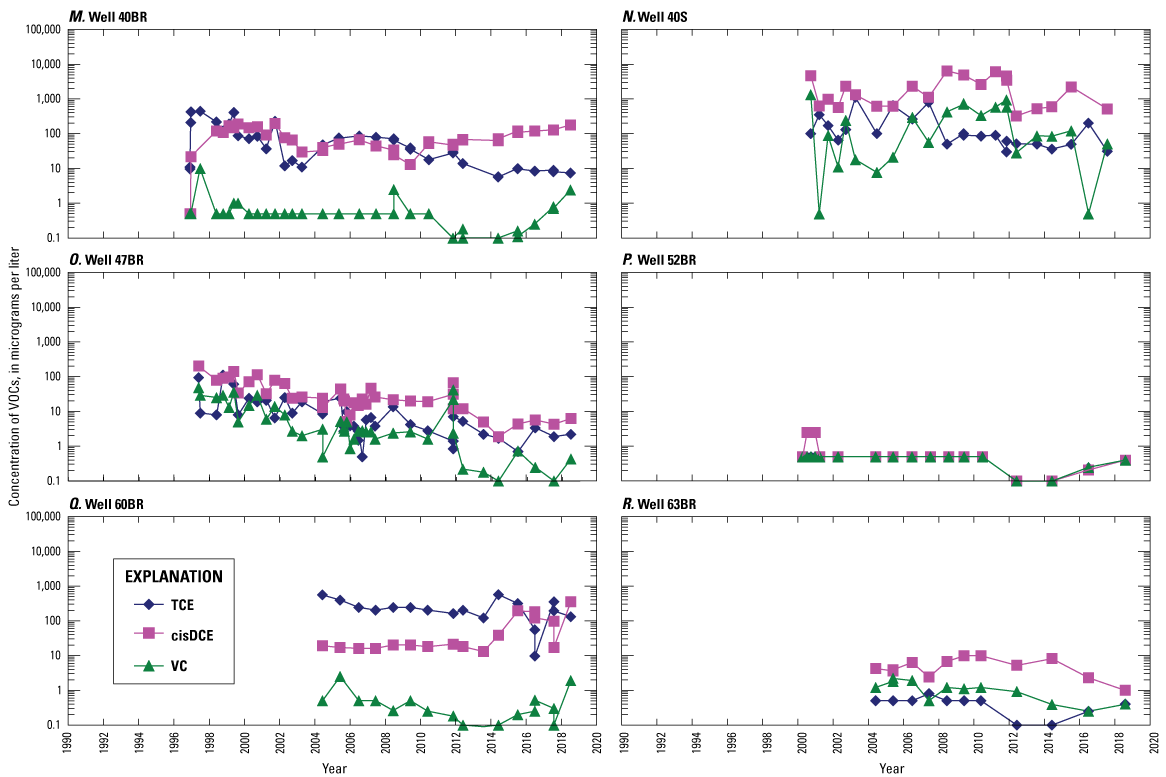
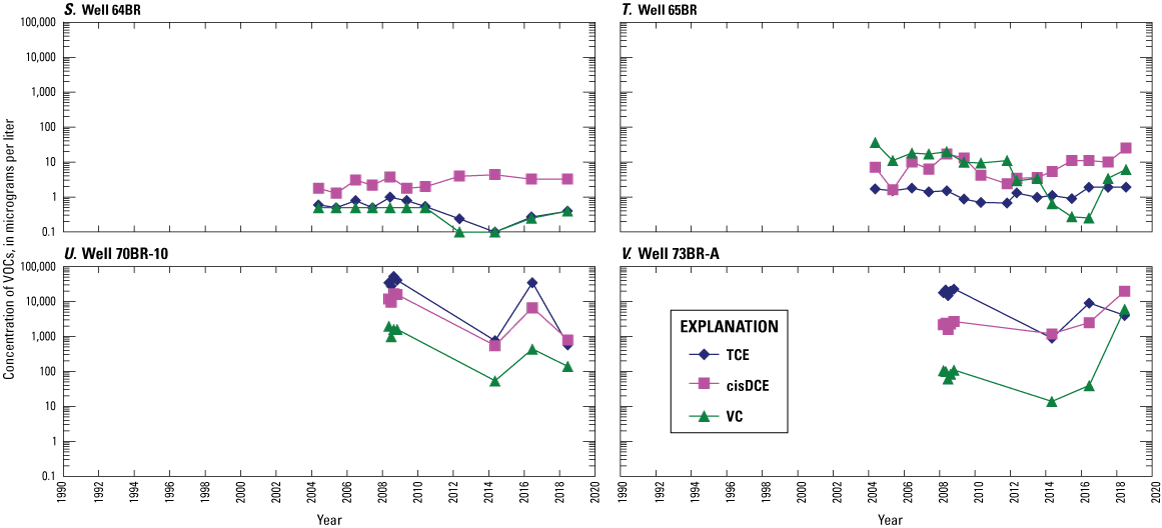
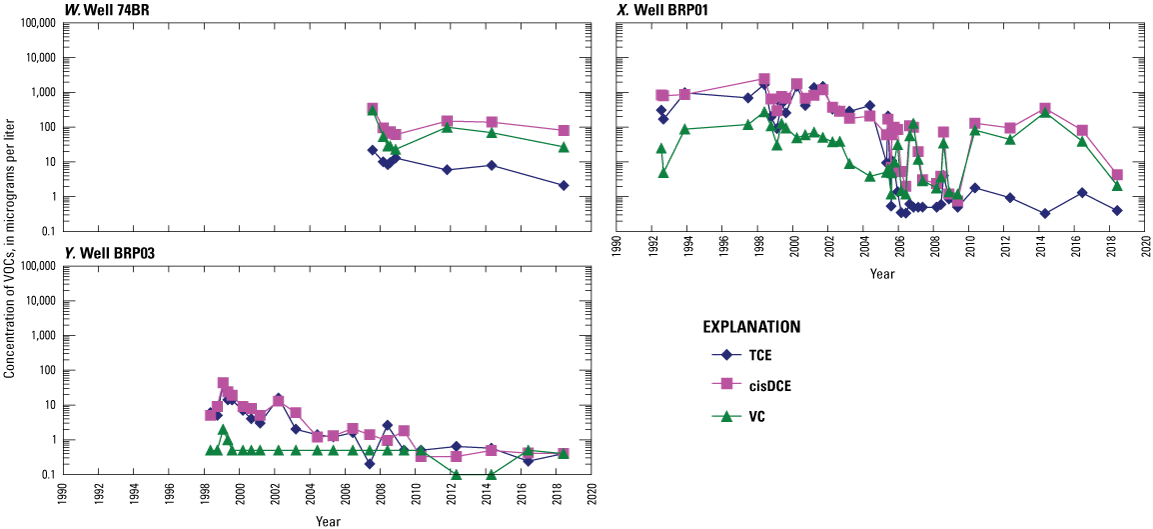
Volatile organic compound (VOC) concentrations in monitoring wells in the southwest quadrant, former Naval Air Warfare Center, West Trenton, New Jersey, 1992–2018. TCE, trichloroethene; cisDCE, cis-1,2-dichloroethene; VC, vinyl chloride.
Outside the bioaugmentation areas in the SW quadrant, the decreasing trend in TCE and cisDCE concentrations in shallow well 40S (fig. 39) may be caused by volatilization to the unsaturated zone or its close proximity to three different extraction wells. The increasing trends in cisDCE and VC concentrations in wells 40BR, 60BR, and 65BR (fig. 39) are likely caused by the effects of natural biodegradation in the fractured rock aquifer. Although wells 04BR and 24BR showed decreases in all VOCs from 2017 to 2018, cisDCE and VC concentrations were generally stable for the prior 10 years.
Increasing TCE concentrations were found in 02BR (NE quadrant) and 42BR (SE quadrant) and increasing cisDCE concentrations were found in 02BR and 11BR (both NE quadrant) (figs. 40 and 41). Wells 02BR and 11BR exhibit stable or minimal change in VOC concentrations overall, so the changes from the previous sample may not be sustained. The increase in the TCE concentration from well 42BR is from below the MDL to just above it, and as discussed earlier, it may be a sampling artifact. Decreases in TCE concentrations occurred in 31S (SE quadrant), possibly from volatilization or its proximity to extraction well 48BR based on the long-term trend (fig. 41). No wells outside the SW quadrant showed decreasing cisDCE or VC concentrations from 2017 to 2018. The change in concentrations in the NW quadrant and offsite wells were either indeterminant or indicated no change, but generally, most of these wells are below the MDL for all VOCs (figs. 42 and 43).
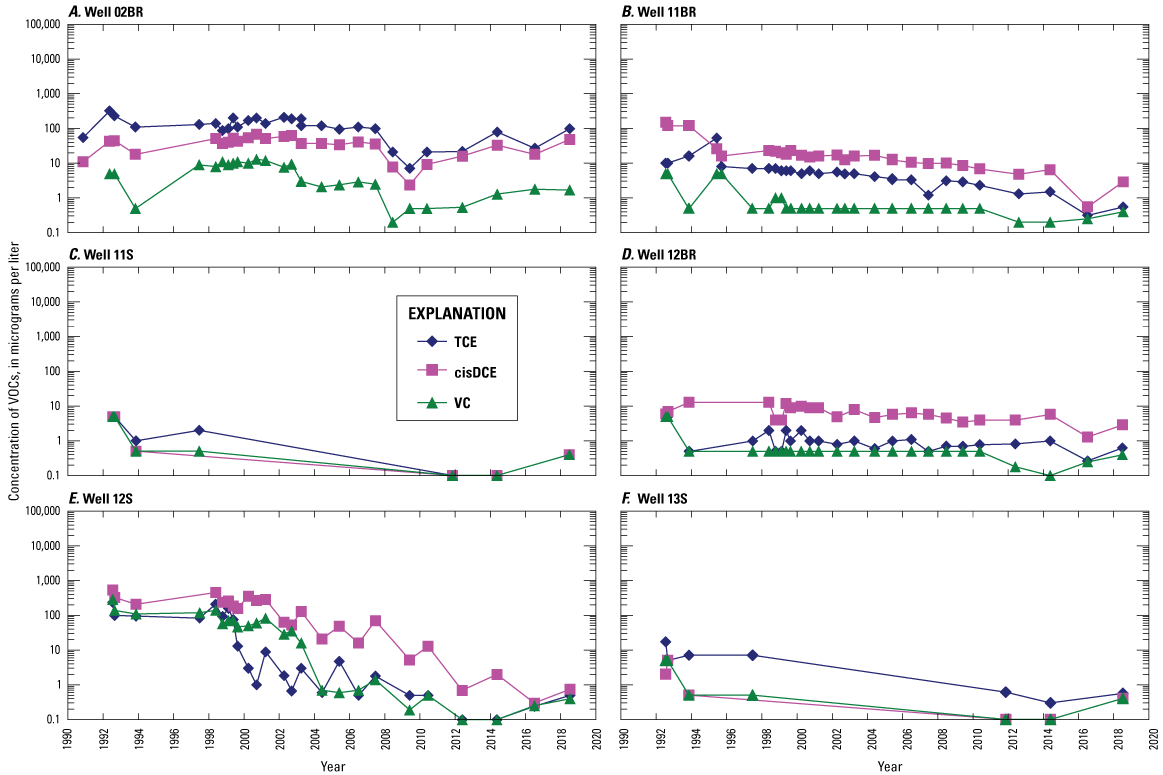
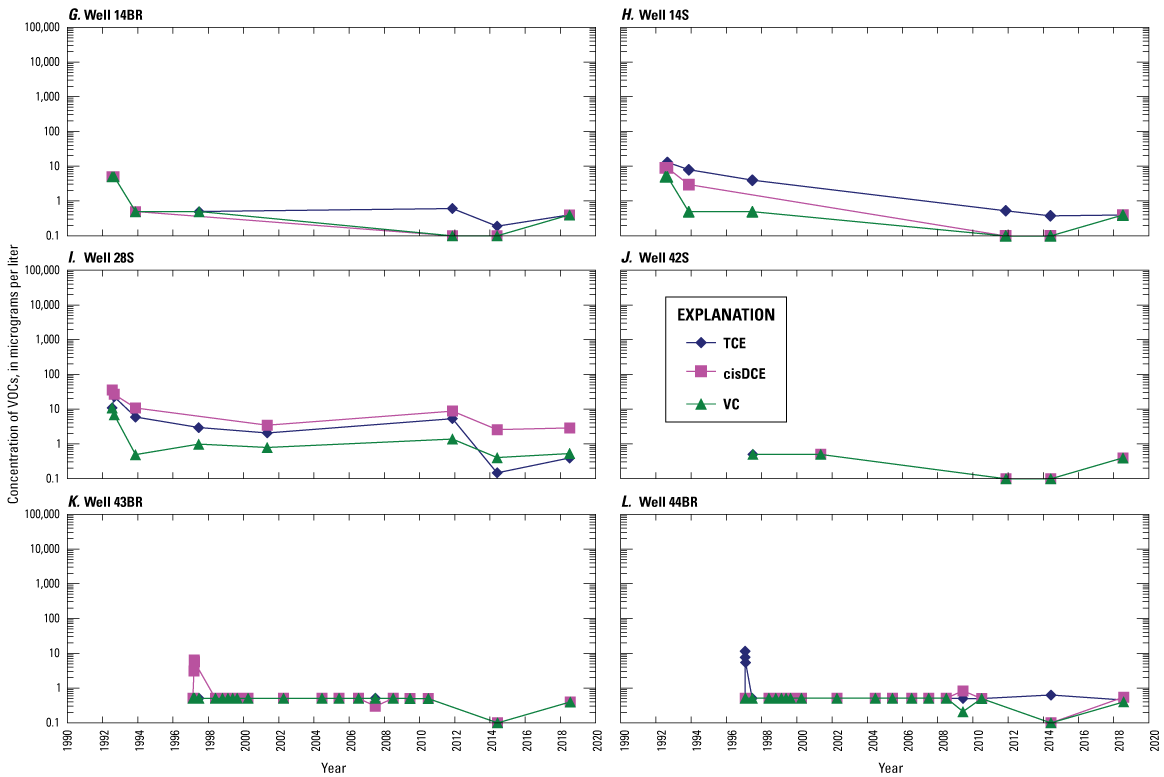
Volatile organic compound (VOC) concentrations in monitoring wells in the northeast quadrant, former Naval Air Warfare Center, West Trenton, New Jersey, 1992–2018. TCE, trichloroethene; cisDCE, cis-1,2-dichloroethene; VC, vinyl chloride.
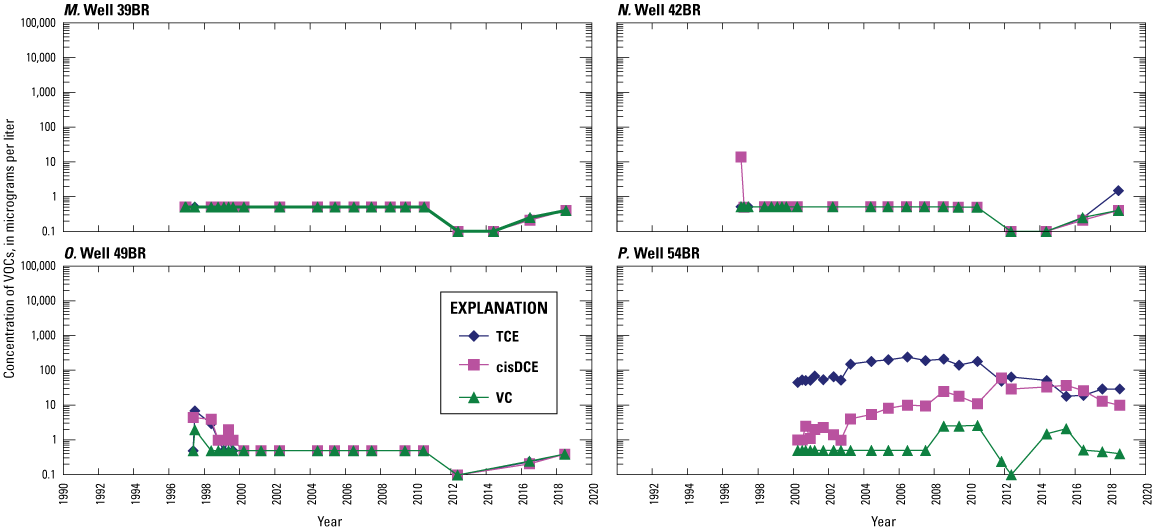
Volatile organic compound (VOC) concentrations in monitoring wells in the southeast quadrant, former Naval Air Warfare Center, West Trenton, New Jersey, 1992–2018. TCE, trichloroethene; cisDCE, cis-1,2-dichloroethene; VC, vinyl chloride.
Volatile organic compound (VOC) concentrations in monitoring wells in the northwest quadrant, former Naval Air Warfare Center, West Trenton, New Jersey, 1992–2018. TCE, trichloroethene; cisDCE, cis-1,2-dichloroethene; VC, vinyl chloride.
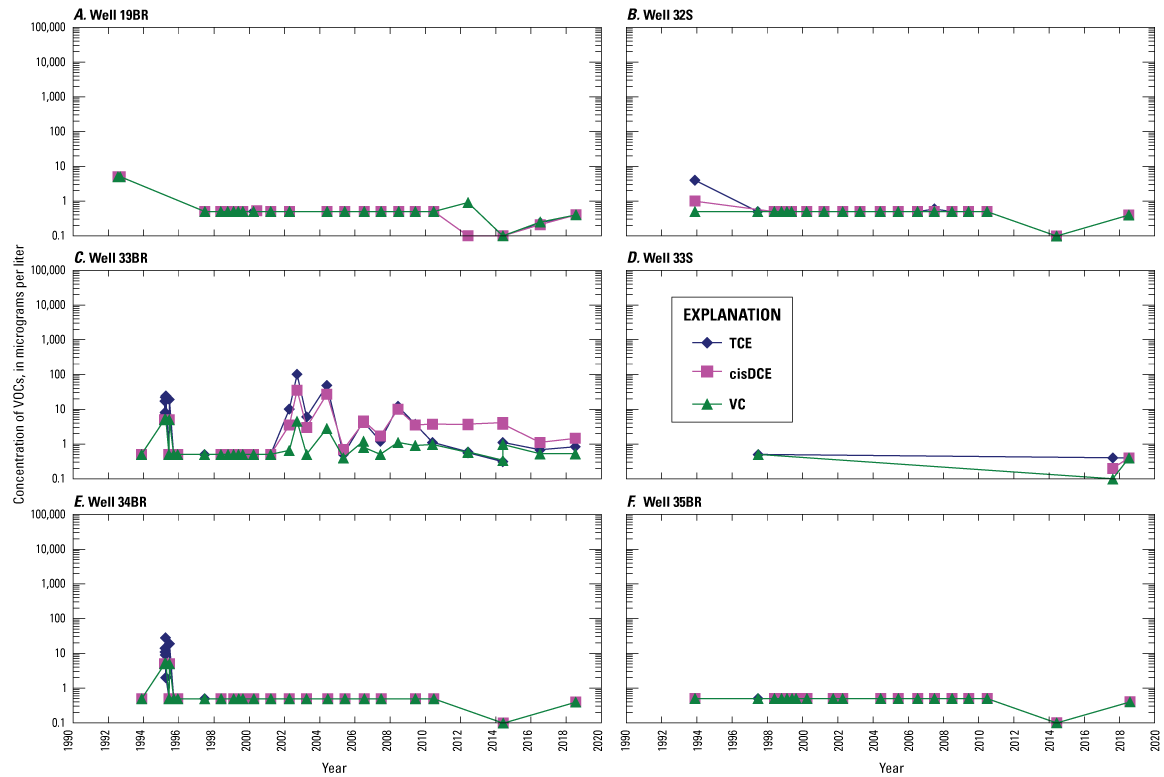
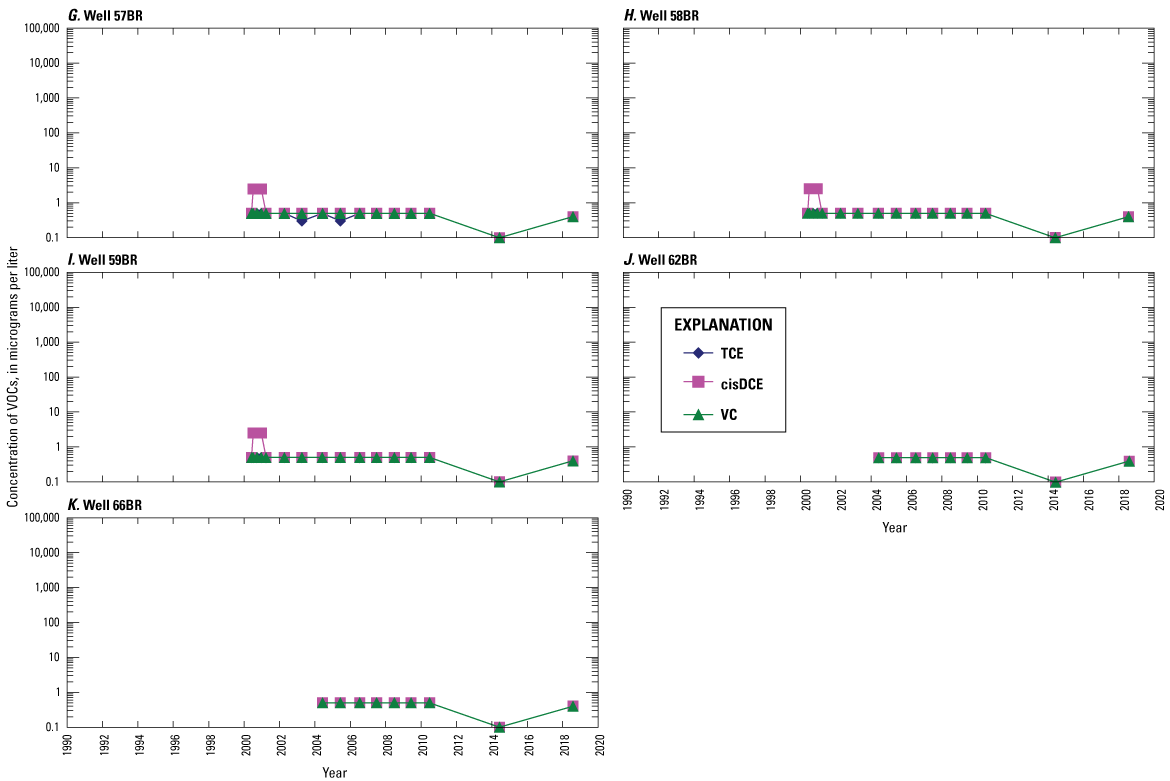
Volatile organic compound (VOC) concentrations in offsite monitoring wells, former Naval Air Warfare Center, West Trenton, New Jersey, 1992–2018. TCE, trichloroethene; cisDCE, cis-1,2-dichloroethene; VC, vinyl chloride.
Distribution of VOC and PFAS Contamination in Surface Water
One pathway by which VOCs leave the NAWC site is through the ditches and storm- sewer lines located throughout the site. Evaluating this pathway is important when accounting for the mass of VOCs being released to the environment, especially because the storm-water drains are not connected to the pump-and-treat system, but rather are routed to additional storm sewers under Parkway Avenue that discharge into Gold Run. As previously mentioned, all water collected from ditches and from storm sewer lines is considered surface water in this report. Appendix 4 lists the concentrations, discharge (Q), and calculated fluxes (where possible) that were measured in February, June, August, and December 2018.
VOC Concentrations in Surface Water
The presence of VOCs in the surface water at the site indicates that residual TCE contamination may be present in soils and in shallow aquifer materials. Precipitation falling on the ground infiltrates through contaminated unconsolidated surface materials that may discharge desorbed dissolved VOCs into swales and ditches as well as into storm sewers. Seasonally, there may be periods when groundwater levels rise to the point where the saturated zone intersects permeable or broken pipes and culverts; high VOC concentrations seen along the West Ditch (appendix 4; fig. 44) and shallow groundwater levels (Fiore and Lacombe, 2020) support this assertion. Groundwater initially discharges into the West Ditch at WDspring (fig. 3), which has <0.75 μg/L concentrations of all VOCs (appendix 4). However, locations along the West Ditch downstream of WDspring are contaminated with VOCs despite being culverted and not engineered to receive groundwater discharge. A perforated subsurface seepage pipe with a collection sump, referred to as the “Interceptor” site (Koman Government Solutions, 2018), collects groundwater on the east side of the West Ditch in this area. The interceptor sump was found to have substantial concentrations of TCE (6,400 μg/L), cisDCE (1,600 μg/L), and VC (13 μg/L) in 2018 (appendix 4). The high VOC concentrations along the West Ditch downstream from this sump are likely caused by the water table in the Interceptor area intersecting permeable or broken segments of the West Ditch culvert, thereby allowing contaminated groundwater to seep in. This likely occurs at or near MH-140 (fig. 3; appendix 4). Additionally, because the abandoned buildings are open to the weather, rain may wash residual VOCs from the buildings into drains and ultimately the storm-sewer lines. The measurable concentrations of VOCs found at the Roof Drain sampling site (fig. 3; appendix 4) are evidence of this occurring.
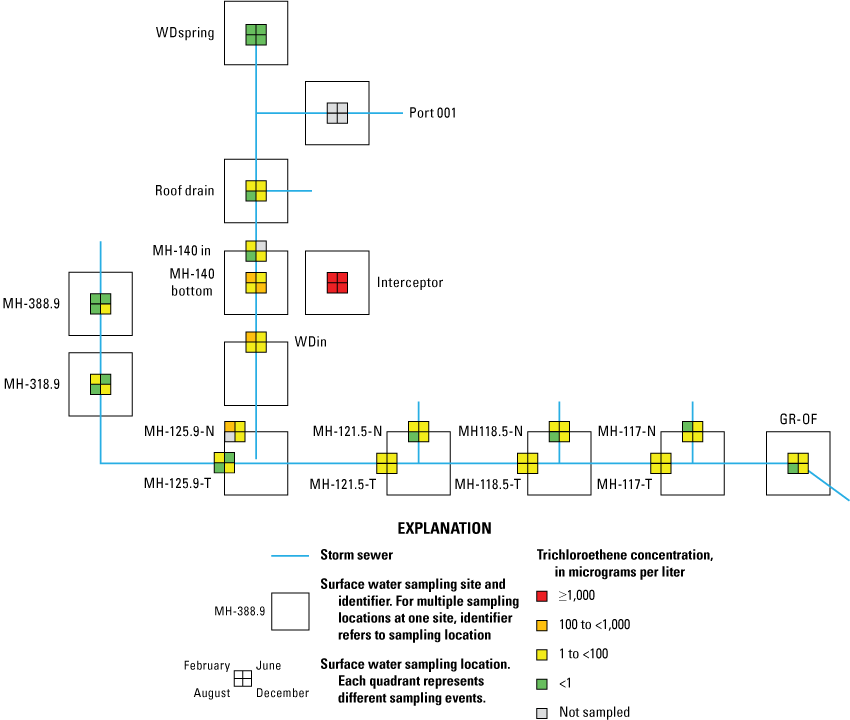
Distribution of trichloroethene in surface water at the former Naval Air Warfare Center, West Trenton, New Jersey, 2018.
In 2018 surface water samples, TCE was quantifiable in 59 samples, cisDCE in 58 samples, and VC in 23 samples (appendix 4). VOCs were present at detectable levels at all surface water sites except WDspring. Locations where notably elevated VOC concentrations were found included MH-118.5-T, MH 121.5-T, MH 125.9-N, WDin, and MH 140-Bottom. The highest surface water TCE concentration (480 μg/L) was found in February in MH140-Bottom (fig. 44). The highest surface water cisDCE concentration (340 μg/L) and VC concentration (13 μg/L) were found in December in MH 121.5-T (figs. 45 and 46). In general, the highest surface water VOC concentrations were found coming from the West Ditch drainage area in the February and December samples, seasons when groundwater levels were highest (Fiore and Lacombe, 2020) and when cold temperatures would have slowed volatilization and biodegradation. Also noteworthy was that in most sample locations, cisDCE concentrations exceeded TCE concentrations (appendix 4; figs. 44 and 45). The only exceptions were in MH140-Bottom, MH-140-In, and the Roof Drain. cisDCE was also elevated in GR-OF (located farthest downstream to the east) in February (18 μg/L). This high concentration of cisDCE appeared to be the result of higher cisDCE entering the Township Line at MH-118.5-N in February (fig. 45). Similarly, elevated VC (1.9 μg/L) in MH-117-T in February was caused by VC entering from the West Ditch system at MH-129.5-N (12 μg/L) and from the OF-3 system at MH-118.5-N (2.8 μg/L) (fig. 46). VC was only sporadically detected, most notably being found in MH-121.5-T (all samples) and MH-125.9-N (February and December). VC concentrations were below detection limits at most surface water sites during the year, likely because of its high volatility (fig. 46). The presence of high concentrations of the degradation products in the surface water indicates that biodegradation is occurring in the contaminated groundwater in the bedrock aquifer and is discharging to the storm-sewer lines.
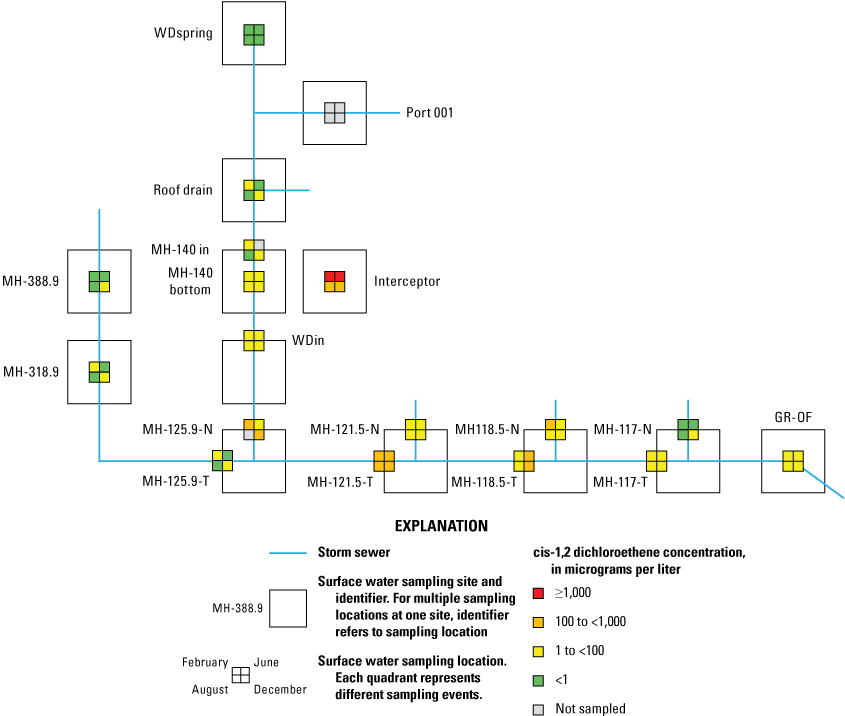
Distribution of cis-1,2 dichloroethene in surface water at the former Naval Air Warfare Center, West Trenton, New Jersey, 2018.
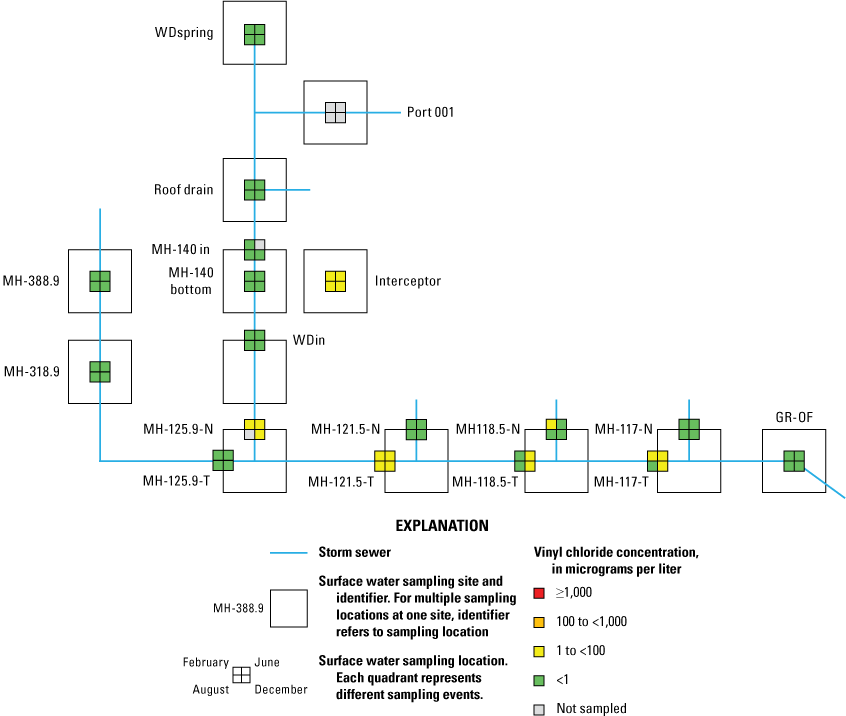
Distribution of vinyl chloride in surface water at the former Naval Air Warfare Center, West Trenton, New Jersey, 2018.
High groundwater levels result in a greater likelihood for contaminated groundwater discharge and seepage into the storm sewer lines. At all surface-water sampling sites, the highest concentrations of VOCs occurred in the months of February and December, when 2018 NAWC groundwater levels were higher compared to those measured during the June and August sampling events (Fiore and Lacombe, 2020). Manholes MH-388.9, MH-318.9, and MH-125.9-T are located farthest upstream along the Township Line and do not receive direct stormwater runoff from the NAWC site (fig. 3), yet each site had detectable concentrations of TCE and (or) cisDCE above their MCLs at least once in 2018 (appendix 4). Groundwater levels in monitoring wells 33BR and 58BR, located west of MH-388.9, are known to respond to pumping from extraction well 45BR (Lacombe, 2000; Tiedeman and others, 2010), which went offline from February to April and contributed to higher groundwater levels in those wells during this time period (Fiore and Lacombe, 2020). Similarly, pumping volumes were lower overall during December, which also caused higher groundwater levels (Fiore and Lacombe, 2020). Higher groundwater levels in this area would favor TCE- and cisDCE-contaminated groundwater discharge into the West Ditch and potentially the upstream groundwater discharge area that flows into MH-388.9, ultimately resulting in higher VOC concentrations along the entire Township Line storm sewer.
PFAS Concentrations in Surface Water
Samples for the PFAS suite of compounds (PFOS, PFOA, and PFNA) were collected at all surface water sites in 2018, except for the Roof Drain, Port 001, and MH-140-In. PFOS, PFOA, and PFNA were detected in all 16 surface-water samples collected in June of 2018 (appendix 4). Site MH-117-N had the highest concentrations of PFOS (2,000 ng/L) and PFOA (100 ng/L). Site WDspring had the highest concentration of PFNA (13 ng/L). Overall, all three PFAS were found to enter the Township Line storm sewer at concentrations exceeding their NJDEP MCLs from the West Ditch system, the OF-2 system, the OF-3 system, and the OF-4 system (fig. 47). PFAS samples were only collected in June, so it was not possible to evaluate the effects of seasonality that may relate to groundwater levels, as was done with VOCs. The fact that the highest overall concentrations of PFAS were sampled in MH-117-N, which connects with the OF-4 system, suggests an important source of the compounds lies in the NE and possibly the SE quadrants, including the northern grassy area located on the Airport property. This was the area of NAWC where AFFF was reportedly discharged to the ground surface in the early 1990s (Tetra Tech, 2018).
Distribution of perfluorooctane sulfonate (PFOS), perfluorooctanoic acid (PFOA), and perfluorononanoic acid (PFNA) concentrations in surface water at the former Naval Air Warfare Center, West Trenton, New Jersey, 2018.
Also noteworthy is the geographical relation between the ratio of PFOS to PFOA across the site. At locations where PFOS concentrations were found to exceed the NJDEP MCLs, PFOS concentrations were always higher than the PFOA concentrations (appendix 4; fig. 47). This appears to be exclusively the case along the east side of NAWC, in the area where the reported discharge of AFFF occurred (Tetra Tech, 2018). This higher ratio of PFOS to PFOA in the surface water also occurred in the groundwater on the east side of NAWC.
Along the west side of the NAWC site, the surface-water concentrations of PFOA exceeded those of PFOS (appendix 4; fig. 47). This was the case for samples from WDspring and from manholes MH-388.9 downstream along the Township Line until MH-118.5-N, where the OF-3 system enters the Township Line sewer (figs. 3 and 47). Therefore, although the data on the west side of NAWC are limited, surface water on the west side of the site was characterized by a lower PFOS to PFOA concentration ratio, whereas on the east side of the site it is dominated by a higher PFOS to PFOA concentration ratio. The divide between these areas is near the OF-2 system, as shown in the sample from MH-121.5-N, which demonstrates a negligible difference between concentrations of PFOS and PFOA.
Surface water PFNA concentrations were not found to exceed their NJDEP MCL of 13 ng/L at any surface-water sampling location in 2018. The highest PFNA concentrations were detected in WDspring (13 ng/L), WDspring duplicate (12 ng/L), MH-125.9-N (12 ng/L), and MH-117-N (12 ng/L). PFOA and PFOS both exceeded their NJDEP MCLs of 14 ng/L and 13 ng/L, respectively, at sites MH-121.5-N, MH-118.5-N. MH-118.5-T, MH-1117-N, MH-117-T, and GR-OF.
VOC and PFAS Fluxes in Surface Water
Daily fluxes of VOCs and PFAS were estimated by multiplying the rate of flow (Q) by the concentration of each VOC or PFAS and normalizing to unit time (day) (appendix 4). Fluxes were calculated for three VOCs (TCE, cisDCE, and VC) and three PFAS (PFOA, PFOS, and PFNA). Fluxes could not be calculated for sites where Q was not measured, for example, if the sampling site was dry and no sample or Q measurement was possible. Fluxes were calculated for samples from WDin, MH-125.9-T, MH-125.9-N, MH 121.5-N, MH-118.5-N, and MH-117-N. The maximum fluxes of the VOC species were found to be 3.6 grams per day (g/d) for TCE at site WDin (December sample), 13 g/d for cisDCE at site MH-118.5-N (February), and 0.31 g/d for VC at site MH-118.5-N (February). The maximum flux measured for PFAS compounds were 160 milligrams per day (mg/d) PFOS, 8.4 mg/d PFOA, and 0.63 mg/d PFNA, which were all measured at MH 118.5-N in the June sample.
These fluxes should be considered rough estimates because the discharge measurements used to measure flow in the storm sewers need to be upgraded and standardized to give more meaningful estimations of the mass of VOCs and PFAS leaving the site through surface waters. Likewise, seasonal sampling of PFAS will be needed to determine ranges in fluxes that may occur as groundwater levels and discharge vary over the year.
Summary and Conclusions
Groundwater and surface-water samples were collected in 2018 at the former Naval Air Warfare Center (NAWC) site in West Trenton, New Jersey and were analyzed for volatile organic compounds (VOCs), including trichloroethene (TCE), cis-1,2-dichloroethene (cisDCE), and vinyl chloride (VC), and a suite of per- and polyfluoroalkyl substances (PFAS), including perfluorooctane sulfonate (PFOS), perfluorooctanoic acid (PFOA), perfluorononanoic acid (PFNA), and perfluorobutane sulfonate (PFBS). This sampling was conducted for the U.S. Navy as part of its long-term groundwater quality monitoring program required by the New Jersey Department of Environmental Protection. The 85 wells sampled in 2018 were a subset of all of the wells at the NAWC site and were chosen based on the schedule in the long-term monitoring Sampling and Analysis Plan (SAP). Wells were split into five groups—wells in four geographic quadrants on the site and wells located offsite. The two principal areas where TCE contamination originated were traditionally referred to as Site 1 (located in the northwest [NW] and southwest [SW] quadrants) and Site 3 (located in the northeast [NE] quadrant). Of the 85 wells sampled at the NAWC site in 2018, 16 were sampled in the NE quadrant, 11 in the NW quadrant, 16 in the southeast (SE) quadrant, 31 in the SW quadrant, and 11 offsite. All 10 extraction wells associated with the groundwater pump-and-treat system on the site were sampled in 2018. In addition, 70 surface water samples were collected at the NAWC site for analysis of VOCs and 16 for analysis of PFAS. Surface water included drains, culverts, springs, manholes, and storm sewers around the NAWC site. When possible, discharge was measured at these sampling points.
The highest concentrations of all three VOCs were found in groundwater in the NW and SW quadrants related to the Site 1 contamination area. In the NE quadrant, maximum concentrations were 530 micrograms per liter (µg/L) TCE (48BR), 48 µg/L cisDCE (02BR), and 1.7 µg/L VC (02BR) related to the Site 3 contamination area. In the NW quadrant, maximum concentrations were 3,200 µg/L TCE (29BR), 3,400 µg/L cisDCE (45BR), and 420 µg/L VC (45BR). In the SE quadrant, maximum concentrations were 29 µg/L TCE (54BR), 9.8 µg/L cisDCE (54 BR), and all wells had <0.75 μg/L concentrations of VC. In the SW quadrant, the maximum concentrations were 14,000 µg/L TCE (56BR), 41,000 µg/L cisDCE (36BR-A), and 6,100 µg/L VC (73-BR-A). No VOCs were found at or above reporting levels concentrations in any wells offsite west of NAWC, indicating that the pump-and-treat system was preventing the flow of VOC contamination off the NAWC site to the west.
PFAS compounds were measured in samples collected from the 10 extraction wells. PFOS was detected in two wells at a maximum concentration of 470 nanograms per liter (ng/L), PFOA was detected in seven wells with a maximum concentration of 54 ng/L, PFNA was detected in two wells with a maximum concentration of 9.8 ng/L, and PFBS was detected in two wells with a maximum concentration of 89 ng/L. All of the maximum concentrations were present in extraction well 48BR, which is located in the NE quadrant of the site closest to the location where aqueous film-forming foam was reported to have been discharged in the past.
Twenty-seven cross-sectional plots were prepared to demonstrate the vertical distribution of VOCs below the surface. Measurable concentrations of TCE, cisDCE, and VC were found to extend from shallow wells at the water table to bedrock wells that were more than 200 feet (ft) in depth. The highest TCE, cisDCE, and VC concentrations were found in wells 165 ft deep (56BR), 125 ft deep (36BR-A), and 34.6 ft deep (73BR-A), respectively. Excluding extraction wells, the highest TCE, cisDCE, and VC concentrations were found at 95 ft deep (24BR), 125 ft deep (36BR), and 34.6 ft deep (73-BR-A). Of the 85 wells sampled in 2018, TCE concentrations remained unchanged or decreased from their previously measured TCE concentrations in 82 of them.
Results of the surface-water sampling showed that VOCs and PFAS compounds were present in springs, ditches, and storm-sewer lines across the site. Measurable concentrations of TCE and cisDCE were found at 16 of the surface-water sampling sites, and VC at 9 of the sites. The highest VOC concentrations entered through the West Ditch system. The PFAS compounds were found in quantifiable concentrations at 14 of the sites, with the maximum concentrations of PFOS (2,000 ng/L) and PFOA (110 ng/L) being present in MH-117-N and the maximum concentration of PFNA (13 ng/L) being present in the West Ditch spring. Fluxes of VOCs and PFAS compounds in the storm sewers were estimated using measured concentrations and the best-available measurements of discharge. These calculations indicate quantities on the order of grams per day of VOCs and milligrams per day of PFAS may leave the site through surface-water discharge.
References Cited
Barrio-Lage, G., Parsons, F.Z., Nassar, R.S., and Lorenzo, P.A., 1986, Sequential dehalogenation of chlorinated ethenes: Environmental Science & Technology, v. 20, no. 1, p. 96–99, accessed August 26, 2019. https://doi.org/10.1021/es00143a013.
Chapelle, F.H., Lacombe, P.J., and Bradley, P.M., 2012, Estimated trichloroethene transformation rates due to naturally occurring biodegradation in a fractured bedrock aquifer: Remediation Journal, v. 22, no. 2, p. 7–20, accessed November 24, 2021, at https://doi.org/10.1002/rem.21307.
Fiore, A.R., 2019, Summary of borehole information at the former Naval Air Warfare Center, West Trenton, New Jersey: U.S. Geological Survey data release, accessed November 24, 2021, at https://doi.org/10.5066/P9KL4IL2.
Fiore, A.R., and Imbrigiotta, T.E., 2021, Concentrations of chlorinated volatile organic compounds and per- and polyfluoroalkyl substances in groundwater and surface water, former Naval Air Warfare Center, West Trenton, New Jersey: U.S. Geological Survey data release, accessed November 24, 2021, at https://doi.org/10.5066/P9RCAQ5N.
Fiore, A.R., and Lacombe, P.J., 2020, Groundwater levels and generalized potentiometric surfaces, former Naval Air Warfare Center, West Trenton, New Jersey, 2018: U.S. Geological Survey Open-File Report 2020–1016, 28 p., accessed November 24, 2021, at https://doi.org/10.3133/ofr20201016.
Goode, D.J., Imbrigiotta, T.E., and Lacombe, P.J., 2014, High-resolution delineation of chlorinated volatile organic compounds in a dipping, fractured mudstone—Depth- and strata-dependent spatial variability from rock-core sampling: Journal of Contaminant Hydrology, v. 171, p. 1–11, accessed November 24, 2021, at https://doi.org/10.1016/j.jconhyd.2014.10.005.
Huang, S., and Jaffé, P.R., 2019, Defluorination of perfluorooctanoic acid (PFOA) and perfluorooctane sulfonate (PFOS) by Acidimicrobium sp. strain A6: Environmental Science & Technology, v. 53, no. 19, p. 11410–11419, accessed November 24, 2021, at https://doi.org/10.1021/acs.est.9b04047.
Imbrigiotta, T.E., and Fiore, A.R., 2021, Distribution of chlorinated volatile organic compounds and per- and polyfluoroalkyl substances in monitoring wells at the former Naval Air Warfare Center, West Trenton, New Jersey, 2014–2017: U.S. Geological Survey Open-File Report 2020–1105, 107 p., accessed November 24, 2021, at https://doi.org/10.3133/ofr20201105.
Imbrigiotta, T.E., and Harte, P.T., 2020, Passive sampling of groundwater wells for determination of water chemistry: U.S. Geological Survey Techniques and Methods, chap. 8, section D, book 1, 80 p., accessed May 13, 2021, at https://doi.org/10.3133/tm1D8.
Imbrigiotta, T.E., and Trotsky, J.S., 2011, Demonstration and validation of a regenerated cellulose dialysis membrane diffusion sampler for monitoring groundwater quality and remediation progress at DoD sites—Perchlorate and ordnance compounds: Strategic Environmental Research and Development Program Environmental Security Technology Certification Program Technical Report ER–200313, 75 p., accessed November 24, 2021, at https://www.serdp-estcp.org//Program-Areas/Environmental-Restoration/Contaminated-Groundwater/Monitoring/ER-200313.
Imbrigiotta, T.E., Trotsky, J.S., and Place, M.C., 2007, Demonstration and validation of a regenerated cellulose dialysis membrane diffusion sampler for monitoring ground-water quality and remediation progress at DoD sites (ER-0313): Naval Facilities Engineering Service Technical Report TR–2281–ENV, 127 p., accessed November 24, 2021, at https://apps.dtic.mil/docs/citations/ADA506680.
Interstate Technology & Research Council, 2018a, Naming conventions and physical and chemical properties of per- and polyfluoroalkyl substances (PFAS): Interstate Technology & Research Council PFAS Fact Sheet 1, 15 p., accessed March 31, 2019, at https://pfas-1.itrcweb.org.
Interstate Technology & Research Council, 2018b, Aqueous film-forming foam (AFFF): Interstate Technology & Research Council PFAS Fact Sheet 7, 12 p., accessed March 31, 2019, at https://pfas-1.itrcweb.org.
Lacombe, P.J., and Burton, W.C., 2010, Hydrogeologic framework of fractured sedimentary rock, Newark Basin, New Jersey: Ground Water Monitoring and Remediation, v. 30, no. 2, p. 35–45, accessed April 22, 2018, at https://doi.org/10.1111/j.1745-6592.2010.01275.x.
Lorah, M.M., and Olsen, L.D., 1999, Natural attenuation of chlorinated volatile organic compounds in a freshwater tidal wetland—Field evidence of anaerobic biodegradation: Water Resources Research, v. 35, no. 12, p. 3811–3827, accessed August 26, 2019, at https://doi.org/10.1029/1999WR900116.
Mackay, D.M., Roberts, P.V., and Cherry, J.A., 1985, Transport of organic contaminants in groundwater: Environmental Science & Technology, v. 19, no. 5, p. 384–392, accessed August 26, 2019, at https://doi.org/10.1021/es00135a001.
National Institute for Occupational Safety and Health, 2007, Pocket guide to chemical hazards: Department of Health and Human Services Publication No. 2005-149, 3rd printing, September 2007, 424 p., accessed August 26, 2019, at https://www.cdc.gov/niosh/docs/2005-149/default.html.
New Jersey Department of Environmental Protection, 2020, Drinking water standards by constituent: NJDEP Division of Science and Research, September 4, 2018, accessed March 25, 2019, at https://www.nj.gov/dep/standards/drinking%20water.pdf.
Shapiro, A.M., Tiedeman, C.R., Imbrigiotta, T.E., Goode, D.J., Hsieh, P.A., Lacombe, P.J., DeFlaun, M.F., Drew, S.R., and Curtis, G.P., 2018, Bioremediation in fractured rock—2. Mobilization of chloroethene compounds from the rock matrix: Ground Water, v. 56, no. 2, p. 317–336, accessed August 26, 2019, at https://doi.org/10.1111/gwat.12586.
Tiedeman, C.R., Lacombe, P.J., and Goode, D.J., 2010, Multiple well-shutdown tests and site-scale flow simulation in fractured rocks: Ground Water, v. 48, no. 3, p. 401–415, accessed April 22, 2018, at https://doi.org/10.1111/j.1745-6584.2009.00651.x.
Tiedeman, C.R., Shapiro, A.M., Hsieh, P.A., Imbrigiotta, T.E., Goode, D.J., Lacombe, P.J., DeFlaun, M.F., Drew, S.R., Johnson, C.D., Williams, J.H., and Curtis, G.P., 2018, Bioremediation in fractured rock—1. Modeling to inform design, monitoring, and expectations: Ground Water, v. 56, no. 2, p. 300–316, accessed August 26, 2019, at https://doi.org/10.1111/gwat.12585.
U.S. Environmental Protection Agency, 2016, Fact sheet: PFOA and PFOS drinking water health advisories: EPA 800-F-16-003, November 2016, accessed March 31, 2019, at https://www.epa.gov/sites/default/files/2016-06/documents/drinkingwaterhealthadvisories_pfoa_pfos_updated_5.31.16.pdf.
U.S. Environmental Protection Agency, 2018a, Method 8260D, Volatile organic compounds by gas chromatography/mass spectrometry: Hazardous Waste Test Methods/SW846, update VI, revision 4, June 2018, 53 p., accessed March 31, 2019, at https://www.epa.gov/sites/production/files/2018-06/documents/method_8260d_update_vi_final_06-11-2018.pdf.
U.S. Environmental Protection Agency, 2018b, Method 537.1, Determination of selected per- and polyfluorinated alkyl substances in drinking water by solid phase extraction and liquid chromatography/tandem mass spectrometry (LS/MS/MS): EPA/600/R-18/352, version 1.0, November 2018, accessed March 31, 2019, at cfpub.epa.gov/si/si_public_file_download.cfm?p_download_id= 537290&Lab= NERL.
Vogel, T.M., Criddle, C.S., and McCarty, P.L., 1987, ES critical reviews—Transformation of halogenated aliphatic compounds: Environmental Science & Technology, v. 21, no. 8, p. 722–736, accessed August 26, 2019, at https://doi.org/10.1021/es00162a001.
Wiedemeier, T.H., Swanson, M.A., Moutoux, D.E., Gordon, E.K., Wilson, J.T., Wilson, B.H., Kampbell, D.H., Haas, P.E., Miller, R.N., Hansen, J.E., and Chapelle, F.H., 1998, Technical protocol for evaluating natural attenuation of chlorinated solvents in groundwater: USEPA 600/R-98/128, September 1998, 248 p., accessed August 26, 2019, at https://www.researchgate.net/profile/John_Wilson37/publication/235101797_Technical_Protocol_for_Evaluating_Natural_Attenuation_of_Chlorinated_Solvents _in_Groundwater_Revision_1/links/0046351a5338dd74c8000000/Technical-Protocol-for-Evaluating-Natural-Attenuation-of-Chlorinated-Solvents-in-Groundwater -Revision-1.pdf.
Wilson, J.T., Kampbell, D., Weaver, J., Wilson, B., Imbrigiotta, T., and Ehlke, T., 1995, A review of intrinsic bioremediation of trichloroethylene in ground water at Picatinny Arsenal, New Jersey, and St. Joseph, Michigan: 1EPA Bioremediation of Hazardous Wastes, p. 13–16, accessed August 26, 2019, at https://play.google.com/books/reader?id=wiJSAAAAMAAJ&hl= en&pg= GBS.PR3.
Wilson, J.T., and Wilson, B.H., 1985, Biotransformation of trichloroethylene in soil: Applied and Environmental Microbiology, v. 49, no. 1, p. 242–243, accessed August 26, 2019, at https://doi.org/10.1128/aem.49.1.242-243.1985.
Appendix 1. Groundwater Flow Directions at the Former Naval Air Warfare Center, West Trenton, New Jersey, 2018
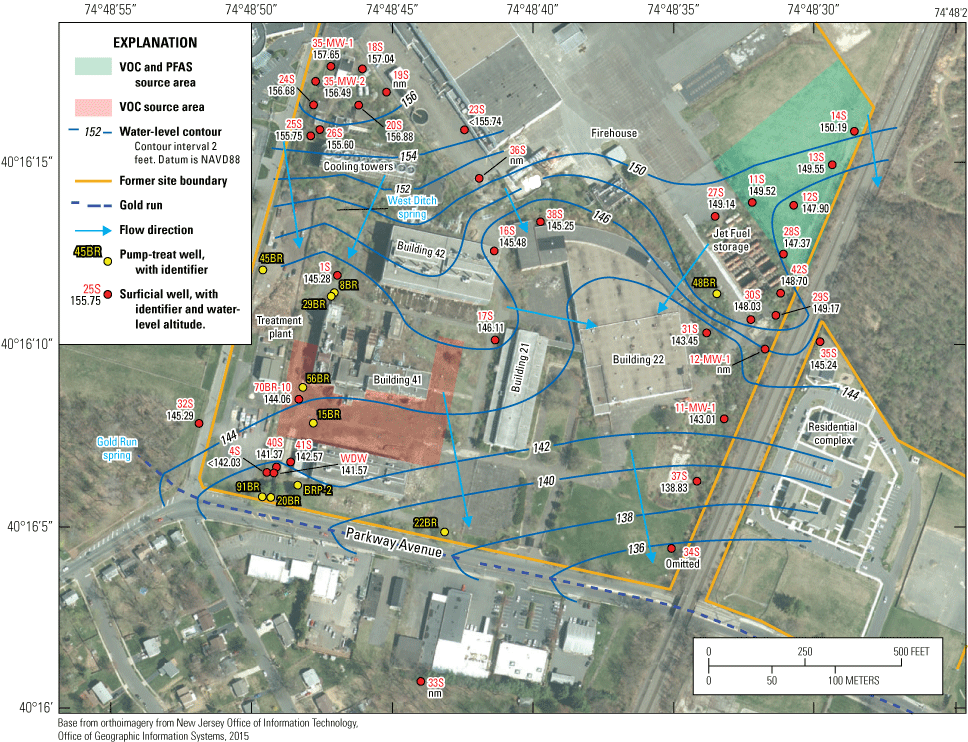
Groundwater levels, generalized water-level potentiometric-surface contours, and generalized groundwater-flow directions in the saprolite and fill, June 2018. Groundwater levels and contours are in feet. Figure from Fiore and Lacombe (2020). VOC, volatile organic compound, PFAS, per- and polyfluoroalkyl substances; NAVD 88, North American Vertical Datum of 1988.
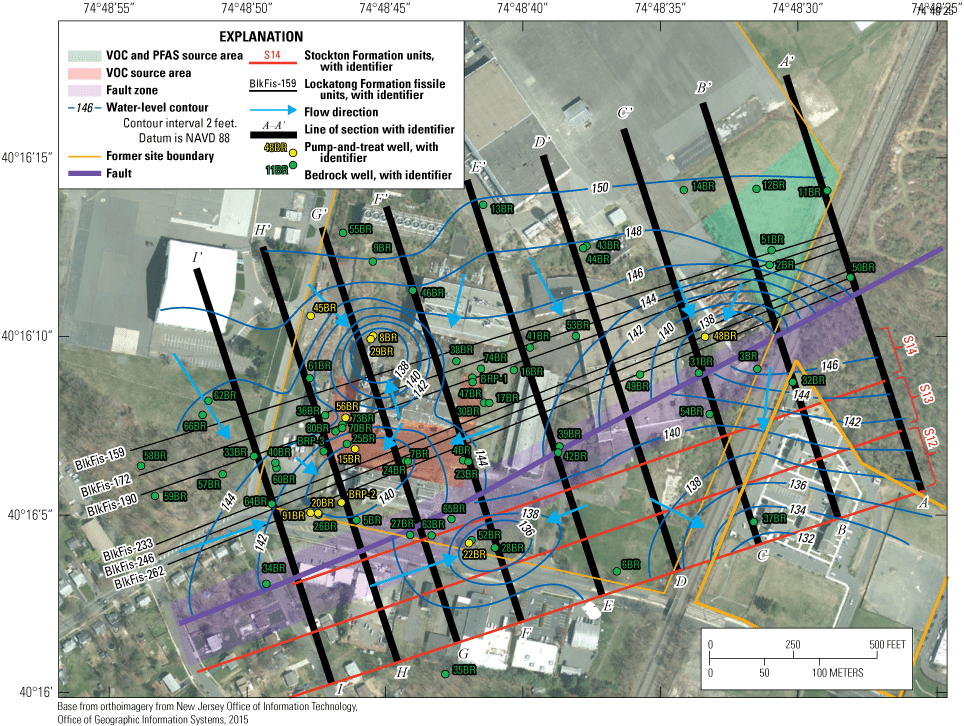
Generalized water-level potentiometric-surface contours and generalized groundwater-flow directions in fractured bedrock at an altitude of approximately 100 feet above the North American Vertical Datum of 1988 (NAVD 88), June 2018. Potentiometric contours are in feet. Figure from Fiore and Lacombe (2020). VOC, volatile organic compound, PFAS, per- and polyfluoroalkyl substances.
Reference Cited
Fiore, A.R., and Lacombe, P.J., 2020, Groundwater levels and generalized potentiometric surfaces, former Naval Air Warfare Center, West Trenton, New Jersey, 2018: U.S. Geological Survey Open-File Report 2020–1016, 28 p., accessed November 24, 2021, at https://doi.org/10.3133/ofr20201016.
Appendix 2. Locations, Construction, and Sampling Frequency of Wells at the Former Naval Air Warfare Center, West Trenton, New Jersey
Table 2.1.
Summary of locations, construction, and sampling frequency of wells at the former Naval Air Warfare Center, West Trenton, New Jersey.[NE, northeast; NW, northwest; SE, southeast; SW, southwest; NJDEP, New Jersey Department of Environmental Protection; NWIS, U.S. Geological Survey National Water Information System database1; ft, feet; VOCs, volatile organic compounds; -- not available or not applicable; gray shaded well identifiers were sampled using passive diffusion techniques]
Reference Cited
U.S. Geological Survey, 2023, USGS water data for the Nation: U.S. Geological Survey National Water Information System database, accessed March 14, 2023, at https://doi.org/10.5066/F7P55KJN/.
Appendix 3. Volatile Organic Compounds and Per- and Polyfluoroalkyl Substances Concentrations Measured in Wells in 2018; Changes in Concentrations of TCE, cisDCE, and VC in Wells Between 2018 Samples and the Most Recent Prior Sample Analyzed; and the Overall Trend of Concentration Changes at the Former Naval Air Warfare Center, West Trenton, New Jersey
Table 3.1.
Volatile organic compounds and per- and polyfluoroalkyl substances concentrations measured in wells in 2018; changes in concentrations of TCE, cisDCE, and VC in wells between 2018 samples and the most recent prior sample analyzed; and the overall trend of concentration changes at the former Naval Air Warfare Center, West Trenton, New Jersey. Data available in Fiore and Imbrigiotta (2021).[NE, northeast; NW, northwest; SE, southeast; SW, southwest; TCE, trichloroethene; cisDCE, cis-1,2-dichloroethene, VC, vinyl chloride; PFBS perfluorobutane sulfonate; PFNA, perfluorononanoic acid; PFOA, perfluorooctanoic acid; PFOS, perfluorooctane sulfonate; μg/L, micrograms per liter; ng/L, nanograms per liter; WDW, West Ditch well; --, not a duplicate sample; DUP, duplicate sample; MW, monitoring well; EW, pump-and-treat extraction well; RW, reserve extraction well; RE, research well; U, concentration less than indicated method reporting level; J, estimated value, concentration less that lowest standard; NS, not sampled; NA, not applicable; +, concentration increased; - concentration decreased; 0, no change in concentration and (or) change cannot be determined; NJDEP; New Jersey Department of Environmental Protection; MCL, maximum contaminant level]
Reference Cited
Fiore, A.R., and Imbrigiotta, T.E., 2021, Concentrations of chlorinated volatile organic compounds and per- and polyfluoroalkyl substances in groundwater and surface water, former Naval Air Warfare Center, West Trenton, New Jersey: U.S. Geological Survey data release, accessed November 24, 2021, at https://doi.org/10.5066/P9RCAQ5N.
Appendix 4. Concentrations and Fluxes of Volatile Organic Compounds and Per- and Polyfluoroalkyl Substances in Storm-Sewer Lines and Springs Associated with the Former Naval Air Warfare Center, West Trenton, New Jersey, 2018
Table 4.1.
Concentrations and fluxes of volatile organic compounds and per- and polyfluoroalkyl substances in storm-sewer lines and springs associated with the former Naval Air Warfare Center, West Trenton, New Jersey.[NWIS, National Water Information System; L/s, liters per second; µg/L, micrograms per liter; µg/s, micrograms per second; ng/L, nanograms per liter; ng/s nanograms per second; NA, not available; g/d, grams per day; mg/d, milligrams per day; GR-OF, Gold Run Outfall; WDin, West Ditch Oil/Water Separator-In; WDspring, West Ditch Spring; J, estimated concentration; U, concentration less than indicated method detection level; TCE, trichloroethene; cisDCE, cis-1,2-dichloroethene; VC, vinyl chloride; PFOS, perfluorooctane sulfonate; PFOA, perfluorooctanoic acid; PFNA, perfluorononanoic acid; Dup, duplicate; Feb., February; Aug., August; Dec., December; <, less than]
Manholes may contain up to three pipes. Pipes with a local name ending with -N enter the manhole from the north. Pipes ending with -T enter from the west and exit to the east.
Flow data are rounded to two significant figures. Data in NWIS are available in units of cubic feet per second.
Interceptor is a perforated pipe buried horizontally below land surface. Despite being categorized as a surface water site (Koman Government Solutions, 2018), the Interceptor actually collects groundwater. Therefore, concentration values from the Interceptor were not considered for this maximum.
References Cited
U.S. Geological Survey, 2023, USGS water data for the Nation: U.S. Geological Survey National Water Information System database, accessed March 14, 2023, at https://doi.org/10.5066/F7P55KJN/.
Conversion Factors
Datum
Vertical coordinate information is referenced to the North American Vertical Datum of 1988 (NAVD 88).
Horizontal coordinate information is referenced to the North American Datum of 1983 (NAD 83).
Altitude, as used in this report, refers to distance above the vertical datum.
Concentrations of chemical constituents in water are given in either milligrams per liter (mg/L), micrograms per liter (µg/L), or nanograms per liter (ng/L).
Abbreviations
AFFF
aqueous film-forming foam
BR
bedrock well
cisDCE
cis-1,2-dichloroethene
DNAPL
dense non-aqueous phase liquid
DoD
U.S. Department of Defense
DWQI
Drinking Water Quality Institute
EPA
U.S. Environmental Protection Agency
ESO
emulsified soybean oil
ft
feet
g/d
grams per day
gal
gallon
GIS
geographic information system
>
greater than
HAL
health advisory limit
<
less than
lpm
liters per minute
MCL
drinking water maximum contaminant level
MDL
method detection limit
MW
monitoring well
µg/L
micrograms per liter
mg/d
milligrams per day
mg/L
milligrams per liter
NJDEP
New Jersey Department of Environmental Protection
ng/L
nanograms per liter
NAWC
Naval Air Warfare Center
PFAS
per- and polyfluoroalkyl substances
PFBS
perfluorobutane sulfonate
PFNA
perfluorononanoic acid
PFOS
perfluorooctane sulfonate
PFOA
perfluorooctanoic acid
RCDM
regenerated cellulose dialysis membrane
S
shallow well
SAP
sampling and analysis plan
SWQS
Surface Water Quality Standard
TCE
trichloroethene
USGS
U.S. Geological Survey
VC
vinyl chloride
VOC
volatile organic compound
For more information about this publication, contact:
Director, New Jersey Water Science Center
3450 Princeton Pike, Suite 110
Lawrenceville, NJ, 08648
For additional information, visit: https://www.usgs.gov/centers/new-jersey-water-science-center
Publishing support provided by the West Trenton Publishing Service Center
Disclaimers
Any use of trade, firm, or product names is for descriptive purposes only and does not imply endorsement by the U.S. Government.
Although this information product, for the most part, is in the public domain, it also may contain copyrighted materials as noted in the text. Permission to reproduce copyrighted items must be secured from the copyright owner.
Suggested Citation
Fiore, A.R., Imbrigiotta, T.E., and Wilson, T.P., 2023, Distribution of chlorinated volatile organic compounds and per- and polyfluoroalkyl substances in groundwater and surface water at the former Naval Air Warfare Center, West Trenton, New Jersey, 2018: U.S. Geological Survey Open-File Report 2023–1022, 81 p., https://doi.org/10.3133/ofr20231022.
ISSN: 2331-1258 (online)
Study Area
| Publication type | Report |
|---|---|
| Publication Subtype | USGS Numbered Series |
| Title | Distribution of chlorinated volatile organic compounds and per- and polyfluoroalkyl substances in groundwater and surface water at the former Naval Air Warfare Center, West Trenton, New Jersey, 2018 |
| Series title | Open-File Report |
| Series number | 2023-1022 |
| DOI | 10.3133/ofr20231022 |
| Publication Date | June 05, 2023 |
| Year Published | 2023 |
| Language | English |
| Publisher | U.S. Geological Survey |
| Publisher location | Reston, VA |
| Contributing office(s) | New Jersey Water Science Center |
| Description | Report: ix, 81 p.; Data Release |
| Country | United States |
| State | New Jersey |
| City | West Trenton |
| Other Geospatial | former Naval Air Warfare Center |
| Online Only (Y/N) | Y |
| Additional Online Files (Y/N) | N |