

User Needs Assessment for Postfire Debris-Flow Inundation Hazard Products
Links
- Document: Report (1.11 MB pdf) , HTML , XML
- Download citation as: RIS | Dublin Core
Acknowledgments
The authors thank all study participants for taking the time to share their perspectives. In addition, we thank the following individuals for their input and guidance on the study conceptualization, implementation, text, or multiple: Jeremy Lancaster of the California Geological Survey; and Jason Kean, Dennis Staley, Francis Rengers, Matthew Thomas, Ryan Jones, Jaime Kostelnik, Kris Ludwig, Dave Ramsey, Emily Brooks, and Amanda Cravens of the U.S. Geological Survey (USGS). Ann Youberg, Stephen Slaughter, and Amanda Stoltz provided constructive reviews which improved the clarity and content of the report. Additionally, we thank the USGS Risk Community of Practice for guidance and for partial financial support of this project through a seed grant.
Abstract
Debris flows are a type of mass movement that is more likely after wildfires, and while existing hazard assessments evaluate the rainfall intensities that are likely to trigger debris flows, no operational hazard assessment exists for identifying the areas where they will run out after initiation. Fifteen participants who work in a wide range of job functions associated with southern California postfire hazards were selected using purposive sampling for unstructured interviews about useful characteristics and needs for postfire debris-flow inundation hazard assessments. The interview guide was developed by a team of social and physical scientists following best practices for engaging with users. The guide focused on target information that could influence ongoing or not-yet-initiated research on debris-flow physics and hazard assessment methodology. Following standard methods for user needs assessment, the audio from the unstructured interviews was recorded, transcribed, and analyzed using a thematic coding scheme. Participants reported engaging with postfire debris-flow inundation as one of multiple postfire hazards and their information needs reflect this breadth. Most participants were from organizations with life and property mandates, and this focused their concerns on where debris-flow inundation could impact people’s physical safety, the ability of populations to egress, and damage to property. Common comments included, (1) the need to interpret inundation hazard assessments in the context of forecast rainfall—which are typically associated with different timeframes, 15 and 60 minutes, respectively; (2) the need to provide multiple scenarios in a hazard assessment to show how the hazard changes under different external factors such as varying rainfall intensity; and (3) the tension between fully reflecting all sources of uncertainty in identifying impacted areas and a high level of precision needed to determine evacuation zones in order to reduce evacuation fatigue. Participants saw utility in both low-resolution hazard assessments over large areas and fine-resolution targeted assessments over small areas, noting that the identification of target areas could pose an ethical challenge because some areas might be prioritized over others. Participants were concerned about the hazard posed by the continuum of postfire hydrologic hazards, including hyperconcentrated flows. Finally, participants recognized that the shrinking time window between the end of fire season and the start of the wet season in southern California makes the production, interpretation, and use of rapid postfire debris-flow inundation hazard assessments both important and challenging.
Introduction and Motivation
Debris flows are water-laden slurries of sediment and rock. When debris flows exit their steep upland source basins and run out onto urbanized fans or floodplains, they are a hazard to human life, infrastructure, and property (Dowling and Santi, 2014). Wildfire exacerbates this hazard by modifying the hydrologic properties of the soil in the debris-flow initiation zone, commonly increasing surface-water runoff generation, erosion and mobilization of sediment, and consequently, debris-flow sediment volumes. Over the last century, debris-flow events that damaged at least 40 structures occurred in southern California on average every 13 years (Kean and Staley, 2021, table 1). Since the year 2000, these events include the 2003 Christmas Day Storm following the 2003 Old and Grand Prix Fires (Chong and others, 2004; Bernard, 2007; Cannon and others, 2008), the 2010 La Cañada-Flintridge event following the 2009 Station Fire (Lin and others, 2010; Kean and others, 2012), and the January 9, 2018, Montecito, California event following the 2017 Thomas Fire (Oakley and others, 2018; Kean and others, 2019; Lukashov and others, 2019; Lancaster and others, 2021). In the most recent major event in Montecito, California, a 100-year precipitation storm over the still-burning Thomas Fire, and the debris-flow inundation resulted in 23 deaths, at least 167 injured, and 408 damaged homes (fig. 1; Kean and others, 2019; Lukashov and others, 2019; Lancaster and others, 2021).
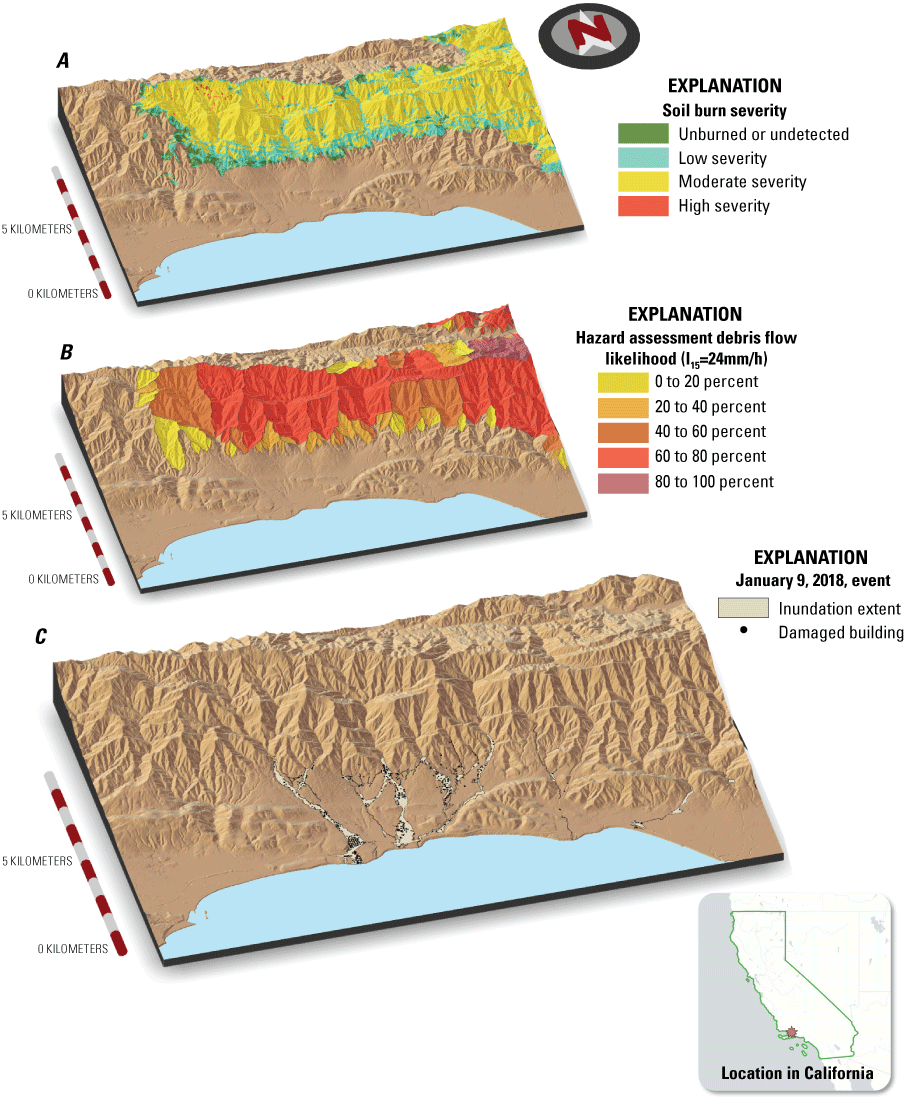
A, soil burn severity for a portion of the 2017 Thomas Fire used as input to the current hazard assessment product for postfire debris flows; B, debris-flow likelihood in percent (%) from a pre-event hazard assessment that used a 15-minute rainfall intensity (I15) of 24 millimeters per hour (mm/h); and, C, a map of inundation and damage that occurred on January 9, 2018, in Montecito, California.
The U.S. Geological Survey (USGS) currently provides hazard assessments of debris-flow likelihood and debris-flow volume across a burned area given its soil and steepness characteristics, and the magnitude of a design rainstorm (Cannon and others, 2010; Staley and others, 2017; https://landslides.usgs.gov/hazards/postfire_debrisflow/). Systematic dissemination of these hazard assessments is an outgrowth of recommendations from the National Oceanic and Atmospheric Administration (NOAA) USGS Task Force (NOAA-USGS Debris Flow Task Force, 2005). At the request of Federal, State, or Local agencies, or any private organization, the USGS calculates and distributes a likelihood hazard assessment for tens of fires (for calendar year 2021, 66 assessments totaling over 18,000 square kilometers were produced).
The hazard assessments are used by a diverse array of stakeholders to address a variety of needs. For example, U.S. Forest Service Burned Area Emergency Response (BAER) teams and California Watershed Emergency Response Teams (WERT) use the results to help identify values-at-risk to debris-flow impacts, such as roads, homes and structures, culverts, and cultural resources (for example: BAER, 2018; WERT, 2018). The National Weather Service use the estimated rainfall thresholds from the hazard assessments to issue watches and warnings in advance of rainstorms that may impact the burn area. Watches and warnings can, in turn, be used by transportation departments to perform road safety closures (for example, Kostelnik and others, 2021) and by county agencies to issue evacuation orders or mobilize emergency response personnel (for example, County of Santa Barbara Office of Emergency Management, 2018). However, despite these utilities, the current hazard assessments do not provide information about the debris-flow runout path or which areas may be exposed to inundation and damage by debris flows (fig. 1). This information is critical to better identifying postfire risk and developing robust emergency response and evacuation plans.
The USGS has experience constructing hazard assessments focused on the runout of volcanic lahars using the LaharZ model (Scott and others, 2000) but less work has been done on assessing potential inundation for postfire debris flows. In one instance, LaharZ was used to enhance postfire hazard assessments of debris-flow likelihood and volume with estimates of potential inundation (Cannon and others, 2009, for the Station Fire in the San Gabriel Mountains). A well-tested and operationalized approach for constructing postfire debris-flow inundation hazard assessments does not yet exist (see section “How Far?”). Current research is evaluating the capability of existing debris-flow runout models to simulate postfire debris-flow inundation (for example, Bessette-Kirton and others, 2019; Barnhart and others, 2021). Should it be possible to generate hazard assessments that include information about which areas are likely to be inundated under a suite of scenarios, such a product may have a wide user base. Potential users of postfire debris-flow inundation hazard assessments may include professional decision makers and interested members of the public (see the description of possible users for USGS information products in Ludwig and others, 2018, fig. 3). We expect that certain professional decision makers may regularly interact with this type of information. Examples of this type of user include: Nation Weather Service Warning Coordination Meteorologists, National Forest Service BAER team members, county geologists and floodplain managers, and emergency management professionals.
Because postfire debris-flow inundation hazard assessment products are currently unavailable, the details of the form, dissemination mechanism, user interface, and visualization specifics of a potential product are undetermined. A postfire debris-flow inundation hazard assessment is likely a map indicating areas downslope of a fire that may be impacted by one or more scenarios. However, because the specific details of both the content and the user interface of the potential product are undetermined, we will generically refer to it as a postfire debris-flow inundation hazard assessment. Such a product is distinguished from the existing hazard assessments (estimating debris-flow likelihood, volume, and rainfall thresholds) in the inclusion of inundation information.
Approach and Intended Audience
The purpose of the research was to conduct a user needs assessment of the professional decision makers in southern California that we expect would use and benefit from a postfire debris-flow inundation hazard assessment, should it be possible to generate such a product. A user needs assessment is a type of user engagement in which users are asked to provide input and guidance, often in the planning phase of a project. Ongoing, active research on the scientific capabilities of debris-flow models makes conducting a user needs assessment a timely choice as results from the assessment may help guide future research. For example, it may provide direction for developing a robust methodology for producing inundation-focused hazard assessments and identifying high-priority areas for improved understanding of debris-flow physics. Additionally, engaging early with potential users follows the best practice of usability science and the co-production of scientific information (see section “Methods”). Our restricted geographic scope for selecting participants may mean that the results of this study do not translate to other geographic areas; however, we chose this scope because southern California has the greatest incidence of postfire debris flows and thus participants have the most experience. Notably, while the intention of the user needs assessment was to understand user needs related to a specific product—a postfire debris-flow inundation hazard assessment—participants provided answers related to a wide range of postfire hazard analyses including debris-flow triggering rainfall or postfire hydrologic recovery.
The intended audience for this report is research scientists and engineers tasked with improving the capabilities of a postfire debris-flow inundation hazard assessment. In conducting and synthesizing this user needs assessment we intended to provide this audience with information about user needs to support them in designing and implementing their research. A secondary audience is professionals who interact with postfire hazards as part of their work. Accordingly, this report is written for an audience with experience in debris-flow hazards.
Origin of this Study
Because the scientific basis for a potential postfire debris-flow inundation product is an area of active research, the authors determined that it was an appropriate time in the research cycle to engage with potential users. This was because the core research necessary to underpin such an inundation hazard assessment has not been completed and user input can still be incorporated into the design of additional research studies. As specific details of a postfire debris-flow inundation product do not yet exist, the study design attempted to solicit user feedback on the general capacity of a potential product, rather than specific feedback regarding user interface and usability.
Katherine Barnhart, author of this report, is actively engaging in physical science research regarding debris-flow inundation (Barnhart and others, 2021), but lacked the necessary knowledge to follow best practices for usability studies and formally engage with users through standard social science methodologies such as the unstructured interview employed here. To that end, Barnhart engaged with authors Katherine Clifford and Veronica Romero, funded in part by the USGS Risk Community of Practice. Clifford and Romero provided expertise in study design and methods and Romero conducted and analyzed interviews.
This project represents a combination of physical and social science. The research was designed around a physical science problem and goal: to improve the core content of a potential postfire debris-flow inundation hazard assessment. However, the project employed social science methods (unstructured interviews to collect qualitative data and thematic analysis) to inform the design of ongoing physical science research. This combination allowed for findings that could shape the scientific choices made by scientists that have important consequences for the type of information generated (King and Tadaki, 2018). We note that this project, while using social science methods, did not attempt to ask or answer social science questions, and instead served to enhance the physical science.
In the remainder of this report we describe the current state of science underpinning postfire debris-flow hazards; how this contribution connects to the USGS Plan for Risk Research and Applications (hereafter, the “USGS Risk Plan”; Ludwig and others, 2018), and define key terms; provide background on coproduction and usable science; describe the methodology used to conduct the user needs assessment, including participant selection; and present our results. We conclude with the implications of the user needs assessment for product development and discuss methodological lessons learned from this study.
Elements of Postfire Debris-Flow Hazards
Debris flows are a complex geophysical phenomenon (Iverson, 1997). They are a mass of poorly sorted water, sediment, and other debris that travel down slope. Debris flows often contain coarse, high sediment concentration fronts and lower sediment concentration “watery tails.” In southern California and other semi-arid postfire settings, they typically initiate after high-intensity rain and within four years of a fire (for example, Santi and Rengers, 2022). Fire also impacts other characteristics of watershed response to rainfall, increasing the frequency and size of clear water flows and sediment laden or hyperconcentrated flows (for example, Moody and others, 2013). Such flows are less destructive than debris flows, but still pose a hazard after fire. Most practitioners who manage postfire hazards are concerned with the full spectrum of hydrologic response, from clear water flows to debris flows.
A postfire hazard assessment provides information about one or more aspects of the physical hazard posed by a debris flow after a fire assuming one or more hypothetical meteorological events, or design storms. A hazard assessment may provide results in a spatially distributed manner, depicting areas that are likely to be inundated given a design storm, or may provide synthesized information such as the fire-wide rainfall threshold described in section “Dissemination and Synthesis of Current Hazard Assessments.”
Inundation is only one of many debris-flow characteristics for which a hazard assessment may prove useful for users (fig. 2). In this section, we describe how the most essential aspects of this hazard are currently simulated. Past research was focused on the first three aspects (when and where will a postfire debris flow occur, and how big will it be). For each aspect, we summarize the current state of knowledge for all elements of the hazard to provide context for the information targeted in the user needs assessment and the answers provided by users.
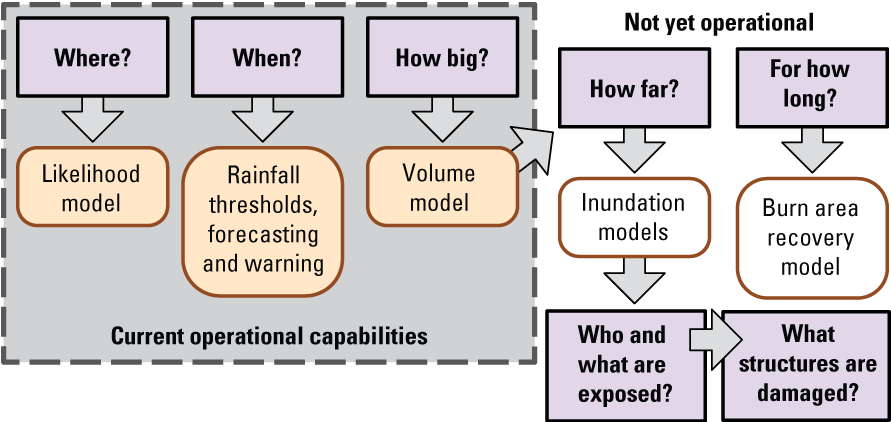
Conceptual schematic describing the relationship between core elements of postfire debris-flow hazards. Not all hazards are shown. Each model requires a variety of input data, none of which are shown.
Where and When?
Early hazard assessments to determine where and when a postfire debris flow might occur considered debris-flow susceptibility as a function of basin characteristics and the rainfall that initiates a debris flow, and were generally regionally specific and subjective (Cannon and others, 2009). Development of the hazard assessment methodologies relied on research into postfire debris-flow processes (for example, Cannon and others, 1995;1998) and the hazard assessment methodology has evolved based on subsequent research (for example, Kean, Staley and Cannon, 2011; Gartner, Cannon, and Santi, 2014). Starting in 2002 with the Coal Seam and Missionary Ridge fires, emergency assessments of peak debris-flow discharge were generated and delivered as USGS Open-File Reports (Cannon and others, 2002a; 2002b). Evaluation of the probability of debris-flow activity was added in 2003 (Cannon and others, 2003) after the development of an initial predictive model (Rupert and others, 2003). Finally, peak debris-flow discharge estimates were replaced with estimates of debris-flow volume in 2008 after the development of an initial predictive model for volume (Cannon and others, 2007; Gartner and others, 2008).
Evaluation of when debris flows occur relies on rainfall intensity-duration thresholds, which demarcate the boundary on a graph of rainfall intensity against rainfall duration above which a debris-flow event is likely to initiate. Rainfall intensity-duration thresholds are used extensively in mass movement studies outside of the postfire setting (for example, Baum and Godt, 2010). Determining rainfall intensity-duration thresholds requires collecting high temporal-resolution observations of rainfall and mass movement event occurrence (for example, Cannon and others, 2008; Cannon and others, 2011; Kean and others, 2011). In contrast with unburned areas, in recently burned areas the antecedent moisture conditions are an insignificant factor in the propensity for debris-flow initiation (for example, Cannon and others, 2008; Schmidt and others, 2011). In these burned watersheds, the significant predictive factor is whether short (less than or equal to 30 minutes) duration rainfall intensities exceed an initiation or “triggering” threshold (Cannon and Gartner, 2005; Kean and others, 2011; Staley and others, 2013).
Staley and others (2017) established the current method, combining susceptibility and likelihood conditional on rainfall, in an objective, non-regional way, thereby generating a framework by which triggering thresholds are identified. The current method for calculating debris-flow initiation likelihood uses the 15-minute rainfall intensity (I15, or the average rainfall rate sustained over 15 minutes) and characteristics of the burned watershed (Staley and others, 2013; Staley and others, 2017). The choice of I15 reflects a combination of training data availability and observations of the debris-flow initiation process. High-temporal resolution monitoring of rainfall and debris-flow timing documents near-zero lag time between high intensity rainfall and debris-flow occurrence (Kean and others, 2011). This monitoring showed temporal correlations between rainfall and debris-flow initiation between 5- and 30-minutes and identified I15 as best correlated with debris-flow generation (Kean and others, 2011; Kean and others, 2012; Staley and others, 2013).
More recent work developing rainfall thresholds based on a non-dimensionalized version of discharge provides a possible path forward for process-based threshold delineation but requires site-specific information like median grain size that may be difficult to define in rapid-response contexts or for geologically heterogeneous watersheds (for example, Tang and others, 2019).
The traditional methods for determining rainfall thresholds are empirical and thus limited in application to the scope of the training data. The relative paucity of postfire debris-flow events beyond two years postfire mean that the existing thresholds are only relevant for the first few years after fire. Recent work using a simulation-based method may be able to extend the timeframe for rainfall threshold estimation into locations with fewer observations and beyond the second year after a fire (Thomas and others, 2021).
How Big?
The current method for estimating the size of postfire debris flows relies on observations of sediment volume mobilized in individual events. The resulting empirical model, which requires measurement of debris-flow deposit volume for individual events, relates debris-flow volume with burned basin characteristics and I15 rainfall intensity for application in southern California (Gartner and others, 2014). The present relationship predicts the natural logarithm of volume and has a standard error of 1.04. This implies an order of magnitude 95 percent prediction confidence interval, meaning that there is 95 percent probability that the volume will be between 13 percent and 770 percent of the expected value. This large uncertainty in the prediction confidence interval derives from multiple factors, including large error in the measured deposit volumes.
Dissemination and Synthesis of Current Hazard Assessments
In 2014, many aspects of hazard assessment calculations were automated, and dissemination moved to an online geographic information system (GIS) webpage. This allowed users to download hazard assessment information as GIS files that can be readily used for planning. Each hazard assessment results in the calculation of debris-flow likelihood and debris-flow volume, given a specified rainfall scenario, for each watershed and all channel segments within a burn perimeter under 8 square kilometers. The hazard assessment results are either depicted as polygons covering each watershed or polylines following the stream network, with each feature colored based on debris-flow probability or size. For each fire, the spatially distributed results are synthesized into a whole-fire rainfall threshold. This whole-fire or “triggering” threshold is the best estimate of the rainfall intensity that has a 50 percent probability of triggering a debris flow in the first year after a fire. It is calculated by taking the median across the stream network of the rainfall intensity value associated with a 50 percent probability of triggering a debris flow.
How Far?
Forecasting the extent of debris-flow inundation requires knowing how much material will be mobilized and routing that material from debris-flow initiation zones until it comes to rest. As described in the prior section, estimating the size of postfire debris flows carries large uncertainty bounds. Multiple options exist for routing the runout of debris flows to identify potential inundation zones, presuming the initial conditions of the simulated scenario are specified (McDougall, 2017). While multiple models exist, none of them implement an agreed-upon method for representing debris-flow routing across a topography because there is no agreed-upon standard for representing the internal dynamics of debris flows. Models include empirical approaches (LaharZ; Iverson and others, 1998; Schilling, 1998), cellular automaton or reduced complexity (FlowR and ProDF; Horton and others, 2013; Gorr and others, 2022), and depth-averaged numerical approaches (RAMMS, DAN3D, HEC-RAS, FLO-2D, r.avaflow, or D-Claw; O’Brien and others, 1993; Christen and others, 2010; George and Iverson, 2014; Iverson and George, 2014; Mergili and others, 2017; Gibson and others, 2021). The study of Cannon and others (2010) represents an early application of LaharZ to the Station Fire, while Bessette-Kirton and others (2019) and Barnhart and others (2021) are evaluations of multiple models in the context of the 2018 Montecito event.
In addition to the absence of a standard model for representing debris-flow dynamics, there is no established method for specifying the initial conditions of a simulated scenario. Presuming a rainfall scenario can be linked with a debris-flow volume, the task of determining how and from where that volume begins to move remains. Two common options are an “inflow hydrograph” in which a discharge-time relationship is specified at a watershed outlet or fan apex, and a “block release” in which the material is allowed to move from a specified location within the watershed. Neither of these approaches represents the typical mechanism of postfire debris-flow initiation such as sheetwash, raindrop-driven detachment, rilling, and entrainment of channel material. Whether and to what extent these details may impact the simulated inundation extent in postfire debris-flow simulations is not well constrained. If an inflow hydrograph is used, some information must be leveraged to determine its functional form. Other potential approaches include the results of rainfall-runoff analysis (for example, Rengers and others, 2019) and scaling relationships between total volume and peak discharge (for example, Rickenmann, 1999). Additionally, entrainment of sediment along the debris-flow path presents a substantial volume source with poorly constrained physics.
Depending on the model used, a different set of inundation attributes (extent, depth, and velocity being the most common) may be simulated, exported, and summarized into time-invariant quantities such as maximum depth. These attributes are hierarchical, in that all models that simulate depth also simulate extent. Finally, we note that the paucity of data on event-scale curtails the ability to evaluate this aspect of model evaluation. Spatially distributed measurements of maximum flow depth may exist for well-studied events (this type of dataset is provided by Kean and others [2019] for the Montecito event), but equivalent datasets of velocity are rarely available due to the difficulty of reliably inferring velocity after an event (methods include using flow superelevation around bends or runup on obstacles).
Connection with the USGS Risk Plan
The USGS Risk Plan synthesized the current state of USGS risk research and products, initiated a community of practice, and made recommendations for best practices for USGS staff engaging in risk research and applications (Ludwig and others, 2018, see the next section for definitions of key terms). The USGS Risk Plan recommended that risk product development efforts incorporate “collaboration with partners from the beginning of research and product development through * * * product evaluation” (Ludwig and others, 2018, p. 1). One example, conceptualization of risk reduction, is shown in figure 3A, articulating the iterative interactions between USGS activities and responsibilities, external responsibilities, and shared responsibilities. Stakeholder engagement occurs throughout the cycle of risk reduction, and at different points in the cycle the nature of this engagement is different. Engaging to understand needs about information content, as is done here, would require a different set of activities than engaging to support use or to refine an existing product. A core element of the risk reduction process is the generation of usable information (the conceptualization for this process is shown in figure 3B). The generation of usable information is itself an iterative process with many elements, including determination of the content provided and how the information is provided (for example, visualization choices in the user interface). Inspired by the USGS Risk Plan and the state of research on knowledge coproduction summarized in the next section, this study was envisioned as the first step in an iterative cycle of knowledge co-production and participatory design (for example, NOAA-USGS Debris Flow Task Force, 2005). On its own, however, this study represents an example of consultation (Bamzai-Dodson and others, 2021).
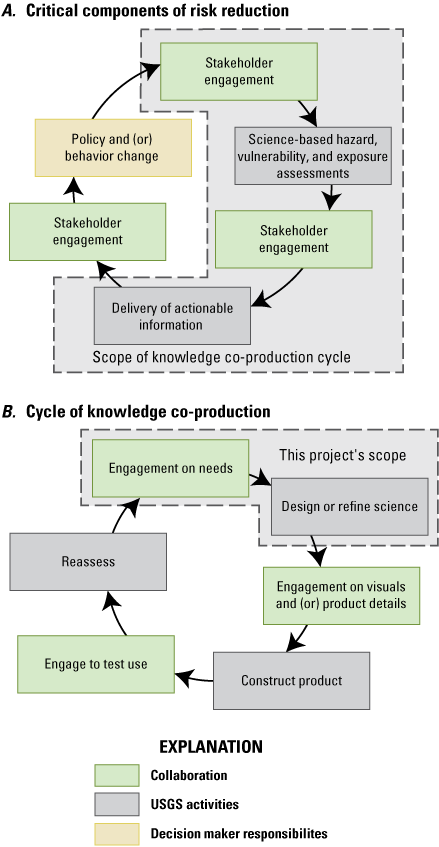
The scope of presented work within the, A, critical components of risk reduction and, B, the cycle of knowledge co-production.
Key Terms
Risk research and applications support decision makers and communities to make decisions about the individuals, populations, or systems that a hazard may impact. The distinctions between hazard, vulnerability, and risk are important for understanding what information is necessary to provide distinct information products (a hazard assessment as compared with an exposure assessment). Accordingly, we define key terms here, quoting heavily from the definitions provided in the text and glossary of the USGS Risk Plan (Ludwig and others, 2018). Note that the term “risk research and applications” encompasses research and applications spanning hazard to risk.
A “hazard” is a dangerous, “process, phenomenon, substance, activity, or condition that may cause loss of life, injury or other health impacts, property damage, loss of livelihoods and services, social and economic disruption, or environmental damage” (Ludwig and others, 2018, p. 51). Accordingly, “hazard assessments” include
* * * efforts to characterize and delineate areas and (or) times where adverse physical events may occur and the specific characteristics of those events. Hazard assessments support risk reduction efforts because of their use for actionable outreach, preparedness efforts, emergency response and mitigation planning, and other activities. Important hazard attributes for decision makers include spatial extent, speed of onset, duration, magnitude, the potential for pre-event warnings, and post-event recovery considerations. (Ludwig and others, 2018, p. 8)
“Forecasts and warnings” build off hazard assessments or similar information by integrating initial or boundary conditions. This type of information is often used for situational awareness or to direct human behavior.
Types of Vulnerability as defined by Ludwig and others (2018, p. 51).
Exposure is, “the presence of people, livelihoods, species or ecosystems, environmental functions, services, infrastructure, or other assets (for example, economic, social, or cultural resources) in places that could be adversely affected.”
Sensitivity is, “the personal or situational conditions that influence the degree to which an individual, group, system, or species may be affected by a hazard.”
Adaptive capacity is, “the ability of systems, institutions, humans, and other organisms to adjust to potential damage, to take advantage of opportunities, or to respond to imminent threats.”
“Vulnerability” is, “the combination of physical, social, cultural, economic, historical, and political components that influence the degree to which an individual, community, or system is susceptible to damaging effects of a hazard * * *. [C]ommon elements within the hazards literature include concepts of exposure, sensitivity, and adaptive capacity” (Ludwig and others, 2018, p. 51).
Thus, vulnerability assessments move beyond hazard assessments and report, “the exposure, sensitivity, and adaptive capacity of individuals or systems to adverse events. Vulnerability assessments focus not only on what is threatened by an adverse event, but also on why and how individuals or systems may be affected, and in some cases describe the societal forces that contribute to these vulnerabilities” (Ludwig and others, 2018, p. 4). Vulnerability assessments do not typically assign absolute likelihoods to the occurrence of an adverse event.
Finally, “risk” is, “the potential for consequences where something of value is at stake and where the outcome is uncertain, recognizing the diversity of values. Risk sometimes is represented quantitatively as probability of occurrence of hazardous events multiplied by the [consequences] if these events occur. Risk results from the interaction of hazards and a vulnerable asset or system” (Ludwig and others, 2018, p. 51).
Methods
Scholars have studied what elements of the scientific process result in research outcomes that are usable and actionable by stakeholders and decision makers (McNie, 2007; Dilling and Lemos, 2011; Beier and others, 2017; Wall and others, 2017). A common, yet incorrect, assumption is that high quality, available science will inherently be used—this is commonly referred to as the loading dock model in which researchers only interact with intended users to share their findings (Cash and others, 2006). In contrast to the loading dock model, usable science must be considered salient, credible, and legitimate by the user or decision maker (Cash and others, 2003). In this context, salience refers to the relevance and importance of the information to the decision needs, credibility refers to robustness of the scientific evidence and practices, and legitimacy refers to beliefs that the scientists and scientific process was unbiased, transparent, and inclusive. Usability research centers on the needs and perspectives of the user, rather than of the producer of scientific information. Accordingly, the same information may be considered usable to some and not usable to others and a scientist may need to clarify for whom and for what purpose their science is usable because of inherent tradeoffs between user needs.
Approaches to user engagement in the scientific process can take many forms and there is no single approach that works for all use cases. Bamzai-Dodson and others (2021) describe a range of participation approaches that span from the scientist informing users (the loading dock approach) to empowering users (participatory design). The work presented here would be classified as the scientist consulting with the users. Bamzai-Dodson and others (2021) emphasize that each form of participation is suited for different topics and timeframes. For example, emergency rapid response may not have sufficiently long timeframes to support extensive user engagement and the informing approach may be the only feasible option.
This user needs assessment used qualitative data collected in unstructured interviews (a qualitative research method described by Zhang and Wildemuth, 2016) conducted by Romero following an interview guide. Interview audio recordings were transcribed to yield a dataset of participant quotes. The data were qualitatively coded in NVivo (Qualitative Research Software International Pty Ltd., 2020) using thematic coding schemes, which was then used to identify trends within qualitative data that could shape ongoing research.
Interview Guide
The interview guide was developed iteratively by the entire research team to ensure questions and discussion topics focused on important choices made in the scientific process and variables that influence postfire debris-flow research. Unstructured interviews provided a flexible method suited to user needs assessments because they allow for unexpected information and give more agency to the participant to help shape the discussion and determine what themes are important. Less structured interactions can be more conversational and are well-suited for understanding a new area of inquiry and one with many intersecting influences (Creswell and Creswell, 2017). They also allow the researcher to ask follow-up questions and respond to unexpected themes that can arise during the interview (Rubin and Rubin, 2011), which are often particularly important when exploring a less studied or understood topic.
Importantly, interviews were focused on aspects of ongoing postfire debris-flow research that could be influenced or manipulated. That is, interviews focused on specific decisions about possible research direction (for instance, which spatial scales were participants most interested in) rather than a general inquiry into participant’s thoughts about postfire debris-flow inundation and scientific information that may be interesting but not end up being actionable or able to shape ongoing research.
Participant Selection and Classification
This study included 15 participants who use information about postfire debris flows as part of their jobs and would be intended users of this information. Because this project did not aim to produce representative findings, it used purposive sampling. Purposive sampling is non-random and ensures specific categories of participants are selected (Mason, 2002); ensuring that a sample of users included key user groups rather than a random one that might be missing key constituencies. This type of sampling is particularly well suited to projects that want to study experts, rather than lay people. The sample was additionally constrained by geography, focusing on participants who make decisions or support decision makers in southern California. This means that there may be limitations for generalizing findings not only arising from the small sample size, but also from the geographic factors. Users from different regions may differ in their needs and intended uses of a postfire debris-flow inundation hazard assessment.
To select potential participants, Barnhart first worked with colleagues to identify a set of possible participants (approximately 30) who could be reasonably expected to use the product. We hypothesized that different user groups might have different needs; thus, we categorized participants into four general groups spanning users with a primary function in analysis and support of decision making and those charged with implementation and management decisions. These groups were named according to the functions and responsibilities of the participants in respect to postfire hazard and emergency response efforts. We then identified a final participant set by choosing between three and four individuals from each of these four sub-groups, depending on participant availability. The four groups were: weather forecasting and warning (sample size of n=4), postfire hazard assessments (n=4), floodplain and geology (n=4), and emergency services and management (n=3). Participants spanned federal government (n=6), state government (n=2), county government (n=5), and private sector (n=2) employees.
Unstructured Interviews
Interviews were conducted by Romero between June and August 2021 and overseen by Clifford, both of whom are social scientists. To ensure that Romero and Clifford met fundamental ethical principles for human-subjects research, participants were promised confidentiality, even from team member Barnhart. Accordingly, all identifying information was removed from quotes before analysis. This decision was made by the whole research team because while the social scientists did not have professional relationships with any of the participants, Barnhart did and expected to continue to work with them. At the beginning of the interviews all participants were read the same text requesting consent to record the interview and describing what efforts would be taken to ensure confidentiality. Offering confidentiality typically improves data quality because participants can answer honestly without being worried about impacts on their professional relationships.
Transcription and Coding
All interviews were audio recorded and then transcribed by a professional transcription service. Transcripts were qualitatively coded using NVivo software. Qualitative analysis uses a rigorous, systematic process called coding (Saldaña, 2016) that identifies concepts or themes in sections of transcribed text and then assigns labels and categorizes them. The analysis presented here primarily used deductive coding methods (Guest and others, 2011), or codes that were developed before analysis takes place to analyze data for specific goals (the research direction choices identified earlier). At this phase, excerpts of anonymized transcripts were shared with Barnhart to ensure that the analysis by Romero and Clifford were not missing important, subject-specific information that required physical science expertise. This allowed Barnhart to engage with the data in a way that protected confidentiality and helped refine, steer, and further validate the analysis and ensure subtle, but important, elements were captured in the analysis. These explicit roles and types of engagement with data were important for the research team to establish early and allow for this type of cross-disciplinary collaboration.
Results
The focus of the unstructured interviews was the target information presented in table 1. However, after integrating all transcripts, additional topics emerged as consistent themes across multiple participants. We begin by describing the two most common themes (challenges and data used). We then discuss results following the structure of table 1. Throughout the results we provide example quotes from study participants. These quotes were anonymized by removing reference to specific events and locations. While we hypothesized that there would be substantial systematic differences in the stated needs of the four participant groups, we did not observe this result. Accordingly, while we note the group from which each inline quote is derived, we do not present results to compare between participant groups.
Table 1.
Target information for user needs assessment.General Findings
Challenges
Participants reported challenges in three main areas when planning and implementing hazard mitigation measures for postfire debris flows: (1) correspondence between rainfall prediction timescales and debris-flow initiation timescales, (2) limited information about fire recovery, and (3) difficulty in forecasting runout, or debris-flow inundation path.
To forecast the inundation hazard associated with postfire debris flows, inputs such as rainfall intensity and burn severity are required for inundation modeling. Because rain gages can measure rainfall over short timeframes (less than 5 minutes), analysis of debris-flow initiation has found the highest degree of correspondence between short (5–30 minute) rainfall intensities. In contrast, weather models struggle to produce useful forecasts at sub-hourly rates. Additionally, weather models have limitations that can affect their ability to forecast specific rainfall intensities over smaller geographic areas such as over a small, steep canyon. The mismatch between the rainfall intensities that trigger debris flows and those that can be forecast can challenge evacuation planning and the issuance of evacuation orders. Specifically, comparing debris-flow initiation thresholds generated by the current debris-flow hazard assessments with rainfall recurrence intervals can help with planning, but typical postfire debris-flow initiation thresholds are exceeded by frequently recurring storms (less than two years; Staley and others 2020).
Similarly, limited availability of fire recovery information for burn areas past their second-year mark contributes to uncertainty as emergency response planners are often unsure if recovering burn areas still pose a threat to nearby communities. In the following quote, a participant describes the importance of fire recovery, regional climate, and drought conditions for the persistence of debris-flow hazards after a fire:
Whereas in the Big Sur—the microclimate is just crazy. It's constantly moist. They have the marine layer; they have the coastal sea air. That soil really regenerates quickly. It recovers very quickly. You'll see sprouts on a burn scar within two months. Whereas [in other locations, the] burn scar has nothing on it. It's still very black. There are no new sprouts, and then we have our drought going on right now which means it'll likely look like that and have that significant amount of risk for the next 2 or 3–5 years. (Participant group: Emergency services and management)
The participant noted that microclimate in Big Sur results in rapid recovery of vegetation. This contrasts with areas experiencing drought conditions or areas with more arid climates. The participant indicated that for fires with little vegetation recovery, the hazard associated with postfire debris flows would persist longer than for areas with rapid vegetation recovery.
Lastly, due to limited geophysical knowledge on the behavior of debris flows in stream channels and the built environment, it remains difficult for scientists and technical experts to forecast debris-flow inundation runout paths and to advise emergency response planners on where to focus mitigation measures and delineate evacuation zones.
Data Currently Used to Make Decisions
Study participants already work with a range of different data to analyze debris flows and make decisions about emergency management. Rainfall and weather information, including weather forecasts, observed rainfall, rainfall thresholds for debris-flow initiation, historical records, and compilations of values-at-risk adjacent to burned areas are used most by supporting scientists and technical experts when making scientific determinations and when reporting to emergency response planners on debris-flow risks. Information about soil burn severity includes burned area reflectance classification maps. Information about debris-flow potential includes those communicated via BAER or WERT reports, California Geological Survey alluvial fan mapping products (WERT, 2020), debris and mudflow potential forecasts within Los Angeles County (Los Angeles County Department of Public Works, 2022), and USGS hazard assessments, are used by emergency response planners, scientists, and technical experts to identify debris-flow hazards in proximity to communities, roads, and critical infrastructure. BAER and WERT reports aid in risk analysis by providing vulnerability information about values-at-risk, such as human life and safety, cultural resources, ecological resources, infrastructure, and property, on land susceptible to postfire debris-flow hazards. Some participants use topographic (lidar, shaded relief maps), soil and geological layers in GIS mapping programs when performing risk analyses. A few participants use in-house methodologies or methodologies provided by the Army Corps of Engineers to calculate debris-flow potential or debris yield estimates. In addition to formal products and process, participants use historical records of debris flows and heuristics for debris-flow potential such as steep hillslopes.
Specific Feedback
This section of the results synthesizes participant statements in the organizational structure provided in table 1.
Desired Capabilities
We asked participants how postfire debris-flow inundation hazard assessments would support their decision-making and postfire debris-flow response and what kind of data or features a potential product might contain. Participants were encouraged to discuss data or features that may not currently be feasible either due to technological limitations or limitations in the state of postfire debris-flow science. Encouraging feedback beyond what they knew was possible allowed for a broader set of product characteristics that was not limited by what participants thought was scientifically possible (an assumption that may or may not be true). Even in cases where what they asked for was not possible, a speculative question such as this one helped highlight what needs or questions were most important to them. Broadly speaking, participants want a product that includes a debris-flow inundation hazard assessment but were also interested in a wide range of supporting information. In addition, participants reported needs that included those topics identified in the section “Challenges” above (weather and rainfall, fire recovery, debris-flow hydraulics) and extended to others, such as the location of important structures. Information needs are summarized in table 2.
Table 2.
Summary of information needs for different topics.Participants anticipated great benefit to having access to a postfire debris-flow inundation product that included the desired capabilities summarized in the first row of table 2. They described the importance of such a product for risk analysis, public education, and emergency response, particularly for informing the following activities:
-
• Aiding in risk analysis as well as providing and maintaining situational awareness;
-
• Determining where mandatory and voluntary evacuation zones should be delineated;
-
• Using inundation data as inputs into hydraulic models to understand flows and potential damages;
-
• Determining where mitigation measures, such as barriers, should be placed before postfire debris flows have occurred;
-
• Educating decision makers and the public on specific characteristics of the postfire debris-flow hazard (depth, velocity, boulder or sediment content) or risks (loss of life, damage to property, movement of large objects);
-
• Creating customized alerts depending on the affected location for the general public; and
-
• Determining where emergency response personnel and other resources should be allocated before and after postfire debris flows have occurred.
While this summary combines many different visions, interests, and needs, it also highlights the broad range of ways a postfire debris-flow inundation hazard assessment could be used. We note that some of these anticipated uses might conflict—some may require a smaller area and others, a larger area—so one product may not be able to meet all goals. However, they provide a picture of the range of use cases that may support a researcher thinking explicitly about use during product research and development.
Scale
When asked to choose between inundation hazard assessments displayed over a large area (an entire fire perimeter, an entire city) with less detail and accuracy or hazard assessments focused on smaller areas (less than a square mile) with more detail and accuracy, most participants opted for the larger areas. In arguing for inundation hazard assessments over a large area, some participants cited the “whole-fire approach” taken for emergency response operations where emergency managers are responsible for identifying hazards, including non-debris-flow related hazards, over the entirety of a burn perimeter. Participants also cited the importance of having a “big picture” to aid in risk analysis and emergency response when time constraints limit the capacity to plan a detailed response. Moreover, participants planning and responding to postfire debris-flow hazards are also responsible for identifying flood hazards. Such efforts require maps that capture a larger area and include the extent of an approaching storm. In the following quote, a participant describes why they preferred information over a large area:
Being able to do one square mile in great detail [means] nothing if that’s not where my high-risk variables are. I would much rather have a little more general information about the entire fire because in that methodology, at least, I can address, in a way, a risk to the public, be it on a freeway, or is it a railroad line, or is it a small community at the canyon type thing. I would much rather have the whole-fire approach. (Participant group: Weather forecasting and warning)
In this quote the participant indicated that an inundation hazard assessment in a small area would not be useful unless that area was where “high-risk variables” (such as people and residences) are located. Instead, the participant preferred information over a larger area because it would permit them to evaluate the risk posed to the public. Other participants saw a need for both detailed, small-area and less detailed, large area hazard assessment, but typically prioritized information over a large area. In the following quote, a participant describes the different uses they see for each scale:
For our unified command, or for us in [the Emergency Operations Center], we always say we need to be thinking and looking at the 10,000-foot level. That might be good for detailed information or mapping later on, and during incident or preplanning or response, but in preplanning our big picture of where we need to do evacs, which for a fire or debris flow are probably gonna cover huge areas, that usually our debris-flow plans, they’re not small for like one neighborhood. They cover a lot of homes, and so we’re lookin’ big picture anyways. (Participant group: Emergency services and management)
The participant indicated that while more detailed information over smaller areas was important for some of their activities, an understanding of the big picture was needed for operations shortly after a fire such as evacuation preplanning.
In contrast, participants who opted for more detailed inundation hazard assessments focused on smaller areas cited the need to develop more precise response plans including, but not limited to, the installation of diversion structures in critical locations to mitigate the inundation footprint as well as the development of more refined evacuation zones to prevent evacuation fatigue. Some participants also believed that postfire debris-flow inundation hazard assessments over large areas could be known through other sources or would generally be known through local knowledge, common heuristics for the generation of postfire debris flows (for example, locations downstream of steep burned slopes), or past experiences1 . Lastly, there was also a concern that maps presenting large areas with less accuracy and detail would decrease the utility of a postfire debris-flow inundation hazard assessment.
Author’s note: We are unaware of such common heuristics for debris-flow inundation.
One participant recommended focusing postfire debris-flow inundation hazard assessments on areas with potential exposure:
I still think we’re gonna be focused on where the most impact is gonna be, where the most people are gonna be impacted. There’s plenty of burn scars out there where if something happens, nobody even knows about it because nobody is impacted, or they couldn’t even get out there to see where the problem may have been. (Participant group: Weather forecasting and warning)
In this quote the participant emphasized that some fire extents contain large areas with little human presence leading them to prioritize areas with greater potential for human impact. However, participants also brought up a challenge in identifying smaller areas for more detailed analysis: that choosing areas necessitates prioritizing one area over another, which may present an ethical dilemma. One participant described why they would find making a decision about which areas to prioritize difficult:
I would find it difficult to request a high level of detail for a certain part of the area expected to be impacted in the debris flow versus another. Because it would place a bias and preference on a certain part of, for example, an urbanized area over others, and I don’t think anyone wants to be in a position making that kind of decision. (Participant group: Floodplain and geology)
The quote illustrates that determining specific areas to prioritize is a difficult task. The participant indicated that they would not want to make the decision to prioritize one populated area over another, or one populated area over an area with critical infrastructure.
Interestingly, participants who have a supportive role to decision makers, but themselves did not make emergency or land management decisions, often expressed a preference for small-extent, more detailed inundation data due to anticipating the needs of said decision makers. These anticipated needs contrast with the reported preference of interviewed decision makers for large-extent maps or, at minimum, potentially being hindered in their ability to make decisions if they only had access to small-extent maps. It is important to note that all participants recognized the importance of having both large- and small-extent inundation hazard assessments and often stressed the importance of getting pertinent information in the hands of decision makers responsible for emergency response in a timely fashion. In the following quote a participant described the different uses they see for both large- and small-extent hazard assessments:
You almost kind of need both, right? One for the rapid inundation assessment when you have a storm two days out. The other one for more refined inundation analysis—if you have the luxury to do that. (Participant group: Postfire hazard assessments)
This quote highlights that participants anticipated using hazard assessments at different scales at different points in time. Specifically, that a large-extent hazard assessment would be used for decision making after a storm was forecast. In contrast, the small-extent hazard assessment would be used only if there were sufficient time to act on the information provided at that scale.
Human Concerns
When prioritizing human concerns, participants often stated their organizations’ mission to protect life and property. All participants ranked the protection and wellbeing of people as the highest priority. Most participants cited property as equally important and were primarily focused on residential structures. Consequently, residential structures are likely sites for evacuation or mitigation measures. Participants anticipated needing information about the location of homes, areas with high population density, busy roads, and information about where vulnerable populations may be located, including hospitals, nursing homes, and schools. One participant specifically indicated the potential usefulness of having social vulnerability information such as the Social Vulnerability Index (Cutter and others, 2003) available as a supporting GIS layer when interacting with visualizations of spatially distributed postfire debris-flow hazard assessment results. In the following quote, a participant describes the emphasis placed on protecting lives:
You can replace your belongings. You can replace your house. You can’t replace yourself. That’s the same with fire evacuation for fires. It’s the same for debris flows. Infrastructure can be repaired, and people can’t. It really comes down to where those people are. (Participant group: Weather forecasting and warning)
In this quote, the participant emphasizes the importance of the impacts to life and safety. The participant drew a parallel between the hazards of fire and the hazard of postfire debris flows—that in both cases, their primary objective is to keep people out of the way.
Transportation sector critical infrastructure such as roads and other transportation corridors were reported as the second highest priority. This prioritization was attributed to the importance of transportation corridors for efficient ingress and egress for both residents evacuating and returning after an evacuation order and emergency vehicles and personnel mobilizing should postfire debris flows occur. A participant reported that evacuation center locations, where people who have evacuated are directed to go, were often far from evacuation zones because the location of evacuation centers considers road connectivity and aims to remove people from the impacted area. Road-intersecting hydraulic infrastructure was also cited as important, specifically culverts that direct water under roads and drainage features that direct water away from the roads.
Non-transportation sector critical infrastructure such as fire stations, telecommunications, gas lines, water infrastructure and waste infrastructure were ranked as the third highest priority. However, the kind of non-transportation critical infrastructure that a participant would find useful to know about varied drastically and depended heavily on their scope of responsibilities or past experiences with postfire debris flows. For example, one participant prioritized the location of natural gas infrastructure because they witnessed a gas line explode due to impact from postfire debris-flow event.
Inundation Attributes
Inundation hazard assessments may be based on simulation results that produce a variety of variables including inundated area, flow depth, and flow velocity under a particular scenario. Participant input indicated inundation area was seen as particularly relevant for emergency management while all three are relevant for mitigation strategies. In addition to flow velocity distributed over an area of interest, participants stated a need for debris-flow-front velocity, the speed at which a debris flow moves through an area.
Participants reported three use cases for inundation characteristics. The first potential use case was to perform risk analyses. All inundation characteristics would likely be used to identify areas of exposure and compounding risks that could impact communities or critical infrastructure. Flow velocity was identified as useful for understanding the damage potential of certain debris flows to structures. The second use case was risk communication regarding postfire debris-flow hazards to multiple, distinct audiences with differing prior knowledge and experience with debris-flow hazards. Example audiences included members of the public and professional decision makers. Inundation flow depth and flow velocity were perceived as useful variables to describe postfire debris flows to emergency managers (one participant stated, “a 6-foot wall of mud moving at 30 miles per hour”). Some participants stated that they already have rules of thumb for using information about inundation to make management decisions. The following quote is an example of one participant’s approach:
If there’s more than six inches of water, we’re closing the road. We’re just closing the road. If there’s a debris flow, if there’s any sort of debris flow across the road, we’re closing the road. While the depth and the velocity are interesting, the presence of it, the boundary [of the debris flow] is probably the most important for us. (Participant group: Floodplain and geology)
The participant indicated that they are most concerned about the presence of a debris flow in a particular area because the threshold they use for closing a road was the presence of a debris flow, not its depth or velocity.
The final use case, which would draw from existing hydrologic and risk analyses, as well as risk communication efforts, would be to support the development of hazard avoidance strategies. Inundation extent, or area, was cited as particularly useful for generating evacuation zones and issuing evacuation orders. Many participants, however, stated the need for precision when delineating inundation extents to ensure unnecessary evacuation orders that contribute to evacuation fatigue.
In addition to these use cases, participants expressed that the scientific advances likely necessary to underpin a postfire debris-flow inundation hazard assessment would support their own internal efforts in hydraulic and hydrologic modeling. Participants who have flood management responsibilities or provide flood expertise to decision-makers commonly described the difficulty of predicting the behavior of non-clear water flows. At present, participants had limited guidance regarding how to specify the initial conditions for debris flows into the models they currently use.
Inundation Threat
The majority of respondents described the most concerning or threatening type of postfire debris-flow inundation as an inundation path that intersects with people, homes, or transportation corridors. Although there were concerns about depth, velocity, and the composition of debris flows (sediment size characteristics), participants indicated they would be prompted to respond only when debris flows put lives at risk or obstructed transportation corridors critical to the movement of emergency personnel and resources for recovery. When asked to describe inundation threat, one participant indicated:
I think, at least for our areas, it would be the areas that pose a threat, regardless of boulder, logs, mud, debris [or] history. In [county name], there's a lot of history of catastrophic flash floods unrelated to burn scars and related to burn scars. (Participant group: Weather forecasting and warning)
Another participant indicated that their intent was to, “* * * identify where the threat is so people can make sure they're out of the way of it.” (Participant group: Emergency services and management)
Notably, neither of these quotes describes specific physical characteristics, such as large boulders, that make a debris flow especially threatening. Both quotes prioritize information about debris-flow runout that could be a threat to life safety.
A few participants expressed being equally concerned with flood flows as much as postfire debris flows for the same reasons.
Should a postfire debris flow with the potential to adversely affect communities and roads be forecasted, participants were concerned with the velocity of the flowing debris as well as the quantity of boulders or other debris. Velocity was reported as particularly threatening due to the limited time for the public to flee and increased time needed by first responders to arrive on scene. Large boulders and other debris were considered threatening and described as “incredibly destructive” due to their ability to damage structures and injure people via impact, as well as clog culverts and other hydraulic infrastructure that conveys water under roads and through urban areas. Maintaining clear conveyance in hydraulic infrastructure is important to unpredictable changes in runout path.
Rainfall Intensity
Rainfall intensity is one of the key inputs to estimating the size and probability of events, and the interview guide led the discussion to multiple aspects of rainfall intensity to understand how to make usable rainfall scenarios.
Distinction Between Moderate and Extreme Rainfall
In defining moderate and extreme rainfall, participants recalled experience with previous events and considered other variables affecting inundation, such as geographical location, topography (steepness of burned terrain), impervious cover in urban environments, or event-specific details (burn severity or size of fire). While opinions about what constituted moderate or extreme rainfall had some overlap, answers varied and conflicted.
Participants expressed that debris flows are triggered by short, intense rain, typically 5–30-minute bursts, consistent with current research. Participants also understand that antecedent moisture is nearly irrelevant for the triggering of postfire debris flows and stated that they rely on existing scientific literature to discuss this point with professionals who are not familiar with this finding.
Participants recognized that the relationship between rainfall scenarios and runoff is different in postfire contexts. For example, a 2-year recurrence interval rain event may inundate an area typically inundated during 5-year or greater recurrence interval storm. One participant described the difficulty they face in modeling postfire debris flows:
I know how to model 100-year clear water storm * * *. Where we need assistance from professionals in the field is in modeling these coast-storm postfire debris events, because the yields are just off the charts * * *. You end up with much more rainfall runoff per unit area, and these incredible bulking factors that are surreal. We saw in the [names of multiple fires] * * *. we got a half inch of rain that when you looked at the runoff, you would have been convinced it was 100-year storm. (Participant group: Floodplain and geology)
The quote indicates that the participant has the knowledge and technical skill to simulate hydrological response and runout for clear-water flows, in which little sediment is entrained. In contrast, they indicated a need for guidance to simulate postfire flows, including postfire debris flows because burned watersheds produce larger volumes of water and sediment than unburned watersheds.
When asked to give examples of moderate rainfall, responses varied in format. Some participants gave recurrence intervals (a 1-year storm) and others gave an intensity-duration value (an I15 value). Common responses include a 1-hour intensity (I60) of 7.6–15.2 millimeters per hour (mm/h), equivalent to 0.3–0.6 inches per hour (in/h), an I15 of 20–28 mm/h (0.79–1.1 in/h), and a 1-year recurrence interval. Multiple participants cited the “USGS triggering threshold” as an example of a moderate rainfall scenario with respect to debris flows, because it is the rainfall at which material begins to move. Similarly, the one-year recurrence interval was justified as a moderate event because this is the most common recurrence interval for a debris flow, consistent with Staley and others (2020). One participant referred to the use of NOAA Atlas 14 (NOAA, 2022) to determine the boundary between moderate and extreme rainfall based on a consistent recurrence interval.
When asked about extreme rainfall, the most common theme in the responses was short duration, high intensity rainfall, typically durations of less than 15 minutes (12.7 millimeters [mm] or 0.5 inches [in.] in 5 minutes, corresponding to an I5 of 152.5 mm/h; 50.8 mm or 2 in. in 15 minutes, corresponding to an I15 of 203 mm/h). When participants connected extreme rainfall to scenarios useful for inundation modeling, they responded based on impact. One participant provided an answer contingent on the triggering threshold, or the rainfall intensity the current hazard assessments indicate will initiate debris flows:
I [want to] know what's the impacts at the triggering threshold, and then what's the impacts all the way going up to fairly extreme situations that could happen. (Participant group: Floodplain and geology)
This participant describes wanting information starting at rainfall intensities that just initiate debris flows, and consequently are smaller in volume, and increasing in size to large events. Additionally, participants recognized that common rainfall intensities, close to typical triggering thresholds could have large debris-flow inundation impacts:
It’s always surprising how big these things can be even towards those lower rainfall thresholds * * *. I mean, I think 20 mm, 22, 24 [I15] is a pretty common one down in southern California, and you can get some pretty big debris flows from a storm like that. (Participant group: Postfire hazard assessment)
Multiple Rainfall Scenarios
Participants reported that inundation hazard assessments with multiple rainfall intensities would be useful for risk communication and emergency response planning. Participants thought that rainfall scenarios might either use common rainfall intensities (a I15 of 12.7 mm/h [0.5 in/h], or 25.4 mm/h [1 in/h]) or rainfall intensities based on precipitation return intervals for an area of interest (the one-year, 10-year or 20-year return interval)2 . Participants indicated that access to inundation hazard assessments based on multiple scenarios would enable county-level emergency management operations to make rapid adjustments or to shift gears with more agility if actual rain intensities were much higher than forecast rainfall intensities. One participant indicated how they already use rainfall forecasts for decision making, specifically the decision to call a specific type of meeting:
Author’s note: A recurrence-interval based approach for defining rainfall rates was previously used by the USGS for postfire hazard assessment. The methodology stopped using recurrence-interval based rainfall rates because NOAA Atlas 14 is not available for several states in the northwest and rainfall recurrence intervals can vary greatly over burn areas with large planimetric extent and differences in elevation.
If you have a rainfall over a half an inch per hour [1.27 centimeters per hour] predicted, then that would trigger us to have what we call a storm risk decision team meeting. We would call that meeting as soon as we got that word. (Participant group: Emergency services and management)
Another participant described how they might use multiple scenarios to make decisions about how large an area might need to be evacuated:
If we’re predicting a half inch an hour [1.27 centimeters per hour], we might identify that there are 10 homes at risk that need to evacuate. If we’re talking about an inch an hour, it might be 100 homes that need to evacuate. Having that information about multiple intensities or multiple rainfall scenarios allows us to better manage not only our mitigation strategies, but also how we are looking at protecting our communities. (Participant group: Floodplain and geology)
Finally, participants described that county-level hydraulic engineers commonly use multiple scenarios for hydraulic modeling—that is, using multiple recurrence intervals storms to understand the range of scenarios and the associated flood and erosion hazards. A participant described multiple scenarios that are typically requested by decision makers:
The first scenario would be a high-frequency event, meaning one that is likely to occur. A lot of times we’ll assume that that would be rainfall that has the ability to occur once every two years. Then we’re asked to define conditions [for] a less frequently occurring event, and that would be something that would have a high magnitude of volume associated with the higher intensity rainfall event. That, we generally look at a 10-to-20-year recurrence interval in providing that kind of assessment. (Participant group: Postfire hazard assessment)
This participant indicated that they see a use for rainfall scenarios with both high and low likelihood of occurrence. Broadly speaking, participants indicated that scenarios allow for multiple types of users to understand how inundation extents might change due to different rainfall intensities or storms.
While there was consensus around the usefulness of multiple rainfall intensity scenarios, there was not consensus regarding which rainfall intensities to use. Specific scenarios proposed by participants varied depending on geographical area, variations in geology and topography, and experience with previous postfire debris-flow events. Lastly, some participants expressed concerns about erring on the side of caution and using the largest reasonable debris-flow volumes given a rainfall intensity to develop inundation hazard assessments because such a worst-case scenario may lead to needless evacuation.
Other Relevant Rainfall Intensities
Other useful rainfall intensities or scenarios included microbursts, bursts of high intensity rain that occur within long-duration, moderate intensity storms. Participants responsible for postfire hazard assessments reported finding 2-year, 5-year, and 10-year events useful for runoff modeling. Some participants urged the importance of identifying rainfall intensities that would contribute to any type of impactful flow event—from hyperconcentrated flows to debris flows—and emphasized that a wide range of postfire hydrologic responses are hazardous to people and property. A participant discussed the distinction between sediment-laden floods and debris flows:
While that’s not, maybe we don’t want to try to model debris flows in that way, but certainly flood hazard. Flood hazard, some of these floods look very close to a debris flow, right? These hyper-concentrated flows, it’s really just a continuum between clear water and the debris flow, so some of these things transport a lot of boulders, trees, a ton of sediment. People call them debris flows even though they’re, take a strict definition, they’re not. (Participant group: Postfire hazard assessment)
The participant indicated both debris flows and sediment-laden hyperconcentrated flows can cause substantial damage. Additionally, an individual event may include both flow types. The quote emphasizes that identifying rainfall intensities that contribute to any type of impactful flow is important for their work.
Uncertainty in Debris-Flow Volume
Under the current practice described in the section “How Far?” the rainfall scenario strongly influences the expected value of debris-flow volume. In addition, at a given I15 value, the prediction uncertainty for debris-flow volume is large. When asked about uncertainty in debris-flow volume, very few participants indicated a strong preference for having access to one specific debris-flow volume scenario over another (the expected value, or the range of the prediction interval at a given I15). One participant expressed concern with only having access to the highest predicted debris-flow volume (worst-case scenario) due to the potential for unnecessary evacuation orders. While participants did not have strong stated preferences for how uncertainty in debris-flow volume factored into rainfall scenario choices, multiple participants expressed that those results ought to indicate uncertainty associated with all relevant model inputs. In the following quote, a participant described the importance of clearly communicating the uncertainty associated with forecasts:
The range in hydrology and the error associated with the hydrology needs to be propagated and combined with the error associated with the hydraulic models. The combined error or range needs to be communicated and displayed on map products. If it is not, then I think that the data can be misinterpreted or relied on at a high level that is not commensurate with the potential errors associated with the data that’s being displayed. (Participant group: Postfire hazard assessments)
This participant thought that postfire debris-flow hazard assessments should consider and depict the uncertainty associated with both the basin hydrologic response that generates debris flows and the models used to identify areas impacted by inundation. The concern described here was that not including a depiction of uncertainty would result in misinterpretation of the hazard assessment, including overconfidence in the results.
Another participant called out the debris-flow volume component of an inundation hazard assessment as particularly important for uncertainty quantification:
The part of that that raises my concerns is, again, the predictability of the—in the range and data used or the range of results in the current debris-flow model volume estimate. (Participant group: Postfire hazard assessment)
The participant raised concern that the model used to forecast volume has a high standard error, and thus produces a large prediction interval for a given rainfall intensity.
Soil Burn Severity
Most participants reported preference for an observed soil burn severity over a synthetic soil burn severity. Participants understood the value in using synthetic soil burn severities for long-term planning or out-of-season emergency planning. This participant indicated that using synthetic soil burn severities was not part of their current procedures but would be useful for understanding more extreme scenarios:
Again, everything I view is through these larger streams on these built alluvial fans, so running those more extreme scenarios, I think there’s utility in doing that. Even if it’s outside of our process and just more of a programmatic approach to pre-fire inundation mapping, assuming a certain burn scenario in a certain storm, running a more extreme scenario at least gives you that upward prediction, I think that’s useful. (Participant group: Postfire hazard assessment)
While this participant did not currently use synthetic soil burn severities, they saw utility in their use for identifying the impacts of more extreme (larger debris-flow volume) events on urbanized alluvial fans. However, most participants prioritized the USGS developing a debris-flow inundation hazard assessment for postfire emergency application that uses observed soil burn severities from fires that have occurred and need to be planned for.
Discussion
Implications
In this section, we synthesize the results to describe their implications for a potential postfire debris-flow inundation hazard assessment. While any individual product may not be able to address all the needs identified in the interviews, collating the needs provides for the identification of common themes and conflicting requirements. In the following section we synthesize the implications into a list of beneficial characteristics of a potential postfire debris-flow inundation hazard assessment product.
From Debris Flows to Flood Flows, It is the Threat that Matters
Participants engage with postfire debris flows as one part of broader postfire hazards. Accordingly, there is less distinction between debris flows and hyperconcentrated flows, but more of a focus on whether either type of flow will pose a threat to people and property.
When participants were asked about a postfire debris-flow inundation hazard assessment, their answers pointed to the entire range of postfire flow hazards, from debris flows to flood flows. In addition to characterization of the hazard, participants were interested in assessments of potential impacts to populations and structures. Answers also spanned timeframes from pre-event planning to post-event forensics. To reflect this, a postfire debris-flow inundation hazard assessment might make clear that debris flows are just one type of postfire hazard. Additionally, research focused on defining the delineation between debris-flows and other postfire flows (Kean and others, 2016) may support users in determining when a postfire debris-flow hazard assessment is applicable.
The locations of populations and transportation infrastructure that influences egress capabilities are the most relevant human concerns for identifying exposure to debris-flow inundation hazards. The results of a postfire debris-flow inundation hazard assessment could be made available in a visualization context that permits inclusion of this geospatial data.
Spatial Scale of Hazard Assessments
Participants see benefit to both less accurate inundation hazard assessments over large areas and more accurate assessments over small area, but typically think assessments for large areas are needed more often, or first.
Some participants thought that hazard assessments over large areas may be available by other means or local heuristics, though we are not aware of such approaches. Participants recommended that, at any scale, areas with high potential exposure to inundation hazards be analyzed first. Focusing analysis on areas with high exposure could address a participant concern that any spatial scope smaller than a whole-fire inundation hazard assessment could result in bias associated with picking target areas. Finally, participants noted different roles for inundation hazard assessments at fine and coarse spatial scales. For example, less detailed inundation hazard assessments over large areas may be useful for evacuations and pre-event planning, while higher resolution assessments over small areas may be better for designing mitigation measures.
To reflect these priorities, researchers may want to prioritize development and evaluation of methods for postfire debris-flow inundation hazard assessment that are feasible to apply at the scale of a whole fire. Additionally, given participants focus on life and property, researchers may consider developing a standardized approach for delineating portions of a fire requiring detailed analysis based on potential population exposure.
Participants recognized that the shrinking time window between fire season and rainy season in southern California may provide an external constraint such that focused, high-resolution inundation hazard assessments are not possible. This short and decreasing time frame emphasizes the need for the development and testing of methods that can be deployed rapidly (days rather than months).
Ancillary Geospatial Information for Decision Support
Inundation hazard assessments are likely to be interpreted in the context of population, residences, and roads.
Participants with mandates to protect human life and property were most interested in hazard assessment that provided information about who or what was at risk, particularly people, residences, and roads. They were interested in other types of non-transportation sector critical infrastructure and the built environment, but to a lesser extent. A postfire debris-flow inundation hazard assessment would not directly determine the vulnerability of people or roads to the hazard. However, providing spatially distributed results from postfire debris-flow inundation hazard assessments in the context of other geospatial layers (population density, critical infrastructure, commercial or residential buildings), may support users in drawing their own exposure inferences.
Utility of Multiple Scenarios
Multiple scenarios are useful because they help users understand how inundation varies across scenarios, providing quick situational awareness as rainfall forecasts change.
Participants brought up a variety of ways to represent rainfall intensities in scenario development (regional standard precipitation intensities, regional recurrence intervals or exceedance probabilities) and there was no consensus regarding a standard approach for rainfall scenario selection. Participants recommended that the results of inundation hazard assessments reflect the likelihood that a given scenario triggers a debris flow, and the consequence of that debris flow. We note that transitioning from a characterization of the hazard to an estimate of risk for hazard requires information and models that do not yet exist (fig. 2). One possible approach for evaluating the consequence of a debris flow might be whether it escapes a confining channel.
Participants were more interested in scenarios based on observed soil burn severity for past fires than synthetic, or “pre-fire,” soil burn severity. The amount of uncertainty introduced in modeled debris-flow volume due to the influence of rainfall intensity was not a top concern for most participants, though one participant stressed that any hazard assessments depicting results on a map ought to represent the propagation of relevant uncertainty sources from one or more scenarios.
There is an important tension between rainfall intensities that trigger debris flows (I5 to I30) and those that can be forecasted (usually I60). This tension originates from observational data that indicates short, high-intensity rainfall triggers debris flows. It is difficult to forecast this type of rainfall on this timescale. Finally, participants expressed concern that using worst-case scenarios may result in result in unnecessary evacuations and evacuation fatigue. While the development of inundation hazard assessment capabilities may not directly address either of these concerns, the concerns underscore the importance of scenarios that are interpretable in the context of rainfall forecast information.
Relevance of Different Inundation Characteristics
Different inundation attributes are useful for different applications and whether inundation comes from a debris flow or a hyperconcentrated flow is not often relevant to participants. Hazard assessments reporting debris-flow extent were seen as most broadly usable, though depth, velocity, and surge front velocity were also important for understanding the hazard and mitigation planning. Critical depths reported for taking actions like closing a road are small (an example of 6 in. was given). Researchers may want to consider prioritizing research evaluating methods to reliably forecast debris-flow extent. However, to estimate levels of damage within considered scenarios, the models that underpin hazard assessments would also need to be able to reliably forecast the required inputs to models that link hazard to damage. Such models include fragility functions that link damage to debris-flow depth or depth and velocity (Jakob and others, 2012; Kean and others, 2019).
Additionally, because participants noted that they already have rules of thumb in hand for use in decision making, researchers may want to work with users to ensure that hazard assessment results are interpreted correctly in the context of these rules of thumb.
Other Elements of Decision Support
Some participants do their own hydrologic and hydraulic modeling. In addition to products produced by the USGS, participants are interested in methods developed by USGS scientists to create inundation hazard assessments. Accordingly, researchers developing methods for postfire debris-flow inundation hazard assessment might ensure that the methods are clearly described, published in accessible information products, and that supporting data is also accessible.
Participants articulated information needs for postfire decision making well beyond the scope of inundation hazard assessments. Most notably participants articulated needs regarding high-resolution topography, understanding the recovery state of burned watersheds and its implication for hazards, and linking hazard characterization to vulnerability and risk. Some of these needs are within the scope of postfire debris-flow processes, while others likely require collaboration with experts in other domains.
Beneficial Characteristics
The implications point to a set of beneficial characteristics that a postfire debris-flow inundation hazard assessment might have. While it may not be possible for one product to have all these characteristics, we synthesize them here:
-
1. A postfire debris-flow hazard assessment that considers multiple scenarios is preferred over one that only considers one scenario because the relative differences between scenarios provide context as forecasts change.
-
2. Usable scenarios are interpretable in the context of ancillary information (such as rainfall forecasts) and the likelihood of triggering an event.
-
3. A hazard assessment that includes information about inundation extent is minimally sufficient. Other desired quantities include forecast depth and velocity, and the location of the transition between debris flows and hyperconcentrated flows.
-
4. A postfire debris-flow hazard assessment would either consider an entire fire or a subset of smaller areas within the fire that have been chosen based on a standardized criteria (for example, all areas with potentially exposed population).
-
5. Usability of an inundation hazard assessment for interpreting the hazard would be improved if it were visualized in the context of population and transportation infrastructure.
-
6. Visualization of an inundation hazard assessment should clearly describe how relevant sources of uncertainty were considered.
Lessons Learned
In this section we report some of the methodological lessons we have learned from the interdisciplinary collaboration necessary to undertake this work.
To ensure that user input would be usable to guide ongoing research, it was necessary to identify areas in the research process where this would be possible. This was an area where multiple iterations between the three project personnel were necessary to identify and refine conversation topics. After Barnhart wrote initial drafts of the target information, she would iterate with Romero and Clifford based on their experience conducting interviews. Common challenges were that while Barnhart initially thought some information might guide ongoing research, after scrutiny from Romero and Clifford, it was determined that this was not the case. Most typically, Barnhart would have thought the information was actionable but when pressed to describe how she might use it, she was not able to. Another common challenge was that Barnhart’s topics of interest were too broad, yielding unspecific draft questions that Clifford and Romero determined would be difficult for participants to answer. The three project personnel found success in narrowing the scope of target information by describing a range of possible answers.
Overall, this approach to identifying target areas where ongoing or future research might be influenced or redirected by the results of a user needs assessment was not something to which Barnhart was accustomed. It would not have been possible without Romero’s and Clifford’s experiences designing studies, creating thematic coding schemes, and conducting interviews. It was made easier by a culture of mutual respect of disciplinary knowledge created by all three project personnel (epistemic humility; Gardiner, 2020). Notably, because so much effort was spent designing the interview guide, the process of designing a thematic coding scheme followed neatly from the guide. This characteristic, however, is likely unique to studies such as this one which are not intended to advance the practice or theory of social science but instead serve as implementations of well-established methods.
All three project personnel worked together to determine a strategy regarding anonymization, and we determined that it was important that Barnhart not see any of the interview transcripts but instead only saw anonymized quotes. The nature of the content meant that to sanitize the quotes, Romero and Clifford needed to remove any reference to places, years, and specific fires, as that information might have de-anonymized the quotes. Quotes were labeled only by participant category not by a unique identifier. We found that it was important that Barnhart see these quotes because her disciplinary perspective allowed her to see a different set of themes than Romero or Clifford could have identified. For example, through her disciplinary read Barnhart better understood the expressed need for methodologic guidance for setting inflow hydrographs. This directly resulted in the revision of the supplementary text of Barnhart and others (2021) to compare the hydrographs constructed through different methods.
Conclusions
We undertook a user needs assessment via unstructured interviews for postfire debris-flow inundation hazard assessments. Such a product is not presently provided by the U.S. Geological Survey. We selected 15 participants associated with decision making for postfire debris-flow hazards in southern California using purposive sampling. These participants spanned a range of job functions, from generating meteorological forecasts and issuing watches and warnings, conducting postfire hazard assessments, providing flood and geology expertise, and executing emergency services. Interviews were recorded, transcribed, and thematically coded for analysis.
Across all participant categories there was strong interest in postfire debris-flow inundation hazard assessments. This presently unmet information need sits alongside other insufficiently met information needs, such as the need for better information about postfire hydrologic recovery of burned watersheds. Participants identified existing challenges, such as connecting the short-duration, high-intensity rainstorms that trigger debris flows with the longer time periods of forecast rainfall. Participants thought that a hazard assessment that considered multiple scenarios would support situational awareness as rainfall forecasts changed. They identified the tension between reflecting all relevant sources of uncertainty in hazard assessments, and a need to make hazard assessments as precise as possible because unnecessary evacuations can result in evacuation fatigue.
With respect to the scale of a hazard assessment and the relevant inundation attributes, different participants wanted different things. Some participants primarily focused on emergency management were interested in a whole-fire assessment in which debris-flow inundation extent would be sufficient, while those focused on designing mitigation measures were interested in a more detailed hazard assessment. Participants identified that the location of focused hazard assessments would need to be based on consistent application of established criteria to prevent any favoritism or bias.
Ultimately, the nature of a postfire debris-flow inundation hazard assessment will reflect the intersection of what is scientifically possible and methodologically robust with the needs of users. This user needs assessment represents an initial effort to understand what users need and thus sets the stage for researchers to expand what is possible in the direction of user needs. Each user and user group may have slightly different needs and the development of a hazard assessment will likely involve tradeoffs, both between different user group needs, and between what is desired and what is possible. Continued interaction with users and studies that build on this work, such as usability assessments, will increase the likelihood that an operational product provides high quality, timely information.
References Cited
Bamzai-Dodson, A., Cravens, A.E., Wade, A., and McPherson, R.A., 2021, Engaging with stakeholders to produce actionable science—A framework and guidance: Weather, Climate, and Society, accessed November 24, 2021. https://doi.org/10.1175/WCAS-D-21-0046.1.
Barnhart, K.R., Jones, R.P., George, D.L., McArdell, B.W., Rengers, F.K., Staley, D.M., and Kean, J.W., 2021, Multi‐Model Comparison of Computed Debris Flow Runout for the 9 January 2018 Montecito, California Post‐Wildfire Event: Journal of Geophysical Research. Earth Surface, v. 126, no. 12, accessed November 24, 2021. https://doi.org/10.1029/2021JF006245.
Baum, R.L., and Godt, J.W., 2010, Early warning of rainfall-induced shallow landslides and debris flows in the USA: Landslides, v. 7, no. 3, p. 259–272, accessed January 13, 2022. https://doi.org/10.1007/s10346-009-0177-0.
Bessette-Kirton, E., Kean, J.W., Coe, J.A., Rengers, F.K., and Staley, D.M., 2019, An evaluation of debris-flow runout model accuracy and complexity in Montecito, CA—Towards a framework for regional inundation-hazard forecasting, in the 7th International Conference on Debris-Flow Hazards Mitigation, accessed January 23, 2023, at https://doi.org/10.25676/11124/173211.
Bernard, D., 2007, Estimation of inundation areas of post-wildfire debris flows: Colorado School of Mines Master’s Thesis, pp. 77, Golden, CO, accessed November 24, 2021, at https://colorado.idm.oclc.org/login?url=https://www.proquest.com/dissertations-theses/estimation-inundation-areas-post-wildfire-debris/docview/2158886 460/se-2?accountid=14503. [Also available at https://repository.mines.edu/handle/11124/15959.]
Beier, P., Hansen, L.J., Helbrecht, L., and Behar, D., 2017, A How-to Guide for Coproduction of Actionable Science: Conservation Letters, v. 10, no. 3, p. 288–296, accessed November 24, 2021. https://doi.org/10.1111/conl.12300.
Burned Area Emergency Response [BAER], 2018, Thomas Fire Burn Area Emergency Response (BAER) team reports: U.S. Forest Service web page, accessed January 24, 2023, at https://www.fs.usda.gov/detail/lpnf/home/?cid=fseprd570093.
Cannon, S.H., Powers, P.S., Pihl, R.A., and Rogers, W.P., 1995, Preliminary evaluation of the fire-related debris flows on Storm King Mountain, Glenwood Springs, Colorado: U.S. Geological Survey Open-File Report 95-508, 38 p., accessed March 30, 2022. https://doi.org/10.3133/ofr95508.
Cannon, S.H., Powers, P.S., and Savage, W.Z., 1998, Fire-related hyperconcentrated and debris flows on Storm King Mountain, Glenwood Springs, Colorado, USA: Environmental Geology (Berlin), v. 35, no. 2-3, p. 210–218, accessed March 30, 2022. https://doi.org/10.1007/s002540050307.
Cannon, S.H., Michael, J.A., Gartner, J.E., Rea, A.H., and Garcia, S.P., 2002a, Emergency assessment of potential debris-flow peak discharges, Coal Seam fire, Colorado: U.S. Geological Survey Open-File Report 2002–379, Version 1.0, accessed March 30, 2022, at https://doi.org/10.3133/ofr02379.
Cannon, S.H., Rea, A.H., Gleason, J.A., and Garcia, S P., 2002b, Emergency assessment of potential debris-flow peak discharges, Missionary Ridge fire, Colorado: U.S. Geological Survey Open-File Report 2002–323, 1 sheet, accessed March 30, 2022, at https://doi.org/10.3133/ofr02323.
Cannon, S.H., Gartner, J.E., Rupert, M.G., Michael, J.A., Djokic, D., and Sreedhar, S., 2003, Emergency assessment of debris-flow hazards from basins burned by the Grand Prix and Old Fires of 2003, Southern California: U.S. Geological Survey Open-File Report 2003–475, accessed March 30, 2022, 1 sheet, at https://doi.org/10.3133/ofr03475.
Cannon, S.H., and Gartner, J., 2005, Wildfire-related debris flow from a hazards perspective, chap. 15 of Hungr O. and Jakob M., eds., Debris-flow hazards and related phenomena: Springer, Berlin, p. 363–385, accessed April 9, 2022, at https://link.springer.com/content/pdf/10.1007/3-540-27129-5_15.pdf.
Cannon, S.H., Gartner, J.E., & Michael, J.A., 2007, Methods for the emergency assessment of debris-flow hazards from basins burned by the fires of 2007, Southern California: U.S. Geological Survey Open-File Report 2007–1384, Version 1.0, accessed March 30, 2022, at https://doi.org/10.3133/ofr20071384.
Cannon, S.H., Gartner, J.E., Wilson, R.C., Bowers, J.C., and Laber, J.L., 2008, Storm rainfall conditions for floods and debris flows from recently burned areas in southwestern Colorado and southern California: Geomorphology, v. 96, no. 3-4, p. 250–269, accessed November 24, 2021. https://doi.org/10.1016/j.geomorph.2007.03.019.
Cannon, S.H., Gartner, J.E., Rupert, M.G., Michael, J.A., Staley, D.M., and Worstell, B.B., 2009, Emergency assessment of postfire debris-flow hazards for the 2009 Station fire, San Gabriel Mountains, southern California (revised April 2010): U.S. Geological Survey Open-File Report 2009-1227, 27 p., accessed November 24, 2021, at https://doi.org/10.3133/ofr20091227.
Cannon, S.H., Gartner, J.E., Rupert, M.G., Michael, J.A., Rea, A.H., and Parrett, C., 2010, Predicting the probability and volume of postwildfire debris flows in the intermountain western United States: Geological Society of America Bulletin, v. 122, no. 1-2, p. 127–144, accessed January 4, 2022. https://doi.org/10.1130/B26459.1.
Cannon, S.H., Boldt, E.M., Laber, J.L., Kean, J.W., and Staley, D.M., 2011, Rainfall intensity–duration thresholds for postfire debris-flow emergency-response planning: Natural Hazards, v. 59, no. 1, p. 209–236, accessed January 13, 2022. https://doi.org/10.1007/s11069-011-9747-2.
Cash, D.W., Clark, W.C., Alcock, F., Dickson, N.M., Eckley, N., Guston, D.H., Jäger, J., and Mitchell, R.B., 2003, Knowledge systems for sustainable development: Proceedings of the National Academy of Sciences of the United States of America, v. 100, no. 14, p. 8086–8091, accessed November 24, 2021. https://doi.org/10.1073/pnas.1231332100.
Cash, D.W., Borck, J.C., and Patt, A.G., 2006, Countering the Loading-Dock Approach to Linking Science and Decision Making: Science, Technology & Human Values, v. 31, no. 4, p. 465–494, accessed November 24, 2021. https://doi.org/10.1177/0162243906287547.
County of Santa Barbara Office of Emergency Management, 2018, Thomas Fire and 1/9 Debris Flow After-Action Report and Improvement Plan: accessed January 24, 2023, at https://www.countyofsb.org/asset.c/4550https://santabarbara.legistar.com/View.ashx?M=F&ID=6681715&GUID=A6648647-9915-411E-98F5-642EF2AB3C8D.
Chong, J., Renaud, J., and Ailsworth, E., 2004, Flash floods wash away lives, dreams: Los Angeles Times, p. B.1, January 3, accessed November 24, 2021, at https://www.latimes.com/archives/la-xpm-2004-jan-03-me-floods3-story.html.
Christen, M., Kowalski, J., and Bartelt, P., 2010, RAMMS—Numerical simulation of dense snow avalanches in three-dimensional terrain: Cold Regions Science and Technology, v. 63, no. 1-2, p. 1–14, accessed January 24, 2022. https://doi.org/10.1016/j.coldregions.2010.04.005.
Cutter, S.L., Boruff, B.J., and Shirley, W.L., 2003, Social Vulnerability to Environmental Hazards: Social Science Quarterly, v. 84, no. 2, p. 242–261, accessed January 14, 2022. https://doi.org/10.1111/1540-6237.8402002.
Dilling, L., and Lemos, M.C., 2011, Creating usable science—Opportunities and constraints for climate knowledge use and their implications for science policy: Global Environmental Change, v. 21, no. 2, p. 680–689, accessed April 9, 2022. https://doi.org/10.1016/j.gloenvcha.2010.11.006.
Dowling, C.A., and Santi, P.M., 2014, Debris flows and their toll on human life—A global analysis of debris-flow fatalities from 1950 to 2011: Natural Hazards, v. 71, no. 1, p. 203–227, accessed November 24, 2021. https://doi.org/10.1007/s11069-013-0907-4.
Gardiner, P., 2020, Learning to think together—Creativity, interdisciplinary collaboration and epistemic control: Thinking Skills and Creativity, v. 38, p. 100749, accessed February 17, 2022. https://doi.org/10.1016/j.tsc.2020.100749.
Gartner, J.E., Cannon, S.H., Santi, P.M., and Dewolfe, V.G., 2008, Empirical models to predict the volumes of debris flows generated by recently burned basins in the western U.S: Geomorphology, v. 96, no. 3-4, p. 339–354, accessed March 30, 2022. https://doi.org/10.1016/j.geomorph.2007.02.033.
Gartner, J.E., Cannon, S.H., and Santi, P.M., 2014, Empirical models for predicting volumes of sediment deposited by debris flows and sediment-laden floods in the transverse ranges of southern California: Engineering Geology, v. 176, p. 45–56, accessed January 3, 2022. https://doi.org/10.1016/j.enggeo.2014.04.008.
George, D.L., and Iverson, R.M., 2014, A depth-averaged debris-flow model that includes the effects of evolving dilatancy. II. Numerical predictions and experimental tests: Proceedings - Royal Society. Mathematical, Physical and Engineering Sciences, v. 470, no. 2170, p. 20130820, accessed January 24, 2022. https://doi.org/10.1098/rspa.2013.0820.
Gibson, S., Floyd, I., Sánchez, A., and Heath, R., 2021, Comparing single‐phase, non‐Newtonian approaches with experimental results—Validating flume‐scale mud and debris flow in HEC‐RAS: Earth Surface Processes and Landforms, v. 46, no. 3, p. 540–553, accessed January 24, 2022. https://doi.org/10.1002/esp.5044.
Gorr, A.N., McGuire, L.A., Youberg, A.M., and Rengers, F.K., 2022, A progressive flow-routing model for rapid assessment of debris-flow inundation: Landslides, v. 19, no. 9, p. 2055–2073, accessed September 28, 2022. https://doi.org/10.1007/s10346-022-01890-y.
Horton, P., Jaboyedoff, M., Rudaz, B., and Zimmermann, M., 2013, Flow-R, a model for susceptibility mapping of debris flows and other gravitational hazards at a regional scale: Natural Hazards and Earth System Sciences, v. 13, no. 4, p. 869–885, accessed January 24, 2022. https://doi.org/10.5194/nhess-13-869-2013.
Iverson, R.M., 1997, The physics of debris flows: Reviews of Geophysics, v. 35, no. 3, p. 245–296, accessed January 24, 2022. https://doi.org/10.1029/97RG00426.
Iverson, R.M., Schilling, S.P., and Vallance, J.W., 1998, Objective delineation of lahar-inundation hazard zones: Geological Society of America Bulletin, v. 110, no. 8, p. 972–984, accessed January 23, 2023. https://doi.org/10.1130/0016-7606(1998)110<0972:ODOLIH>2.3.CO;2.
Iverson, R.M., and George, D.L., 2014, A depth-averaged debris-flow model that includes the effects of evolving dilatancy. I. Physical basis: Proceedings - Royal Society. Mathematical, Physical and Engineering Sciences, v. 470, no. 2170, p. 20130819, accessed January 24, 2022. https://doi.org/10.1098/rspa.2013.0819.
Jakob, M., Stein, D., and Ulmi, M., 2012, Vulnerability of buildings to debris flow impact: Natural Hazards, v. 60, no. 2, p. 241–261, accessed April 9, 2022. https://doi.org/10.1007/s11069-011-0007-2.
Kean, J.W., McGuire, L.A., Rengers, F.K., Smith, J.B., and Staley, D.M., 2016, Amplification of postwildfire peak flow by debris: Geophysical Research Letters, v. 43, no. 16, p. 8545–8553, accessed January 10, 2021. https://doi.org/10.1002/2016GL069661.
Kean, J.W., Staley, D.M., and Cannon, S.H., 2011, In situ measurements of post-fire debris flows in southern California—Comparisons of the timing and magnitude of 24 debris-flow events with rainfall and soil moisture conditions: Journal of Geophysical Research, v. 116, F4, F04019, accessed January 3, 2021. https://doi.org/10.1029/2011JF002005.
Kean, J.W., Staley, D.M., Leeper, R.J., Schmidt, K.M., and Gartner, J.E., 2012, A low-cost method to measure the timing of postfire flash floods and debris flows relative to rainfall: Water Resources Research, v. 48, no. 5, accessed November 24, 2021. https://doi.org/10.1029/2011WR011460.
Kean, J.W., Staley, D.M., Lancaster, J.T., Rengers, F.K., Swanson, B.J., Coe, J.A., Hernandez, J.L., Sigman, A.J., Allstadt, K.E., and Lindsay, D.N., 2019, Inundation, flow dynamics, and damage in the 9 January 2018 Montecito debris-flow event, California, USA—Opportunities and challenges for post-wildfire risk assessment: Geosphere, v. 15, no. 4, p. 1140–1163, accessed November 24, 2021. https://doi.org/10.1130/GES02048.1.
Kean, J.W., and Staley, D.M., 2021, Forecasting the Frequency and Magnitude of Postfire Debris Flows Across Southern California: Earth’s Future, v. 9, no. 3, accessed November 24, 2021. https://doi.org/10.1029/2020EF001735.
King, L., and Tadaki, M., 2018, A framework for understanding the politics of science (Core Tenet #2) in R. Lave, C. Biermann, and S. Lane, eds., The Palgrave handbook of critical physical geography: Cham, Switzerland. Palgrave Macmillan, p 67–88, accessed January 23, 2023 at https://doi.org/10.1007/978-3-319-71461-5_4.
Kostelnik, J., Schmitt, R., and Rengers, F., 2021, Glenwood Canyon flooding and debris flows, accessed on March 30, 2022, at https://landslides.usgs.gov/storymap/grizzlycreek/.
Lancaster, J.T., Swanson, B.J., Lukashov, S.G., Oakley, N.S., Lee, J.B., Spangler, E.R., Hernandez, J.L., Olson, B.P.E., DeFrisco, M.J., Lindsay, D.N., Schwartz, Y.J., McCrea, S.E., Roffers, P.D., and Tran, C.M., 2021, Observations and Analyses of the 9 January 2018 Debris-Flow Disaster, Santa Barbara County, California: Environmental & Engineering Geoscience, v. 27, no. 1, p. 3–27, accessed November 24, 2021. https://doi.org/10.2113/EEG-D-20-00015.
Lin, R.G., Kim, V.V., and Vives, R., 2010, ‘Niagara’ of mud hits homes: Los Angeles Times, p. A.1, 7 February, accessed November 24, 2021, at https://www.latimes.com/archives/la-xpm-2010-feb-07-la-me-rain7-2010feb07-story.html.
Los Angeles County Department of Public Works, 2022, Debris and mudflow potential forecast, accessed April 9, 2022, at https://dpw.lacounty.gov/wrd/forecast/index.cfm.
Ludwig, K.A., Ramsey, D.W., Wood, N.J., Pennaz, A.B., Godt, J.W., Plant, N.G., Luco, N., Koenig, T.A., Hudnut, K.W., Davis, D.K., and Bright, P.R., 2018, Science for a risky world—A U.S. Geological Survey plan for risk research and applications: U.S. Geological Survey Circular 1444, 57 p., accessed January 24, 2022, at https://doi.org/10.3133/cir1444.
Lukashov, S.G., Lancaster, J.T., Oakley, N.S., and Swanson, B.J., 2019, Postfire debris flows of 9 January 2018, Thomas Fire, southern California—Initiation areas, precipitation and impacts: Proceedings of the Seventh International Conference on Debris-Flow Hazards Mitigation, Golden, Colorado, USA, June 10-13, 2019. Association of Environmental and Engineering Geologists, accessed November 24, 2021, at https://doi.org/10.25676/11124/173144.
McDougall, S., 2017, 2014 Canadian Geotechnical Colloquium—Landslide runout analysis — current practice and challenges: Canadian Geotechnical Journal, v. 54, no. 5, p. 605–620, accessed January 24, 2022. https://doi.org/10.1139/cgj-2016-0104.
McNie, E.C., 2007, Reconciling the supply of scientific information with user demands—An analysis of the problem and review of the literature: Environmental Science & Policy, v. 10, no. 1, p. 17–38, accessed February 17, 2022. https://doi.org/10.1016/j.envsci.2006.10.004.
Mergili, M., Fischer, J.-T., Krenn, J., and Pudasaini, S.P., 2017, r.avaflow v1, an advanced open-source computational framework for the propagation and interaction of two-phase mass flows: Geoscientific Model Development, v. 10, no. 2, p. 553–569, accessed January 24, 2022. https://doi.org/10.5194/gmd-10-553-2017.
Moody, J.A., Shakesby, R.A., Robichaud, P.R., Cannon, S.H., and Martin, D.A., 2013, Current research issues related to post-wildfire runoff and erosion processes: Earth-Science Reviews, v. 122, p. 10–37, accessed January 24, 2022. https://doi.org/10.1016/j.earscirev.2013.03.004.
National Oceanic and Atmospheric Administration [NOAA]-U.S. Geological Survey [USGS] Debris Flow Task Force, 2005, NOAA-USGS debris-flow warning system—Final report: U.S. Geological Survey Circular 1283, 47 p., accessed November 24, 2021, at https://doi.org/10.3133/cir1283.
National Oceanic and Atmospheric Administration [NOAA], 2022, NOAA ATLAS 14 point precipitation frequency estimates: Hydrometeorological Design Studies Center, accessed February 17, 2022, at https://hdsc.nws.noaa.gov/hdsc/pfds/pfds_map_cont.html.
Oakley, N.S., Cannon, F., Munroe, R., Lancaster, J.T., Gomberg, D., and Ralph, F.M., 2018, Brief communication—Meteorological and climatological conditions associated with the 9 January 2018 post-fire debris flows in Montecito and Carpinteria, California, USA: Natural Hazards and Earth System Sciences, v. 18, no. 11, p. 3037–3043, accessed November 23, 2021. https://doi.org/10.5194/nhess-18-3037-2018.
O’Brien, J.S., Julien, P.Y., and Fullerton, W.T., 1993, Two‐Dimensional Water Flood and Mudflow Simulation: Journal of Hydraulic Engineering (New York, N.Y.), v. 119, no. 2, p. 244–261, accessed January 24, 2022. https://doi.org/10.1061/(ASCE)0733-9429(1993)119:2(244).
Qualitative Research Software [QSR] International Pty Ltd., 2020, NVivo: Software released in March 2020, Accessed November 25, 2020, at https://www.qsrinternational.com/nvivo-qualitative-data-analysis-software/home.
Rengers, F.K., McGuire, L.A., Kean, J.W., Staley, D.M., and Youberg, A.M., 2019, Progress in simplifying hydrologic model parameterization for broad applications to post‐wildfire flooding and debris‐flow hazards: Earth Surface Processes and Landforms, v. 44, no. 15, p. 3078–3092, accessed January 24, 2022. https://doi.org/10.1002/esp.4697.
Rickenmann, D., 1999, Natural Hazards, v. 19, no. 1, p. 47–77, accessed January 24, 2022. https://doi.org/10.1023/A:1008064220727.
Santi, P.M., and Rengers, F.K., 2022, Wildfire and Landscape Change: p. 765–797, accessed January 24, 2022. https://doi.org/10.1016/B978-0-12-818234-5.00017-1.
Schilling, S. P., 1998, LAHARZ—GIS programs for automated mapping of lahar-inundation hazard zones: U.S. Geological Survey Open-File Report 98-638, 80 p., accessed January 23, 2023 at https://doi.org/10.3133/ofr98638
Schmidt, K.M., Hanshaw, M.N., Howle, J.F., Kean, J.W., Staley, D.M., Stock, J.D., and Bawdeng, G.W., 2011, Hydrologic conditions and terrestrial laser scanning of post-fire debris flows in the San Gabriel Mountains, CA, USA: Italian Journal of Engineering Geology and Environment, p. 583–593, accessed September 28, 2022, at https://doi.org/10.4408/IJEGE.2011-03.B-064.
Scott, W.E., Iverson, R.M., Schilling, S.P., and Fisher, B.J., 2000, Volcano hazards in the Three Sisters region, Oregon: U.S. Geological Survey Open-File Report 99-437, 14 p., 1 plate, accessed November 24, 2021, at https://doi.org/10.3133/ofr99437.
Staley, D.M., Kean, J.W., Cannon, S.H., Schmidt, K.M., and Laber, J.L., 2013, Objective definition of rainfall intensity–duration thresholds for the initiation of post-fire debris flows in southern California: Landslides, v. 10, no. 5, p. 547–562, accessed January 13, 2022. https://doi.org/10.1007/s10346-012-0341-9.
Staley, D.M., Negri, J.A., Kean, J.W., Laber, J.L., Tillery, A.C., and Youberg, A.M., 2017, Prediction of spatially explicit rainfall intensity–duration thresholds for post-fire debris-flow generation in the western United States: Geomorphology, v. 278, p. 149–162, accessed November 24, 2021. https://doi.org/10.1016/j.geomorph.2016.10.019.
Staley, D.M., Kean, J.W., and Rengers, F.K., 2020, The recurrence interval of post-fire debris-flow generating rainfall in the southwestern United States: Geomorphology, v. 370, p. 107392, accessed April 9, 2022. https://doi.org/10.1016/j.geomorph.2020.107392.
Tang, H., McGuire, L.A., Rengers, F.K., Kean, J.W., Staley, D.M., and Smith, J.B., 2019, Developing and Testing Physically Based Triggering Thresholds for Runoff‐Generated Debris Flows: Geophysical Research Letters, v. 46, no. 15, p. 8830–8839, accessed January 24, 2022. https://doi.org/10.1029/2019GL083623.
Thomas, M.A., Rengers, F.K., Kean, J.W., McGuire, L.A., Staley, D.M., Barnhart, K.R., and Ebel, B.A., 2021, Postwildfire Soil‐Hydraulic Recovery and the Persistence of Debris Flow Hazards: Journal of Geophysical Research. Earth Surface, v. 126, no. 6, accessed January 13, 2022. https://doi.org/10.1029/2021JF006091.
Wall, T.U., Meadow, A.M., and Horganic, A., 2017, Developing Evaluation Indicators to Improve the Process of Coproducing Usable Climate Science: Weather, Climate, and Society, v. 9, no. 1, p. 95–107, accessed January 23, 2023. https://doi.org/10.1175/WCAS-D-16-0008.1.
Watershed Emergency Response Team [WERT], 2018, Thomas Fire—Watershed Emergency Response Team final report, CA-VNC-103156: Sacramento, California, CAL FIRE, accessed January 3, 2022, at https://readysbc.org/wp-content/uploads/2020/06/Thomas_Fire_WERT_20180228-final-a_OPTIMIZED.pdf.
Watershed Emergency Response Team [WERT], 2020, CZU Lightning Complex—Watershed Emergency Response Team final report, CA-CZU-005205: Sacramento, California, CAL FIRE, accessed January 24, 2023, https://www.smcgov.org/sites/default/files/2021-11/CZU%20Lightning%20Complex%20WERT%20Final%2010-6-20.pdf.
Rupert, M.G., Cannon, S.H., and Gartner, J.E., 2003, Using Logistic Regression To Predict the Probability of Debris Flows Occurring in Areas Recently Burned By Wildland Fires: U.S. Geological Survey Open-File Report 2003–500, 1 sheet, accessed March 30, 2022, at https://doi.org/10.3133/ofr03500.
Disclaimers
Any use of trade, firm, or product names is for descriptive purposes only and does not imply endorsement by the U.S. Government.
Although this information product, for the most part, is in the public domain, it also may contain copyrighted materials as noted in the text. Permission to reproduce copyrighted items must be secured from the copyright owner.
Suggested Citation
Barnhart, K.R., Romero, V.Y., and Clifford, K.R., 2023, User needs assessment for postfire debris-flow inundation hazard products: U.S. Geological Survey Open-File Report 2023–1025, 25 p., https://doi.org/10.3133/ofr20231025.
ISSN: 2331-1258 (online)
Study Area
| Publication type | Report |
|---|---|
| Publication Subtype | USGS Numbered Series |
| Title | User needs assessment for postfire debris-flow inundation hazard products |
| Series title | Open-File Report |
| Series number | 2023-1025 |
| DOI | 10.3133/ofr20231025 |
| Publication Date | April 06, 2023 |
| Year Published | 2023 |
| Language | English |
| Publisher | U.S. Geological Survey |
| Publisher location | Reston, VA |
| Contributing office(s) | Geologic Hazards Science Center |
| Description | vi, 25 p. |
| Country | United States |
| State | California |
| City | Montecito |
| Online Only (Y/N) | Y |
| Additional Online Files (Y/N) | N |