

Method for Identification of Reservoir Regulation within U.S. Geological Survey Streamgage Basins in the Central United States Using a Decadal Dam Impact Metric
Links
- Document: Report (8.69 MB pdf) , HTML , XML
- Datasets:
- U.S. Army Corps of Engineers database —National inventory of dams
- USGS National Water Information System database —USGS water data for the Nation
- Data Releases:
- USGS data release - Select attributes for NHDPlus Version 2.1 reach catchments and modified network routed upstream watersheds for the conterminous United States (ver. 3.0, January 2021)
- USGS data release - Dam impact/disturbance metrics for the conterminous United States, 1800 to 2018
- NGMDB Index Page: National Geologic Map Database Index Page (html)
- Download citation as: RIS | Dublin Core
Acknowledgments
Funding for this project was provided by the Transportation Pooled Fund-5(460) project, in cooperation with the following State agencies: Illinois Department of Transportation, Iowa Department of Transportation, Michigan Department of Transportation, Minnesota Department of Transportation, Missouri Department of Transportation, Montana Department of Natural Resources and Conservation, North Dakota Department of Water Resources, South Dakota Department of Transportation, and Wisconsin Department of Transportation.
Several U.S. Geological Survey colleagues contributed to the methods and ideas used in this project, including Steve Sando, Harper Wavra, Nancy Barth, Roy Sando, Thomas Over, and Padraic O’Shea.
Abstract
Researchers routinely study streamflow data to understand the effects of natural climate variability and anthropogenic climate change, and to develop methods for estimating streamflow at ungaged locations. These studies require streamflow data that are not modified or largely altered by other anthropogenic activities, such as reservoirs or diversions. This report discusses a method for identifying basins with reservoir regulation using a decadal impact metric that characterizes the degree of regulation of a given river reach. The method is applied to U.S. Geological Survey streamgage basins from eight States in the Central United States. Using this metric, 140 streamgages with known regulation effects (annual peak streamflow values qualified with a code 6) were evaluated for their impact metric values in decades with annual peak streamflow values qualified with code 6. Based on the distribution of median impact metric values at these regulated basins, a threshold value of 0.1 was identified as the value that when exceeded was the most characteristic of the regulated streamgage basins in the study area. Streamgage basins from nine States with peak streamflow values that were not qualified with code 6 were evaluated for impact metric values equal to or greater than the established threshold. About 13 percent of streamgages (136 of 1,017) had an impact metric equal to or greater than the identified regulated threshold at some point in their periods of record. The method discussed in this report, which has limitations owing to characteristics of the data underlying the dam impact metric, provides a regionally consistent approach to identifying regulated U.S. Geological Survey streamgage basins.
Introduction
Streamflow on many rivers in the United States is regulated by the use of dams and their reservoirs, which store and release water, altering the natural flow regime. The effects of this regulation vary depending on the size of the reservoir as well as the purpose of the dam, such as irrigation, hydropower, or flood control (Collier and others, 1996). Scientists frequently make decisions about the use of long-term streamgage records in hydrologic studies based on available regulation information. If a study has a goal of understanding the effects of natural climate variability or anthropogenic climate change on flooding, the set of streamgages used should reflect those not modified by reservoirs or substantial land-use change. In studies focused on peak streamflow (peak) values, the peaks included in the study should be unaltered by regulation.
Sources used for information on the degree of regulation on a particular river reach or streamgage basin vary by study and include information from the peak-flow file (PFF) published by the U.S. Geological Survey (USGS), using institutional knowledge from local analysts familiar with the study area, and using reservoir storage and streamflow information to develop a method unique to a specific study. Few of these methods are systematic; thus, consistent application across a large region would be difficult. Sources of data on the presence of dams and reservoirs, like the National Inventory of Dams (NID), are not all-inclusive and often are missing some dams and smaller structures like stock ponds.
One source of information on regulation is the PFF, which is available as part of the USGS National Water Information System (NWIS) database (U.S. Geological Survey, 2021b). In addition to annual peak values, the PFF dataset may contain qualification codes that are applied to some peak values to provide additional information about the forces that generated the peak value. Qualification code definitions can be viewed in NWIS by visiting the page for a specific streamgage, clicking on “Peak streamflow,” and then clicking on “Tab-separated file” under “Output formats” (U.S. Geological Survey, 2021c). For sites with an active Next Generation Monitoring Location page, a user can get to the same location by selecting “Data Inventory” and then “Peak Streamflow” (U.S. Geological Survey, 2021b).
The qualification codes describing regulation are code 5, indicating that streamflow was affected to an “unknown degree by Regulation or Diversion,” and code 6, indicating that streamflow was “affected by known Regulation or Diversion” (U.S. Geological Survey, 2021c). These codes have important implications for streamgage selection in studies and for flood-frequency analysis because PeakFQ, the USGS program used for flood-frequency analysis, uses peaks qualified with code 5 but excludes peaks qualified with code 6 unless otherwise specified by the user; however, these descriptions are open to interpretation. Code 5 peaks have been considered to have less than 10 percent of the peak streamflow affected by regulation (Ryberg and others, 2017) whereas peaks qualified with code 6 were affected by known and planned regulation affecting peaks by more than 10–15 percent (Ryberg, 2008; Ryberg and others, 201714). Throughout the history of the USGS PFF, technical reviews, regional-flood studies, and user inquiries have indicated inconsistencies among USGS Water Science Centers and over time in the use of these and other qualification codes, and efforts have been made to improve the consistency of the application of the codes (Ryberg, 2008; Ryberg and others, 2017). However, the definition of codes 5 and 6 have not been revised to be more specific and “the difference between code 5…and code 6…is admittedly fuzzy and subject to differing interpretations. The difference is mainly one of certainty that there is a regulation effect on the peak discharge” (Ryberg and others, 2017, p. 9).
When it comes to streamgage selection and better determination of regulation effects, several tactics have been used. The USGS Hydro-Climatic Data Network (HCDN) was identified in 1992 as a subset of all USGS streamgages for which the streamflow primarily reflects prevailing meteorological conditions for specified years (Slack and Landwehr, 1992). The HCDN was updated in 2009 (hereafter referred to as “HCDN-2009”; Lins, 2012) to address questions concerning the number of original streamgages that maintained their status as sensitive to climate, streamgages that no longer remained operational, and streamgages that did not qualify as HCDN sites in 1988 (the last year of the original data evaluation) because their records were too short and did not have sufficiently long streamflow records for climate-sensitivity studies by 2009. Many of those same questions would be beneficial to revisit if one were to use HCDN-2009 sites. In related efforts, the USGS National Water-Quality Assessment Program analyzed reference sites to identify those streamgages minimally affected by direct human activities in the conterminous United States (Falcone and others, 2010). The list of reference and nonreference sites and associated basin characteristics was called Geospatial Attributes of Gages for Evaluating Streamflow (GAGES) in 2010 and updated to GAGES-II in 2011 (Falcone and others, 2010; Falcone, 2011). GAGES-II has been widely used because it provides geospatial data for each streamgage in the dataset; however, GAGES-II has two shortcomings for streamgage selection. First, as with HCDN-2009, the dataset has not been updated. Because reference status can change over time, some streamgages may have been discontinued and some not initially included because of lack of data may now have sufficient data. In addition, if part of the drainage area upstream from a streamgage was in Canada or Mexico, the streamgage was not included in GAGES-II because of the difficulty in obtaining or harmonizing data across international boundaries. The exclusion of transboundary watersheds left out some streamgages with long-term records of good quality data, which was particularly of concern for Montana and North Dakota. Given the shortcomings of the peak qualification codes and the HCDN-2009 and GAGES-II datasets and the lack of updates, many alternative methods of streamgage selection have been used.
One option for selecting streamgages, or selecting individual peaks from a streamgage, despite known shortcomings, is to assume the peak qualification codes are correct and represent the best judgement of USGS subject matter experts. In this case, analysts may remove peak values qualified with codes 5, 6, and other codes indicating unnatural conditions or uncertainty in the data. Code 3 is often removed from analyses because it represents “Discharge affected by Dam Failure” (U.S. Geological Survey, 2021c). Code C may also be removed, depending on the purposes of the study, because it represents peaks that have been “Affected by Urbanization, Mining, Agricultural changes, Channelization, or other” (U.S. Geological Survey, 2021c). Code A indicates that the year of occurrence is unknown or not exact and code B indicates that the month or day of occurrence is unknown or not exact (Ryberg, 2008; Ryberg and others, 2017). Depending on the goal of the study, some analysts may remove peaks qualified with codes A and B, whereas others may use them; for example, within Ryberg and others (2016), individual peak values qualified with codes 3, 5, 6, A, B, and C were removed from the study and then streamgages were required to have least 15 remaining peak values for inclusion in the study.
Another option is initial screening of peaks based on the peak qualification codes and subsequent inclusions or exclusions of peaks based on institutional knowledge and discussions with subject matter experts (for example, Hirsch and Ryberg, 2012; Ryberg and others, 2014). This option requires the analysts to know who the subject matter experts are and can require substantial time, depending on the extent of the study.
In other cases, analysts develop their own regulation criteria for streamgage selection or to categorize results, such as calculating a flow-based normalized dam storage above a streamgage and picking a threshold value to indicate a regulated basin (Hodgkins and others, 2019; Ryberg and others, 2020). Sando and McCarthy (2018) developed major and minor regulation definitions. Major dam regulation status was applied to streamgages where a single upstream dam had a drainage area that exceeded 20 percent of the drainage area of the streamgage. Minor dam regulation status was applied to streamgages where the cumulative drainage area of all upstream dams exceeded 20 percent of the drainage area of the streamgage, but no single upstream dam had a drainage area that exceeds 20 percent of the drainage area of the streamgage (Sando and McCarthy, 2018). Depending on data availability and institutional knowledge, others have used a variety of methods including the comparison of peak values pre- and postreservoir operations to determine the effect of regulation and the examination of additional datasets, including data describing regulation location and purpose, the fraction of total basin drainage area that is controlled, the flood-storage capacity of dams in the basin, and other management practices (Asquith, 2001; Sando and others, 2008).
This exercise in determining regulated and (relatively) unregulated streamgages for studies is repeatedly performed and revised by USGS scientists and others that use USGS data. Recent efforts have been made to determine the effects of dams on a more systematic scale by defining a dam impact/disturbance metric for flowlines in the conterminous United States (Wieczorek and others, 2021) using information from the NID (U.S. Army Corps of Engineers, 2018). This impact metric was used to identify a threshold in an eight-State study area and apply it to streamgages in a nine-State area to identify those that are largely unregulated. The method removes some of the subjectivity from the process of identifying regulated streamgage basins, is reproducible, and could be used to develop more quantitative descriptions of peak-streamflow qualification codes in the future.
Purpose and Scope
The purpose of this report is to document a method for consistently identifying the presence of reservoir regulation in streamgage basins and apply it across nine States in the Central United States. A decadal impact metric that characterizes the degree of regulation of a given river reach using storage information from dams in the NID was used to quantify regulation. This metric (denoted “DamIndex_PMC” in the original publication (Wieczorek and others, 2021) and referred to as the “impact metric” in this report) is a function of the sum of the upstream reservoir storage multiplied by the ratio of the dam drainage area to the National Hydrography Dataset (NHD) (U.S. Geological Survey, 2021a) flowline drainage area, divided by the volume of precipitation in the NHD flowline basin (Wieczorek and others, 2021). This dimensionless metric is meant to provide insight into how peaks are affected by dams in the upstream flow network and uses storage information from the NID, a database documenting dams in the United States maintained by the U.S. Army Corps of Engineers (U.S. Army Corps of Engineers, 2018).
Using these data, streamgages with known regulation (streamgages with peaks qualified by code 6) from eight States were evaluated for their impact metric values in decades with code 6 peaks. A threshold value was identified as the value most characteristic of these regulated streamgages. This threshold was applied to streamgages in a nine-State area and used to identify streamgages without known regulation (including those qualified with code 5) that had an impact metric value equal to or greater than the identified threshold at some time in their active period of record.
Description of Study Area
The study area includes the States of Illinois, Iowa, Michigan, Minnesota, Missouri, Montana, North Dakota, South Dakota, and Wisconsin (fig. 1). The study area includes basins outside of those State boundaries whose streamflow flows into any of the nine States in the study area, including streamgages in Arkansas, Idaho, Indiana, Kansas, Nebraska, Washington, and Wyoming. These States are largely within the upper Mississippi River Basin and vary in topography, ecoregions, land use, land cover, and climate. Dams are prevalent throughout the study area but are unevenly distributed throughout the region. The application of code 6 peak qualification codes varies throughout the study area; for example, in contrast with several other States in the region, it is more common to apply code 5 to peaks in Montana streamgage basins with some regulation, and therefore Montana has very few streamgages with a code 6.
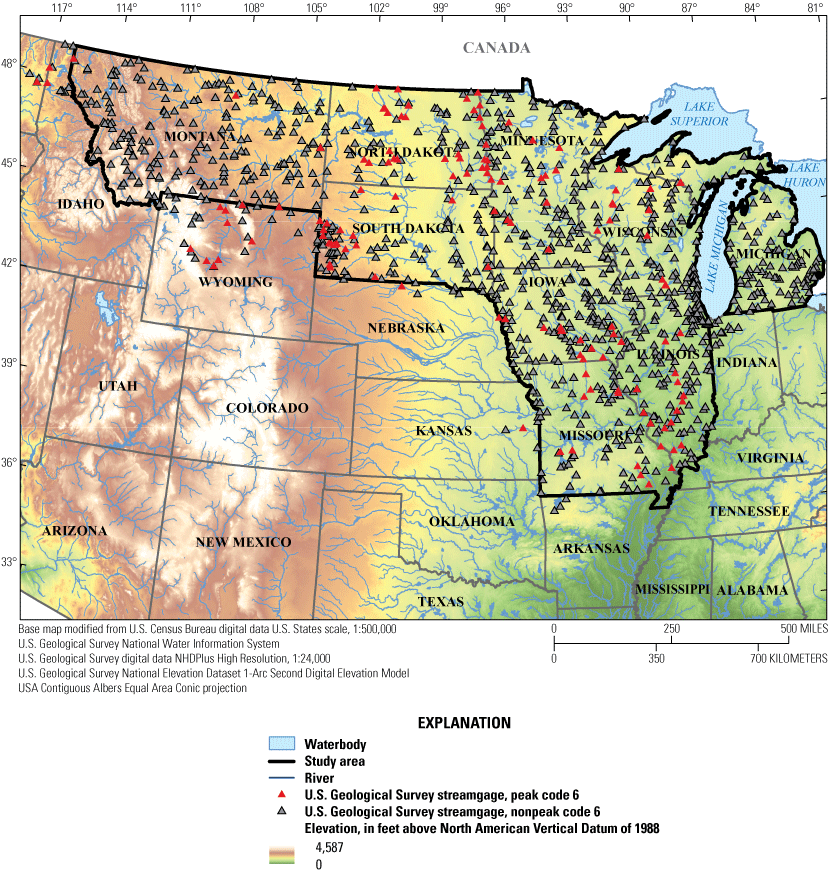
U.S. Geological Survey streamgages with and without peak-streamflow qualification code 6 in the study area.
Methods
An impact metric value denoting a threshold above which a streamgage basin would be considered regulated was established using streamgages with known regulation (streamgages with peaks qualified with code 6). This threshold was developed using streamgages from only eight States, excluding Michigan, because the Michigan Department of Transportation joined the Transportation Pooled Fund study after this portion of the analysis had concluded. The threshold was then applied to a selection of streamgages from the full nine-State study area that do not have peaks qualified with code 6 to determine which of these streamgages had a dam impact metric equal to or greater than the threshold at some point in their periods of record.
Streamgage Selection
Peak data for two sets of streamgages were retrieved from NWIS: those with peaks qualified with code 6 and those without peaks qualified with code 6. Peaks for streamgages in the study area with one or more annual peak flow values with a qualification code 6 were retrieved from NWIS on July 22, 2021 (U.S. Geological Survey, 2021b).
Noncode 6 streamgage peaks were retrieved from NWIS on July 29, 2021, for all but the State of Michigan, for which streamgage peaks were retrieved on November 23, 2021. Noncode 6 streamgages with an end date before October 1, 2018, or with peaks that occurred before water year 1921 were removed from consideration (water year is a continuous 12-month period, from October 1 to September 30, and is identified by the year in which it ends). Noncode 6 streamgages were required to have data from one of the following four periods, with a peak in the first or second water year and at least 80-percent completeness: (1) 1921–2020, (2) 1946–2020, (3) 1971–2020, and (4) 1991–2020. Streamgages outside of the nine-State area that were within basins that contributed to one of the nine States were included, including streamgages from Arkansas (3), Idaho (10), Indiana (14), Kansas (5), Nebraska (4), Washington (5), and Wyoming (31). Peaks for these streamgages were retrieved simultaneously with peaks from the streamgages in the nine States (November 23, 2021, for those associated with Michigan and July 29, 2021, for the rest of the study area). The total number of streamgages used in the study is identified by State in table 1, with 1,157 total streamgages used, 140 of which were from the eight-State area and had at least one peak with a code 6. The remaining 1,017 streamgages came from the nine-State region and did not have any peaks with a code 6.
Table 1.
Number of U.S. Geological Survey streamgages in each State used for the study (U.S. Geological Survey, 2021b).Decadal Dam Impact Metric
The impact metric, DI, developed by Wieczorek and others (2021), is a decadal metric provided for the years 1800–2018 that characterizes the degree of regulation of a given river reach based on the sum of the upstream reservoir storage multiplied by the ratio of the dam drainage area to the NHD flowline drainage area, divided by the volume of precipitation in the NHD flowline basin.
wheren
is the total number of dams upstream from the reach;
d
is the sum index, 1;
Sd
is the dam(s) storage, in acre-feet;
DAd
is the drainage area of the dam(s), in acres;
DAt
is the total upstream contributing area of the NHD flowline, in acres; and
P
is total mean 30-year (1971–2000) upstream annual precipitation, in feet.
Dam drainage area, DAd, represents the watershed area upstream from the dam location, and the NHD flowline drainage area, DAt, is the watershed area upstream from the farthest downstream point on the NHD flowline.
The impact metric represents the effect of reservoir regulation on a given river reach for each decadal period, with dam records selected for each decade by selecting dams with construction dates on or before the end of each decade year (for example, 1990; Wieczorek and others, 2021). The final “decade” is not a complete decade and spans 2011–18. The storage information, sourced from the NID, is included only for dams with completion dates, storage information, and structures that have reservoirs (for example, navigation locks were excluded). The impact metric computation uses the maximum storage from the NID dataset, which represents the total storage space in a reservoir below the maximum attainable water-surface elevation and includes any surcharge storage (U.S. Army Corps of Engineers, 2022). The metric is provided for each flowline in the United States in the form of a “COMID,” which is a unique identification corresponding to every flowline in the NHD NHDPlus Version 2 dataset (U.S. Geological Survey, 2021a).
Linking Regulation Metric to Streamgage Locations
The impact metric dataset provides a value for each flowline in the NHD, but streamgage locations are a single geographic point (Wieczorek and others, 2021). To identify which flowline, and therefore COMID, a streamgage corresponds to, the streamgage watershed information (SWIM) dataset (Hayes and others, 2021) was used. The SWIM dataset provides USGS streamgage locations indexed to the NHDPlus Version 2.1, allowing for a flowline COMID to be retrieved for each streamgage. The impact metric for each decade was then linked to the corresponding streamgage using the shared COMID. Of the 1,157 total streamgages (from all nine States) analyzed here, 17 (about 1.5 percent) had “−9999” COMIDs in the SWIM dataset. The “−9999” designation represents a streamgage that was unable to be snapped to an NHDPlus flowline in the indexing process of the SWIM methodology (Hayes and others, 2021). For these streamgages, the unique COMID of the flowline corresponding to the streamgage location was retrieved using the discover_nhdplus_id() function, which is part of the nhdplusTools R package (Blodgett, 2019). These 17 streamgage locations use coordinates from NWIS (U.S. Geological Survey, 2021b) and are not indexed to the NHDPlus Version 2 flowlines. Streamgage locations from NWIS may not always accurately reflect the location of a streamgage with respect to NHD flowlines, potentially resulting in errors for streamgages not snapped to the NHD. The flowline COMIDs were obtained for all streamgages and matched to the corresponding COMIDs provided in the impact metric dataset (Wieczorek and others, 2021).
Determination of Regulation Threshold
To identify which streamgage basins were regulated, a threshold denoting a regulated basin was established by evaluating the impact metric for streamgages from the eight-State area with peaks qualified with code 6, which denote known regulation in the basin. For the 140 streamgages with peaks qualified with code 6 (table 1), the impact metric was retrieved for decades in which the streamgage had at least one peak code 6, resulting in a decadal impact metric value for the regulated period of record for each streamgage. The median of these decadal values was computed for each streamgage and used as a representative impact metric value for each of the streamgages. Streamgages outside of the eight State area were grouped into the State into which their streamflow contributes for the assessment: 1 streamgage added to Missouri, 13 streamgages added to Montana, and 1 streamgage added to South Dakota.
Application of Regulation Threshold
For streamgages without peaks qualified with code 6, impact metric values were retrieved for all decades in which a streamgage was active. Eight streamgages that have peak code 6 in their period of record were included in the noncode 6 subset by removing the peaks with code 6. If the impact metric was equal to or greater than the established threshold at any point during a streamgage’s active period of record, the streamgage was considered regulated. Although the streamgage was considered regulated in this analysis, it is possible that there are peaks in the record that are unregulated based on the construction date of the dams used for the regulation metric.
Results
An impact metric value denoting a threshold above which a streamgage basin would be considered regulated was established using 140 streamgages and applied to 1,017 streamgages without known regulation (table 1). Results from this assessment are provided in the following sections.
Regulation Threshold
The median impact metric for streamgages with peaks qualified with code 6 varied by State, with the impact metric values ranging from 0 to 7,282 for all 140 streamgages evaluated (fig. 2). Four of the 140 streamgages have an impact metric of zero and are not shown in figure 2 owing to the log-space of the y-axis. The minimum number of streamgages in each State was 12, and the maximum was 31. Wieczorek and others (2021) identify “generic ranges” of the impact metric that correspond to varying effects of regulation on peaks. Values less than 0.05 are “not considered to impact peak flows,” 0.05 to 0.1 are “not likely to affect peak flows,” and 0.1 to 0.2 “may impact minor or ordinary peak flows” (Wieczorek and others, 2021). The values observed at the streamgages evaluated here are as low as 0, with medians between 0.119 and 0.415. Values of 0.05, 0.1, and 0.2 were considered based on the distribution of the data (fig. 2) as well as the ranges provided by Wieczorek and others (2021). A group of USGS subject matter experts from each of the States in the study convened to examine the results and the implications of designating sites as regulated at differing thresholds. To ensure a threshold that captures the low end of the median impact metric distribution across all eight States was selected (fig. 2), a threshold of 0.1 was chosen to represent regulated streamgage basins in the study area. An impact metric less than 0.1 in this study area is expected to denote a basin that does not have a substantial regulation signal in the distribution of peaks.
Identification of Regulated Basins
Regulated basins in the study area were identified by applying the established threshold of 0.1 to each noncode 6 streamgage. Of the 1,017 noncode 6 streamgages (some with code 5 peaks, denoting an unknown degree of regulation or diversion) evaluated, 136 (about 13 percent) had an impact metric over 0.1 at some point in their periods of record. Of those 136 streamgages, a minimum impact metric of 0 and maximum of 5,085 was observed. The large range of the impact metric indicates there is a large variation in the degree of impact of regulation greater than the identified 0.1 threshold. For the 136 streamgages identified as regulated, the median impact metric of the entire active period of record is presented in table 2 and figure 3. A small number of regulated streamgages had a median impact metric less than 0.1 during their entire active period of record, despite their maximum impact metric value being greater than the 0.1 threshold.
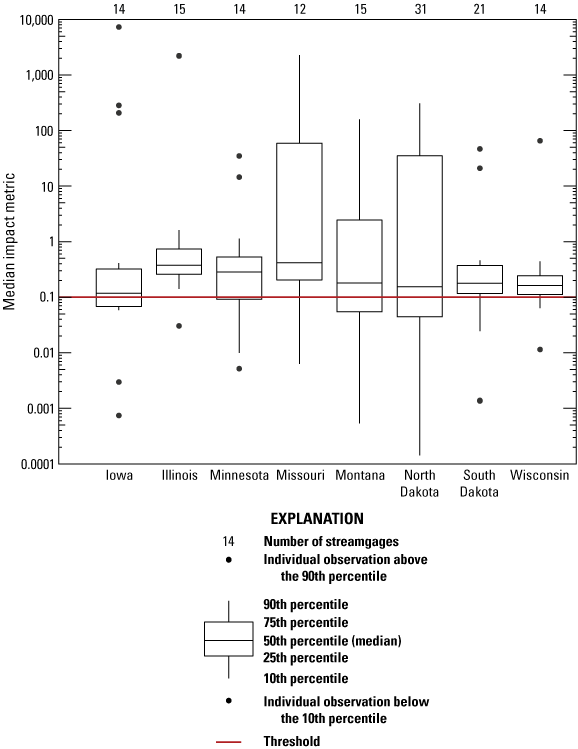
Distribution of the median impact metric by State for the U.S. Geological Survey streamgages with peaks qualified with code 6 in the study area.
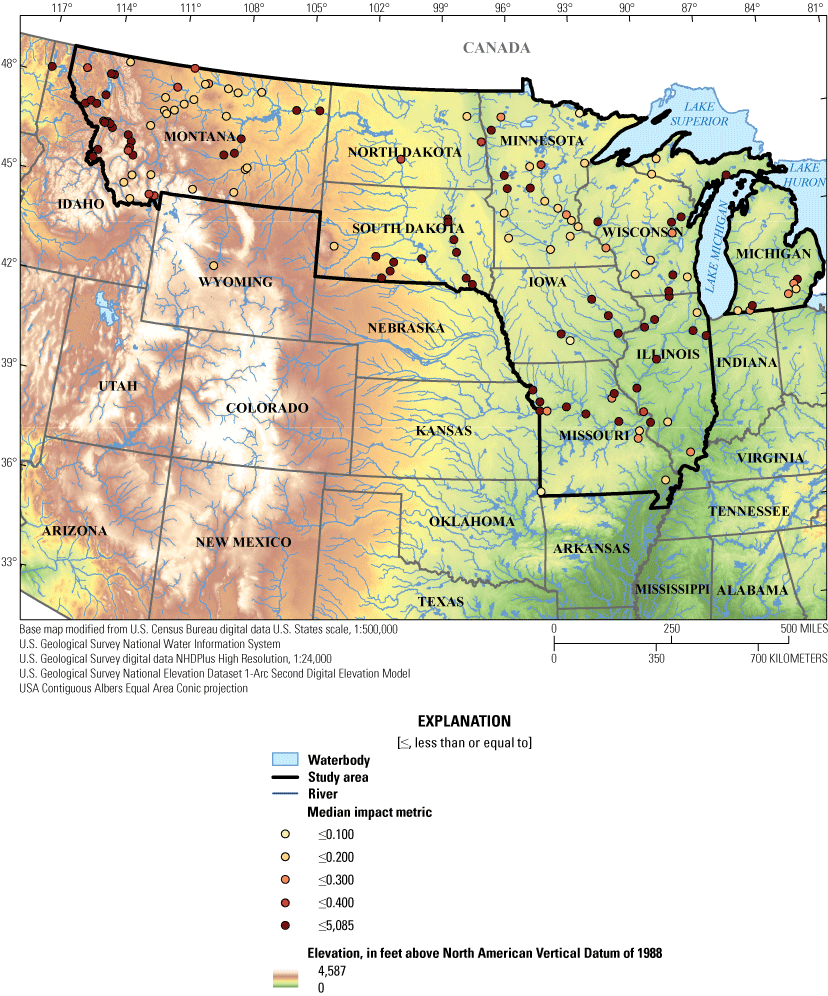
Median impact metric of U.S. Geological Survey streamgages with an impact metric equal to or greater than the 0.1 threshold at some point in their active period of record.
Table 2.
U.S. Geological Survey streamgages without annual peak streamflow values qualified as regulated (code 6) that were determined to be regulated in this evaluation.[YYYY, year; MM, month; DD, day]
Limitations
This analysis was conducted in an effort to establish a method that consistently identifies the degree of regulation at USGS streamgage basins over large regions and apply this method to a nine-State study area. Although this method allows for a consistent approach over a large area and integrates important information to consider when assessing potential regulation effects on peak flows, like upstream storage and watershed area, it also has limitations. Several of these limitations are mentioned in the metadata that accompanies the original impact metric dataset (Wieczorek and others, 2021). The NID contains more than 91,000 dams that meet a list of criteria: dams that would result in a loss of human life or disrupt access to critical facilities or damage facilities if there was downstream flooding, dams that equal or exceed 25 feet in height and exceed 15 acre-feet in storage, or dams with storage greater than or equal to 50 acre-feet and exceeding 6 feet in height (U.S. Army Corps of Engineers, 2018). Some dams that meet these criteria are not yet included in the NID. Additionally, dams that do not meet these criteria are not included in the NID and thus are not included in the impact metric dataset (Wieczorek and others, 2021). There are other alterations of streamflow on the landscape, such as diversions for irrigation or municipal supply and small dams associated with water rights (such as stock dams), and these alternations do not meet the criteria for inclusion in the NID (McCarthy and others, 2016). Data are sparse for small impoundments, which has made understanding their effect on all metrics of streamflow difficult, but the density of impoundments has a cumulative effect on streamflow and small impoundments alter low streamflow conditions (Brogan and others, 2021). Dams are occasionally removed, and how the removal of these structures is handled by the NID is not clear. Some dam reservoirs that function as run-of-the-river dams, which do not affect downstream streamflow in the same way as a dam that retains flow, are included in the NID dataset and may lead to overestimation on regulation impact in some cases. Additionally, in study areas such as this one, that border Canada or Mexico, there often are long-term streamgages (for monitoring of transboundary waters) with part of the drainage area outside of the United States, and extraterritorial dams are not in the NID. These streamgages are often of interest because of their long record and may require subject matter expertise, searching of databases from the other country, or extensive examination of maps looking for reservoirs. Dams with no completion date were not included in the impact metric dataset (Wieczorek and others, 2021); of more than 91,000 dams in the NID, about 17 percent of dams do not have a completion date (U.S. Army Corps of Engineers, 2018). The impact metric computation uses the maximum storage from the NID dataset, which represents the maximum amount of water that can be stored behind each dam and may lead to an overestimation of the real effects of dam storage on the streamgage basins.
The dams used in this study were snapped to NHD flowlines using automated procedures that require that the NID dam location coordinates be relatively accurate. The quality of the dam locations varies among regions and through time, and improvements on the dam locations could alter the results presented in this report. For example, in Montana, these dams were reviewed and revised for implementation in a web-based application and this effort determined that many of the dams were mislocated in the NID (Pete McCarthy, USGS, written commun., 2022). Some dams were also determined to not be on the main river system but were snapped to flowlines in the analysis. A smaller scale, State-based evaluation would likely find many of these metrics to be different, in some cases substantially.
The NHDPlus data are another input into the impact metric dataset and do include some network errors for flowlines, streamgage locations, and dam locations (Wieczorek and others, 2018). Improved flowline network representations could improve the accuracy of the impact metric used in this report. The large range of impact metric values for the streamgages evaluated indicate that in some instances the degree of regulation is far beyond the 0.1 threshold identified. Further evaluation of these instances would help the understanding of where improvements to the dataset may be made.
The limitations of this method may vary depending on the region where it is applied. In the nine-State study area used in this report, it seems that the most common result of these limitations was streamgages being incorrectly identified as regulated. For example, Andresen Coulee near Custer, Montana (USGS streamgage 06294400), which, based on local knowledge and observance on aerial imagery, has no dams within the basin, has a median impact metric of 0.162 during its period of record in this analysis. This instance may be a result of incorrect NID dam locations or incorrect snapping of those dam locations to NHD flowlines. When used as a screening tool to remove regulated basins, a more conservative approach (where unregulated basins are removed incorrectly) is less problematic than if regulated basins are incorrectly included. However, depending on where and how this method is applied, additional evaluation of results may be necessary. The large scale of this evaluation method will naturally have less detail at the local level that may otherwise be present in an approach that integrates institutional knowledge from subject matter experts. Future improvements to the data available may allow for refinements of the dam metric or the threshold selection.
Summary
Determining a set of streamgages that are not affected by regulation is a common exercise among scientists conducting various hydrologic studies. Different methods have been used to establish which streamgages are relatively unregulated in U.S. Geological Survey studies, but inconsistencies in datasets make some methods difficult to apply over a large study region. A recent U.S. Geological Survey data release provides a decadal impact metric, based on the sum of the upstream reservoir storage multiplied by the ratio of the dam drainage area to the National Hydrography Dataset flowline drainage area, divided by the volume of precipitation in the National Hydrography Dataset flowline, which characterizes the degree of regulation of a given river reach, allowing for a more systematic approach. A threshold denoting regulation was established using impact metric values from streamgages in eight States with peaks qualified with code 6, which have known regulation or diversion. This threshold was applied to streamgages in the nine-State study area to identify regulated basins. Using this dataset, 140 streamgages in the study area with known regulation (peaks qualified with code 6) were evaluated for their impact metric values in decades with code 6 peaks. A threshold value of 0.1 was identified as the value most characteristic of the regulated streamgages in the study area. This threshold was used to identify noncode 6 streamgages in the study area that had an impact metric equal to or greater than the identified threshold at some time in their active period of record. Impact metric values for 1,017 noncode 6 streamgages (some with code 5 peaks) were evaluated. Thirteen percent of streamgages examined (136 of 1,017 streamgages) had an impact metric equal to or greater than the identified regulated threshold at some point in their periods of record.
References Cited
Asquith, W.H., 2001, Effects of regulation on L-moments of annual peak streamflow in Texas: U.S. Geological Survey Water-Resources Investigations Report, WRIR 01–423, 66 p., accessed December 2021 at https://pubs.usgs.gov/wri/wri014243/.
Blodgett, D., 2019, nhdplusTools—Tools for accessing and working with the NHDPlus: U.S. Geological Survey software release, accessed December 2021 at https://doi.org/10.5066/P97AS8JD.
Brogan, C., Burgholzer, R., Keys, T., Kleiner, J., Shortridge, J., and Scott, D., 2021, The cumulative role of impoundments in streamflow alteration: Journal of the American Water Resources Association, v. 58, no. 1, p. 119–133. [Also available at https://doi.org/10.1111/1752-1688.12979.]
Collier, M., Webb, R.H., and Schmidt, J.C., 1996, Dams and rivers—A primer on the downstream effects of dams: U.S. Geological Survey Circular 1126, 94 p. [Also available at https://doi.org/10.3133/cir1126.]
Falcone, J.A., 2011, GAGES-II—Geospatial Attributes of Gages for Evaluating Streamflow: U.S. Geological Survey Unnumbered Series, accessed July 15, 2015, at https://doi.org/10.3133/70046617.
Falcone, J.A., Carlisle, D.M., Wolock, D.M., and Meador, M.R., 2010, GAGES—A stream gage database for evaluating natural and altered flow conditions in the conterminous United States: Ecology, v. 91, no. 2, p. 621. [Also available at https://doi.org/10.1890/09-0889.1.]
Hayes, L., Chase, K.J., Wieczorek, M.E., and Jackson, S.E., 2021, USGS streamgages in the conterminous United States indexed to NHDPlus v2.1 flowlines to support Streamgage Watershed InforMation (SWIM): U.S. Geological Survey data release, accessed December 2021 at https://doi.org/10.5066/P9J5CK2Y.
Hirsch, R.M., and Ryberg, K.R., 2012, Has the magnitude of floods across the USA changed with global CO2 levels?: Hydrological Sciences Journal, v. 57, no. 1, p. 1–9. [Also available at https://doi.org/10.1080/02626667.2011.621895.]
Hodgkins, G.A., Dudley, R.W., Archfield, S.A., and Renard, B., 2019, Effects of climate, regulation, and urbanization on historical flood trends in the United States: Journal of Hydrology, v. 573, p. 697–709. [Also available at https://doi.org/10.1016/j.jhydrol.2019.03.102.]
Lins, H.F., 2012, USGS Hydro-Climatic Data Network 2009 (HCDN–2009): U.S. Geological Survey Fact Sheet 2012–3047, 4 p., accessed March 23, 2018, at https://doi.org/10.3133/fs20123047.
McCarthy, P., Dutton, D.M., Sando, S.K., and Sando, R., 2016, Montana StreamStats—A method for retrieving basin and streamflow characteristics in Montana: Chapter A in Montana StreamStats: U.S. Geological Survey Scientific Investigations Report 2015–5019A, 26 p., accessed December 2021 at https://doi.org/10.3133/sir20155019A.
Ryberg, K.R., 2008, PFReports—A program for systematic checking of annual peaks in NWISWeb: U.S. Geological Survey Open-File Report 2008–1284, 17 p., accessed November 3, 2017, at https://doi.org/10.3133/ofr20081284.
Ryberg, K.R., Akyüz, F.A., Wiche, G.J., and Lin, W., 2016, Changes in seasonality and timing of peak streamflow in snow and semi-arid climates of the north-central United States, 1910–2012: Hydrological Processes, v. 30, no. 8, p. 1208–1218. [Also available at https://doi.org/10.1002/hyp.10693.]
Ryberg, K.R., Goree, B.B., Williams-Sether, T., and Mason, R.R., Jr., 2017, The U.S. Geological Survey peak-flow file data verification project, 2008–2016: U.S. Geological Survey Scientific Investigations Report 2017–5119, 61 p., accessed November 6, 2017, at https://doi.org/10.3133/sir20175119.
Ryberg, K.R., Hodgkins, G.A., and Dudley, R.W., 2020, Change points in annual peak streamflows—Method comparisons and historical change points in the United States: Journal of Hydrology, v. 583, p. 124307. [Also available at https://doi.org/10.1016/j.jhydrol.2019.124307.]
Ryberg, K.R., Lin, W., and Vecchia, A.V., 2014, Impact of climate variability on runoff in the north-central United States: Journal of Hydrologic Engineering, v. 19, no. 1, p. 148–158. [Also available at https://doi.org/10.1061/(ASCE)HE.1943-5584.0000775.]
Sando, S.K., Driscoll, D.G., and Parrett, C., 2008, Peak-flow frequency estimates based on data through water year 2001 for selected streamflow-gaging stations in South Dakota: U.S. Geological Survey Scientific Investigations Report 2008–5104 367 p., accessed December 2021 at https://doi.org/10.3133/sir20085104.
Sando, S.K., and McCarthy, P.M., 2018, Methods for peak-flow frequency analysis and reporting for streamgages in or near Montana based on data through water year 2015: U.S. Geological Survey Scientific Investigations Report 2018–5046, 39 p., accessed December 2021 at https://doi.org/10.3133/sir20185046.
Slack, J.R., and Landwehr, J.M., 1992, Hydro-climatic data network (HCDN); a U.S. Geological Survey streamflow data set for the United States for the study of climate variations, 1874–1988: U.S. Geological Survey Open-File Report 92–129, accessed June 2021 at https://doi.org/10.3133/ofr92129.
U.S. Army Corps of Engineers, 2018, National inventory of dams: U.S. Army Corps of Engineers, accessed November 05, 2021, at https://nid.usace.army.mil/#/.
U.S. Army Corps of Engineers, 2022, National Inventory of Dams data dictionary: U.S. Army Corps of Engineers, 12 p., accessed October 2022 at https://usace-cwbi-prod-il2-nld2-docs.s3-us-gov-west-1.amazonaws.com/c72a02de-5e8e-405d-b64b-eb87b3cbe393/NID%20Data%20Dictionary%20August%202022.pdf.
U.S. Geological Survey, 2021a, National Hydrography Dataset: accessed December 2021 at https://www.usgs.gov/national-hydrography/national-hydrography-dataset.
U.S. Geological Survey, 2021b, USGS water data for the Nation: U.S. Geological Survey National Water Information System database, accessed June 2021 at https://doi.org/10.5066/F7P55KJN.
U.S. Geological Survey, 2021c, USGS 05054000, Red River of the North at Fargo, North Dakota, in USGS water data for the Nation: U.S. Geological Survey National Water Information System database, accessed January 31, 2023, at https://doi.org/10.5066/F7P55KJN. [Site information directly accessible at https://nwis.waterdata.usgs.gov/nwis/peak?site_no=05054000&agency_cd=USGS&format=rdb.]
Wieczorek, M.E., Jackson, S.E., and Schwarz, G.E., 2018, Select attributes for NHDPlus Version 2.1 reach catchments and modified network routed upstream watersheds for the conterminous United States (ver. 3.0, January 2021): U.S. Geological Survey data release, accessed June 2021 at https://doi.org/10.5066/F7765D7V.
Wieczorek, M.E., Wolock, D.M., and McCarthy, P.M., 2021, Dam impact/disturbance metrics for the conterminous United States, 1800 to 2018: U.S. Geological Survey data release, accessed June 2021 at https://doi.org/10.5066/P92S9ZX6.
Datum
Vertical coordinate information is referenced to the North American Vertical Datum of 1988 (NAVD 88).
Horizontal coordinate information is referenced to the USA Contiguous Albers Equal Area Conic projection.
Elevation, as used in this report, refers to distance above the vertical datum.
For more information about this publication, contact:
Director, USGS Central Midwest Water Science Center
405 North Goodwin
Urbana, IL 61801
217–328–8747
For additional information, visit: https://www.usgs.gov/centers/cm-water
Publishing support provided by the
Rolla and Reston Publishing Service Centers
Disclaimers
Any use of trade, firm, or product names is for descriptive purposes only and does not imply endorsement by the U.S. Government.
Although this information product, for the most part, is in the public domain, it also may contain copyrighted materials as noted in the text. Permission to reproduce copyrighted items must be secured from the copyright owner.
Suggested Citation
Marti, M.K., and Ryberg, K.R., 2023, Method for identification of reservoir regulation within U.S. Geological Survey streamgage basins in the Central United States using a decadal dam impact metric: U.S. Geological Survey Open-File Report 2023–1034, 15 p., https://doi.org/10.3133/ofr20231034.
ISSN: 2331-1258 (online)
Study Area
| Publication type | Report |
|---|---|
| Publication Subtype | USGS Numbered Series |
| Title | Method for identification of reservoir regulation within U.S. Geological Survey streamgage basins in the Central United States using a decadal dam impact metric |
| Series title | Open-File Report |
| Series number | 2023-1034 |
| DOI | 10.3133/ofr20231034 |
| Publication Date | April 20, 2023 |
| Year Published | 2023 |
| Language | English |
| Publisher | U.S. Geological Survey |
| Publisher location | Reston, VA |
| Contributing office(s) | Dakota Water Science Center, Central Midwest Water Science Center |
| Description | Report: vi, 15 p.; 2 Data Releases; 2 Datasets |
| Country | United States |
| State | Iowa, Illinois, Michigan, Missouri, Montana, North Dakota, South Dakota, Wisconsin |
| Online Only (Y/N) | Y |