

Ecological Effects of Pinyon-Juniper Removal in the Western United States—A Synthesis of Scientific Research, January 2014–March 2021
Links
- Document: Report (96 MB pdf) , HTML , XML
- Download citation as: RIS | Dublin Core
Acknowledgments
The authors thank the Bureau of Land Management, who requested and supported this work. We also acknowledge the researchers who conducted studies included in this review. Lastly, we are grateful to Dr. Madelon Case (U.S. Geological Survey) and Dr. John Severson (U.S. Geological Survey) for providing helpful feedback on an earlier version of this report.
Executive Summary
Increasing density of pinyon pine (Pinus spp.) and juniper (Juniperus spp.) woodlands (hereinafter “pinyon-juniper”), as well as expansion of these woodlands into adjacent shrublands and grasslands, has altered ecosystem function and wildlife habitat across large areas of the interior western United States. Although there are many natural and human-caused drivers of woodland infilling and expansion, restoration of sagebrush (Artemisia spp.) habitat through removal of pinyon-juniper is considered an urgent management objective in many locations, particularly in support of sagebrush-dependent wildlife species of conservation concern. In December 2020, the Bureau of Land Management (BLM) established the Pinyon-Juniper Management Categorical Exclusion (PJCX) to expedite the regulatory process for pinyon-juniper removal projects on public lands, largely intended to benefit mule deer (Odocoileus hemionus) and greater sage-grouse (Centrocercus urophasianus) habitats. During final preparation of this report, the BLM discontinued use of the PJCX (as of November, 2022), but the pinyon-juniper tree removal techniques assessed in this report are commonly used and understanding their effects remains relevant to land use planning.
To address areas of uncertainty relative to potential ecological effects of the PJCX, we conducted a review of the peer-reviewed science literature to better understand the likely responses of vegetation, environmental (for example, soils), and wildlife variables to specific tree removal techniques permitted by the PJCX. In brief, the PJCX permitted removal of trees by either manual cutting, mechanical cutting, or mastication; allowed certain methods to redistribute or remove resulting tree biomass after treatment; and prohibited broadcast burning, roadbuilding, removal of old-growth, and seeding of non-native species. Specifically, we conducted our review to address the following questions:
-
1. How will PJCX removal techniques affect plant communities, soils, and abiotic resources?
-
2. How do these pinyon-juniper removal techniques affect wildlife communities, including both woodland- and sagebrush-dependent species?
-
3. What are the potential ecological implications of different pinyon-juniper removal treatment types and implementation strategies (for example, treatment sizes) over time?
-
4. What are the most important gaps in our scientific understanding of how treatments might affect targeted ecosystems over space and time (for example, potential effects of climate change)?
To answer these questions, we considered studies related to pinyon-juniper ecosystems, focusing on research that occurred over a large portion of the interior western United States that is the primary focus of the PJCX. We also focused on papers published from 2014 onward, to avoid excessive overlap with other recent reviews on pinyon-juniper management effects. Using strict criteria, including only considering research that tested responses for statistical significance, we identified 48 papers that primarily examined treatment effects on vegetation and other environmental variables (1,709 responses), and 11 papers that addressed effects on wildlife (132 responses). Responses to the PJCX-permitted treatments were summarized as either positive (that is, a significant increase), negative (that is, a significant decrease), or non-significant (that is, no significant difference). Responses were assigned to categories (for example, Native Annual Grass/Forb Abundance) and hierarchical treatment levels.
We found that there were large proportions of non-significant responses among all categories combined, with roughly half or more of all responses non-significant (48 percent for wildlife, 60 percent for vegetation-environmental), comparable to other recent systematic reviews of pinyon-juniper treatment effects. However, we also found that when there were significant responses, some important trends potentially emerged. Important undesirable outcomes included far more positive than negative responses of exotic grass and forb abundance among nearly all treatment types. Cutting treatments were also more likely to decrease biocrust cover and microbial activity. Potentially beneficial outcomes included mostly positive responses among sagebrush obligate species, including more positive than negative responses for mule deer and sage-grouse. Some treatment types (for example, mastication) also resulted in more positive than negative responses for native grasses and forbs (although, non-significant responses were the majority). We also highlighted many limitations of this review, including how responses often come from few studies, and how some response-treatment category combinations lack adequate response data. Moreover, the existing research is often insufficient to address many key questions about treatment effects, largely owing to short time-scales and limited spatial extents of observations, which do not match the size of treatments being implemented by land managers, nor capture long-term, post-treatment ecological dynamics. We also identify a lack of research that addresses key interactions that could undermine restoration objectives, including potential effects of climate change and grazing on post-treatment environments. Thus, we emphasize the importance of integrating these factors into future pinyon-juniper treatment research, and we stress the need for use of monitoring programs and research studies that partake in data collection and analysis over long durations and broad spatial scales.
Introduction
Pinyon pine (Pinus spp.) and juniper (Juniperus spp.) trees are the foundation species of wooded ecosystems (that is, “pinyon-juniper” woodlands and savannas) that are estimated to cover at least 33 million hectares (ha) in the 11 western United States (Romme and others, 2009; Miller and others, 2019). Pinyon-juniper ecosystems provide valuable habitat for numerous wildlife species, and Native Americans traditionally relied on these trees (especially pinyon pine) for resources including materials, medicine, and food (Monsen and Stevens, 1999; Stevens, 2002). Prior to Euro-American settlement, the area covered by pinyon-juniper ecosystems expanded and retracted over time, largely varying in response to shifts in climate and associated changes in disturbance regimes (Miller and Wigand, 1994). After Euro-American settlement began in the late 19th century, pinyon-juniper ecosystems were often cut or cleared for a variety of reasons, including to produce timber and fuel for mining activities and to increase forage for livestock (Miller and others, 2019). However, land-uses such as livestock grazing and fire exclusion, as well as changes in climate, have enhanced growing conditions for pinyon and juniper trees across portions of their range (Romme and others, 2009; Shinneman and Baker, 2009; Miller and others, 2019).
There is concern among land managers and others that infilling of existing pinyon-juniper stands and expansion of pinyon and juniper trees into adjacent sagebrush (Artemisia spp.) shrubland and grassland ecosystem types are changing the availability of biotic and abiotic resources, altering wildlife habitat, and increasing vulnerability to erosion and severe disturbance events (Miller and others, 2019; Hartsell and others, 2020). As a result, restoration of sagebrush habitat to support sagebrush-dependent species is a key focus of pinyon-juniper woodland reduction and tree removal across large portions of the interior western United States (Reinhardt and others, 2020; Natural Resources Conservation Service [NRCS], 2021). Pinyon-juniper removal is considered a particularly urgent management objective in ecosystems that support populations of the greater sage-grouse (Centrocercus urophasianus), a sagebrush-obligate species that is considered at risk throughout its range due to declining habitat (Farzan and others, 2015; Remington and others, 2021). Because of this urgency, in December of 2020, the Bureau of Land Management (BLM) established the Pinyon-Juniper Management Categorical Exclusion (PJCX; Department of the Interior [DOI], 20201 ) based in part on a BLM verification report that found the removal of pinyon-juniper is a “…category of action that normally does not result in significant effects” (Bureau of Land Management [BLM], 2020). Categorical exclusions are a regulatory approach that can expedited land management actions in accordance with the National Environmental Policy Act (NEPA) following review by the Council on Environmental Quality (https://ceq.doe.gov/nepa-practice/categorical-exclusions.html). The PJCX expedites the process for pinyon-juniper removal projects because the permitted treatment methods were generally not expected to have a “significant effect on the quality of the human environment” and, therefore, analysis through an environmental assessment or environmental impact statement was not required for NEPA compliance (BLM, 2020). Moreover, the BLM developed the PJCX in response to a U.S. Department of Interior (DOI, 2017) Secretarial Order to “advance the goals of enhancing and restoring habitat” for greater sage-grouse and mule deer (Odocoileus hemionus). Thus, a stated goal of the PJCX was to enhance and restore wildlife habitat through “management of encroaching pinyon pine and juniper trees for the benefit of mule deer and sage-grouse habitats” (BLM, 2020).
During final preparation of this report, the proposed BLM PJCX was discontinued (https://www.blm.gov/policy/pim-2023-002)
Given the tremendous range of environmental and climate conditions suitable for pinyon-juniper and sagebrush ecosystems in the western United States (Baker and Shinneman, 2004; Romme and others, 2009), there is likely great variability in ecological response to the various pinyon-juniper removal treatment types (for example, Creutzburg and others, 2014; Bates and others, 2014a; Roundy and others, 2014a). Previous literature reviews on the effects of pinyon-juniper treatments (for example, Jones, 2019; Miller and others, 2019) have emphasized that although pinyon-juniper removal can have ecological benefits (for example, enhanced perennial herbaceous cover, reduced soil-water runoff), it may also produce undesirable effects (for example, increased exotic plant cover). Research and literature reviews on treatment effects have also shown that pinyon-juniper tree removal can benefit some grassland- and shrubland-associated wildlife species (for example, Olsen and others, 2021a), but positive trends have not been evident for most species or taxonomic/functional groups, including some sagebrush-dependent species (Bombaci and Pejchar, 2016; Jones, 2019). Moreover, even when pinyon-juniper removal accomplishes near-term goals, the long-term responses of plant communities and wildlife species are understudied and thus often remain uncertain (Bombaci and Pejchar, 2016; Hartsell and others, 2020). Such variability in response and uncertainty regarding duration of treatment effects are problematic for land managers who wish to thin or remove pinyon and juniper trees to protect biological and environmental resources from consequences of woodland expansion. Indeed, predicting the ecological effects of pinyon-juniper removal treatments remains challenging, even with the aid of recent literature reviews on this topic (for example, Bombaci and Pejchar, 2016; Jones, 2019; Miller and others, 2019), in part due to knowledge gaps regarding post-treatment ecosystem response under a diversity of environmental settings, developmental stages, natural disturbance dynamics, treatment approaches, and time periods (Baker and Shinneman, 2004; Romme and others, 2009; Hartsell and others, 2020).
To better address these areas of uncertainty relative to the PJCX, we conducted a literature review on the effects of the specific pinyon and juniper removal techniques permitted by the PJCX. Our overarching goal was to assess the peer-reviewed science to summarize the potential ecological effects of these treatments as they pertain to pinyon-juniper and sagebrush ecosystem components, processes, and habitat. Specifically, we conducted our review to address the following questions:
-
1. How will PJCX removal techniques affect plant communities, soils, and abiotic resources?
-
2. How do these pinyon-juniper removal techniques affect wildlife communities, including both woodland- and sagebrush-dependent species?
-
3. What are the potential ecological implications of different pinyon-juniper removal treatment types and implementation strategies (for example, treatment sizes) over time?, and
-
4. What are the most important gaps in our scientific understanding of how treatments might affect targeted ecosystems over space and time (for example, potential effects of climate change)?
To answer these questions, we considered studies from pinyon-juniper ecosystems occurring over a variety of environmental settings in the 11 western United States that were most likely to be targeted by treatments permitted by the PJCX. To set the stage for our review, we provide background information that describes the pinyon-juniper species and ecosystems most likely to be affected by the PJCX, the effects of tree expansion into sagebrush ecosystems and for associated wildlife, and the historical management of pinyon-juniper woodlands, including treatment methods permitted under the PJCX.
Background
Pinyon and Juniper Species and Ecosystems Addressed in this Review
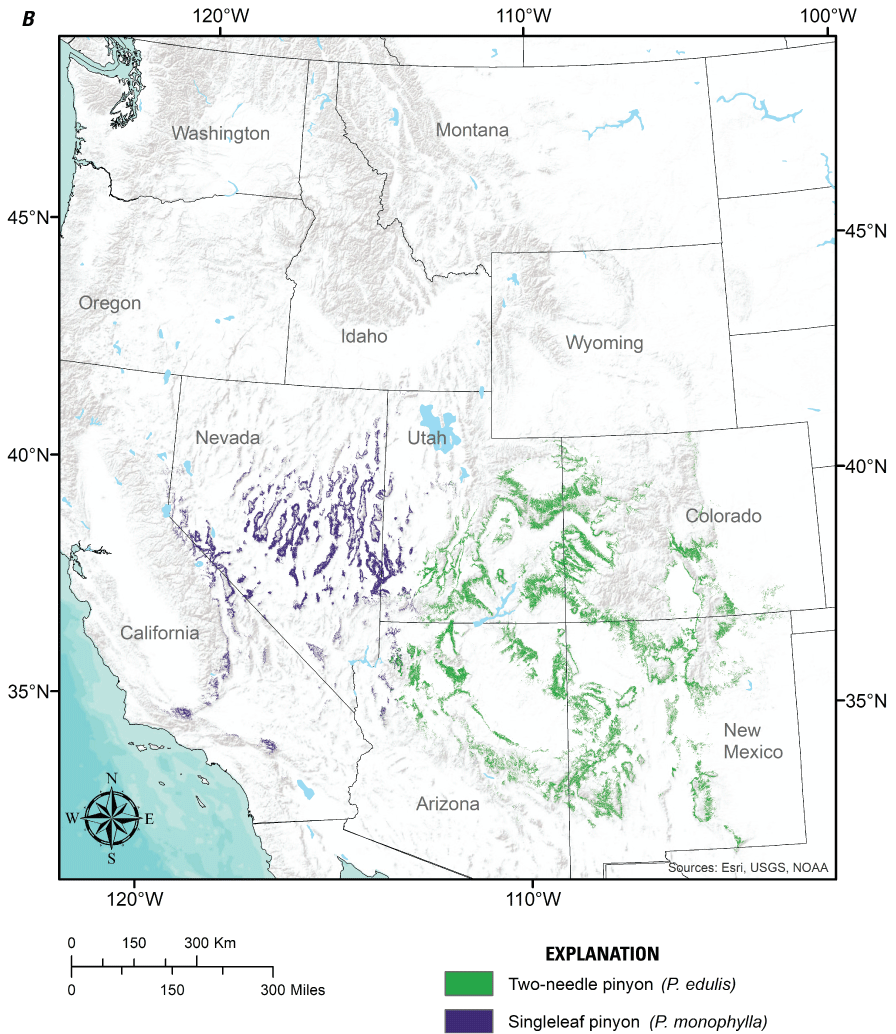
We focused our review on six widespread pinyon and juniper tree species of the interior western United States (fig. 1) that primarily occupy semiarid environments with cool to cold winters, are often the focus of woodland reduction treatments, and have ranges that overlap substantially with both greater sage-grouse (fig. 2) and mule deer (fig. 3), which are the primary wildlife species expected to benefit from treatments permitted by the PJCX. These tree species include western juniper (Juniperus occidentalis), Utah juniper (J. osteosperma), oneseed juniper (J. monosperma), Rocky Mountain juniper (J. scopulorum), singleleaf pinyon (Pinus monophylla), and two-needle pinyon (P. edulis). We do not consider pinyon and juniper species that are primarily found in Madrean woodlands farther south, more humid climates to the east, warm to hot Mediterranean climates to the southwest (for example, J. ashei, J. deppeana, J. pinchotii, J. virginiana, P. cembroides, P. quadrifolia), or at high elevations in the Sierra Nevada (J. grandis). These tree species are assumed not to be the focus of the PJCX, as they are generally distant from historical sage-grouse populations and, with the exception of J. deppeana, only marginally overlap with the range of mule-deer.
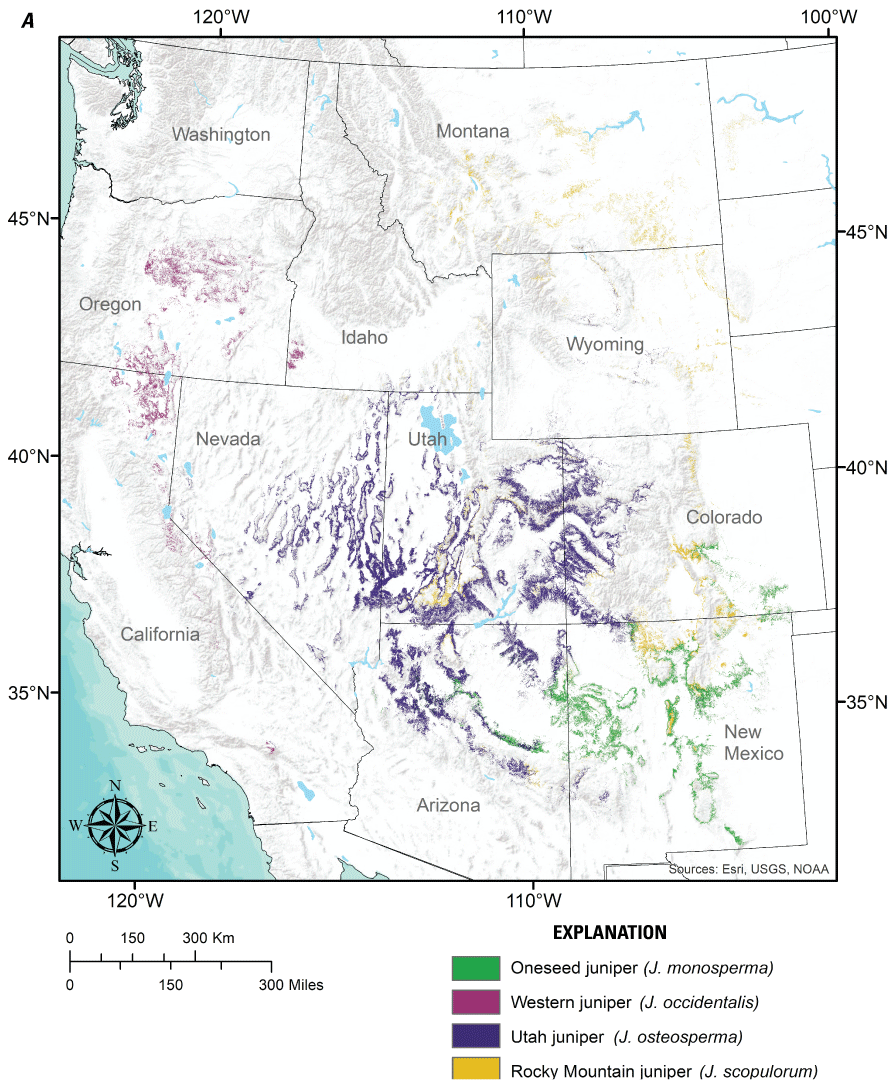
Distributions of (A) the four juniper species (Juniperus spp.) and (B) two pinyon pine species (Pinus spp.) considered in this review. Distribution data obtained from the U.S. Forest Service National Individual Tree Species Atlas (Ellenwood and others, 2015).
![A map of the western United States and Canada, depicting the approximate contemporary
distribution (believed to be occupied in the late 1990s) and historical distribution
(estimated maximum extent from the early 1800s to the present [late 1990s]) of the
greater sage-grouse (Centrocercus urophasianus) and Gunnison sage-grouse (C. minimus).
The historical distribution covers more area and is more contiguous than the current
distribution.](https://pubs.usgs.gov/of/2023/1041/images/ofr20231041_fig02.png)
Approximate contemporary distribution (believed to be occupied in the late 1990s) and historical distribution (estimated maximum extent from the early 1800s to the present [late 1990s]) of the greater sage-grouse (Centrocercus urophasianus) and Gunnison sage-grouse (C. minimus; Data Basin, 2014).
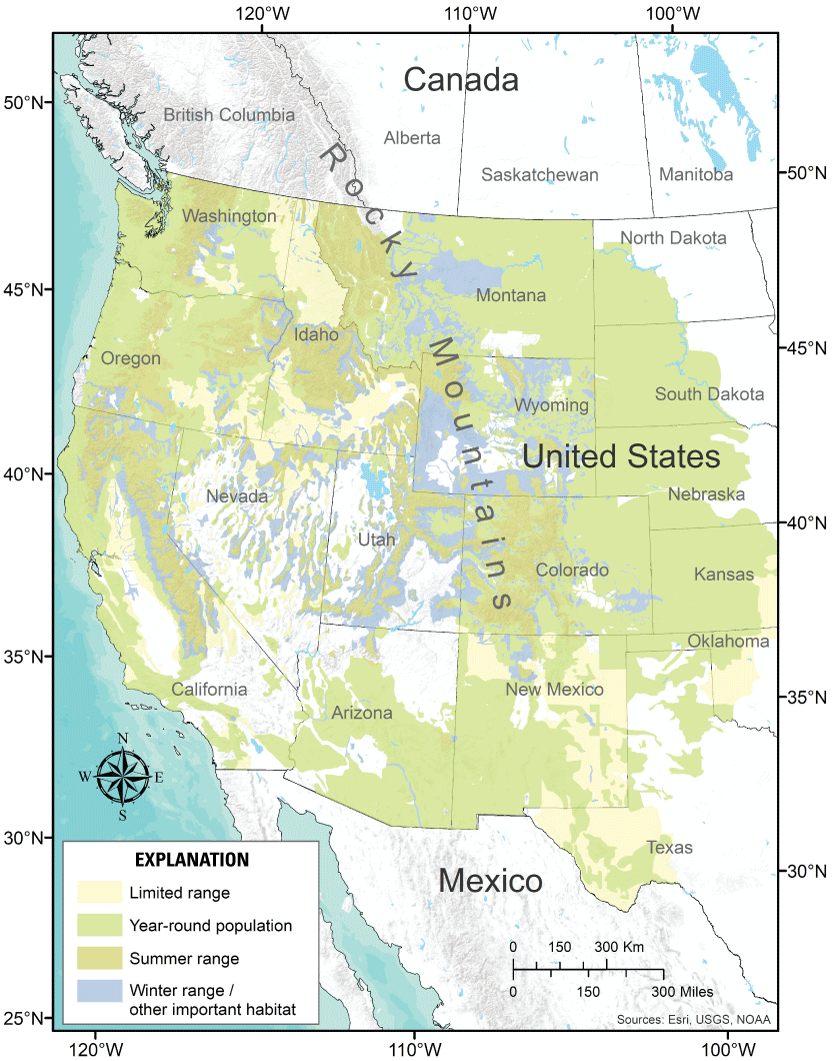
Mule deer (Odocoileus hemionus) range classifications in the United States (Utah State University, 2005).
The six pinyon and juniper species collectively span a distributional gradient from winter- to summer-dominated precipitation regimes. This gradient occurs along a generally northwest to southeast extent of the western United States, culminating in relatively strong summer monsoonal precipitation regimes in the interior southwestern United States. Three of the juniper species of interest are distributed uniquely along this gradient, with only marginal range overlap (fig. 1A). J. occidentalis is primarily found in the northwestern Great Basin, where a large majority of annual precipitation falls in winter to early spring as snow or rain. J. monosperma is located in the southeastern portion of the western interior U.S., where summer monsoonal precipitation is substantial and can comprise more than half of annual precipitation. J. osteosperma is geographically intermediate to the other two juniper species, mostly occurring on the Colorado Plateau and in central and northeastern portions of the Great Basin, where precipitation regimes range from seasonally bimodal (to the east) to winter dominated (in the west). Scattered populations of these juniper species also occur elsewhere, including the Columbia Plateau and coastal ranges (J. occidentalis), Wyoming Basin (J. osteosperma), and southwestern High Plains (J. monosperma). J. scopulorum has more substantial range overlap with the three other juniper species, but it typically occurs with cooler soil temperature regimes and higher elevations, and it also extends into the northern Rocky Mountains and northwestern Great Plains.
Similar to junipers, the distributions of pinyon pine species (fig. 1B) are also influenced by seasonal gradients in precipitation. P. monophylla is found throughout the central Great Basin and into southern California, where most precipitation arrives during winter and spring. P. edulis occupies the Colorado Plateau, scattered locations in the Southern Rocky Mountains, and the mountains/plateaus of Arizona and New Mexico, where precipitation regimes are moderately to strongly bimodal (summer-winter). Overlapping species ranges result in extensive cover of pinyon-juniper woodlands consisting of P. monophylla and J. occidentalis in the central Great Basin, P. edulis and J. osteosperma on the Colorado Plateau and western portions of the southern Rocky Mountains, and P. edulis and J. monosperma in central to southern Arizona and New Mexico and southern Colorado. Pure pinyon or pure juniper woodlands can also be found; J. occidentalis in particular extends throughout the northwestern Great Basin, well beyond the range of pinyon.
These six tree species form woodland or savanna ecosystems that generally occupy a zone between arid shrubland or grassland environments at lower elevations and forests at higher elevations. Topographic settings, soil conditions (depth, texture, and moisture-temperature regimes), and climate can vary substantially within this zone, and the structure and composition of pinyon-juniper ecosystems vary with changes in these biophysical environments (Romme and others, 2009). Regional- to landscape-scale variation in the structure and composition of pinyon-juniper ecosystems is largely determined by ecophysiological differences between junipers and pinyons that result in unique species adaptations to climate conditions and biophysical settings (Romme and others, 2009). Juniper species tend to be more drought tolerant than pinyon and often occupy drier, lower elevation settings within a given landscape (with the exception of J. scopulorum), while pinyon is more likely to dominate more mesic locations than juniper, often at higher elevations.
Historical disturbance regimes that varied among biophysical settings also influenced compositional and structural differences among pinyon-juniper woodlands. Prior to widespread livestock grazing and fire suppression, most pinyon-juniper woodlands had complex stand structures shaped by infrequent, high-severity crown fire (Shinneman and Baker, 2009), although some savannas were likely maintained by relatively frequent surface fire (Baker and Shinneman, 2004; Romme and others, 2009). Drought, insects, and disease also contributed to patchy and occasionally extensive mortality in pinyon-juniper ecosystems (Shaw and others, 2005; Romme and others, 2009). These disturbance dynamics, coupled with spatially variable environmental conditions, produced a variety of pinyon-juniper structural ecosystem types, including woodlands, savannas, and wooded shrublands, with ecotones that shifted among types as moisture and disturbance regimes changed over time (Nowak and others, 1994; Romme and others, 2009). Pinyon pine and juniper species tend to be long-lived, with individual trees commonly reaching 300─600 or more years in age in some regions (for example, Landis and Bailey, 2005; Shinneman and Baker, 2009). However, old-growth and persistent woodlands may have historically been more limited to relatively fire-safe environments in many regions, including large portions of the Great Basin (Waichler and others, 2001; Weisberg and others, 2008).
Both increases (via woodland expansion or infilling) and decreases (via drought-induced dieback or decline) in pinyon and juniper populations over recent decades have been documented over extensive areas using remotely sensed imagery and forest inventory data (for example, Shaw and others, 2005; Brewer and others, 2017; Filippelli and others, 2020; Stanke and others, 2021). Expansion of pinyon and juniper trees has been attributed to several factors, including natural expansion in response to favorable climate shifts over time, and the effects of land use, especially livestock grazing, fire suppression, and reestablishment of historically cleared woodlands (Miller and Wigand, 1994; Romme and others, 2009; Miller and others, 2019). In contrast, recent and extensive pinyon pine mortality events (Shaw and others, 2005) suggest tree populations at lower shrubland-woodland ecotones may be particularly vulnerable to future climates that are expected to be warmer and drier for much of the region (Urza and others, 2020; Rodman and others, 2022).
Tree removal and thinning treatments in the interior western United States have been instituted to limit infilling of wooded shrublands and expansion of persistent pinyon-juniper woodlands into adjacent shrublands. As pinyon and juniper trees expand into non-wooded ecosystems and transition from early- to late-successional stages (or development phases), plant community composition, disturbance regimes, ecosystem function (hydrologic, energy, and nutrient cycles; carbon-storage), and habitat for wildlife are increasingly altered (Bender and others, 2007; Rickart and others, 2008; Coates and others, 2017; Severson and others, 2017a; Miller and others, 2019). Three phases of successional development of pinyon-juniper woodlands (table 1) that are based on relative dominance of trees versus shrub-herbaceous layers have been described (Miller and others, 2005, 2019) and can be quantified based on a tree dominance index (Williams and others, 2017). Classification of pinyon-juniper woodlands using these three phases of successional development is often used for making management decisions and determining appropriate treatment actions, with Phase I representing early stages of tree expansion and Phase III representing a more advanced woodland developmental stage (table 1).
Table 1.
Three phases of successional development of pinyon-juniper (Pinus-Juniperus ssp.) woodlands based on relative dominance of trees versus shrub-herbaceous layers, quantified based on a tree dominance index (adapted from Miller and others, 2005, 2019; Williams and others, 2017).Dynamics and Effects of Pinyon-Juniper Expansion on Plant and Wildlife Communities
Pinyon and juniper tree expansion into adjacent sagebrush shrubland and sagebrush steppe ecosystems can result in numerous biophysical changes, including reduced shrub and understory herbaceous cover and plant species richness (Tausch and Tueller, 1990; Monaco and Gunnell, 2020), altered hydrologic function and increased water run-off and soil erosion (Wilcox, 1994; Williams and others, 2019), and enhanced woody fuel accumulation that can increase fire severity and potential for subsequent invasion by exotic annual grasses that promote frequent fire (Tausch, 1999; Shinneman and Baker, 2009). The types of sagebrush communities affected by pinyon and juniper tree expansion vary depending on ecoregion, topographic setting, and temperature/precipitation regimes that influence soil conditions, but commonly include communities dominated by Artemisia tridentata ssp. wyomingensis (Wyoming big sagebrush) or A. nova (black sagebrush) in relatively warm-dry environments, and A. tridentata ssp. vaseyana (mountain big sagebrush) at higher elevations under relatively cold-moist conditions. The specific effects of tree expansion can vary among different sagebrush communities and their environmental settings. As an example, Wyoming big sagebrush communities are generally less resistant than mountain big sagebrush to exotic annual grass invasion and dominance after fire (Chambers and others, 2014).
Expansion of pinyon-juniper trees also alters the structure and composition of habitat with mixed results for the fauna that occupy affected areas. Declines in sagebrush cover resulting from increased pinyon-juniper cover can have implications for wildlife species that use shrub and associated herbaceous features as habitat. Avian species associated with sagebrush steppe, especially sagebrush-obligates like Brewer’s sparrow (Spizella breweri), sage thrasher (Oreoscoptes montanus), and sagebrush sparrow (Artemisiospiza nevadensis), have become less abundant in areas of pinyon-juniper expansion (Knick and others, 2005; Noson and others, 2006). In contrast, many avian species associated with conifer woodlands have increased across the sagebrush biome (Maestas and others, 2021). A notable exception to this pattern is the pinyon jay (Gymnorhinus cyanocephalus), which has experienced population declines across much of its range (Sauer and others, 2017; Boone and others, 2018; Remington and others, 2021). Pinyon-juniper woodlands support very high bird abundance and diversity compared to other habitat types (Paulin and others, 1999), and more than 70 species of birds can occupy pinyon-juniper woodlands during the breeding season (Balda and Masters, 1980). For some avian species, including the black-throated gray warbler (Setophaga nigrescens) and gray flycatcher (Empidonax wrightii), pinyon-juniper may represent essential breeding habitat (Bombaci and Pejchar, 2016). Pinyon-juniper woodlands provide habitat for a high diversity of mammals as well, with greater than (>) 60 species recorded in these woodlands in Colorado alone (Finch and Ruggiero, 1993). Pinyon-juniper woodlands thus represent an important contribution to biodiversity, and reductions in the extent of pinyon-juniper woodlands, although beneficial for sagebrush obligates in certain environments, may have negative impacts for other species.
Two species of particular management interest have been affected by expansion of pinyon-juniper cover: greater sage-grouse and mule deer. Generally, sage-grouse avoid or are negatively affected by pinyon-juniper cover during nesting (Doherty and others, 2010; Severson and others, 2017b), brood-rearing (Atamian and others, 2010; Casazza and others, 2011), and wintering seasons (Doherty and others, 2008). The mechanisms responsible for these patterns are still under investigation, but forage abundance for sage-grouse is negatively associated with pinyon-juniper cover (Severson and others, 2017b), and expansion of pinyon-juniper may facilitate habitat use by avian predators of sage-grouse via increasing perch availability (Wolff and others, 1999; Manzer and Hannon, 2005; Young, 2022). Patterns of selection by sage-grouse appear to vary with respect to the amount of pinyon-juniper cover in sagebrush habitats. Specifically, areas of pinyon-juniper cover classified as Phase II or III successional development are generally avoided but individuals vary in their response to Phase I (Coates and others, 2017; Rabon and others, 2021a; see table 1 for description of phases). This variation may be at least partially tied to reproductive status, such that hens with broods are more likely to avoid areas of Phase I pinyon-juniper cover than hens without broods (Rabon and others, 2021a), or may be explained by habitat conditions associated with pinyon-juniper expansion, such as higher elevation and more productive ecological sites (Gibson and others, 2016; Coates and others, 2017). Similarly, most used leks are in habitat with less than (<) 1 percent pinyon-juniper cover within 5 kilometers (km), and leks are abandoned when cover is >4 percent within 1 km (Baruch-Mordo and others, 2013; Knick and others, 2013). When individual sage-grouse do use areas affected by pinyon-juniper expansion, movement rates are faster compared to those in areas without pinyon-juniper, and survival rates are reduced (Prochazka and others, 2017). There are also behavioral consequences for sage-grouse that are associated with proximity to pinyon-juniper cover. Sage-grouse that increase movement rates when encountering pinyon-juniper cover may require larger areas of the landscape to meet resource needs, and hens with larger home ranges have higher stress hormone levels and lower reproductive success (Rabon and others, 2021b). Because of these factors, it has been suggested that areas of early-phase pinyon-juniper expansion selected by sage-grouse may function as ecological traps (where animals show a maladaptive preference for lower quality habitat; Schlaepfer and others, 2002; Coates and others, 2017).
Pinyon-juniper expansion may have complex consequences for mule deer because it alters relationships between available forage and cover. Mule deer are considered a shrub-dependent ungulate, and during summer, adult females are particularly reliant on understory shrub and forb communities to meet energetic demands of lactation and to store energy for winter (Parker and others, 2009; Tollefson, 2011). As pinyon-juniper canopy cover increases, forage availability or quality can decrease, a response that can be measured by negative associations between levels of body fat and the amount of pinyon-juniper cover within an individual deer’s home range (Bender and others, 2007). Despite this consequence, mule deer select for some pinyon-juniper woodlands within their home range, possibly because of the cover provided by conifer trees (Bender and others, 2007). Similarly, although mule deer in the White Mountains of California and Nevada largely avoid high levels of pinyon-juniper cover (>40 percent), they select for areas of low and intermediate pinyon-juniper cover (10–40 percent) during resting periods, suggesting that low levels of pinyon-juniper cover provide benefit for either avoidance of predators or thermal stress (Morano and others, 2019).
Historical Management of Pinyon-Juniper Woodlands by Land Management Agencies
Historical clearing of pinyon and juniper by land management agencies was usually conducted to improve forage conditions for livestock and big game species. Extensive clearing efforts largely began after World War II (Miller and others, 2019), using various mechanical methods such as “chaining” (pulling a chain between two tractors to knock over trees), bulldozing, disking/harrowing (pulling a series of disks or other implements to uproot plants and (or) prepare soil for seeding), and cutting (for example, using heavy equipment, such as feller-bunchers, or manually, using chainsaws). Since the late-1970s, prescribed fire has been another commonly used technique to clear pinyon-juniper woodlands. In early phases of pinyon-juniper woodland development, when ladder fuels are more abundant, prescribed fire can spread effectively, resulting in higher mortality of small trees compared to use of mechanical methods (Baker and Shinneman, 2004; Bates and others, 2014b; Miller and others, 2019). However, prescribed fire can pose greater risks of exotic species invasions or soil erosion compared to some mechanical treatments, particularly on more vulnerable sites (for example, Bates and others, 2014a; Karban and others, 2022). More recently, a suite of mastication techniques (also referred to as mulching, chipping, or shredding) are increasingly used, and clearing is often followed by herbicide application and seeding of perennial herbaceous species that are intended to improve forage, reduce erosion potential, and provide competition for exotic annuals (Miller and others, 2019).
Historical clearing of pinyon-juniper was largely indiscriminate relative to woodland development stage (that is, whether stands represented recent expansion of young trees or persistent old growth), and consideration of site potential for invasion by annual plant species was often inadequate (Miller and others, 2019). Contemporary pinyon-juniper treatments are increasingly likely to consider the developmental stage of the woodland and the potential for invasion of exotic species (for example, Tausch and others, 2009). Moreover, modern justifications for tree removal often focus on ecological restoration intended to improve wildlife habitat (Natural Resource Conservation Service [NRCS], 2019), restore hydrologic functions (for example, reducing water run-off and soil loss), and decrease risk of high-severity fire through woody fuel reduction (Miller and others, 2019; Hartsell and others, 2020).
The true extent and effects of past clearings are not well known, as older detailed historical treatment records are rare, and post-treatment monitoring was often absent. However, key patterns emerge based on our search of compiled historical data over the previous four decades (1980–2019) available in the Land Treatment Digital Library (LTDL; Pilliod and others, 2019; fig. 4; table 2). Although the historical data in the LTDL are incomplete, as pinyon-juniper treatment records from some BLM offices were not reliably reported or were unavailable, they provide the best available representation of the geographic distribution of historical pinyon-juniper treatments in the western United States. Pinyon-juniper clearing and restoration treatments of all types occurred mostly in the central and northwestern portion of the collective range of the six tree species addressed in this review (fig. 4). Based on available data, Oregon and Idaho collectively accounted for more than half (about 57 percent) of all recorded pinyon-juniper treated area in the western United States from 1980 to 2019. Historical pinyon-juniper removal treatment sizes ranged widely. The largest recorded project area was 26,579 ha (combined individual treatment area), but the average project size among most states was <1,000 ha (table 2). Moreover, individual treatment sizes <500 ha comprised a large majority of the total number of treatments in each state (range 71–95 percent; data not shown).
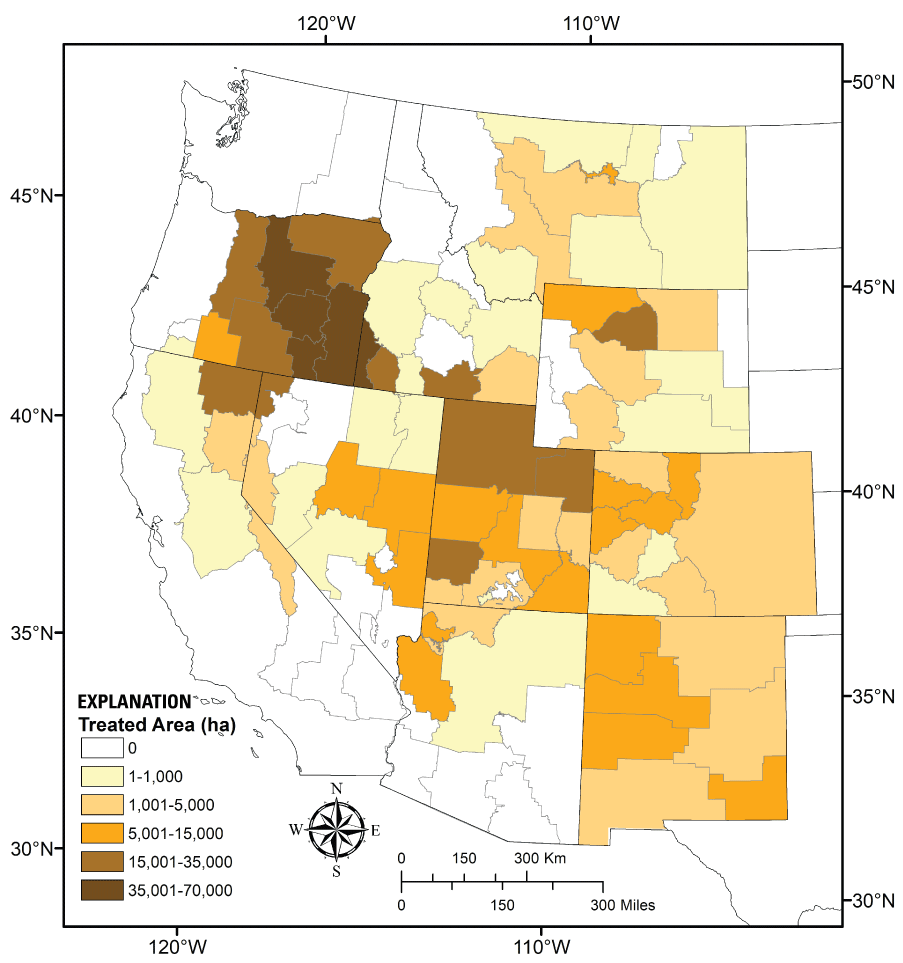
The area (in hectares [ha]) of pinyon-juniper treatments between 1980 and 2019 for Bureau of Land Management (BLM) field office management units in the western United States based on data available in the U.S. Geological Survey Land Treatment Digital Library (LTDL; Pilliod and others, 2019). Not all historical treatments and their records are available in the LTDL, and there may be other sources of error in available records. Refer to text and table 2 for search criteria used.
Table 2.
Pinyon-juniper removal projects in the western United States (1980–2019) by number per decade (and total) and by mean, standard deviation, and largest treated area (in hectares [ha]) by project.[Data were obtained from the U.S. Geological Survey Land Treatment Digital Library (LTDL; Pilliod and others, 2019). Projects were included if a completion date was provided. Search terms included all combinations of treatment types provided within the Tree/Brush Control, Vegetation Disturbance, and Prescribed Burn categories in the LTDL, and for which pinyon, juniper, or “PJ” were explicitly identified in project documents. Numbers of projects per decade were based on completion dates; treatment sizes included a few projects begun during 1980–2019 but completed in 2020. Not all historical treatments and their records are available in the LTDL, and there may be other sources of error in available records. ha, hectares]
Treatment Methods Permitted Under the PJCX
The PJCX permitted certain actions and treatment areas that are up to about 4,047 ha (10,000 acres) in size within sagebrush shrublands and adjacent sagebrush steppe communities. Specific treatment actions allowed under the PJCX (DOI, 2020; BLM, 2020) included: (1) manual (hand) cutting using chain saws; (2) mechanical cutting using equipment such as feller-bunchers; and (3) mastication, in which a rotating metal cylinder attached to a machine (for example, a skid-steer or front-loader) shreds trees and other vegetation, typically leaving one to several inches of mulch on the ground near the location of the tree. After cutting and (or) mastication, additional methods are permitted to redistribute or remove tree biomass, including:
-
1. lop and scatter techniques, in which the cut tree components, such as branches and tree tops, are distributed on the ground;
-
2. yarding and piling of cut trees, which involves hauling and placing logs horizontal and parallel at a collection point;
-
3. pile burning, which is burning of woody debris (slash) piles; and
-
4. removal of cut trees for commercial and non-commercial uses or products (for example, sawlogs, fuelwood).
Seeding or manual planting of seedlings of native species were also allowed by the PJCX. However, the PJCX did not allow cutting “old-growth trees” (trees that established prior to Euro-American settlement), chaining, broadcast or jackpot burning (that is, prescribed burning that either occurs broadly throughout the understory or in patchy mosaics to target scattered concentrations of cut vegetation, respectively), seeding or planting non-native species, or pesticide or herbicide use. Construction of roads (temporary or permanent) and permanent infrastructure were also not allowed by the PJCX.
Methods
Criteria and Scope of this Review
We used the following criteria for a research paper to qualify for assessment in this review:
-
1. PJCX-permitted treatments were performed on one or more of the six pinyon and juniper species described earlier;
-
2. biotic or abiotic responses to treatments were tested for significance using controls or pre-treatment conditions, with the exception of two papers that measured wildlife habitat selection in treated areas only;
-
3. the paper was unique and not previously published (for example, not a review); and
-
4. the paper was published and externally peer-reviewed (for example, we did not include government reports, conference proceedings, or graduate student theses).
For the final criterion, we only included peer-reviewed literature published after January 1, 2014 (extending to March 2021, when the review started), to avoid redundancy with two recent systematic reviews of pinyon-juniper removal treatment effects that incorporated older literature. Bombaci and Pejchar (2016) systematically reviewed 19 studies on mechanical and non-mechanical (that is, prescribed fire) pinyon-juniper tree reduction treatment effects on wildlife abundance, summarized by taxonomic or functional group. Jones (2019) systematically reviewed studies addressing mechanical treatments of pinyon-juniper woodlands, summarized by four primary ecosystem responses, including change in vegetative species groups, soil erosion, hydrological function, and sage-grouse. These reviews considered a wide range of treatment types, including methods not allowed by the PJCX (for example, chaining, herbicide application, prescribed fire, seeding non-native species). However, these two publications, as well as related reviews that considered pinyon-juniper treatments (for example, Miller and others, 2019; Hartsell and others, 2020), provided a foundational basis to which we compare our findings and better identify key knowledge gaps regarding treatment effects.
Systematic Search Methods Used
We used Web of Science and Google Scholar to perform systematic literature searches and assess the impacts of PJCX-permitted treatments on biotic and abiotic ecosystem components and processes. The keyword searches listed below (limited to papers published from January 2014 to March 2021) were used to identify potentially relevant pinyon-juniper papers that were then further assessed to determine if they met our four criteria (described above) for inclusion. Vegetation-, soils-, and abiotic-related (for example, hydrologic function) papers (hereinafter collectively referred to as “vegetation-environmental”) were identified using the first two search-groupings, whereas wildlife-related papers were identified using all three groupings (below):
-
1. juniper or pinyon or piñon or “Pinus edulis” OR “Pinus monophylla” OR “Juniperus osteosperma” OR “Juniperus occidentalis” OR “Juniperus monosperma” OR “Juniperus scopulorum,”
-
2. [search (1)] AND any of the following treatment keywords: “treatment” OR “tree removal” OR “woodland reduction” OR “woodland clearing” OR “habitat manipulation” OR cut* OR mulch* OR masticat* OR thin* OR lop-and-scatter OR yard* OR pile OR piling OR pile burn* OR seeding OR seeded OR planting OR planted OR sawlog* OR fuelwood OR remov* OR “wood product” OR fuel*, and
-
3. [search (1) and (2)] AND any of the following wildlife keywords: wildlife OR animal* OR reptile* OR lizard* OR amphibian* OR frog* OR toad* OR snake* OR salamander* OR bird* OR raptor* OR mammal* OR rodent* OR rabbit* OR bat* OR predator* OR carnivore* OR mustelid* OR herbivore* OR “game species” OR ungulate* OR insect* OR invertebrate* OR arthropod* OR omnivore* OR fish* OR avian OR habitat OR “mule deer” OR “sage-grouse”
Summarizing Responses from Relevant Literature
For each paper that met our four criteria, we extracted information on the tree species treated, treatment type, study duration, spatial extent, and the type of response to treatment that was measured and reported. For our assessment of treatment effects, we considered a response to be a comparison between an untreated control or pre-treatment condition (if no control) and a post-treatment condition, including when a response was analyzed among multiple years and (or) multiple sites within a single study. For example, if a paper examined native perennial grass response to cutting at 1, 3, and 10 years post-treatment, each of those three responses were included in our analysis. We tallied responses to each type of PJCX-permitted treatment as either positive (that is, a significant increase), negative (that is, a significant decrease), or non-significant (that is, no significant difference) based on measures of statistical relevance provided by each study (for example, as indicated by significance values or confidence intervals). Because there is uncertainty regarding the statistical independence of multiple responses from a single study, we limited our assessment to simple comparisons of the proportions of positive, negative, or non-significant responses for categories of interest, rather than performing additional statistical analysis.
For vegetation-environmental responses to PJCX-permitted treatments, we classified and reported responses among the following 19 categories, capitalized, as follows:
-
1. Native herbaceous plant abundance responses included measures of cover, density, or biomass and were reported among three categories:
-
a) All Native Grass/Forb Abundance included all native herbaceous plant abundance responses, irrespective of whether life-cycle duration (annual or perennial) was reported or not (responses placed in either of the two following categories were also included in this category)
-
b) Native Annual Grass/Forb Abundance included responses for which a species or group of species were reported as annuals; and
-
c) Native Perennial Grass/Forb Abundance included responses for which a species or group of species were reported as perennials.
-
-
2. Exotic herbaceous plant abundance responses were classified using the same logic as for native plants, but there were no exotic perennial grass/forbs reported uniquely in papers reviewed here, resulting in two categories:
-
3. General understory vegetation abundance responses were classified using the same structure as for native and exotic plants, but irrespective of whether information was provided on native status, resulting in three categories for reporting:
-
4. The Native Plant Species Richness/Diversity response category included any measure of native species richness or diversity, regardless of plant life form.
-
5. Shrub abundance responses (cover, biomass, density) were reported using two categories:
-
6. Measures of Tree Abundance (for example, cover, density, basal area) represented the response of trees to treatments over time and included indicators of either woodland regrowth or physiological responses of remaining trees.
-
7. Ground-cover responses were assessed among four categories:
-
a) Downed Woody Debris included responses that measured wood particles/pieces (from both shrubs and trees);
-
b) Litter included responses that measured cover or depth of dead herbaceous material;
-
c) Bare Ground Cover included cover measurements of bare soil; and
-
d) Biocrust Cover/Microbial Activity measured biocrust cover or indicators of soil microbial abundance/activity.
-
-
8. Abiotic-water responses included two water-related parameters:
-
9. The Carbon Storage response category included measurements such as root, soil, and aboveground carbon stocks.
Other vegetation-environmental responses were not included because they were too few or ambiguous to categorize meaningfully, such as disparate changes in soil chemistry or diversity measures that did not delineate native from non-native species.
We organized wildlife responses to the PJCX-permitted treatments into four groups:
-
1. Habitat-Related (including variation in habitat use and selection);
-
2. Reproductive (including variation in nest success [that is, successful hatching of eggs] and nest abundance);
-
3. Other Demographic (including variation in density, survival, and population growth rate, but not including metrics of nest success or abundance); and
-
4. Community (including variation in species abundance, richness, diversity, evenness, and biomass).
We further placed wildlife species into one of five habitat functional groups, following Bombaci and Pejchar (2016):
-
1. Generalist (species that commonly use >2 habitat types);
-
2. Sagebrush obligate (species that primarily use sagebrush habitat);
-
3. Shrubland-grassland (species that use both of these habitat types);
-
4. Woodland-shrubland (species that use both of these habitat types); and
-
5. Woodland (species that primarily use woodland habitat or woodland edges).
Finally, we summarized the spatial and temporal aspects of the reviewed pinyon-juniper treatment papers to provide geographical, ecological, and treatment context. Studies were summarized based on environmental setting, geographic location, study size, and study duration, and these context results were delineated based on the broadly defined response types (that is, vegetation-environmental and wildlife).
Results
In the summaries of responses to treatments provided below, reported percentages always represent the proportion of the total number of responses (n) for a given response-treatment category combination. The total number of papers ([n]) from which responses were obtained are also provided. Both provided values correspond to tables 3–6.
Vegetation-Environmental Responses to Treatments
Number of Papers and Responses Found
Using the search criteria described above, we found 719 potentially relevant papers describing vegetation-environmental responses to pinyon-juniper treatments. Upon further review, we determined that only 48 were directly relevant, 10 of which were included in the analysis by Jones (2019). Most of the initial papers were excluded because either they had no relevance to the review (for example, medicinal use of Juniperus species), PJCX-permitted treatments were not conducted (for example, modeling or review papers), relevant treatments were combined with those not permitted by the PJCX (for example, cutting followed by prescribed fire), treatments were not conducted on pinyon-juniper species addressed in this review, or significance of treatment effects was not reported. We found papers that tested for effects relevant to all PJCX-permitted treatments except yarding and piling of cut trees (which was never specifically mentioned).
The 48 papers reported 1,709 relevant responses to PJCX-permitted treatment types (fig. 5; app. 1). All studies included cutting (37 papers) or mastication (23 papers) as a primary treatment (fig. 5). Three studies combined cutting and mastication, and we assigned these to the cutting category for our assessment because only a few masticated plots were combined with a larger number of cut plots (Roundy and others, 2018, 2020) or because large trees were cut and only small trees were masticated (Ashcroft and others, 2017). When cutting was the primary treatment, 73 percent of variables were measured following cutting alone, with the remaining responses measured when secondary treatments of pile burning, off-site tree removal, or seeding native species followed cutting. Additionally, there were instances in which seeding was conducted following pile burning or off-site tree removal, as well as instances in which those treatments were conducted with no seeding. We highlight differences at this “tertiary level” (fig. 5) only when they vary from those reported at the secondary level. For mastication, only one paper (Redmond and others, 2014) included a secondary treatment of seeding native species. We report these seeding responses only when they differ from overall mastication results.
![A flowchart depicting the hierarchical treatment framework used to assess vegetation-environmental
responses: the combined, primary, and secondary treatment levels are consistently
reported in this assessment. The total number of responses and total number of peer-reviewed
papers (n = responses [papers]) from which the data were obtained are indicated in
each box (a single paper may have tested responses to more than one treatment or combination
of treatments). Treatments are divided into two primary treatment types (All Cutting
and All Mastication), which are further divided into secondary treatments. The secondary
cutting treatments are divided yet again into those with tertiary treatments; however,
there are no tertiary treatments following mastication.](https://pubs.usgs.gov/of/2023/1041/images/ofr20231041_fig05.png)
Flowchart depicting the hierarchical treatment framework used to assess vegetation-environmental responses: the combined, primary, and secondary treatment levels are consistently reported in this assessment. The total number of responses and total number of peer-reviewed papers (n = responses [papers]) from which the data were obtained are indicated in each box (a single paper may have tested responses to more than one treatment or combination of treatments).
Geographical, Ecological, and Treatment Context of Studies Included
For purposes of this summary, a “study site” was defined as a location in which one or more plots were measured. Among the 48 papers that addressed vegetation-environmental responses, most included more than one study site, with a total of >200 unique locations reported. In some instances, authors did not provide precise study site locations and (or) treatment responses were summarized using numerous sites. As such, study site locations displayed in fig. 6 are a combination of provided (that is, authors reported geographic coordinates) or estimated (that is, authors provided a map that was used to approximate site location). Many sites located in the Central Basin and Range, Northern Basin and Range, Eastern Cascade Slopes, Southern Rockies, Wasatch and Uinta Mountains, and Colorado Plateau could not be mapped with confidence due to lack of or vague location information provided by authors, including data from more than 100 treated sites in Utah assessed in a retrospective study by Monaco and Gunnell (2020). Furthermore, some locations represent more than one site in very close proximity, and other locations represent individual sites that were utilized in more than one paper.
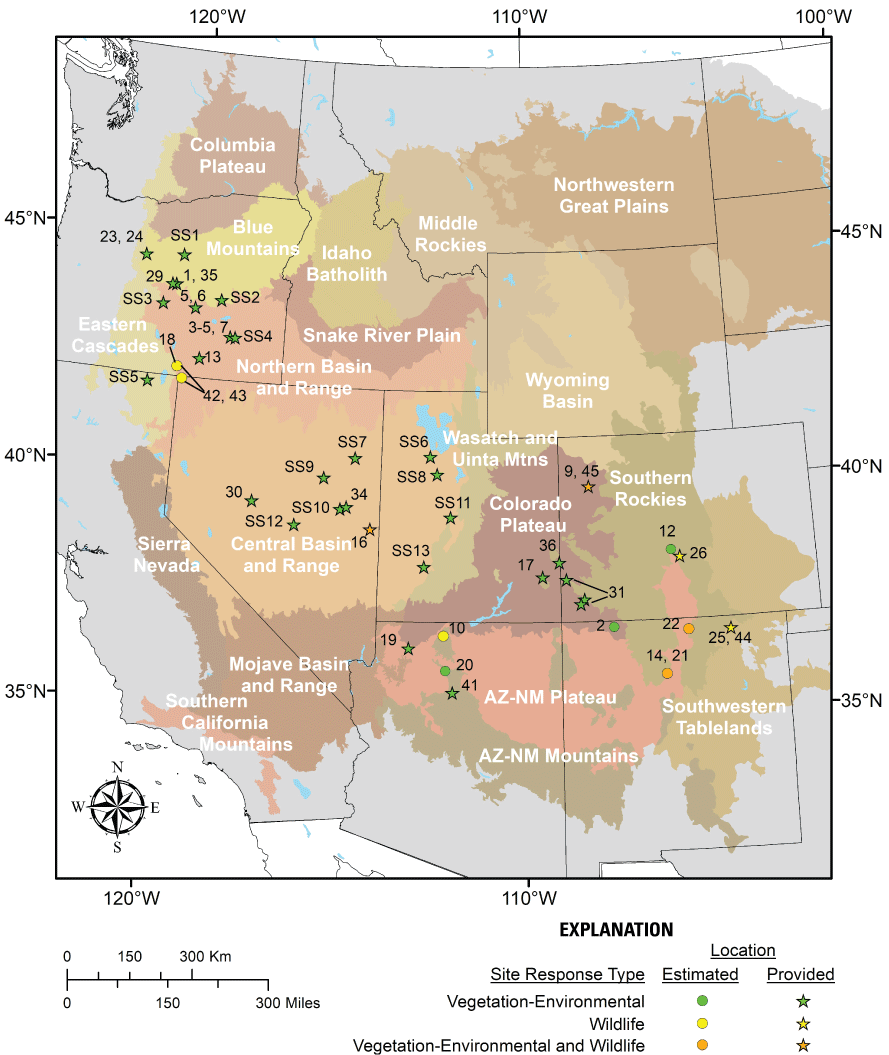
Approximate vegetation-environmental and wildlife study site locations used to summarize Pinyon-Juniper Management Categorical Exclusion treatment effects in this review, superimposed on Level III ecoregions (U.S. Environmental Protection Agency [EPA], 2013). Study site locations from each publication are based on author-provided geographic coordinates (stars) or are approximated (circles) using author-provided maps, including some estimated centers of multiple sites in close proximity. Not all study sites could be mapped. Numbers for a particular site correspond to individual research papers as listed in References Cited, with various combinations of Sagebrush Steppe Treatment Evaluation Project (SageSTEP) papers indicated by ‘SS’ and a unique number that follows.
Reported study sites were located across seven western states, with the majority (56 percent) of sampling conducted in either Utah (34 percent) or Oregon (22 percent). Across 8 ecoregions, most sampling occurred in the Central Basin and Range (52 percent), followed by the Blue Mountains (16 percent), and Northern Basin and Range (15 percent). Five additional ecoregions accounted for <6 percent of sampling each. One additional paper (Monaco and Gunnell, 2020) that analyzed 129 previously sampled study sites in Utah (primarily in the Central Basin and Range, Colorado Plateau, Wasatch and Uinta Mountain ecoregions) lacked information necessary to adequately determine the exact locations of sites that qualified for our review. Among research papers, many study sites were located near the margins of rangeland-dominated ecoregions, likely reflecting areas with higher potential for tree expansion along ecotones. Study sites were also located across a broad range of climatic conditions, with reported mean annual precipitation (represented by 30-year norms and [or] conditions around time of treatment) ranging from 229 to 573 millimeters (mm; 40 papers) and elevation ranging from 800 to 3,900 meters (m; 47 papers).
Among all papers, pinyon and juniper species were mostly studied when occurring together, with 37 papers reporting at least one site that was a pinyon-juniper woodland. Eleven papers reported exclusively on J. occidentalis and no papers reported on pinyon species without juniper present. The most studied species in our review were J. osteosperma (27 papers), J. occidentalis (22 papers), and P. edulis (25 papers), while papers examining treatment of P. monophylla (17 papers), J. monosperma (6 papers), or J. scopulorum (3 papers) were less common (fig. 7A). Five papers did not specify the pinyon and (or) juniper species treated. Successional development of pinyon-juniper woodlands being studied ranged from Phase I to Phase III (see definitions in table 1), with 12 papers comparing responses to treatments at different developmental phases. However, roughly 80 percent of reported treatments were applied in Phase II or III, and authors sometimes used different criteria to designate development phases (for example, tree cover versus tree dominance index).
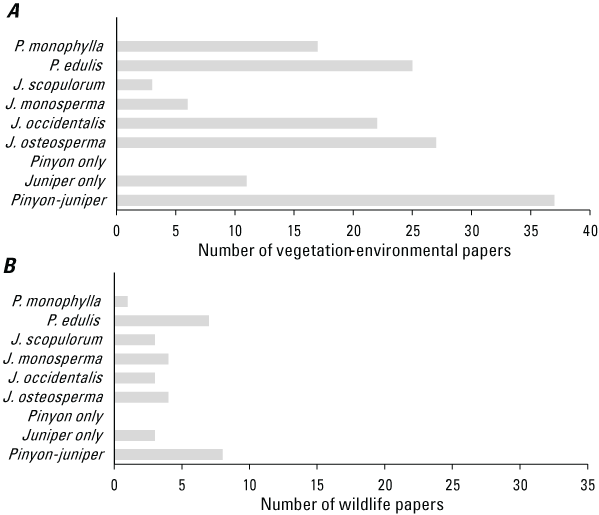
Number of (A) vegetation-environmental and (B) wildlife papers assessed by pinyon-juniper species studied, and by whether pure pinyon (Pinus spp.), pure juniper (Juniperus spp.), or mixed pinyon-juniper communities were studied (n = 48 papers for vegetation-environmental, n = 11 papers for wildlife).
Study sites and treatment sizes represented varying spatial extents. The total area spanned by study sites for any given paper ranged from local scale (<1,000 ha, 22 papers), to large-landscape scale (about 1,000–100,000 ha within a single ecoregion, 8 papers), to multi-ecoregional (11 papers). Of the 11 multi-ecoregional papers, 10 were sampled as part of the Sagebrush Steppe Treatment Evaluation Project (SageSTEP), which is a long-term experimental project designed to evaluate sagebrush steppe restoration methods in the Great Basin (McIver and Brunson, 2014). The total pinyon-juniper treated area also varied widely by study, ranging from 0.2 to 2,800 hectares when reported (40 papers). Twenty-eight papers examined effects where <200 hectares of pinyon-juniper were treated in total, 11 papers evaluated effects where 200–1,000 hectares were treated, and one paper examined effects where 2,800 hectares of pinyon-juniper were treated. When the sizes of individual treatments were reported (38 papers), most treatments were implemented in small (<8 ha; 17 papers) or medium-sized (8–30 ha; 17 papers) patches, with only 5 papers measuring responses in large, contiguous treatment patches (50–166 ha; including one paper that also included a medium-sized patch).
The temporal sampling design and duration of studies also varied greatly; for example, many papers analyzed measurements taken before and after experimental treatments, while others were retrospective studies of previous land management treatments of various ages. When the maximum time since treatment was reported (46 papers), the number of papers that measured at less than or equal to (≤) 3, 4–8, and 9–13 years after treatment was similar, accounting for approximately a third of all papers each (fig. 8A). Only one paper included responses that were measured >14 years after treatment (at 25 years; Bates and others, 2017b). However, even more germane to our assessment of results among papers, when considering responses that we could confidently place into one of the aforementioned time periods (n = 1,619), 49 percent of responses were measured ≤3 years posttreatment, while only 3 percent of responses were measured greater than or equal to (≥) 14 years posttreatment (fig. 8B). The earliest treatment considered in our review occurred in 1991 and the most recent in 2018.
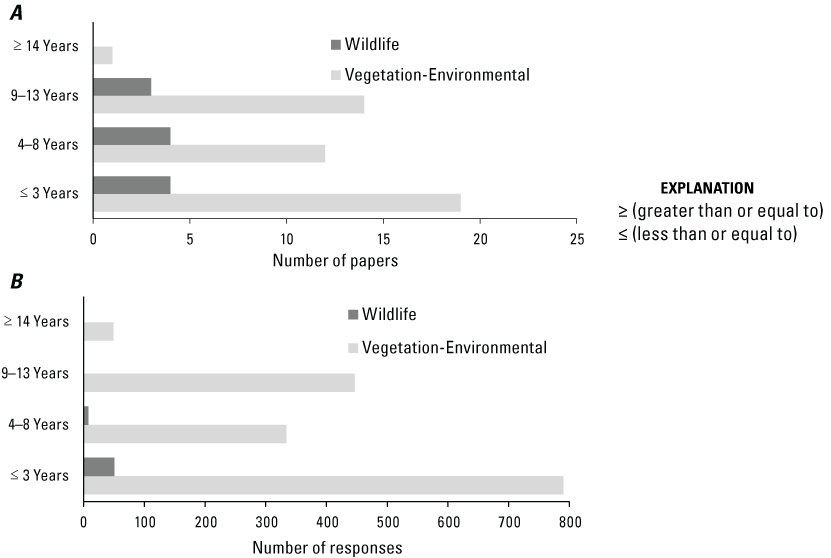
Number of (A) papers by maximum duration after treatment year and (B) number of responses by years since treatment. The maximum duration reported for vegetation-environmental and wildlife responses was 25 years and 11 years, respectively. Maximum duration after treatment year (A) could not be derived from all papers; thus, data are from n = 46 papers for vegetation-environmental, 11 for wildlife. Years since treatment (B) could not be determined for all responses; thus, data are from n = 1,619 [40] for vegetation-environmental and n = 59 [6] for wildlife.
Native Herbaceous Plant Abundance Responses to Treatments
Pinyon-juniper removal treatments generally did not benefit native herbaceous plant abundance, with most responses reported as non-significant across and among treatment types (fig. 9). However, when significant effects were observed, the relative dominance of positive versus negative responses varied among individual treatment types (appendix 1). When all native herbaceous species were considered (All Native Grass/Forb Abundance, n = 199 [16]), the majority of responses to all treatments combined were non-significant (57 percent), and there were slightly more positive (24 percent) than negative (20 percent) responses (fig. 9). Notably, following mastication there were >8 times more positive (42 percent) than negative (5 percent) All Native Grass/Forb Abundance responses (n = 19 [6]). Though a less pronounced difference, cutting only (n = 87 [10]) also had more positive (25 percent) than negative (11 percent) responses. When secondary treatments occurred after cutting, off-site tree removal (n = 51 [2]) had the highest percentage (73 percent) of responses that were non-significant, while pile burning (n = 42 [2]) had the highest percentage (50 percent) of negative responses (and higher than either positive or non-significant responses). Seeding following cutting (n = 62 [2]) had a higher proportion of non-significant (44 percent) than either positive (26 percent) or negative (31 percent) responses for All Native Grass/Forb Abundance.
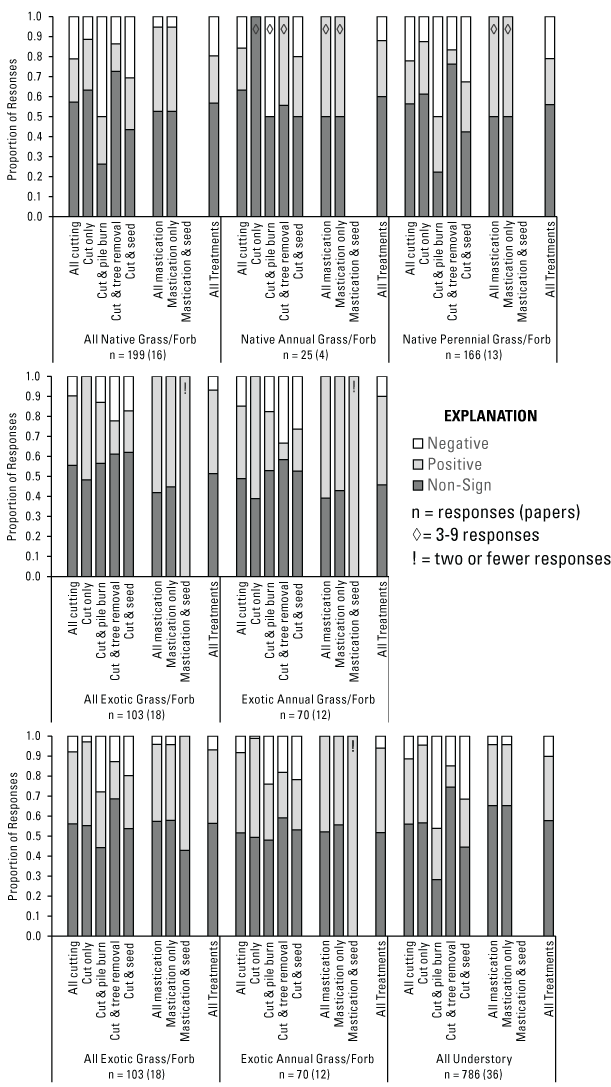
Proportion of understory vegetation category responses that were negative, positive, or non-significant by Pinyon-Juniper Management Categorical Exclusion treatment type (see fig. 5, table 3). An exclamation mark (!) within a bar indicates 2 or fewer responses, a diamond (◊) indicates 3–9 responses, and unmarked bars represent 10 or more responses. For each category, n = number of responses (number of papers) evaluated.
Table 3.
Number of responses (number of papers) by Pinyon-Juniper Management Categorical Exclusion treatment type for herbaceous plant abundance response categories.[Many papers included more than one treatment and (or) more than one response variable, so the total studies by treatment and response variable is less than the sum of each row and column.]
When considering native plants based on life-cycle duration (Native Annual Grass/Forb Abundance, n = 25 [4]), responses to all treatments combined were mostly non-significant (60 percent), and positive responses (28 percent) were more frequent than negative (12 percent; fig. 9). Cutting treatments accounted for most of these responses (n = 19 [3]) and resulted in similar trends (fig. 9). Among all treatments combined, Native Perennial Grass/Forb Abundance (n = 166 [13]) also had mostly non-significant responses (56 percent), with positive responses (23 percent) slightly more common than negative (21 percent). Cutting accounted for most Native Perennial Grass/Forb Abundance responses (n = 158 [11]). At the tertiary level of treatment effects, seeding made an apparent difference in Native Perennial Grass/Forb Abundance. Specifically, when pile burning (n = 12 [2]) and off-site tree removal (n = 14 [2]) followed cutting with no subsequent seeding, there were no positive responses for either treatment. However, when seeding did occur, 42 percent of responses were positive for pile burning (n = 24 [2]) and 11 percent for tree removal (n = 28 [2]); although, negative responses were similar between seeded and non-seeded sites for both cutting and pile burning. Following mastication treatments, both Native Annual Grass/Forb Abundance (n = 6 [1]) and Native Perennial Grass/Forb Abundance (n = 8 [4]) had 50 percent positive and 50 percent non-significant responses.
Exotic Herbaceous Plant Abundance Responses to Treatments
Unlike the relatively variable response of native herbaceous species abundance, exotic herbaceous species abundance was nearly always more positive than negative following pinyon-juniper removal (fig. 9). There were 6 times more positive (42 percent) than negative (7 percent) All Exotic Grass/Forb Abundance (n = 103 [18]) responses to all treatment types combined. Following both cutting only (n = 29 [7]) and mastication treatments (n = 31 [9]), more than half of all responses were positive (52 percent and 58 percent, respectively), with no negative responses for either treatment. When pile burning followed cutting (n = 23 [4]), there were >2 times more positive (30 percent) than negative (13 percent) responses. Seeding following cutting (n = 29 [5]) also resulted in more positive than negative responses (21 percent and 17 percent, respectively), although the difference was less substantial. Off-site tree removal (n = 18 [2]) was the only treatment to result in more negative (22 percent) than positive (17 percent) responses in the All Exotic Grass/Forb Abundance category, but data were from just two related studies in the same location (Kerns and Day, 2014; Kerns and others, 2020). When comparing exotic plant responses based on life-cycle duration, Exotic Annual Grass/Forb Abundance (n = 70 [12]) responses to all treatments combined were >4 times more positive (44 percent) than negative (10 percent), with 46 percent non-significant responses. Additionally, both cutting only (n = 18 [5]) and all mastication (n = 23 [6]) treatments had 61 percent positive responses, with the remaining non-significant. There were no response data available for exotic perennial grass/forb abundance among studies we considered.
General Understory Vegetation Abundance Responses to Treatments
When all herbaceous plants were considered irrespective of life-cycle duration or native status (All Understory Abundance, n = 786 [36]), 56 percent of responses were non-significant, and there were >5 times more positive (37 percent) than negative (7 percent) responses. Among nearly all individual treatment types, either the majority or the largest proportion of All Understory Abundance responses were non-significant, and positive responses were substantially more common than negative. The exception was for mastication followed by seeding, which had mostly (57 percent) positive All Understory Abundance responses, but data were from a single study (n = 7 [1]). Among all treatments combined, Annual Grass/Forb Abundance (n = 180 [20]) had mostly non-significant responses (52 percent), and 7 times more positive (42 percent) than negative (6 percent) responses. Perennial Grass/Forb Abundance responses among all treatments combined (n = 376 [22]) were also mostly non-significant (58 percent), and there were >3 times more positive responses (32 percent) than negative responses (10 percent, fig. 9).
Native Plant Species Richness/Diversity Response to Treatments
Among all treatments combined, Native Plant Species Richness/Diversity (n = 54 [7]) responses were mostly non-significant (65 percent) and with slightly lower proportions of positive (15 percent) than negative (20 percent) responses (fig. 10). Following cutting treatments (n = 40 [3]), negative responses (23 percent) were >1.5 times more frequent than positive (13 percent). In contrast, following mastication treatments (n = 14 [4]), positive responses (21 percent) were 1.5 times more numerous than negative (14 percent). Among secondary treatments following cutting, pile burning (n = 18 [2]) had 39 percent negative and no positive responses, while seeding after cutting (n = 28 [3]) had a slightly lower proportion of positive (14 percent) than negative (18 percent) responses. At the tertiary treatment level, when seeding occurred after off-site tree removal (n = 12 [2]), positive responses (17 percent) were >2 times more frequent than negative (8 percent); however, when there was no seeding after off-site tree removal (n = 6 [2]), positive and negative responses were each 17 percent.
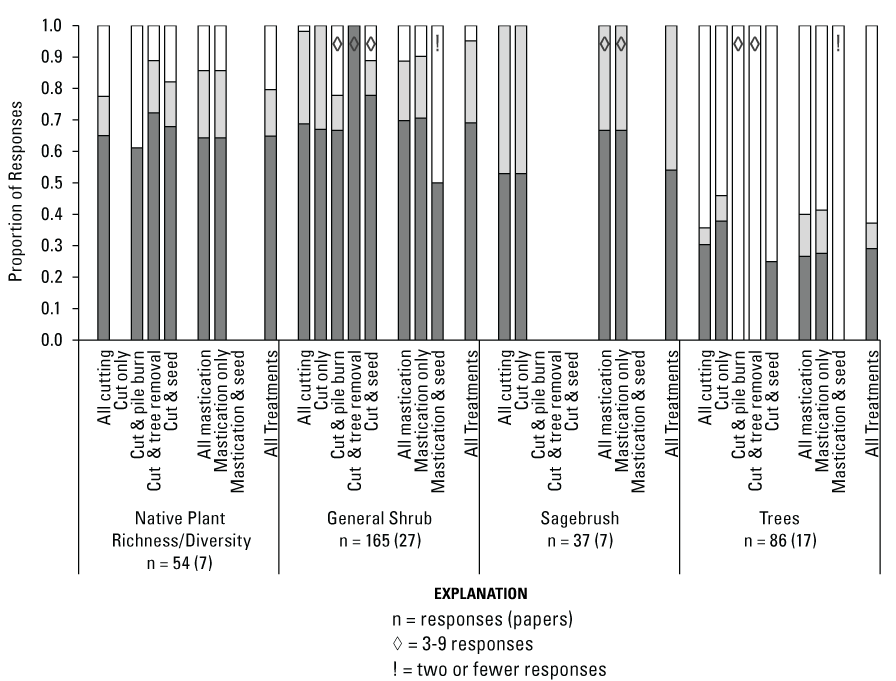
Proportion of richness and diversity, shrub, and tree category responses that were negative, positive, or non-significant by Pinyon-Juniper Management Categorical Exclusion treatment type (see fig. 5, table 4). Missing bars for a treatment type indicate no data were available. An exclamation mark (!) within a bar indicates 2 or fewer responses, a diamond (◊) indicates 3–9 responses were available, and unmarked bars represent 10 or more responses. For each category, n = number of responses (number of papers) evaluated.
Shrub Abundance Responses to Treatments
Treatments had mostly non-significant effects on measures of shrub abundance (fig. 10); however, of those with significant effects, positive responses were generally more common than negative. Among all treatment types combined, General Shrub Abundance (n = 165 [27]) had mostly non-significant responses (69 percent), but positive responses (26 percent) were >5 times more frequent than negative (5 percent). Notably, following cutting treatments there were >14 times more positive (29 percent) than negative (2 percent) General Shrub Abundance responses (n = 112 [19]), with the remaining responses non-significant. Concerning secondary treatments conducted after cutting, off-site tree removal (n = 4 [2]) had only non-significant responses, seeding (n = 9 [4]) had 78 percent non-significant responses, and pile burning (n = 9 [4]) had 67 percent non-significant responses. Following mastication, responses (n = 53 [15]) were also largely non-significant (70 percent), and positive responses were >1.5 times more frequent than negative (19 percent and 11 percent, respectively). There were relatively few Sagebrush Abundance responses recorded among studies (n = 37 [7]), but 46 percent of responses to all treatments combined were positive, with the remaining non-significant (54 percent; fig. 10). Most Sagebrush Abundance responses were measured after cutting only (n = 34 [6]), and the few responses following mastication followed a similar pattern (one positive, two non-significant).
Table 4.
Number of responses (number of papers) by Pinyon-Juniper Management Categorical Exclusion treatment type for diversity, shrub, tree, and ground cover response categories.[Many papers included more than one treatment and (or) more than one response variable, so the total studies by treatment and response variable is less than the sum of each column.]
Tree Abundance Responses to Treatments
Among all treatments combined, Tree Abundance responses (n = 86 [17]) were largely negative (63 percent), with 8 percent positive and 29 percent non-significant responses (fig. 10). Tree Abundance responded similarly to cutting (n = 56 [12]) and mastication (n = 30 [8], with 64 percent and 60 percent of all responses negative after treatment, respectively. When secondary treatments were conducted following cutting, tree removal (n = 7 [2]) and pile burning (n = 6 [3]) both had only negative responses, while seeding (n = 12 [4]) had 75 percent negative and 25 percent non-significant responses.
Ground Cover Responses to Treatments
Among all treatments combined, Downed Woody Debris (n = 77 [9]) had >3 times more positive (48 percent) than negative (14 percent) responses (fig. 11). Importantly, most of the Downed Woody Debris responses were reported by fuel size class (ranging from 1-hour [hr] to 1000-hr; n = 57). Downed Woody Debris positive responses were most pronounced following cutting treatments (n = 44 [6]), with >12 times more positive (64 percent) than negative (5 percent) responses. When secondary treatments followed cutting, seeding (n = 10 [1]) had 80 percent non-significant responses, while tree removal and pile burning had only one response each (positive and negative, respectively). Following mastication, 45 percent of Downed Woody Debris (n = 33 [5]) responses were non-significant, with the remaining responses split evenly between positive and negative. While this may seem counterintuitive, the Downed Woody Debris category includes dissimilar fuel types (for example, measurements of mulch and 1,000-hr woody debris) and a range of years since treatment, resulting in variable responses. When all treatments were combined, Litter (n = 79 [15]) had mostly non-significant responses (68 percent) and >2 times more positive (22 percent) than negative (10 percent) responses (fig. 11). This trend was similar for both cutting (n = 61 [12]) and mastication (n = 18 [7]). Concerning secondary treatments after cutting, there were only four Litter responses (one negative and three non-significant) for seeding, only one positive response for pile burning, and five responses for off-site tree removal (four non-significant and one positive). Bare Ground Cover was generally unchanged after treatment, with mostly non-significant responses (66 percent) among all treatment types combined (n = 100 [16]), but with nearly 6 times more negative (29 percent) than positive (5 percent) responses (fig. 11). Mastication (n = 33 [9]) resulted in 13 times more negative (39 percent) than positive (3 percent) Bare Ground Cover responses, and cutting only (n = 58 [9]) resulted in 14 times more negative (28 percent) than positive (2 percent) responses. However, secondary treatments following cutting suggest potential for increasing Bare Ground Cover. Two of three Bare Ground Cover responses for pile burning treatments were positive, and one of six responses after off-site tree removal were positive (the remaining were non-significant). There was little evidence that treatments benefited Biocrust Cover/Microbial Activity (n = 62 [8]), with 71 percent of responses non-significant among all treatment types combined, and >3 times more negative (23 percent) than positive (6 percent) responses (fig. 11). Biocrust Cover/Microbial Activity responses to cutting only (n = 27 [6]) were predominantly negative (52 percent), with the remaining responses non-significant (48 percent). Following secondary treatments after cutting, pile burning had 92 percent non-significant and 8 percent positive responses (n = 13 [2]), while tree removal had only one non-significant response, and seeding had no responses. Few studies reported on Biocrust Cover/Microbial Activity following mastication (n = 21 [4]), with 86 percent non-significant and 14 percent positive responses.
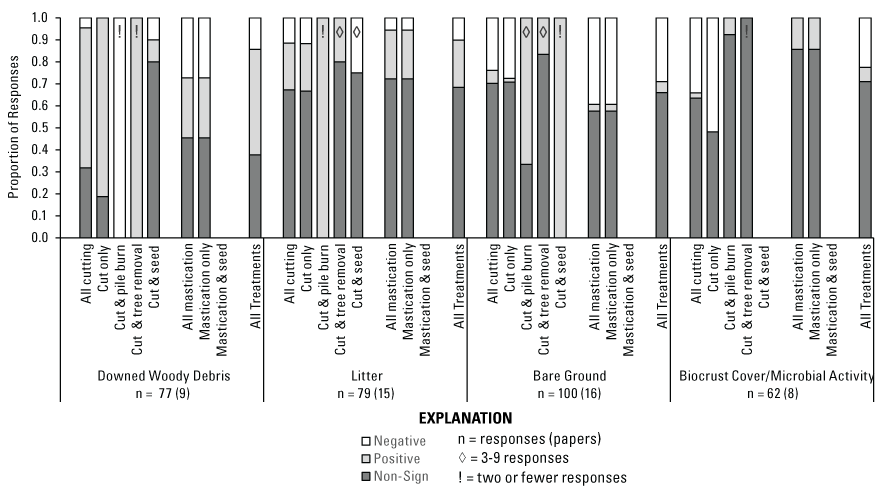
Proportion of ground cover category responses that were negative, positive, or non-significant by Pinyon-Juniper Management Categorical Exclusion treatment type (see fig. 5, table 4). Missing bars for a treatment type indicate no data were available. An exclamation mark (!) within a bar indicates 2 or fewer responses, a diamond (◊) indicates 3–9 responses were available, and unmarked bars represent 10 or more responses. For each category, n = number of responses (number of papers) evaluated.
Abiotic-Water Responses to Treatments
When all treatments were combined, Soil Water (n = 47 [6]) had a slight majority of positive responses (51 percent), with most (47 percent) of the remaining responses non-significant (fig. 12). Notably, most of the Soil Water responses (n = 38 [3]) were included in the three papers (Ashcroft and others, 2017; Roundy and others, 2018, 2020) that were assigned to cutting treatments, but in which some mastication was also conducted. Following cutting only (n = 41 [4], including 38 responses with some degree of mastication), responses were 56 percent positive, 42 percent non-significant, and 2 percent negative (fig. 12). When off-site tree removal followed cutting (n = 6 [2], including 4 responses with some degree of mastication), there were 83 percent non-significant responses, with the remaining positive (17 percent; fig. 12). Hydrologic responses (n = 157 [6]), which include measures of water runoff/flow and sediment yield, were mostly non-significant (83 percent), but there were more negative (11 percent) than positive (6 percent) responses among all treatment types combined (fig. 12). Hydrologic responses to cutting and mastication treatments (n = 103 [5] and n = 54 [3], respectively) were also mostly non-significant (82 percent and 85 percent, respectively). However, the remaining responses to cutting were split nearly evenly between positive and negative, while the remaining mastication responses were only negative. Regarding secondary treatments after cutting, off-site tree removal had just twelve Hydrologic responses from a single study (Ashcroft and others, 2017), and these were evenly split between negative and non-significant. No included studies evaluated Hydrologic response variables for pile burning or seeding after cutting treatments.
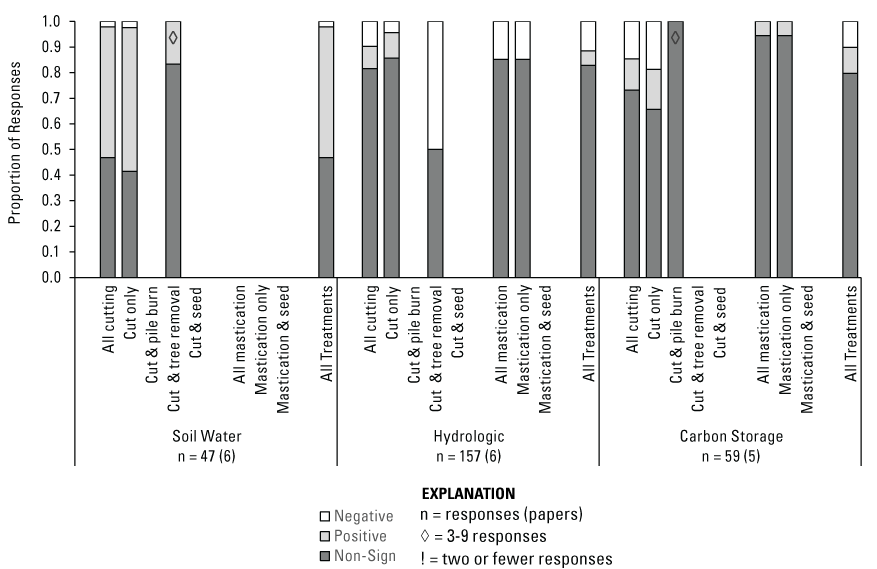
Proportion of water-related and carbon storage category responses that were negative, positive, or non-significant by Pinyon-Juniper Management Categorical Exclusion treatment type (see figure 5, table 5). Missing bars for a treatment type indicate no data were available. An exclamation mark (!) within a bar indicates 2 or fewer responses, a diamond (◊) indicates 3–9 responses, and unmarked bars represent 10 or more responses. For each category, n = number of responses (number of papers) evaluated.
Table 5.
Number of responses (number of papers) by Pinyon-Juniper Management Categorical Exclusion treatment type for soil water, hydrologic, and carbon storage response categories.[Many papers included more than one treatment and (or) more than one response variable, so the total studies by treatment and response variable is less than the sum of each column.]
Carbon Storage Responses to Treatments
The overall effects of treatments on Carbon Storage (n = 59 [5]) were ambiguous, as 80 percent of responses from the reviewed studies were non-significant, and the remaining responses were split evenly (10 percent each) between positive and negative (fig. 12). No clear patterns emerged for belowground (that is, soil and root) Carbon Storage (n = 52), with 88 percent of responses non-significant, 10 percent positive, and 2 percent negative. There were only 6 total responses (n = 5 negative, 1 positive) for aboveground Carbon Storage, and one additional non-significant response measured both total above and belowground Carbon Storage. The majority of Carbon Storage responses were for cutting only (n = 32 [3]), with 66 percent of responses non-significant, 16 percent positive, and 19 percent negative. Only one paper reported on pile burning (n = 9) following cutting, with all responses non-significant. Mastication treatment effects on Carbon Storage (n = 18 [3]) were overwhelmingly non-significant (94 percent), with the remaining responses positive.
Wildlife Responses to Treatments
Number of Papers and Responses Found
We identified 238 papers that met our search criteria for wildlife responses to PJCX-permitted treatments in the Web of Science database. We reviewed an additional 100 of the most relevant papers returned by the Google Scholar database, 44 of which were already included in our Web of Science search. Of the 294 papers assessed, 11 of them were relevant based on our selection criteria. Most of the excluded papers either did not measure wildlife responses, did not include PJCX-permitted treatments, or did not include pinyon-juniper species addressed in this review. One of the included papers (McIver and Macke, 2014) was also included in the review by Bombaci and Pejchar (2016).
Most of the 11 papers that met our selection criteria considered more than one type of treatment. In total, eight considered cutting, five included mastication, five included pile burning, one included seeding, and one included tree removal (table 6; fig. 13). In one of the papers that included mastication (Bristow and others, 2020), 9 percent of plots had been burned by wildfire before treatment; these plots were combined with unburned plots in the reported responses and, thus, were included in our results. Two papers included both cutting and mastication treatments. One of these reported wildlife responses separately for each treatment (McIver and Macke, 2014), whereas the other paper reported most responses (18 of 28) for both treatments combined (Magee and others, 2019; fig. 13). Thus, for this second paper, we report the 18 combined cutting and mastication responses in a separate category. Six papers included either secondary or tertiary treatments (four papers had cutting then pile burning; one had cutting then tree removal; and one had cutting followed by pile burning and seeding). We did not find any papers that specifically mentioned wildlife responses to yarding and piling treatments.
Table 6.
Number of responses (number of papers) by Pinyon-Juniper Management Categorical Exclusion treatment type for wildlife response categories.[One paper included both cutting and mastication treatments but reported responses (Community response type) to each treatment separately. A second paper included both cutting and mastication treatments but reported some responses (Habitat-Related response type) to each treatment separately and other responses combined. Many papers included more than one treatment and (or) more than one response variable, so the total studies by treatment and response variable is less than the sum of each column.]
![A flowchart depicting the hierarchical treatment framework used to assess wildlife
responses: the combined, primary, and secondary treatment levels are consistently
reported in this assessment. The total number of responses and total number of peer-reviewed
papers (n = responses [papers]) from which the data were obtained are indicated in
each box (a single paper may have tested responses to more than one treatment or combination
of treatments). Treatments are divided into three primary treatment types (All Cutting,
Cutting and Mastication, and All Mastication). All cutting is further divided into
secondary and tertiary treatments, while the other two primary treatments did not
include additional treatments.](https://pubs.usgs.gov/of/2023/1041/images/ofr20231041_fig13.png)
Flowchart depicting the hierarchical treatment framework used to assess wildlife responses: the combined, primary, and secondary treatment levels are consistently reported in this assessment. The total number of responses and total number of peer-reviewed papers (n = responses [papers]) from which the data were obtained are indicated in each box (a single paper may have tested responses to more than one treatment or combination of treatments).
From the 11 papers, we identified 132 responses to treatments, of which 48 percent were non-significant, 22 percent were positive, and 30 percent were negative. However, the prevailing direction (positive or negative) of significant responses varied by treatment type, response type, taxonomic group, and habitat functional group (figs. 14–16). In general, regardless of the treatment type, Habitat-Related responses were most frequently reported (n = 74 [5]; table 6), with Community-Level (n = 31 [4]) and Demographic (other than reproductive; n = 24 [3]) responses also common. Reproductive (n = 3 [3]) responses were infrequently reported (table 6).]
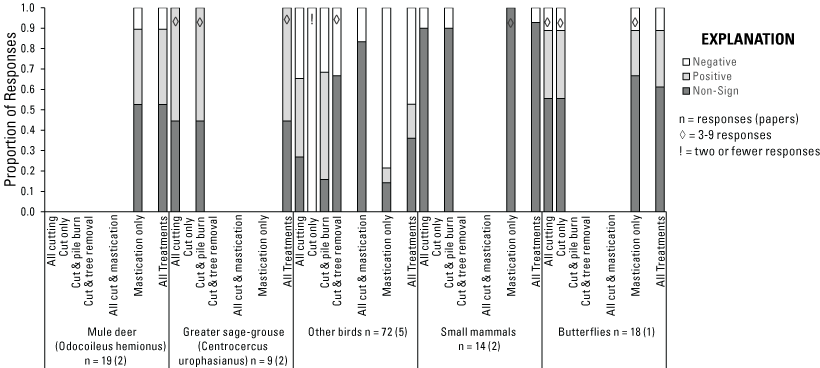
Proportion of wildlife responses that were positive, negative, or non-significant within taxonomic groups and by Pinyon-Juniper Management Categorical Exclusion treatment type (see fig. 13, table 6). Missing bars for a category indicate no data were available. An exclamation mark (!) within a bar indicates 2 or fewer responses, a diamond (◊) indicates 3–9 responses, and unmarked bars represent 10 or more responses. For each category, n = number of responses (number of papers) evaluated.
Geographical, Ecological, and Treatment Context of Studies Included
There were 52 reported study sites among our 11 papers that addressed wildlife responses to PJCX-permitted treatments (maximum = 29 sites; Magee and others, 2019). Study sites were distributed across seven western states, with the majority (73 percent) of sampling conducted in Colorado (60 percent) and New Mexico (13 percent). Nine woodland sites within the SageSTEP network were sampled in one paper, which reported butterfly responses (McIver and Macke, 2014). One location was sampled in two papers, both of which reported sage-grouse responses (Severson and others, 2017c, 2017d). Most papers did not provide coordinates of study sites and thus we do not specifically organize studies by ecoregion; however, approximate locations are mapped (fig. 6) and most sites are in or near the Southern Rockies and the Northern Basin and Range ecoregions. Studies occurred across a broad range of elevations (800–2,832 meters [m]; 10 papers) and annual precipitation (242–462 millimeters [mm]; 7 papers).
All 11 papers specified the pinyon and (or) juniper species treated. The most commonly treated tree species was Pinus edulis (seven papers), while only one paper examined treatment of P. monophylla. No papers treated pinyon species alone, and most included at least one pinyon and one juniper species (eight papers; fig. 7B).
Study areas ranged from local to regional scales, with the smallest study encompassing approximately 120 ha and the largest spanning multiple ecoregions and four states. The paper with regional scale extent included study sites within the SageSTEP network and reported butterfly responses (McIver and Macke, 2014). Total PJCX treatment area ranged from 7 ha to approximately 6,500 ha when reported (9 papers); however, the actual area studied did not always encompass the entire treatment area. When the sizes of individual treatments were reported (5 papers), treatments ranged from 1 ha to a mean of 144 ha. The two papers that studied the same location included a total area of 6,488 ha that was treated from 2007 to 2014 and reported sage-grouse responses (Severson and others, 2017c, 2017d).
Time since treatment ranged from <1 to 11 years. Four papers measured responses ≤3 years and 4–8 years after treatment, and three papers measured responses 9–11 years after treatment (fig. 8B). When considering responses that we could confidently place into one of the aforementioned time periods reported (n = 59), 39 percent of responses were measured ≤3 years, and 6 percent were measured 4–8 years; the remaining responses were reported across temporal scales. The earliest treatment application occurred in 2002 and the most recent was in 2018.
Habitat-Related Responses
Papers that measured Habitat-Related wildlife responses relative to PJCX-permitted treatments focused on mule deer (n = 19 [2]), greater sage-grouse (n = 5 [1]), and songbirds (n = 50 [2]; fig. 15). For mule deer, habitat selection was inconsistent by season, treatment age, and primary land cover type. In one paper, selection by mule deer was generally for pinyon-juniper savanna more than pinyon-juniper woodlands, and the deer selected for recently treated (that is, 2 years previously) areas in summer but for older treatment (that is, 4 years previously) areas in winter (Sorensen and others, 2020). In the second paper, mule deer selected for lower vegetation heights, but treatment age was not associated with habitat selection (Bristow and others, 2020). For sage-grouse, Habitat-Related responses included both habitat use and selection. In a Before-After-Control-Impact (BACI) study, extent of nesting habitat was predicted to have increased each year after three consecutive years of treatment (Severson and others, 2017c). When habitat selection was measured, sage-grouse selected for older-treated areas (22 percent increase in probability of use each year after treatment) and sites closer to treatments (5.5 percent decrease in probability of use for every 100 m away from treatments; Severson and others, 2017c).
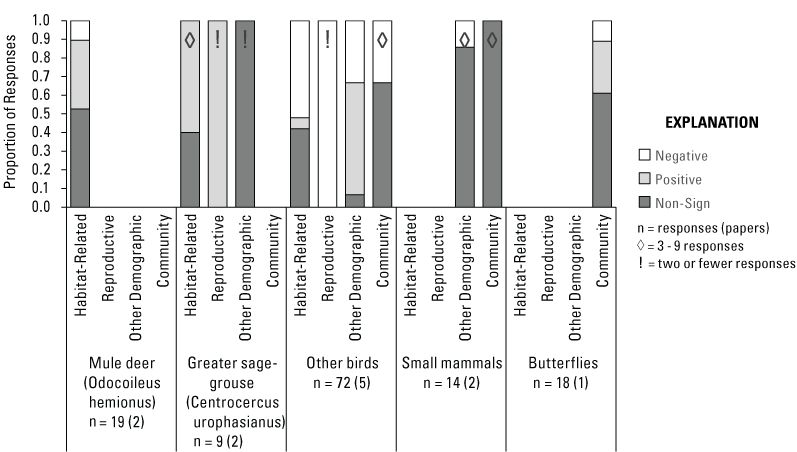
Proportion of habitat-related, reproductive, other demographic, and community responses (within taxonomic group) to Pinyon-Juniper Management Categorical Exclusion treatment type (see fig. 13, table 6) that were positive, negative, or non-significant. Missing bars for a category indicate no data were available. An exclamation mark (!) within a bar indicates 2 or fewer responses, a diamond (◊) indicates 3–9 responses, and unmarked bars represent 10 or more responses. For each category, n = number of responses (number of papers) evaluated.
Finally, responses for songbirds were studied exclusively for habitat use. Most pinyon-juniper specialists and other woodland species used treated areas less or no differently than they used control areas, whereas one shrubland-grassland species (lark sparrow [Chondestes grammacus]) used treated areas more than it used control areas (Magee and others, 2019). Bird species associated with both dense and open woodlands used treated areas less than they used control areas (Bombaci and others, 2017).
Community-Level Responses
Papers that measured response of Community-Level parameters to treatments focused on butterflies (n = 18 [1]), birds (n = 6 [1]), and small mammals (n = 7 [2]; fig. 15). For butterflies, abundance and richness of local species did not differ between treatment and control areas (McIver and Macke, 2014). Additionally, transient whites, legume-feeding sulfurs, and Melissa blues (Plebejus melissa) were more abundant in treated areas relative to control areas, whereas juniper hairstreaks (Callophrys gryneus) were less abundant (McIver and Macke, 2014). For birds, richness and overall abundance for a community of songbirds and raptors declined faster in treated than in untreated sites, but species diversity did not change (Fair and others, 2018). Finally, for small mammals, species richness, evenness, and biomass (that is, the sum of the mean masses of each captured individual) did not change after treatment (Hamilton and others, 2019). In another study, abundances of deer mice (Peromyscus maniculatus) and least chipmunks (Tamias minimus) did not differ between treated and control areas (Bombaci and others, 2017).
Reproductive Responses
Papers that measured Reproductive responses to treatments focused on greater sage-grouse (n = 2 [2]) and pinyon jays (Gymnorhinus cyanocephalus; n = 1 [1]; fig. 15). For sage-grouse, nest success was higher (19 percent increase) within treated areas relative to the control area (Severson and others, 2017d). Nest abundance was predicted to have increased by 9.5 percent during each of the 3 years after treatment (Severson and others, 2017c). Pinyon jays abandoned nesting in treated sites, although they did often nest near treatments (Johnson and others, 2018).
Other Demographic Responses
Three papers measured Other Demographic responses to treatments and focused on greater sage-grouse (n = 2 [1]), small mammals (n = 7 [1]), and songbirds (n = 15 [1]; fig. 15). Annual survival and population growth rate of female sage-grouse did not differ significantly between treatment and control areas (Severson and others, 2017d). Density of small mammals, both overall and for most species, did not change after treatment (Hamilton and others, 2019). The one exception to this pattern was for the piñon mouse (Peromyscus truei), which declined in density following treatment. Finally, some sagebrush, grassland, and shrubland songbird species had higher density, and one shrubland-grassland species (rock wren; Salpinctes obsoletus) and one woodland-shrubland species (gray flycatcher) had lower density, in treated areas relative to control areas (Holmes and others, 2017).
Discussion
Among the most notable findings from this review is that ecological responses following PJCX-permitted treatments were often non-significant, and therefore did not indicate either desirable or undesirable management outcomes. Across the entire spectrum of treatments and response categories, roughly half of all responses were non-significant (60 percent for vegetation-environmental, 48 percent for wildlife). The relative dominance of non-significant results found here is comparable to other systematic reviews of pinyon-juniper treatment effects. For instance, Jones (2019) reported that 64 percent of perennial herbaceous responses to mechanical pinyon-juniper tree removal were non-significant. Compared to our finding of an even split between significant and non-significant wildlife responses, Bombaci and Pejchar (2016) found that a substantial majority (69 percent) of wildlife responses to pinyon-juniper treatments were non-significant. Although these previous reviews included treatment types not permitted by the PJCX, collective review results suggest tree removal treatments neither significantly increased many valued ecosystem components and processes nor decreased undesirable ones.
Importantly, the predominance of non-significant effects may belie the potential for desirable outcomes for land managers, at least under certain environmental conditions and within certain time periods after treatment. This is in part because more comprehensive or fully crossed experimental designs may consider a range of conditions and treatments that are unlikely to be utilized by land managers or are measured at time intervals for which desirable outcomes are not expected or achieved. The objective of experimental research is often to better understand the range of treatments, environmental conditions, and their interactions over time, under which successful outcomes can be achieved, and not an expectation that desirable results will occur under all such conditions or time steps. Furthermore, studies that encompass broader spatial scales often pool responses of numerous sites (for example, Monaco and Gunnell, 2020), potentially diminishing their impact when combined with a similar number of responses from highly localized studies, and thus underscoring the need to better address research differences among disparate spatial scales. Thus, whether non-significant responses dominated or not among our findings, we highlight directional trends in responses (both positive and negative) to improve our understanding of the types of treatments and environmental conditions that may drive those directional outcomes. We discuss key considerations regarding potential trends, below.
Trends and Variability among Vegetation-Environmental Responses to Treatments
Notable differences among individual response categories to treatments are provided in table 7 and are operationally defined here as those with at least 10 responses and a substantial difference (≥25 percent) between the proportion of positive and negative responses. Based on these criteria, the most evident trend in vegetation-environmental responses is one that is largely undesirable for restoration purposes: overall exotic grass and forb abundance generally had far more positive than negative responses among nearly all treatment types (fig. 9, appendix 1). All mastication treatments and cutting only resulted in the highest proportion of positive responses (58 and 52 percent, respectively) for exotic species abundance (with no negative responses for either). The increase in exotic annual species after treatment is similar to review findings by Jones (2019) in which half of non-native annual species responses increased while the other half were non-significant following treatments in pinyon-juniper ecosystems (including treatment types not permitted by the PJCX). Exotic annual species are increasingly identified as a threat to successful restoration of sagebrush habitat, due to factors such as direct competition with native species, altered nutrient and soil water availability, and initiation of a frequent fire regime that favors exotic species persistence (for example, Huffman and others, 2017; Wilder and others, 2019; Monaco and Gunnell, 2020). Moreover, some treatments decreased native species richness and abundance, especially cutting followed by pile burning. Another undesirable outcome is the general decrease in biocrust cover and microbial activity following cut only treatments, with mostly (52 percent) negative and no positive responses. Loss of biocrusts alters soil chemistry and soil water content and can destabilize native plant communities while facilitating invasion of exotic plants (Ponzetti and others, 2007; Condon and Pyke, 2018).
Table 7.
Summary of responses organized by treatment type and (or) level for which there were greater than or equal to (≥) 10 responses to assess and the absolute differences between positive and negative responses was ≥25 percent, suggesting a potential directional trend.[Bold indicates that the number of positive or negative responses comprised a majority (greater than (>) 50 percent) of all responses (appendix 1). Due to the small number of responses that were masticated and seeded, potential mastication trends identified here are primarily driven by mastication only treatments. Abbreviations: N/A, not applicable (that is, not enough responses or no clear trend). Symbols: POS, positive response; NEG, negative response.]
Improvement of the understory plant community to restore ecosystem function and wildlife habitat is among the most desirable treatment effects of pinyon-juniper removal by land managers (Miller and others, 2019). In this review, abundance of native herbaceous plant species was found to increase more often after mastication than following cutting. Mastication leaves shredded tree material distributed over the soil surface which can increase available soil water and nitrogen mineralization that are beneficial to both native and exotic plant species (Young and others, 2013b; Aanderud and others, 2017). For shrubs, which are a critical habitat component for species such as sage grouse, cutting only was most likely to result in increased abundance, including for sagebrush. Cutting can increase available light, soil moisture and nutrients after treatment, and can potentially prolong the growing season, which improves conditions for native shrub development in semiarid environments (for example, Roundy and others, 2014b). However, meeting native understory restoration objectives after tree removal, especially for shrubs, should be weighed against our finding of a higher likelihood of non-significant responses among all treatment types. Indeed, despite increases after treatment, researchers have found that shrub composition was that of an immature community at high tree dominance sites (Freund and others, 2021), shrub cover remained far below site potential (Bates and others, 2017b), or shrubs that established were of little importance to wildlife (Dittel and others, 2018).
There were also consistently more positive than negative responses for general understory vegetation (that is, including both native and exotic species) among nearly all treatment types (except pile burning), which can be considered a desirable outcome for some management objectives, such as minimizing soil-water runoff (for example, Williams and others, 2019). Additionally, we found cutting and mastication without secondary treatments resulted in more positive than negative responses for perennial plant species abundance (native and exotic), similar to results found by Jones (2019). Monaco and Gunnell (2020) also found pronounced return of perennial plant species across a range of prior treatment conditions in Utah, likely resulting from both unaided recovery and due to positive effects of seeding. However, depending on the abundance and composition of exotic species, such understory responses may also result in enhanced fire risk, loss of native diversity, and inadequate wildlife habitat conditions (Arkle and others, 2014; Chambers and others, 2021).
Other potential trends identified in this review include decreases in bare ground cover following cutting only and mastication treatments, as well as increases in downed woody debris and litter among many treatments (table 7). These soil surface conditions may help enhance soil moisture and nutrients beneficial for native plant species recovery, as well as prevent water runoff and soil loss (Williams and others, 2019). Indeed, soil water content increased more than decreased following cut only treatments assessed in this review (including several sites with some degree of mastication), as both cutting and mastication treatments have been shown to increase soil moisture (Young and others, 2013a; Roundy and others, 2014b). Both ground cover and soil moisture have been shown to aid the establishment and eventual persistence of native perennial herbaceous species and can facilitate soil crust development, but they can also aid the establishment of exotic annual plants, depending on factors such as the seasonal timing of precipitation, soil texture, and seedbank conditions (Roundy and others, 2018; Johnston, 2019). Another potential disadvantage is that abundant herbaceous litter and woody debris enhance highly flammable surface fuel loadings that may increase the risk that subsequent fire will counteract restoration gains (Coop and others, 2017) by increasing fire intensity effects on soils (Brooks, 2008).
The reasons for variable outcomes among studies include not only the effects of specific treatment types, but also treatment interactions with environmental settings (for example, edaphic conditions), plant composition and developmental stage of woodlands prior to treatment, and pre- and post-treatment effects of disturbance (for example, fire), land use (for example, grazing), and climate (for example, Bates and others, 2014a; Williams and others, 2020). Unfortunately, there were far too many sources of variation among studies to accurately account for such interactions in this review, as well as inconsistent or insufficient reporting of key environmental conditions among many papers reviewed. However, we can provide some context and examples from the relevant scientific literature. For instance, sites in wetter and cooler climates tend to have higher resistance to exotic species invasion and greater resilience after disturbance, and thus are more likely to support recovery of native grasses and forbs, compared to warmer and drier environments (Chambers and others, 2014, 2016; Roundy and others, 2018). Thus, exotic annual species responses to treatment can vary greatly along environmental gradients, with warmer-drier soil temperature-precipitation regimes generally less resistant to exotic annual invasion after treatment, while sites with cool-moist soil types are generally more conducive to successful recovery of native plant species after treatment (Chambers and others, 2019, 2021). Competition from successfully restored native perennial plants can reduce exotic plant abundance (Prévey and others, 2010; Davies and others, 2019), as was found in sites with cooler fall and wet winter climates in the Great Basin (Roundy and others, 2018).
Soil moisture and temperature regimes alone do not always strongly correspond to expected vegetation trajectories after treatment. For example, Monaco and Gunnell (2020) found pronounced return of perennial plant species in a study of 129 previously treated woodland sites distributed across a range of climatic and environmental settings in Utah. Thus, other interactions among multiple factors, including pre-treatment vegetation, seed bank composition, post-treatment climatic variability, and woodland development also need to be considered (Miller and others, 2019). For example, the relative success of seeding to limit exotic plant invasion is often dependent on the abundance of nonnative plants before treatment, especially in less resistant and resilient landscapes (for example, Urza and others, 2019). Variability in climate conditions after seeding is also a key determinant of successful reestablishment of native shrubland species, and meeting restoration objectives in these semi-arid environments through planting or reseeding remains a challenge due to this factor (Arkle and others, 2014; Brabec and others, 2015). Finally, pre-treatment woodland floristics and structural conditions may also be critical for post-treatment restoration success, though results can be highly variable (Stephens and others, 2016; Williams and others, 2017; Wilder and others, 2019; Bates and others, 2000). For instance, although cutting stands in earlier stages of woodland development may be more likely to retain a mature shrub component (Miller and others, 2019), post-treatment shrub abundance and growth responses vary among studies, likely due to differences among treatments, development phases, and environmental settings (for example, Williams and others, 2017; Bernau and others, 2018; Freund and others, 2021). In contrast, some research suggests tree removal in more advanced pinyon-juniper development stages can enhance hydrologic functionality under certain environmental conditions (Williams and others, 2020), which may promote greater resiliency after a subsequent disturbance (Jacobs, 2015).
Trends and Variability among Wildlife Responses to Treatments
Although the number of papers reporting wildlife responses were far fewer than for those reporting vegetation-environmental responses, overall, authors again reported largely non-significant responses (48 percent), less than that found by Bombaci and Pejchar (2016). However, we were able to identify some potentially important trends and patterns. Wildlife responses varied by taxonomic group (appendix 2). There were more positive than negative responses for mule deer and sage-grouse compared to other groups of species. However, mule deer responses were restricted to consideration of habitat-related responses, and demographic responses were not reported. For birds other than sage-grouse, there were far more negative than positive responses, although most studies focused on woodland or woodland-shrubland species. For small mammals and butterflies there were mostly non-significant responses. However, in cases where communities were studied for these two species groups, positive responses for some species and negative responses for others may have canceled each other out, creating the appearance of community-level non-significant responses.
Positive responses from sage-grouse were limited to habitat-related and reproductive responses. Selection of nesting sites in treated areas and increasing nest success was observed as soon as one year after conifer removal and there were (non-significant) trends of increasing hen survival for three years. The fact that nest success began increasing within one year of conifer removal suggests that this response may not have been mediated via changes in cover from shrubs, but instead was mediated directly by effects of tree removal (that is, via rapid changes in numbers of predators or improved forage availability). Increases in shrub cover would likely require multiple growing seasons to achieve magnitudes large enough to contribute to increased nest success. Indeed, a study that reported increases in sage-grouse nest success (Severson and others, 2017d) did not observe increased shrub cover within three years after conifer removal (but did observe increased shrub height), as reported in a companion paper (Severson and others, 2017b). Instead, this pattern may be in direct response to conifer removal (that is, grouse respond to tree structures themselves) or a flush of growth in herbaceous cover brought on by added sunlight or moisture, or mediated through other responses such as an altered predator community (Severson and others, 2017b; Olsen and others, 2021b). The non-significant trend towards improved hen survival suggests a lag effect that may reflect the time needed for improved resource availability to be realized (Severson and others, 2017d). Thus, understanding of sage-grouse responses to conifer removal will benefit from long-term (>3 years post-removal) monitoring.
Studies investigating mule deer responses were even more limited, focusing only on habitat selection behavior after mastication. The fact that 89 percent of the responses were positive or non-significant suggests that this species is likely to respond well to PJCX-permitted treatments. Furthermore, these results are consistent with observations suggesting that despite the value of some trees for cover, this species generally avoids areas with higher tree cover (Morano and others, 2019). That said, the studies we evaluated (Sorensen and others, 2020; Bristow and others, 2020) reported conflicting evidence as to whether these positive responses would increase or decrease with time since treatment. Finally, habitat selection by mule deer varies dramatically by season (for example, Coe and others, 2018; Eckrich and others, 2020), and there is evidence that response of deer to PJCX-permitted treatments varied by season (Sorensen and others, 2020). Understanding seasonal variation in response to PJCX-permitted treatments may therefore be an important area for future research.
When considered by habitat functional groups, the highest proportion of positive responses were from sagebrush obligates (8 of 12), followed by shrubland-grassland species (13 of 26; fig. 16). Importantly, there were no negative responses reported for sagebrush obligates. There were also no positive responses to any treatments reported for woodland or woodland-shrubland species. In fact, woodland species experienced mostly negative responses, more often than woodland-shrubland species. Tree removal often results in near-immediate loss of vertical structure associated with the tree canopy; therefore, animals that nest or forage in trees are expected to be negatively impacted. However, given recent expansion of pinyon-juniper woodlands, many species associated with these habitats are assumed to not be of significant conservation concern, with the exception of specialists like pinyon jay, juniper titmouse (Baeolophus ridgwayi), and gray flycatcher (Johnson and others, 2018; Magee and others, 2019). Unsurprisingly, habitat generalists exhibited mostly non-significant responses (fig. 16).
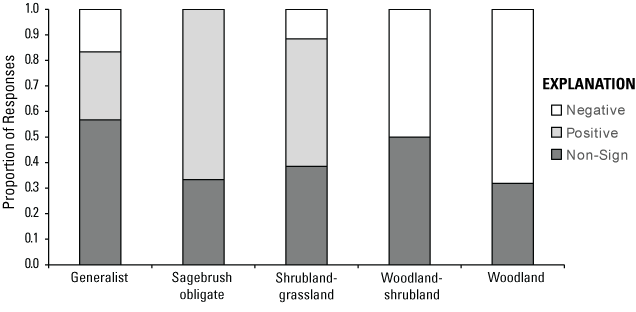
Proportion of habitat functional group responses to Pinyon-Juniper Management Categorical Exclusion treatment that were positive, negative, or non-significant. Sixteen responses (12 percent) were for pooled species and, thus, were not assigned to a habitat functional group.
There were also some informative differences in wildlife responses to treatment types. Relative to mastication, cutting seemed to be more commonly associated with positive than negative outcomes for use of habitat (appendix 3). This could be because of the change in habitat or the fact that downed woody debris creates habitat for some species of wildlife (Albert and others, 2004; Boone and others, 2021). However, all papers in our review that reported habitat-related responses and included cutting treatments also pile-burned after cutting, so any effects of downed woody debris would depend on how long it remained in treated plots before burning. Most community responses were non-significant, whether treatments were cutting or mastication. Non-reproductive demographic responses were always in cutting treatments and were fairly evenly distributed between positive, negative, and non-significant responses. Our sample size of studies is insufficient to evaluate drivers of these patterns in detail, but it is possible that further study could elucidate relationships that we did not detect in the few papers we were able to consider. For example, it seems reasonable to expect that longer-term studies (>15 years) may be more likely to show positive demographic or community responses, since the downed woody debris and sagebrush in these habitats may provide important structure and food resources as pinyon-juniper is replaced by sagebrush. Likewise, studies in a greater variety of habitat types may allow identification of differences in wildlife response to removal of different species dominating pinyon-juniper woodlands. In particular, trophic relationships may differ between animals and pinyon versus juniper trees, which could contribute to geographic and taxonomic variation in animal responses to pinyon-juniper removal.
Data Gaps and Research Needs
Need for Continuous Long-term Study Across Multiple Spatial Scales
The value of long-term data collection and analysis has been widely recognized in ecological research (Likens, 1989; Lindenmayer and others, 2012). The studies included in our review varied widely in terms of the period of measurement for post-treatment effects, with measured responses ranging from <1 year to 25 years after treatment. Although we found relatively even distribution among studies that sampled a maximum of 3 years, 4–8 years, or 9–13 years after treatment (fig. 8A), studies with responses measured beyond 13 years after treatment were nearly nonexistent (only 1 study for vegetation-environmental responses, and none for wildlife). Some of the longer-term studies were retrospective assessments of past management treatments of various ages (for example, Coop and others, 2017; Monaco and Gunnell, 2020), while others measured responses over time following experimental treatments (for example, Chambers and others, 2021). Moreover, when considered as a proportion of responses, short-term information was clearly more abundant than long-term information. For example, for vegetation-environmental responses that could be assigned a time since treatment (n = 1,619), 49 percent of responses were recorded ≤3 years post-treatment versus 3 percent for responses measured ≥14 years post-treatment (fig. 8B).
The relatively short duration of recently published studies may not be adequate to address complex community dynamics operating on timescales dictated by slow-growing perennial plants in the understory and long-lived pinyon-juniper tree species, a concern that has been expressed by others. For instance, Hartsell and others (2020) reviewed the geographic and temporal context of 131 pinyon-juniper treatment-based studies that occurred over a longer publication period and wider variety of treatment types than considered here (that is, types not permitted by the PJCX). They found most studies only measured management effects within one year of treatment and concluded this represented “…consistently short timescales for evaluating post-treatment effects and were not representative of the possible spatial or temporal extent of responses to management actions.”
Understanding differences between short-term and long-term vegetation-environmental and wildlife responses to pinyon-juniper removal treatments will be essential for land managers to estimate the potential for restoration success. For instance, although shrub response was 83 percent non-significant among short-term studies assessed here, positive responses of shrub abundance became the majority (69 percent) among studies that measured responses ≥10 years post-treatment. If shrub cover or abundance drives habitat use or demography for wildlife species, which is likely at minimum for the sagebrush-obligate birds during the breeding season, then wildlife responses may also need longer time scales to be fully realized. Similarly, there were more positive than negative responses from exotic annual plant species over time after treatment; however, because availability of responses over time decrease substantially and environmental settings vary, firm conclusions about temporal trends cannot be drawn based on these data alone. Other research has shown that the abundance of both native and exotic species can vary broadly over time after disturbance or treatment in pinyon-juniper and sagebrush ecosystems (for example, Shinneman and Baker, 2009; Chambers and others, 2014, 2021), as can hydrologic and other abiotic responses (for example, Williams and others, 2020). Although our wildlife dataset is also insufficient to assess temporal trends, well-established temporal trends in wildlife response to disturbance found elsewhere (for example, Sawyer and others, 2017; Poessel and others, 2020) suggest such trends are likely. For these reasons, research projects that regularly measure responses to treatments in semiarid rangelands over long time frames will become increasingly valuable to the land management decision-making process, including for treatments permitted under the PJCX. Several studies reviewed here are part of the multidisciplinary SageSTEP project (McIver and Brunson, 2014) that has investigated both short and long-term (>10 years) treatment effects for a variety of variables (for example, vegetation, wildlife, soils) using consistent and repeatable methods at sagebrush steppe and woodland sites throughout the Great Basin. Treatment monitoring protocols developed by SageSTEP can also be integrated into agency objectives for long-term monitoring programs (for example, Assessment, Inventory, and Monitoring; Kachergis and others, 2022).
The size of land management agency treatments often far surpasses those of the experimental design treatments that are established primarily for research purposes. Thus, long-term agency monitoring and assessment of plant, animal, and abiotic resources across a range of typical agency treatment sizes will also be important, especially when replicating large treatments for controlled scientific study is not practical or feasible. Only three papers assessed here measured vegetation-environmental responses where pinyon-juniper removal had individual treatments of greater than 100 contiguous hectares (the largest individual treatment size reported was 166 ha); a size far less than the maximum sizes of treatments in the past (table 2) and the 4,047-ha treatment size permitted under the PJCX. This gap between practice and research is important because many ecological outcomes may be influenced by the size and placement of treatments. For instance, sagebrush shrub re-establishment into the interiors of disturbed areas may decrease with distance to seed sources (Young and Evans, 1989), necessitating a greater focus on seeding after treatment in larger treated areas (Davies and Bates, 2019). Moreover, animal movement and demographic responses to treatments may also vary with treatment size, as well as with the relative placement of multiple treatment patches on the landscape (for example, treatment proximity or environmental setting), and the size of the study area relative to the size of the overall treatment (Doherty and others, 2010; Doherty and Driscoll, 2018). For animals, effects of pinyon-juniper may not be limited to the footprint of remaining, uncut stands. For example, if the composition or activity of predator communities is affected by pinyon-juniper cover, there could be effects of predators within a limited distance of remaining stands. Therefore, proximity to untreated areas may influence animal responses to treatments as well.
Under-Studied Pinyon-Juniper Ecosystems
The geographic distribution of research sites (fig. 6) roughly corresponds to the geographic distribution of treatment history in pinyon-juniper woodlands (fig. 4), with heaviest concentrations of both activities in the ecoregions comprising the central to northern Great Basin and adjacent areas, and secondarily scattered within or near the Colorado Plateau and Arizona-New Mexico Plateau ecoregions. However, as woody species expand into various grassland and shrubland ecosystems in the western U.S., there is increasing interest to remove trees and restore non-wooded habitat across a range of environmental settings (Maestas and others, 2015; Falkowski and others, 2017; Reinhardt and others, 2020). For instance, although there are ongoing juniper removal projects occurring in ecoregions such as the Wyoming Basin and Middle Rocky Mountains, we found no peer-reviewed research addressing tree removal treatment effects in these regions. Thus, there is a need for commensurate increase in research for determining the efficacy of tree removal among various grassland and shrubland environments throughout the ecoregions of the western U.S. This need for geographic expansion is also reflected in the pinyon-juniper tree species being studied. Although some species are well-studied relative to their range-wide distribution, particularly P. edulis and J. occidentalis, other species lack regional representation in treatment research, for instance a lack of studies for J. osteosperma across the entire northeastern portion of its range. Moreover, there are disproportionately few papers addressing wildlife effects after treatment in P. monophylla ecosystems, and relatively few vegetation-environmental research papers have addressed treatment effects in J. monosperma and J. scopulorum ecosystems relative to their overall distribution (figs. 1, 6). Using a broader set of criteria for study inclusion, Hartsell and others (2020) similarly found that treatment effect studies were lacking for individual pinyon-juniper species among various ecoregions, and especially for J. scopulorum.
Under-Studied Processes, Including Interactions with Land Use and Climate Change
Even among the vegetation-environmental response categories reported here, there were often relatively few or no responses among specific treatment-response category combinations (for example, response of native herbaceous species to mastication and seeding). Specifically, of the 171 possible combinations for vegetation-environmental variables (appendix 1), 33 percent had fewer than 10 responses, and 15 percent had no responses. Of the 40 possible combinations for wildlife variables (appendix 3), 70 percent had fewer than 10 responses, and 45 percent had no responses. Moreover, we were unable to assess the response of exotic perennial forbs and grasses to any treatment because that variable was not specifically assessed in any paper. Furthermore, information on 39 combinations of treatments and responses for the vegetation-environmental variables were from just 1 or 2 independent studies. Similarly, some categories reported here largely reflect the influence of a disproportionately large number of observations from a single study. Specifically, the soil water, hydrologic, and carbon storage response categories each had a single study comprise over half of the responses assessed in this review. Additionally, other post-treatment responses were poorly represented in qualified studies, and we did not analyze them in this review. For instance, soil chemistry responses were too few among specific nutrients to summarize effectively. Changes in soil chemistry such as soil nitrogen (N) availability can affect plant growth after treatment, especially invasive species such as cheatgrass. For instance, mulch left on the ground after mastication can increase N beneficial to invasive species (Young and others, 2013b), but can also enhance soil carbon (C), simulating the growth of soil microbes that in turn utilize and reduce inorganic N (Rhoades and others, 2012).
Only 35 percent of vegetation-environmental papers included in our review addressed tree responses after treatment (for example, Havrilla and others, 2017) and only 6 percent included measures of post-treatment tree reestablishment (for example, tree seedling density). Variability among response types (that is, different measures of abundance, density, or biomass) and imprecise or inconsistent reporting among studies made it difficult to assign a specific post-treatment year to each tree abundance response; thus, we did not attempt to collectively quantify a temporal pattern or trend in tree regrowth after treatment. However, this is critical information, as potential tree reestablishment and growth may impact long-term success rates of treatments, whether for habitat restoration or hydrologic function, and can inform the need for strategic retreatment schedules.
The effects of past and continuing land use were not specifically quantified or addressed in most studies. Perhaps the most glaring omission is that only two research papers (Jacobs, 2015; Dittel and others, 2018) reviewed here experimentally incorporated the effects of livestock grazing with tree removal treatments, and only 46 percent of studies mentioned whether treatment plots were grazed by cattle or not (for example, within a fenced livestock exclosure). Treatment interactions with livestock grazing can enhance tree seedling or exotic species survival over native herbaceous species, damage remnant soil crust or impede biocrust redevelopment, alter soil chemistry, and contribute to increased erosion (Neff and others, 2005; Shinneman and others, 2008; Shinneman and Baker, 2009; Condon and Pyke, 2018). Hartsell and others (2020) reported that only 31 percent of the studies they examined considered grazing impacts relative to treatment effects, which they suggested was inadequate given that grazing is a dominant land use in pinyon-juniper landscapes. Jones (2019) also found that most reviewed studies did not control for grazing following treatments. Moreover, few studies mentioned the previous treatment or disturbance history of the sites they studied (for example, past clearings, seedings of nonnative wheatgrasses), a process that is now facilitated by creation of databases on historical treatment records (using the LTDL; Pilliod and others, 2019) and historical wildfire perimeter data (for example, Welty and Jeffries, 2021). Given the availability of historical datasets, as future research is designed and implemented, it will be critical to ensure these types of past disturbances and their interactions are considered.
Only four of the vegetation-environmental papers reviewed here specifically examined the influence of ambient climate variability on responses to treatment, and none utilized experimental techniques to mimic potential climate change impacts on the efficacy of tree removal treatments. Post-treatment climate variability can have dramatic effects on regeneration success and species composition (for example, Chambers and others, 2014; Brabec and others, 2015). Climate-warming induced changes in the intensity and patterns of pinyon-juniper mortality events (for example, drought dieback, insect outbreaks, wildfire), declining recruitment, and shifts in species distribution also need to be considered more fully in future treatment research. For instance, a recent study (Shriver and others, 2022) suggests that P. edulis, P. monophylla, J. monosperma, and J. scopulorum populations are all declining in the western United States, especially in warmer and drier portions of their ranges, due to both enhanced rates of mortality and inadequate rates of recruitment. P. edulis experienced the largest proportion (24 percent) of its populations in decline (Shriver and others, 2022). The reasons for these changes are complex but include extensive drought-induced dieback events in some regions (Shaw and others, 2005; Brewer and others, 2017; Filippelli and others, 2020; Stanke and others, 2021). Intensified disturbance events may be followed by warmer and drier post-disturbance climates and interact with grazing or other dominant land uses that create inhospitable conditions for tree regeneration, especially for lower elevation forest and woodland ecotones (Stevens-Rumann and others, 2018; Urza and others, 2020). Such changes will have consequences for pinyon-juniper woodland distribution, plant species composition, hydrologic processes that determine availability of water resources, and wildlife habitat and food sources. For instance, substantial declines in pinyon seed production via periodic “masting” events could have serious ramifications for regeneration of pinyon trees as well as a host of wildlife species that depend on abundant seed as food (Redmond and others, 2012).
Management Implications and Conclusions
In this review, we assessed and summarized the potential effects of pinyon and juniper removal on plant and wildlife communities, as well as several non-living ecosystem components and processes (for example, bare ground, hydrologic, litter). In doing so, we were also able to assess potential ecological implications of different pinyon-juniper removal treatment types and strategies, and we highlighted several important gaps in our scientific understanding of how treatments might affect targeted ecosystems over space and time. A key finding is that although pinyon-juniper removal may have some intended benefits, risks from exotic species remain a primary concern, and site conditions and the probability of meeting objectives over the long-term should be carefully considered. Another key finding was that the amount of research available to confidently address likely outcomes of the many specific combinations of treatment types, ecosystem types, climate conditions, and relevant post-treatment time spans were lacking for many key variables of interest and settings (for example, tree regrowth over time among different pinyon-juniper woodland communities and species, wildlife responses for understudied taxonomic groups or species). Moreover, treatment sizes permitted under the PJCX were substantially larger (effectively an order of magnitude) than most treatments assessed in the peer-reviewed literature here. This precludes our ability to assess or even speculate confidently about many of the impacts and dynamics related to much larger treatments in progress or being planned.
The information summarized in this review can be used by land managers to assess the potential for either desirable or undesirable outcomes after pinyon-juniper removal treatments. However, to best inform the likelihood of potential outcomes, we suggest land managers also refer specifically to the research projects assessed here to determine their applicability to the treatments being considered, the similarity of environmental settings, the species being affected, the duration of the post-treatment data available (as an indication of certainty of effects over time), and other limitations of each study (for example, size of treatments). Online resources are currently available that provide access to even more comprehensive pinyon-juniper research activities and results (for example, the Pinyon Juniper Encroachment Education Project; https://www.pinyonjuniperproject.org/our-research). We also suggest this information be coupled with science-based guides to pinyon-juniper management (for example, Miller and others, 2005, 2019), and relevant agency monitoring information where available (Kachergis and others, 2022).
Finally, the substantial information gaps identified here regarding pinyon-juniper treatment effects suggest that enhancing opportunities for co-production of scientific research between land managers and scientists would provide important information to land management agencies. SageSTEP (McIver and Brunson, 2014) is an excellent model for this type of collaboration, and it will continue to provide information through ongoing research. However, additional broad-scale and long-term research would also be beneficial among the diverse environmental settings of pinyon-juniper woodlands in the interior western U.S. For instance, although not specifically addressed in this review, the goal of restoring sagebrush and grassland communities from pinyon-juniper “encroachment” is not always clearly defined for large portions of the interior west in terms of the fundamental drivers of woodland expansion or infilling. Indeed, other reviews have concluded that a “one-sized-fits-all” management approach may be misguided given the diversity of environmental settings and variable disturbance histories of pinyon-juniper woodlands (for example, Baker and Shinneman, 2004; Romme and others, 2009). Therefore, additional research that addresses key drivers of woodland expansion and die-off events, such as climate change and grazing impacts (Hartsell and others, 2020), should prove beneficial to long term management of pinyon-juniper woodlands and adjacent non-wooded ecosystems.
References Cited
Aanderud, Z.T., Schoolmaster, D.R., Rigby, D., Bybee, J., Campbell, T., and Roundy, B.A., 2017, Soils mediate the impact of fine woody debris on invasive and native grasses as whole trees are mechanically shredded into firebreaks in piñon-juniper woodlands: Journal of Arid Environments, v. 137, p. 60–68. [V-E; UNK]
Abdallah, M.A.B., Mata-González, R., Noller, J.S., and Ochoa, C.G., 2020, Ecosystem carbon in relation to woody plant encroachment and control—Juniper systems in Oregon, USA: Agriculture, Ecosystems and Environment, v. 290, article 106762, 10 p. [Also available at https://doi.org/10.1016/j.agee.2019.106762.] [V-E; 1]
Albert, S., Luna, N., Jensen, R., and Livingston, L., 2004, Restoring biodiversity to pinyon-juniper woodlands: Ecological Restoration, v. 22, no. 1, p. 18–23. [Also available at http://dx.doi.org/10.3368/er.22.1.18.]
Arkle, R.S., Pilliod, D.S., Hanser, S.E., Brooks, M.L., Chambers, J.C., Grace, J.B., Knutson, K.C., Pyke, D.A., Welty, J.L., and Wirth, T.A., 2014, Quantifying restoration effectiveness using multi-scale habitat models—Implications for sage-grouse in the Great Basin: Ecosphere, v. 5, no. 3, article 31, 32 p. [Also available at https://doi.org/10.1890/ES13-00278.1.]
Ashcroft, N.K., Jr., Fernald, A.G., VanLeeuwen, D.M., Baker, T.T., Cibils, A.F., and Boren, J.C., 2017, The effects of thinning trees and scattering slash on runoff and sediment yield within dense pinõn-juniper woodlands in New Mexico, United States: Journal of Soil and Water Conservation, v. 72, no. 2, p. 122–130. [V-E; 2]
Atamian, M.T., Sedinger, J.S., Heaton, J.S., and Blomberg, E.J., 2010, Landscape-level assessment of brood rearing habitat for greater sage-grouse in Nevada: The Journal of Wildlife Management, v. 74, no. 7, p. 1533–1543. [Also available at https://doi.org/10.2193/2009-226.]
Baker, W.L., and Shinneman, D.J., 2004, Fire and restoration of piñon-juniper woodlands in the western United States—A review: Forest Ecology and Management, v. 189, nos. 1–3, 21 p. [Also available at https://doi.org/10.1016/j.foreco.2003.09.006.]
Baruch-Mordo, S., Evans, J.S., Severson, J.P., Naugle, D.E., Maestas, J.D., Kiesecker, J.M., Falkowski, M.J., Hagen, C.A., and Reese, K.P., 2013, Saving sage-grouse from the trees—A proactive solution to reducing a key threat to a candidate species: Biological Conservation, v. 167, p. 233–241. [Also available at https://doi.org/10.1016/j.biocon.2013.08.017.]
Bates, J.D., Miller, R.F., and Svejcar, T.J., 2000, Understory dynamics in cut and uncut western juniper woodlands: Journal of Range Management, v. 53, no. 1, p. 119–126. [Also available at https://doi.org/10.2307/4003402.]
Bates, J.D., Sharp, R.N., and Davies, K.W., 2014b, Sagebrush steppe recovery after fire varies by development phase of Juniperus occidentalis woodland: International Journal of Wildland Fire, v. 23, no. 1, p. 117–130. [Also available at https://doi.org/10.1071/WF12206.]
Bender, L.C., Lomas, L.A., and Kamienski, T., 2007, Habitat effects on condition of doe mule deer in arid mixed woodland-grassland: Rangeland Ecology & Management, v. 60, no. 3, p. 277–284. [Also available at https://doi.org/10.2111/1551-5028(2007)60[277:HEOCOD]2.0.CO;2.]
Bernau, C.R., Strand, E.K., and Bunting, S.C., 2018, Fuel bed response to vegetation treatments in juniper-invaded sagebrush steppe: Fire Ecology, v. 14, no. 2, article 1, 13 p. [Also available at https://doi.org/10.1186/s42408-018-0002-z.] [V-E; SS1-3, SS5-6, SS8-13]
Bombaci, S., and Pejchar, L., 2016, Consequences of pinyon and juniper woodland reduction for wildlife in North America: Forest Ecology and Management, v. 365, p. 34–50. [Also available at https://doi.org/10.1016/j.foreco.2016.01.018.]
Boone, J.D., Ammon, E.M., and Johnson, K.D., 2018, Long-term declines in the pinyon jay and management implications for piñon–juniper woodlands, in Shuford, W.D., Gill, R.E., Jr., and Handel, C.M., ed., Trends and traditions—Avifaunal change in western North America, Studies of Western Birds: Camarillo, California, Western Field Ornithologists, v. 3, p. 190–197. [Also available at https://doi.org/10.21199/SWB3.10.]
Boone, J.D., Witt, C., and Ammon, E.M., 2021, Behavior-specific occurrence patterns of pinyon jays (Gymnorhinus cyanocephalus) in three Great Basin study areas and significance for pinyon-juniper woodland management: PLoS One, v. 16, no. 1, article 16:e0237621, 27 p. [Also available at https://journals.plos.org/plosone/article?id=10.1371/journal.pone.0237621.]
Brabec, M.M., Germino, M.J., Shinneman, D.J., Pilliod, D.S., McIlroy, S.K., and Arkle, R.S., 2015, Challenges of establishing big sagebrush (Artemisia tridentata) in rangeland restoration—Effects of herbicide, mowing, whole-community seeding, and sagebrush seed sources: Rangeland Ecology and Management, v. 68, no. 5, p. 432–435. [Also available at https://doi.org/10.1016/j.rama.2015.07.001.]
Brewer, W.L., Lippitt, C.L., Lippitt, C.D., and Litvak, M.E., 2017, Assessing drought-induced change in a piñon-juniper woodland with Landsat—A multiple endmember spectral mixture analysis approach: International Journal of Remote Sensing, v. 38, no. 14, p. 4156–4176. [Also available at https://doi.org/10.1080/01431161.2017.1317940.]
Bristow, K.D., Harding, L.E., Lucas, R.W., and McCall, T.C., 2020, Influence of fire severity and vegetation treatments on mule deer (Odocoileus hemionus) winter habitat use on the Kaibab Plateau, Arizona: Animal Production Science, v. 60, p. 1292–1302. [Also available at https://doi.org/10.1071/AN19373.] [W; 10]
Bureau of Land Management [BLM], 2020 BLM Pinyon Pine and Juniper Management Categorical Exclusion Verification Report, 67 p. [Available at https://eplanning.blm.gov/public_projects/nepa/1504279/20014611/250019705/2020.03.13_BLM_Proposed_PJCX_508.pdf.]
Casazza, M.L., Coates, P.S., and Overton, C.T., 2011, Linking habitat selection and brood success in greater sage-grouse, in Sandercock, B.K., Martin, K., and Segelbacher, G., eds., Ecology, conservation, and management of grouse: Berkeley, California, University of California Press, Studies in Avian Biology, no. 39, p. 151–167.
Chambers, J.C., Brooks, M.L., Germino, M.J., Maestas, J.D., Board, D.I., Jones, M.O., and Allred, B.W., 2019, Operationalizing resilience and resistance concepts to address invasive grass-fire cycles: Frontiers in Ecology and Evolution, v. 7, article 185, 25 p. [Also available at https://doi.org/10.3389/fevo.2019.00185.]
Chambers, J.C., Germino, M.J., Belnap, J., Brown, C.S., Schupp, E.W., and Clair, S.B.S., 2016, Plant community resistance to invasion by Bromus species—The roles of community attributes, Bromus interactions with plant communities, and Bromus traits, in Exotic brome-grasses in arid and semiarid ecosystems of the western US: Cham, Springer, p. 275–304.
Chambers, J.C., Miller, R.F., Board, D.I., Pyke, D.A., Roundy, B.A., Grace, J.B., Schupp, E.W., and Tausch, R.J., 2014, Resilience and resistance of sagebrush ecosystems—Implications for state and transition models and management treatments: Rangeland Ecology and Management, v. 67, no. 5, p. 440–454. [Also available at https://doi.org/10.2111/REM-D-13-00074.1.]
Chambers, J.C., Urza, A.K., Board, D.I., Miller, R.F., Pyke, D.A., Roundy, B.A., Schupp, E.W., and Tausch, R.J., 2021, Sagebrush recovery patterns after fuel treatments mediated by disturbance type and plant functional group interactions: Ecosphere, v. 12, no. 4, article e03450, 22 p. [Also available at https://doi.org/10.1002/ecs2.3450.]
Coates, P.S., Prochazka, B.G., Ricca, M.A., Gustafson, K.B., Ziegler, P., and Casazza, M.L., 2017, Pinyon and juniper encroachment into sagebrush ecosystems impacts distribution and survival of greater sage-grouse: Rangeland Ecology and Management, v. 70, no. 1, p. 25–38. [Also available at https://doi.org/10.1016/j.rama.2016.09.001.]
Coe, P.K., Clark, D.A., Nielson, R.M., Gregory, S.C., Cupples, J.B., Hedrick, M.J., Johnson, B.K., and Jackson, D.H., 2018, Multiscale models of habitat use by mule deer in winter: The Journal of Wildlife Management, v. 82, no. 6, p. 1285–1299. [Also available at https://doi.org/10.1002/jwmg.21484.]
Condon, L.A., and Pyke, D.A., 2018, Fire and grazing influence site resistance to Bromus tectorum through their effects on shrub, bunchgrass and biocrust communities in the Great Basin (USA): New York, New York, Ecosystems, v. 21, no. 7, p. 1416–1431. [Also available at https://doi.org/10.1007/s10021-018-0230-8.]
Creutzburg, M.K., Halofsky, J.E., Halofsky, J.S., and Christopher, T.A., 2014, Climate change and land management in the rangelands of central Oregon: Environmental Management, v. 55, no. 1, p. 43–55. [Also available at https://doi.org/10.1007/s00267-014-0362-3.]
Data Basin, 2014, Current and historic ranges of sage-grouse in North America: Data Basin database, accessed April, 3, 2023, at https://databasin.org/maps/e114216b7abb43d2bc9972e16b1c2b30/.
Davies, K.W., and Bates, J.D., 2019, Longer-term evaluation of sagebrush restoration after juniper control and herbaceous vegetation trade-offs: Rangeland Ecology and Management, v. 72, no. 2, p. 260–265. [Also available at https://doi.org/10.1016/j.rama.2018.10.006.]
Davies, K.W., Bates, J.D., and Boyd, C.S., 2019, Post wildfire seeding to restore native vegetation and limit exotic annuals: an evaluation in juniper-dominated sagebrush steppe: Restoration Ecology: The Journal of the Society for Ecological Restoration, v. 27, no. 1, p. 120–127. [Also available at https://doi.org/10.1111/rec.12848.]
Department of the Interior [DOI], 2017, Secretarial Order 3356 Hunting, Fishing, Recreational Shooting, and Wildlife Conservation Opportunities and Coordination with States, Tribes and Territories. [Available at https://www.doi.gov/sites/doi.gov/files/uploads/signed_so_3356.pdf.]
Department of the Interior [DOI], 2020, Notice of the Federal Register, Federal Register, v. 85, no. 238, Thursday, December 10, 2020. [Also available at https://eplanning.blm.gov/public_projects/1504279/200362544/20030986/250037185/Pinion%20Juniper%20CX%20FRN.pdf.]
Doherty, T.S., and Driscoll, D.A., 2018, Coupling movement and landscape ecology for animal conservation in production landscapes: Proceedings of the Royal Society B—Biological Sciences, v. 285, no. 20172272, 10 p. [Also available at http://dx.doi.org/10.1098/rspb.2017.2272.]
Doherty, K.E., Naugle, D.E., and Walker, B.L., 2010, Greater sage-grouse nesting habitat—The importance of managing at multiple scales: The Journal of Wildlife Management, v. 74, no. 7, p. 1544–1553. [Also available at https://doi.org/10.1111/j.1937-2817.2010.tb01282.x.]
Doherty, K.E., Naugle, D.E., Walker, B.L., and Graham, J.M., 2008, Greater sage-grouse winter habitat selection and energy development: The Journal of Wildlife Management, v. 72, no. 1, p. 187–195. [Also available at https://doi.org/10.2193/2006-454.]
Eckrich, C.A., Coe, P.K., Clark, D.A., Nielson, R.M., Lombardi, J., Gregory, S.C., Hedrick, M.J., Johnson, B.K., and Jackson, D.H., 2020, Habitat use of female mule deer in Oregon: The Journal of Wildlife Management, v. 84, no. 3, p. 576–587. [Also available at https://doi.org/10.1002/jwmg.21806.]
Ellenwood,J.R., Krist, F.J., and Romero, S.A., 2015, National Individual Tree Species Atlas. FHTET-15–01, Fort Collins, Colorado: USDA Forest Service, Forest Health Technology Enterprise Team. [Also available at https://www.fs.usda.gov/foresthealth/technology/pdfs/FHTET_15_01_National_Individual_Tree_Species_Atlas.pdf.]
Falkowski, M.J., Evans, J.S., Naugle, D.E., Hagen, C.A., Carleton, S.A., Maestas, J.D., Khalyani, A.H., Poznanovic, A.J., and Lawrence, A.J., 2017, Mapping tree canopy cover in support of proactive prairie grouse conservation in western North America: Rangeland Ecology and Management, v. 70, no. 1, p. 15–24. [Also available at https://doi.org/10.1016/j.rama.2016.08.002.]
Farzan, S., Young, D.J.N., Dedrick, A.G., Hamilton, M., Porse, E.C., Coates, P.S., and Sampson, G., 2015, Western juniper management—Assessing strategies for improving greater sage-grouse habitat and rangeland productivity: Environmental Management, v. 56, no. 3, p. 675–683. [Also available at https://doi.org/10.1007/s00267-015-0521-1.]
Filippelli, S.K., Falkowski, M.J., Hudak, A.T., Fekety, P.A., Vogeler, J.C., Khalyani, A.H., Rau, B.M., and Strand, E.K., 2020, Monitoring pinyon-juniper cover and aboveground biomass across the Great Basin: Environmental Research Letters, v. 15, no. 2, article 025004, 11 p. [Also available at https://doi.org/10.1088/1748-9326/ab6785.]
Fornwalt, P.J., Rocca, M.E., Battaglia, M.A., Rhoades, C.C., and Ryan, M.G., 2017, Mulching fuels treatments promote understory plant communities in three Colorado, USA, coniferous forest types: Forest Ecology and Management, v. 385, p. 214–224. [Also available at https://doi.org/10.1016/j.foreco.2016.11.047.] [V-E; UNK]
Freund, S.M., Newingham, B.A., Chambers, J.C., Urza, A.K., Roundy, B.A., and Cushman, J.H., 2021, Plant functional groups and species contribute to ecological resilience a decade after woodland expansion treatments: Ecosphere, v. 12, no. 1, article e03325, 24 p. [Also available at https://doi.org/10.1002/ecs2.3325.] [V-E; SS1–3, SS5, SS8–13]
Gibson, D., Blomberg, E.J., Atamian, M.T., and Sedinger, J.S., 2016, Nesting habitat selection influences nest and early offspring survival in greater sage-grouse: The Condor, v. 118, no. 4, p. 689–702. [Also available at https://doi.org/10.1650/CONDOR-16-62.1.]
Hartsell, J.A., Copeland, S.M., Munson, S.M., Butterfield, B.J., and Bradford, J., 2020, Gaps and hotspots in the state of knowledge of pinyon-juniper communities: Forest Ecology and Management, v. 455, article 117628, 23 p. [Also available at https://doi.org/10.1016/j.foreco.2019.117628.]
Johnson, K., Petersen, N., Smith, J., and Sadoti, G., 2018, Piñon-juniper fuels reduction treatment impacts pinyon jay nesting habitat: Global Ecology and Conservation, v. 16, article e00487, 7 p. [Also available at https://doi.org/10.1016/j.gecco.2018.e00487.] [V-E, W; 22]
Johnston, D.B., 2019, Rough soil surface lessens annual grass invasion in disturbed rangeland: Rangeland Ecology and Management, v. 72, no. 2, p. 292–300. [Also available at https://doi.org/10.1016/j.rama.2018.10.010.]
Jones, A.J., 2019, Do mechanical vegetation treatments of pinyon-juniper and sagebrush communities work? A review of the literature: Wild Utah Project technical report, 73 p., accessed January 13, 2021, at https://doi.org/10.13140/RG.2.2.12538.13760.
Kachergis, E., Miller, S.W., McCord, S.E., Dickard, M., Savage, S., Reynolds, L.V., Lepak, N., Dietrich, C., Green, A., Nafus, A., Prentice, K., and Davidson, Z., 2022, Adaptive monitoring for multiscale land management—Lessons learned from the Assessment, Inventory, and Monitoring (AIM) principles: Rangelands, v. 44, no. 1, p. 50–63. [Also available at https://doi.org/10.1016/j.rala.2021.08.006.]
Kerns, B.K., Day, M.A., and Ikeda, D., 2020, Long-term seeding outcomes in slash piles and skid trails after conifer removal: Forests, v. 11, no. 8, article, 839, 14 p. [Also available at https://doi.org/10.3390/F11080839.] [V-E; 24]
Knick, S.T., Hanser, S.E., and Preston, K.L., 2013, Modeling ecological minimum requirements for distribution of greater sage‐grouse leks—Implications for population connectivity across their western range, U.S: Ecology and Evolution, v. 3, no. 6, p. 1539–1551. [Also available at https://doi.org/10.1002/ece3.557.]
Knick, S.T., Holmes, A.L., and Miller, A.F., 2005, The role of fire in structuring sagebrush habitats and bird communities, in Saab, V.A. and Powell, H.D.W., eds., Fire and avian ecology in North America, studies in avian biology: Camarillo, California, Cooper Ornithological Society, v. 30, p. 63–75.
Landis, A.G., and Bailey, J.D., 2005, Reconstruction of age structure and spatial arrangement of piñon–juniper woodlands and savannas of Anderson Mesa, northern Arizona: Forest Ecology and Management, v. 204, no. 2–3, p. 221–236. [Also available at https://doi.org/10.1016/j.foreco.2004.09.006.]
Likens, G.E., 1989, Long-term studies in ecology—Approaches and alternatives: Limnology and Oceanography, v. 34, no. 4, p. 791–792. [Also available at https://doi.org/10.4319/lo.1989.34.4.0791.]
Lindenmayer, D.B., Likens, G.E., Andersen, A., Bowman, D., Bull, M.C., Burns, E., Dickman, C.R., Hoffmann, A.A., Keith, D.A., Liddell, M.J., Lowe, A.J., Metcalfe, D.J., Phinn, S.R., Russell-Smith, J., Thurgate, N., and Wardle, G.M., 2012, Value of long-term ecological studies: Austral Ecology, v. 37, no. 7, p. 745–757. [Also available at http://dx.doi.org/10.1111/j.1442-9993.2011.02351.x.]
Maestas, J.D., Roundy, B.A., and Bates, J.D., 2015, Conifer removal in the sagebrush steppe—The why, when, where, and how: Great Basin Fact Sheet Series, no. 4, accessed on May 20, 2021, at http://www.sagegrouseinitiative.com/wp-content/uploads/2015/07/4_GBFactSheet_Conifer-Management.pdf.
Maestas, J.D., Naugle, D.E., Chambers, J.C., Tack, J.D., Boyd, C.S., Tague, J.M., 2021, Conifer expansion, Chapter M, in Remington, T.E., Deibert, P.A., Hanser, S.E., Davis, D.M., Robb, L.A., Welty, J.L., Sagebrush conservation strategy—Challenges to sagebrush conservation: U.S. Geological Survey Open-File Report 2020–1125, p. 139–152. [Also available at https://doi.org/10.3133/ofr20201125.]
Magee, P.A., Coop, J.D., and Ivan, J.S., 2019, Thinning alters avian occupancy in piñon-juniper woodlands: The Condor-Ornithological Applications, v. 121, no. 1, article duy008, 17 p. [Also available at https://doi.org/10.1093/condor/duy008.] [W; 26]
Manzer, D.L., and Hannon, S.J., 2005, Relating grouse nest success and corvid density to habitat—A multi-scale approach: The Journal of Wildlife Management, v. 69, no. 1, p. 110–123. [Also available at https://www.researchgate.net/publication/232679072_Relating_grouse_nest_success_and_corvid_density_to_habitat_A_multi-scale_approach.]
McIver, J., and Brunson, M., 2014, Multidisciplinary, multisite evaluation of alternative sagebrush steppe restoration treatments—The SageSTEP project: Rangeland Ecology and Management, v. 67, no. 5, p. 435–439. [Also available at https://doi.org/10.2111/REM-D-14-00085.1.]
Miller, R.F., Chambers, J.C., Evers, L., Williams, C.J., Snyder, K.A., Roundy, B.A., and Pierson, F.B., 2019, The ecology, history, ecohydrology, and management of pinyon and juniper woodlands in the Great Basin and Northern Colorado Plateau of the western United States: Fort Collins, Colorado, U.S. Forest Service, Rocky Mountain Research Station, U.S. Forest Service General Technical Report RMRS-GTR-403, 284 p. [Also available at https://doi.org/10.2737/RMRS-GTR-403.]
Miller, R.F., and Wigand, P.E., 1994, Holocene changes in semiarid pinyon-juniper woodlands: Bioscience, v. 44, no. 7, p. 465–474. [Also available at http://dx.doi.org/10.2307/1312298.]
Monaco, T.A., and Gunnell, K.L., 2020, Understory vegetation change following woodland reduction varies by plant community type and seeding status—A region-wide assessment of ecological benefits and risks: Plants, v. 9, no. 9, article 1113, 26 p. [Also available at https://doi.org/10.3390/plants9091113.] [V-E; UNK]
Morano, S., Stewart, K.M., Dilts, T., Ellsworth, A., and Bleich, V.C., 2019, Resource selection of mule deer in a shrub-steppe ecosystem—Influence of woodland distribution and animal behavior: Ecosphere, v. 10, no. 11, article e02811, 23 p. [Also available at http://dx.doi.org/10.1002/ecs2.2811.]
Natural Resources Conservation Service [NRCS], 2019, Conifer removal benefits sage-grouse, other sagebrush birds, and rangeland productivity—Conservation Effects Assessment Project (CEAP): CEAP-Wildlife Conservation Insight. [Also available at https://www.nrcs.usda.gov/publications/ceap-wildlife-2019-ConiferRemoval-SageGrouse-RangelandProductivity.pdf.]
Natural Resources Conservation Service [NRCS], 2021, A decade of science support in the sagebrush biome: Washington, D.C., United States Department of Agriculture, 32 p. [Also available at https://doi.org/10.32747/2021.7488985.]
Neff, J.C., Reynolds, R.L., Belnap, J., and Lamothe, P.J., 2005, Multi-decadal impacts of grazing on soil physical and biogeochemical properties in southeast Utah: Ecological Applications, v. 15, no. 1, p. 87–95. [Also available at https://doi.org/10.1890/04-0268.]
Nowak, C.L., Nowak, R.S., Tausch, R.J., and Wigand, P.E., 1994, Tree and shrub dynamics in northwestern Great Basin woodland and shrub steppe during the late-Pleistocene and Holocene: American Journal of Botany, v. 81, no. 3, p. 265–277. [Also available at http://dx.doi.org/10.2307/2445452.] https://doi.org/10.1002/j.1537-2197.1994.tb15443.x
Olsen, A.C., Severson, J.P., Allred, B.W., Jones, M.O., Maestas, J.D., Naugle, D.E., Yates, K.H., and Hagen, C.A., 2021a, Reversing tree encroachment increases usable space for sage‐grouse during the breeding season: Wildlife Society Bulletin, v. 45, no. 3, p. 488–497. [Also available at https://doi.org/10.1002/wsb.1214.]
Olsen, A.C., Severson, J.P., Allred, B.W., Jones, M.O., Maestas, J.D., Naugle, D.E., Yates, K.H., and Hagen, C.A., 2021b, Reversing tree expansion in sagebrush steppe yields population-level benefit for imperiled grouse: Ecosphere, v. 12, no. 6, article e03551, 10 p. [Also available at https://doi.org/10.1002/wsb.1214.]
Parker, K.L., Barboza, P.S., and Gillingham, M.P., 2009, Nutrition integrates environmental responses of ungulates: Functional Ecology, v. 23, no. 1, p. 57–69. [Also available at https://doi.org/10.1111/j.1365-2435.2009.01528.x.]
Pilliod, D.S., Welty, J.L., and Jeffries, M.I., 2019, USGS land treatment digital library data release—A centralized archive for land treatment tabular and spatial data, ver. 5.0, July 2022: U.S. Geological Survey data release, accessed on September 20, 2021, at https://doi.org/10.5066/P98OBOLS.
Poessel, S.A., Hagar, J.C., Haggerty, P.K., and Katzner, T.E., 2020, Removal of cattle grazing correlates with increases in vegetation productivity and in abundance of imperiled breeding birds: Biological Conservation, v. 241, article 108378, 9 p. [Also available at https://doi.org/10.1016/j.biocon.2019.108378.]
Prévey, J.S., Germino, M.J., Huntly, N.J., and Inouye, R.S., 2010, Exotic plants increase and native plants decrease with loss of foundation species in sagebrush steppe: Plant Ecology, v. 207, no. 1, p. 39–51. [Also available at https://doi.org/10.1007/s11258-009-9652-x.]
Prochazka, B.G., Coates, P.S., Ricca, M.A., Casazza, M.L., Gustafson, K.B., and Hull, J.M., 2017, Encounters with pinyon-juniper influence riskier movements in greater sage-grouse across the Great Basin: Rangeland Ecology and Management, v. 70, no. 1, p. 39–49. [Also available at http://dx.doi.org/10.1016/j.rama.2016.07.004.]
Rabon, J.C., Coates, P.S., Ricca, M.A., and Johnson, T.N., 2021a, Does reproductive status influence habitat selection by female greater sage-grouse in a sagebrush-juniper landscape?: Rangeland Ecology and Management, v. 79, no. 1, p. 150–163. [Also available at https://doi.org/10.1016/j.rama.2021.08.008.]
Rabon, J.C., Nunez, C.M.V., Coates, P.S., Ricca, M.A., and Johnson, T.N., 2021b, Ecological correlates of fecal corticosterone metabolites in female greater sage-grouse (Centrocercus urophasianus): Canadian Journal of Zoology, v. 99, no. 9, p. 812–822. [Also available at http://dx.doi.org/10.1139/cjz-2020-0258.]
Ray, G., Ochoa, C.G., Deboodt, T., and Mata-Gonzalez, R., 2019, Overstory-understory vegetation cover and soil water content observations in western juniper woodlands: A paired watershed study in central Oregon, USA: Forests, v. 10, no. 2, article 151, 16 p. [Also available at https://doi.org/10.3390/f10020151.] [V-E; 35]
Redmond, M.D., Forcella, F., and Barger, N.N., 2012, Declines in pinyon pine cone production associated with regional warming: Ecosphere, v. 3, no. 12, article 120, 14 p. [Also available at https://doi.org/10.1890/ES12-00306.1.]
Reinhardt, J.R., Filippelli, S., Falkowski, M., Allred, B., Maestas, J.D., Carlson, J.C., and Naugle, D.E., 2020, Quantifying pinyon-juniper reduction within North America’s sagebrush ecosystem: Rangeland Ecology and Management, v. 73, no. 3, p. 420–432. [Also available at https://doi.org/10.1016/j.rama.2020.01.002.]
Remington, T.E., Deibert, P.A., Hanser, S.E., Davis, D.M., Robb, L.A., and Welty, J.L., 2021, Sagebrush conservation strategy—Challenges to sagebrush conservation: U.S. Geological Survey Open-File Report 2020–1125, 327 p. [Also available at https://doi.org/10.3133/ofr20201125.]
Rhoades, C.C., Battaglia, M.A., Rocca, M.E., and Ryan, M.G., 2012, Short-and medium-term effects of fuel reduction mulch treatments on soil nitrogen availability in Colorado conifer forests: Forest Ecology and Management, v. 276, p. 231–238. [Also available at https://doi.org/10.1016/j.foreco.2012.03.028.]
Rickart, E.A., Robson, S.L., and Heaney, L.R., 2008, Mammals of Great Basin National Park, Nevada—Comparative field surveys and assessment of faunal change: Monographs of the Western North American Naturalist, v. 4, no. 1, p. 77–114. [Also available at https://doi.org/10.3398/1545-0228-4.1.77.]
Rodman, K.C., Crouse, J.E., Donager, J.J., Huffman, D.W., and Sánchez Meador, A.J., 2022, Patterns and drivers of recent land cover change on two trailing-edge forest landscapes: Forest Ecology and Management, v. 521, article 120449, 14 p. [Also available at https://doi.org/10.1016/j.foreco.2022.120449.]
Romme, W.H., Allen, C.D., Bailey, J.D., Baker, W.L., Bestelmeyer, B.T., Brown, P.M., Eisenhart, K.S., Floyd, L.M., Huffman, D.W., Jacobs, B.F., Miller, R.F., Muldavin, E.H., Swetnam, T.W., Tausch, R.J., and Weisberg, P.J., 2009, Historical and modern disturbance regimes, stand structures, and landscape dynamics in piñon–juniper vegetation of the western United States: Rangeland Ecology and Management, v. 62, no. 3, p. 203–222. [Also available at https://doi.org/10.2111/08-188R1.1.]
Roundy, B.A., Chambers, J.C., Pyke, D.A., Miller, R.F., Tausch, R.J., Schupp, E.W., Rau, B., and Gruell, T., 2018, Resilience and resistance in sagebrush ecosystems are associated with seasonal soil temperature and water availability: Ecosphere, v. 9, no. 9, article e02417, 27 p. [Also available at https://doi.org/10.1002/ecs2.2417.] [V-E; SS1–3, SS5–6, SS8–13]
Roundy, B.A., Miller, R.F., Tausch, R.J., Young, K., Hulet, A., Rau, B., Jessop, B., Chambers, J.C., and Eggett, D., 2014a, Understory cover responses to piñon–juniper treatments across tree dominance gradients in the Great Basin: Rangeland Ecology and Management, v. 67, no. 5, p. 482–494. [V-E; SS1–3, SS5–6, SS8–13]
Sauer, J.R., Niven, D.K., Hines, J.E., Ziolkowski, D.J., Jr., Pardieck, K.L., Fallon, J.E., and Link, W.A., 2017, The North American Breeding Bird Survey, results and analysis 1966–2015, Version 2.07.2017: Laurel, Md., U.S. Geological Survey Patuxent Wildlife Research Center. [Also available at https://www.mbr-pwrc.usgs.gov/.]
Sawyer, H., Korfanta, N.M., Nielson, R.M., Monteith, K.L., and Strickland, D., 2017, Mule deer and energy development–Long-term trends of habituation and abundance: Global Change Biology, v. 23, no. 11, p. 4521–4529. [Also available at https://doi.org/10.1111/gcb.13711.]
Schlaepfer, M.A., Runge, M.C., and Sherman, P.W., 2002, Ecological and evolutionary traps: Trends in Ecology & Evolution, v. 17, no. 10, p. 474–480. [Also available at https://doi.org/10.1016/S0169-5347(02)02580-6.]
Severson, J.P., Hagen, C.A., Maestas, J.D., Naugle, D.E., Forbes, J.T., and Reese, K.P., 2017a, Effects of conifer expansion on greater sage-grouse nesting habitat selection: The Journal of Wildlife Management, v. 81, no. 1, p. 86–95. [Also available at https://doi.org/10.1002/jwmg.21183.]
Severson, J.P., Hagen, C.A., Maestas, J.D., Naugle, D.E., Forbes, J.T., and Reese, K.P., 2017b, Restoring sage‐grouse nesting habitat through removal of early successional conifer: Restoration Ecology, v. 25, no. 6, p. 1026–1034. [Also available at https://doi.org/10.1111/rec.12524.]
Severson, J.P., Hagen, C.A., Tack, J.D., Maestas, J.D., Naugle, D.E., Forbes, J.T., and Reese, K.P., 2017d, Better living through conifer removal—A demographic analysis of sage-grouse vital rates: PLoS ONE, v. 12, no. 3, article e0174347, 17 p. [Also available at https://doi.org/10.1371/journal.pone.0174347.] [W; 42–43]
Shaw, J.D., Steed, B.E., and DeBlander, L.T., 2005, Forest Inventory and Analysis (FIA) annual inventory answers the question—What is happening to pinyon-juniper woodlands?: Journal of Forestry, v. 103, no. 6, p. 280–85. [Also available at http://www7.nau.edu/mpcer/direnet/publications/publications_s/files/Shaw_et_al_2005.pdf.]
Shinneman, D.J., and Baker, W.L., 2009, Historical fire and multidecadal drought as context for piñon–juniper woodland restoration in western Colorado: Ecological Applications, v. 19, no. 5, p. 1231–1245. [Also available at https://doi.org/10.1890/08-0846.1.]
Shinneman, D.J., Baker, W.L., and Lyon, P., 2008, Ecological restoration needs derived from reference conditions for a semi-arid landscape in western Colorado, USA: Journal of Arid Environments, v. 72, no. 3, p. 207–227. [Also available at https://doi.org/10.1016/j.jaridenv.2007.06.002.]
Shriver, R.K., Yackulic, C.B., Bell, D., Bradford, J., and Hampe, A., 2022, Dry forest decline is driven by both declining recruitment and increasing mortality in response to warm, dry conditions: Global Ecology and Biogeography, v. 31, no. 11, p. 2259–2269. [Also available at https://doi.org/10.1111/geb.13582.]
Stanke, H., Finley, A.O., Domke, G.M., Weed, A.S., and MacFarlane, D.W., 2021, Over half of western United States’ most abundant tree species in decline: Nature Communications, v. 12, no. 1, article 451, 11 p. [Also available at https://doi.org/10.1038/s41467-020-20678-z.]
Stevens, M., 2002, NRCS plant guide—Rocky mountain juniper: Natural Resources Conservation Service, National Plant Data Center, 5 p. [Also available at https://plants.usda.gov/DocumentLibrary/plantguide/pdf/pg_jusc2.pdf.]
Stevens-Rumann, C.S., Kemp, K.B., Higuera, P.E., Harvey, B.J., Rother, M.T., Donato, D.C., Morgan, P., and Veblen, T.T., 2018, Evidence for declining forest resilience to wildfires under climate change: Ecology Letters, v. 21, no. 2, p. 243–252. [Also available at https://doi.org/10.1111/ele.12889.]
Tausch, R.J., 1999, Transitions and threshold: Influences and implications for management in pinyon and Utah juniper woodlands, in Monsen, S.B., Stevens, R., comps., 1999, Proceedings—Ecology and management of pinyon-juniper communities within the Interior West: Provo, Utah, U.S. Forest Service, Rocky Mountain Research Station, Proc. RMRS-P-9, p. 361-365, September 15–18, 1997.
Throop, H.L., and Lajtha, K., 2018, Spatial and temporal changes in ecosystem carbon pools following juniper encroachment and removal: Biogeochemistry, v. 140, no. 3, p. 373–388. [Also available at https://doi.org/10.1007/s10533-018-0498-y.] [V-E; SS3]
Tollefson, J., 2011, How green is my future? UN panel foresees big growth in renewable energy, but policies will dictate just how big: Nature, v. 473, no. 7346, p. 134–135. [Also available at https://doi.org/10.1038/473134a.]
Urza, A.K., Weisberg, P.J., Chambers, J.C., Board, D., and Flake, S.W., 2019, Seeding native species increases resistance to annual grass invasion following prescribed burning of semiarid woodlands: Biological Invasions, v. 21, no. 6, p. 1993–2007. [Also available at https://doi.org/10.1007/s10530-019-01951-9.]
Urza, A.K., Weisberg, P.J., and Dilts, T., 2020, Evidence of widespread topoclimatic limitation for lower treelines of the Intermountain West, United States: Ecological Applications, v. 30, no. 7, article e02158, 12 p. [Also available at https://doi.org/10.1002/eap.2158.]
U.S. Environmental Protection Agency [EPA], 2013, Level III ecoregions of the continental United States: Corvallis, Oregon, U.S. Environmental Protection Agency, National Health and Environmental Effects Research Laboratory, map scale 1:7,500,000. [Also available at https://www.epa.gov/eco-research/level-iii-and-iv-ecoregions-continental-united-states.]
Utah State University, 2005, Mule deer mapping project: Utah State University Remote Sensing/GIS Laboratory database, accessed April, 3, 2023, at https://www.gis.usu.edu/projects/mule-deer-mapping-project/.
Waichler, W.S., Miller, R.F., and Doescher, P.S., 2001, Community characteristics of old-growth western juniper woodlands: Journal of Range Management, v. 54, no. 5, p. 518–527. [Also available at http://dx.doi.org/10.2307/4003580.]
Weisberg, P.J., Ko, D., Py, C., and Bauer, J.M., 2008, Modeling fire and landform influences on the distribution of old-growth pinyon-juniper woodland: Landscape Ecology, v. 23, no. 8, p. 931–943. [Also available at http://dx.doi.org/10.1007/s10980-008-9249-0.]
Welty, J.L., and Jeffries, M.I., 2021, Combined wildland fire datasets for the United States and certain territories, 1800s–present: U.S. Geological Survey data release. [Also available at https://www.usgs.gov/data/combined-wildland-fire-datasets-united-states-and-certain-territories-1800s-present.]
Wilcox, B.P., 1994, Runoff and erosion in intercanopy zones of pinyon-juniper woodlands: Journal of Range Management, v. 47, no. 4, p. 285–295. [Also available at http://dx.doi.org/10.2307/4002549.]
Wilder, L.E., Veblen, K.E., Gunnell, K.L., and Monaco, T.A., 2019, Influence of fire and mechanical sagebrush reduction treatments on restoration seedings in Utah, United States: Restoration Ecology, v. 27, no. 2, p. 308–319. [Also available at https://doi.org/10.1111/rec.12860.]
Williams, C.J., Johnson, J.C., Pierson, F.B., Burleson, C.S., Polyakov, V.O., Kormos, P.R., and Nouwakpo, S.K., 2020, Long-term effectiveness of tree removal to re-establish sagebrush steppe vegetation and associated spatial patterns in surface conditions and soil hydrologic properties: Water, v. 12, no. 8, article 2213, 35 p. [Also available at http://dx.doi.org/10.3390/w12082213.] [V-E; SS8, SS10]
Williams, R.E., Roundy, B.A., Hulet, A., Miller, R.F., Tausch, R.J., Chambers, J.C., Matthews, J., Schooley, R., and Eggett, D., 2017, Pretreatment tree dominance and conifer removal treatments affect plant succession in sagebrush communities: Rangeland Ecology and Management, v. 70, no. 6, p. 759–773. [V-E; SS1–3, SS5, SS8–13]
Wolff, J.O., Fox, T., Skillen, R.R., and Wang, G., 1999, The effects of supplemental perch sites on avian predation and demography of vole populations: Canadian Journal of Zoology, v. 77, no. 4, p. 535–541. [Also available at https://doi.org/10.1139/z99-002.]
Wozniak, S.S., Strand, E.K., Johnson, T.R., Hulet, A., Roundy, B.A., and Young, K., 2020, Treatment longevity and changes in surface fuel loads after pinyon–juniper mastication: Ecosphere, v. 11, no. 8, article e03226, 18 p. [Also available at https://doi.org/10.1002/ecs2.3226.] [V-E; SS8, SS11, S13]
Young, J.A., and Evans, R.A., 1989, Dispersal and germination of big sagebrush (Artemisia tridentata) seed: Weed Science, v. 37, no. 2, p. 201–206. [Also available at https://doi.org/10.1017/S0043174500071782.]
Young, K.R., Roundy, B.A., and Eggett, D.L., 2013a, Tree reduction and debris from mastication of Utah juniper alter the soil climate in sagebrush steppe: Forest Ecology and Management, v. 310, p. 777–785. [Also available at https://doi.org/10.1016/j.foreco.2013.09.024.]
Young, K.R., Roundy, B.A., and Eggett, D.L., 2013b, Plant establishment in masticated Utah juniper woodlands: Rangeland Ecology and Management, v. 66, no. 5, p. 597–607. [Also available at https://doi.org/10.2111/REM-D-12-00094.1.]
Appendix 1. Summary of All Vegetation-Environmental Responses
Table 1.1.
Proportion of positive, negative, and non-significant responses by Pinyon-Juniper Management Categorical Exclusion treatment for each vegetation-environmental category. Table also shows total number of responses and papers by category and treatment.[--, no data]
Appendix 2. Summary of All Wildlife Responses by Taxonomic Group
Table 2.1.
Proportion of positive, negative, and non-significant responses by Pinyon-Juniper Management Categorical Exclusion treatment for each wildlife taxonomic group. Table also shows total number of responses and papers by category and treatment.[--, no data]
Appendix 3. Summary of All Wildlife Responses by Response Type
Table 3.1.
Proportion of positive, negative, and non-significant responses by Pinyon-Juniper Management Categorical Exclusion treatment for each wildlife response type. Table also shows total number of responses and papers by category and treatment.[--, no data]
Datum
Horizontal coordinate information is referenced to the North American Datum of 1983 (NAD 83).
Elevation, as used in this report, refers to distance above the vertical datum.
For information about the research in this report, contact
Director, Forest and Rangeland Ecosystem Science Center
777 NW 9th Street
Suite 400
Corvallis, OR 97330
https://www.usgs.gov/centers/forest-and-rangeland-ecosystem-science-center
Manuscript approved on May 8, 2023.
Publishing support provided by the U.S. Geological Survey
Science Publishing Network, Tacoma Publishing Service Center
Disclaimers
Any use of trade, firm, or product names is for descriptive purposes only and does not imply endorsement by the U.S. Government.
Although this information product, for the most part, is in the public domain, it also may contain copyrighted materials as noted in the text. Permission to reproduce copyrighted items must be secured from the copyright owner.
Suggested Citation
Shinneman, D.J., McIlroy, S.K., Poessel, S.A., Downing, R.L., Johnson, T.N., Young, A.C., and Katzner, T.E., 2023, Ecological effects of pinyon-juniper removal in the Western United States—A synthesis of scientific research, January 2014–March 2021: U.S. Geological Survey Open-File Report 2023–1041, 56 p., https://doi.org/10.3133/ofr20231041.
ISSN: 2331-1258 (online)
Study Area
| Publication type | Report |
|---|---|
| Publication Subtype | USGS Numbered Series |
| Title | Ecological effects of pinyon-juniper removal in the Western United States—A synthesis of scientific research, January 2014–March 2021 |
| Series title | Open-File Report |
| Series number | 2023-1041 |
| DOI | 10.3133/ofr20231041 |
| Publication Date | June 21, 2023 |
| Year Published | 2023 |
| Language | English |
| Publisher | U.S. Geological Survey |
| Publisher location | Reston, VA |
| Contributing office(s) | Forest and Rangeland Ecosystem Science Center |
| Description | viii, 56 p. |
| Country | United States |
| Online Only (Y/N) | Y |