

Behavior and Movement of Smallmouth Bass (Micropterus dolomieu) near Bonneville Dam, Columbia River, Washington and Oregon, March–October 2022
Links
- Document: Report (16.5 MB pdf) , HTML , XML
- Download citation as: RIS | Dublin Core
Acknowledgments
We thank the U.S. Army Corps of Engineers employees (including Kristen Kerns, Dan Carlson, Katie Richwine, Bill Gardiner, Christine Budai, Brad Eppard, Rebecca Cates, and Andrew Derugin) for assistance with study planning, coordination, and implementation. We also thank Edward Chin, a professional fishing guide, for assistance with fish collection efforts during the study. Additionally, we thank our colleagues with the U.S. Geological Survey (including Philip Haner, Joe Warren, Lance Downing, Jamie Sprando, Jake Kelly, and Brian Ekstrom) for their efforts with fieldwork activities.
Abstract
A telemetry study was conducted during March–October 2022 to evaluate behavior and movement patterns of adult smallmouth bass (Micropterus dolomieu) in the forebay of Bonneville Dam, on the Columbia River in Washington and Oregon. This study was a follow-up to a previous study conducted at the site during August–December 2020. In 2022, a total of 41 smallmouth bass were collected, tagged, and released during March–May in three distinct areas of the dam forebay and monitored until late-October. Movement data from 39 tagged smallmouth bass were used in behavior analyses with an average detection duration (elapsed time from release to last detection) of 121.5 days. Most tagged smallmouth bass had site fidelity while present in the forebay of Bonneville Dam, primarily remaining within their zone of release, or moving into nearby adjacent zones. Although site fidelity was common during the study, we found that some tagged smallmouth bass left the forebay of Bonneville Dam and moved substantial distances upstream or downstream. Thirty-six percent of the tagged smallmouth bass were detected at least 8 kilometers upstream or downstream from the Bonneville Dam at some point during the study period (several of these fish eventually returned to the forebay), and 10 percent of the tagged fish were detected at sites located 24 river kilometers upstream or downstream from the dam. Results from this study build upon previous data collected during 2020 and provide new insights into behavior patterns of smallmouth bass collected and tagged in the Bonneville Dam forebay.
Introduction
Bonneville Dam, which was authorized by the Flood Control Act in 1938 (Public Law No. 761, House Resolution No. 10618), was the first dam constructed on the Columbia River along the Washington and Oregon border. The dam is a multipurpose facility that consists of the first and second powerhouses, old and new navigation locks, and spillway (fig. 1). Historical practices at the dam included disposal of old electrical equipment directly into the river on the north side of Bradford Island, upstream from the spillway (fig. 1), which resulted in substantial contamination at the site (URS Corporation, 2016; U.S. Army Corps of Engineers, 2017).
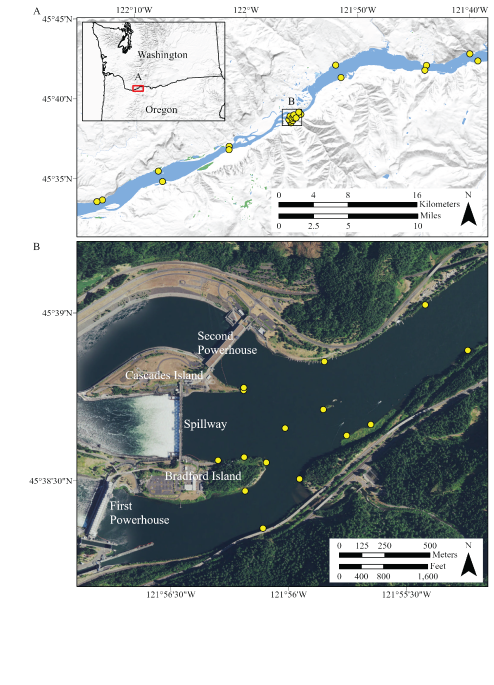
Study area and locations of acoustic telemetry receivers (yellow dots) deployed in the Columbia River, Washington and Oregon, March–October 2022. Top image (A) includes sites located upstream and downstream from the Bonneville Dam forebay. Rectangular red box indicates extent of location shown in image A. Source: ArcGIS Pro, U.S. Geological Survey (USGS) The National Map—3D Elevation Program, USGS Earth Resources Observation & Science (EROS) Center: GMTED2010. Data refreshed March, 2021. Bottom image (B) shows locations of acoustic telemetry receivers in the forebay of Bonneville Dam. Source: ArcGIS Pro, USGS The National Map—Orthoimagery. Data refreshed December, 2021.
Numerous investigations have been completed since 1997, and in 2012 a remedial investigation report (URS Corporation, 2012) summarized investigation activities over the previous 10 years and used the data to identify contamination source areas at Bradford Island. The report defined the nature and extent of environmental contamination and identified contaminants of potential concern for human health and contaminants of potential ecological concern. The remedial investigation report indicated that 38 smallmouth bass (Micropterus dolomieu), which were sampled in the Bonneville Dam forebay, had elevated levels of polychlorinated biphenyls. To better understand the potential exposure of smallmouth bass to areas of contaminated sediments and to inform conceptual modeling of the cleanup of the site, the U.S. Army Corps of Engineers contracted with the U.S. Geological Survey in 2020 to collect smallmouth bass for contaminant analysis and to evaluate smallmouth bass movement patterns in the forebay of Bonneville Dam (Kock and others, 2021). For the study, 36 smallmouth bass were tagged and monitored using acoustic telemetry during August–December 2020. Most of the tagged smallmouth bass had strong site fidelity, remaining within their zone of release or moving into nearby adjacent zones. However, by the end of the study, 69.4 percent of the tagged smallmouth bass eventually moved upstream or downstream, out of the area monitored by acoustic telemetry receivers. Researchers noted that the spillway did not operate during the study and observed that smallmouth bass behavior data were collected only during fall and early winter (Kock and others, 2021). Thus, the 2020 study provided new insights into smallmouth bass behavior in the forebay of Bonneville Dam, but considerable uncertainties related to the influence of seasonality and variable dam operations remained. To address these uncertainties, the U.S. Army Corps of Engineers provided funding for a follow-on study in 2022. This study was conducted during March–October 2022 and included the original monitoring sites deployed during 2020, along with additional sites located upstream and downstream from the dam to provide information on the spatial extent of smallmouth bass movements. This report describes that study. Portions of the abstract, introduction, methods, and discussion were originally presented in Kock and others. (2021) and are restated or summarized herein.
Methods
Smallmouth Bass Collection and Tagging
Adult smallmouth bass were collected for tagging in the forebay of Bonneville Dam (fig. 2) during March–May 2022 by angling crews using artificial lures. Once a smallmouth bass was captured, the location was recorded on a Global Positioning System and the fish was placed into an insulated cooler (hereinafter “holding container”) filled with fresh river water that received a continuous flow of oxygen from an external source. The fish was held in the cooler for a short time period (less than 5 minutes) while the tagger prepared supplies for surgical transmitter implantation. When the tagger was ready, the fish was hand-netted and transferred to an approximately 20-liter (L) anesthetic bath (3 milliliters AQUI-S 20E per 10 L river water, AquaTactics Fish Health, Kirkland, Washington) where it remained until sufficiently sedated. The fish was then removed from the bath, measured for total length (in millimeters), visually evaluated for external injuries, and transferred to a lower-dose anesthetic bath (2 milliliters AQUI-S 20E per 10 L river water) where surgical transmitter implantation occurred. Fish were positioned in the bath head down and oriented at an angle with the ventral side facing up so the incision site was exposed to air. After making a longitudinal incision, which penetrated the peritoneum, the transmitter (Model SS400 Advanced Telemetry Systems, Inc., Asanti, Minnesota; 0.740 grams weight in air, 14.7 × 5.7 millimeters) was gently inserted into the abdominal cavity. Two sutures closed the incision and fish were returned to the holding container until they regained equilibrium and recovered. After recovery, tagged fish were released at the original collection site.
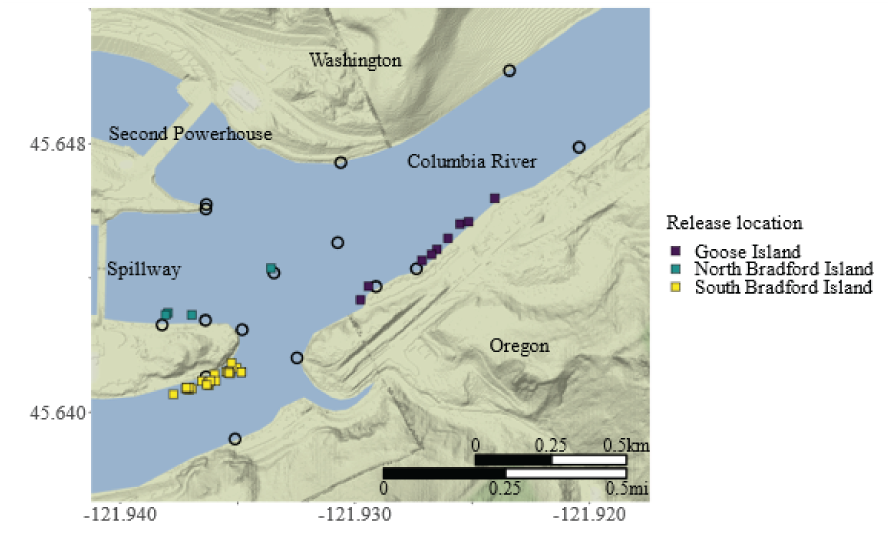
Locations where smallmouth bass (Micropterus dolomieu) were collected, tagged, and released, during an acoustic telemetry study, upstream from Bonneville Dam, Columbia River, Washington and Oregon, March–October 2022. Open circles represent acoustic telemetry receiver locations. Base-map tiles by Stamen Design, under CC BY 3.0; base map data by OpenStreetMap, under ODbL.
Acoustic Telemetry Monitoring Sites
A total of 27 monitoring sites were deployed to detect acoustic-tagged smallmouth bass. At each monitoring site an acoustic telemetry receiver (Models SR3017 or SR5000, Advanced Telemetry Systems, Inc., Asanti, Minnesota) was connected to a cabled underwater hydrophone and was operated continuously throughout the study period. Monitoring sites were checked bi-monthly to download data, conduct routine maintenance, and verify that receivers and hydrophones were functioning properly. Fifteen sites were deployed near the forebay of Bonneville Dam using locations originally established for the 2020 study (Kock and others, 2021; fig. 1). Receivers were grouped into seven zones: (1) North Shore, which included two receivers along the Washington shoreline; (2) Boat Rock, which was monitored by one receiver on the western end of the rock grouping; (3) Goose Island, which included four receivers along the Oregon shoreline and Goose Island; (4) East Bradford, which was monitored using two receivers—one on the eastern end of Bradford Island and one on the offshore rock east of the island; (5) Cascades Island, which included two receivers on the eastern end of the island; (6) North Bradford, which had two receivers along the north side of Bradford Island; and (7) South Bradford, consisting of two receivers—one on the south side of Bradford Island and one on the adjacent Oregon shoreline (fig. 3). We also deployed receivers upstream and downstream from the main monitoring array in the Bonneville Dam forebay to collect information about the spatial dispersal of tagged fish that left the forebay. These additional receivers were deployed to create a total of six detection gates, three downstream from the dam and three upstream from the dam. Upstream and downstream gates were established approximately 8 river kilometers (rkm), 16 rkm, and 24 rkm from the dam (fig. 1), and each of these gates included two receivers to increase detection coverage at the gate.
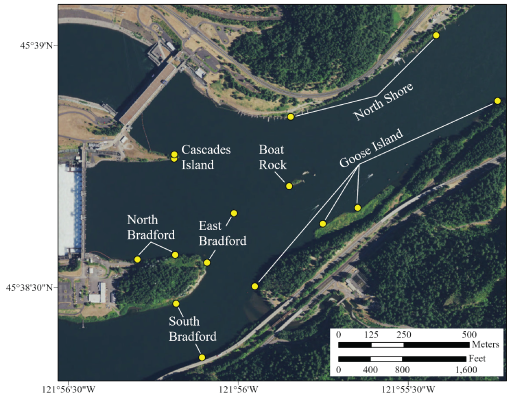
Locations of acoustic telemetry monitoring sites (receivers, shown as yellow dots) and groups used for zone characterization in the forebay of Bonneville Dam, Columbia River, Oregon, March–October 2022. Source: ArcGIS Pro, U.S. Geological Survey The National Map—Orthoimagery. Data refreshed December, 2021.
Data Processing and Analysis
Once the field study was completed, acoustic telemetry data records were compiled in a single dataset, merged with tagging and release data, and processed to create a final dataset for analysis. Data compilation and processing were completed using SAS (version 9.4, SAS Institute Inc., Cary, North Carolina), and additional data analyses, summaries, and visualizations were run using R statistical software (R Core Team, 2021) and supplemental packages (ggmap, ggplot) in RStudio (Kahle and Wickham, 2013; Wickham, 2016; RStudio Team, 2021). Processing involved (1) removal of false-positive detection events (defined as transmitter detections recorded on a telemetry receiver when the transmitter was not present at the site), which are common in active telemetry systems (Beeman and Perry, 2012); and (2) use of received signal strength to identify where smallmouth bass were located for instances in which simultaneous detections of a single tagged smallmouth bass occurred at multiple receiver sites. We used an automated proofing program to remove false-positive records if (1) the detection record was from a tag code that was not released during the study, (2) the record matched criteria that indicated the detection likely resulted from reflections of valid tag signals (multipath), (3) the detection record did not match a multiple of the tag pulse interval, or (4) the record was not followed by at least three valid detection events of that transmitter on each receiver (McMichael and others, 2010; Deng and others, 2017). Once false-positive detection records were removed, frequency of detection and highest mean signal strength was used to assign a location when simultaneous detection on multiple receivers occurred. Upon completion of processing, the dataset was analyzed to describe smallmouth bass behavior and movement patterns. For final analysis, receivers were grouped into the following zones to summarize smallmouth bass movements upstream from Bonneville Dam: North Shore, Boat Rock, Goose Island, East Bradford, Cascades Island, North Bradford, and South Bradford (fig. 3). Two tagged smallmouth bass had limited detections during the study and were omitted from behavior and movement analyses, resulting in analysis of detection records for a total of 39 tagged fish.
Behavior was assessed by describing the zones in which individual tagged smallmouth bass were detected and calculating elapsed time of detection in specific zones for each tagged fish. These data were combined for tagged smallmouth bass within each release zone to determine the percentage of fish from each group that were detected in each zone and to summarize the percentage of time spent in those zones. Movement of smallmouth bass to upstream and downstream sites was evaluated using detections of individual acoustic-tagged smallmouth bass at each site located upstream and downstream from Bonneville Dam.
Results
Smallmouth Bass Collection and Tagging
Forty-one smallmouth bass were collected, tagged with an acoustic transmitter, and released into the Bonneville Dam forebay during the study. Most smallmouth bass (28 fish) that were collected, tagged, and released were within the South Bradford zone (table 1). Additionally, nine smallmouth bass were tagged and released in the Goose Island zone (table 1). Access to the North Bradford zone for collection, tagging, and release was only possible from March 23, 2022, when collection efforts began, until April 30, 2022, when the spillway began operating. During this period, we collected, tagged, and released a total of four smallmouth bass in the North Bradford zone (table 1).
Table 1.
Summary of collection dates; number of smallmouth bass (Micropterus dolomieu) collected, tagged, and released; and range of total lengths for smallmouth bass collected during an acoustic telemetry study in the forebay of Bonneville Dam, Columbia River, Washington and Oregon, March–October 2022.[mm, millimeter]
Behavior and Movement of Acoustic-Tagged Smallmouth Bass
We monitored the behavior and movement of smallmouth bass from March 23 to October 26, 2022 (217 days overall). Detection histories (that is, elapsed time from release to last detection) ranged from 7.3 to 217.0 days (mean = 121.5 days) for individual tagged fish. All tagged fish were detected in their zone of release and were detected in greatest proportion in nearby adjacent zones (table 2), compared to zones located farther away. For example, of the 27 fish released in the South Bradford zone, 22 tagged smallmouth bass were detected in the East Bradford zone and 23 tagged fish were detected in the Goose Island zone (table 2). By comparison, only 10 tagged smallmouth bass were detected in the Cascades Island and North Shore zones, which were located farthest away from South Bradford. This relation was similar for fish released at Goose Island. Six of the 9 fish were detected in the Boat Rock zone, but none were detected in the Cascades Island zone (table 2). Interestingly, at least two of the three smallmouth bass released in the North Bradford zone were detected in every zone in the Bonneville Dam forebay (table 2). Tagged smallmouth bass spent most of the time in the zone of release and adjacent detection zones—69.8 percent of the time at North Bradford and East Bradford zones, 88.8 percent of the time at South Bradford and East Bradford zones, and 89.6 percent of the time at Goose Island and Boat Rock zones (table 3). The median duration of time from release to first detection at the North Bradford zone for all fish released during the study was 47.4 days and ranged from 0.0 to 152.0 days (fig. 4). All fish from the North Bradford release group were detected shortly after release on the North Bradford receivers. The duration of time from release at the South Bradford zone to first detection at the North Bradford receivers ranged from 2.2 to 143.2 days, median 49.5 days (fig. 4). The detection of the single Goose Island released fish on the North Bradford Island receivers occurred 152.0 days after release (fig. 4). Of the 39 tagged smallmouth bass released in the forebay of Bonneville Dam, 10 fish were eventually detected on upstream detection sites and 5 fish were detected on downstream detection sites (table 2).
Table 2.
Number of acoustic-tagged smallmouth bass (Micropterus dolomieu) detected in detection zones in the forebay of Bonneville Dam, upstream sites, and downstream sites on the Columbia River, Washington and Oregon, March–October 2022.[Detection zone: km, kilometer. Numbers in parentheses indicate total number of smallmouth bass detected in a given detection zone. Release zone: Numbers in parentheses indicate total number of smallmouth bass released in a given release zone.]
Table 3.
Percentage of time that acoustic-tagged smallmouth bass (Micropterus dolomieu) were detected near fixed telemetry sites in the forebay upstream from Bonneville Dam on the Columbia River, Washington and Oregon, March–October 2022.[Release zone: Numbers in parentheses indicate total number of smallmouth bass released in a given release zone. Detection zone: All numbers are percentages of time that smallmouth bass were detected in a given detection zone]
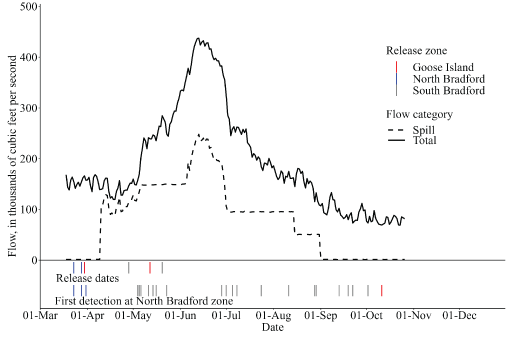
Release dates and dates of first detection at North Bradford zone for acoustic-tagged smallmouth bass (Micropterus dolomieu) relative to flow category during an acoustic telemetry study at Bonneville Dam on the Columbia River, Washington and Oregon, March–October 2022. Mar, March; Apr, April; Jun, June; Jul, July; Aug, August; Sep, September; Oct, October; Nov, November, Dec, December.
Behavior of Tagged Smallmouth Bass Released in the North Bradford Zone
Three smallmouth bass tagged and released in the North Bradford zone were detected throughout the forebay of Bonneville Dam. All three fish were detected in the area upstream from the spillway including the North Bradford, Cascades Island, East Bradford, and Boat Rock detection zones. The number of fish detected and mean residence time decreased with increasing distance from the release site (table 2; fig. 5). Mean residence times were longest in the North Bradford, East Bradford, and Boat Rock detection zones (fig. 5), and cumulative percentage of time detected was 88.1 percent in those three zones (table 3).
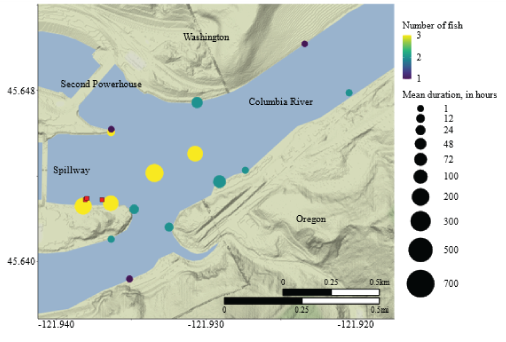
Mean residence time at telemetry monitoring sites for acoustic-tagged smallmouth bass (Micropterus dolomieu) collected, tagged, and released in the North Bradford zone, upstream from Bonneville Dam, Columbia River, Washington and Oregon, March–October 2022. Squares indicate the release locations of individual smallmouth bass. Base-map tiles by Stamen Design, under CC BY 3.0; base-map data by OpenStreetMap, under ODbL.
Behavior of Tagged Smallmouth Bass Released in the South Bradford Zone
Tagged smallmouth bass released in the South Bradford zone were detected on receivers throughout the forebay of Bonneville Dam. Many fish (16–23 fish) were also detected in the East Bradford, North Bradford, Boat Rock, and Goose Island zones (table 2). The longest residence times were observed in the South Bradford zone. Mean residence times were much shorter at receiver locations outside the South Bradford zone (fig. 6); 83 percent of the residence time for tagged fish released in the South Bradford zone was in the South Bradford zone (table 3).
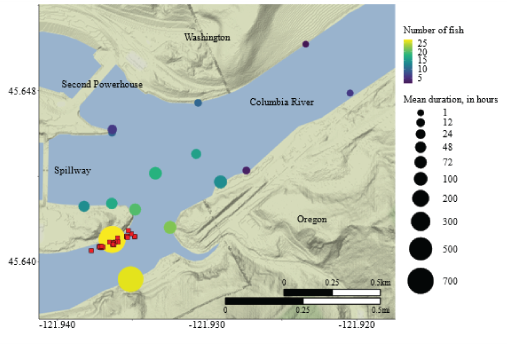
Mean residence time at telemetry monitoring sites for acoustic-tagged smallmouth bass (Micropterus dolomieu) collected, tagged, and released in the South Bradford zone, upstream from Bonneville Dam, Columbia River, Washington and Oregon, March–October 2022. Squares indicate the release locations of individual smallmouth bass. Base-map tiles by Stamen Design, under CC BY 3.0; base-map data by OpenStreetMap, under ODbL.
Behavior of Tagged Smallmouth Bass Released in the Goose Island Zone
Some tagged smallmouth bass released in the Goose Island zone were detected in all detection zones, except the Cascade Island zone. The largest number of tagged fish released at Goose Island were detected in the Goose Island (9 fish) and Boat Rock (6 fish) zones, with these zones also having the longest mean residence times (table 2; fig. 7). The cumulative percentage of time during which the tagged smallmouth bass were detected in the Goose Island and Boat Rock zones was 89.6 percent for fish released in the Goose Island zone (table 3).
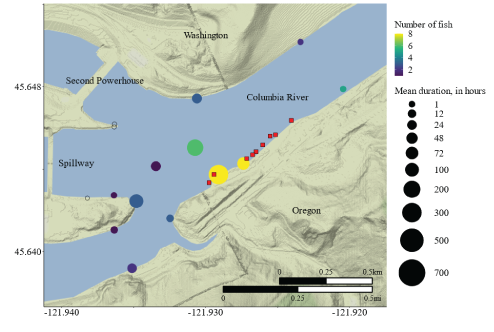
Mean residence time at telemetry monitoring sites for acoustic-tagged smallmouth bass (Micropterus dolomieu) collected, tagged, and released in the Goose Island zone, upstream from Bonneville Dam, Columbia River, Washington and Oregon, March–October 2022. Squares indicate the release locations of individual smallmouth bass. Base-map tiles by Stamen Design, under CC BY 3.0; base-map data by OpenStreetMap, under ODbL.
Behavior of Tagged Smallmouth Bass at Upstream and Downstream Sites
Several acoustic-tagged smallmouth bass were detected on sites deployed 8–24 kilometers (km) upstream and downstream from Bonneville Dam. Ten acoustic-tagged smallmouth bass were detected on the upstream sites and 5 fish were detected on downstream sites below Bonneville Dam. Two of the fish that were detected on upstream sites were detected on the 24-km gate (table 4). Five of the 10 fish that moved upstream from the Bonneville Dam forebay returned to the near-dam array and 3 tagged fish eventually moved back upstream and were detected on upstream gates (table 4; fig. 8). Two tagged fish that moved downstream from Bonneville Dam were detected on the 24-km gate. Two tagged fish detected on downstream gates eventually moved upstream, passed Bonneville Dam, and were detected on the near-dam array (table 4; fig. 8).
Table 4.
Number of acoustic-tagged smallmouth bass (Micropterus dolomieu) detected in detection zones upstream and downstream from Bonneville Dam on the Columbia River, Washington and Oregon, March–October 2022.[km, kilometer]
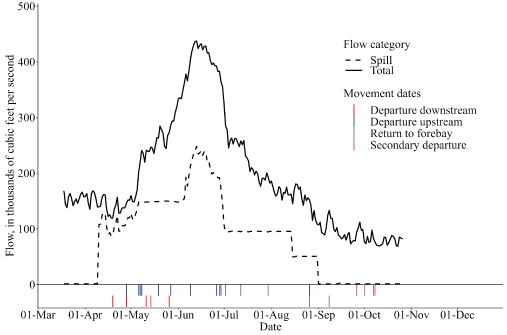
Dates of movements to upstream and downstream sites for acoustic-tagged smallmouth bass (Micropterus dolomieu) during an acoustic telemetry study in relation to Columbia River flow at Bonneville Dam, on the Columbia River, Washington and Oregon, March–October 2022. Mar, March; Apr, April; Jun, June; Jul, July; Aug, August; Sep, September; Oct, October; Nov, November, Dec, December.
Discussion
Results from this study build on information collected during 2020 and provide new insights into the behavior of smallmouth bass near Bonneville Dam. During the 2020 study, we found that tagged fish had high site fidelity, spending most of their time in the zone where they were originally released, or in nearby adjacent zones (Kock and others, 2021). Data collected during 2022 support these findings; we found that tagged smallmouth bass were most likely to be detected in their zone-of-release, or in nearby adjacent zones, and this pattern was also supported by residence times during both studies. However, we also found that some fish moved upstream or downstream from our monitoring array in the Bonneville Dam forebay. During 2020, 9 tagged smallmouth bass moved downstream from the array, and 16 tagged fish moved upstream and out of the array (Kock and others, 2021). During that study, we were unable to assess the spatial extent of these movements because we did not have monitoring arrays outside the Bonneville Dam forebay. As a result, we added several detection gates upstream and downstream from the Bonneville Dam forebay in our 2022 study, and this provided interesting insights into smallmouth bass behavior. We found that some of the tagged smallmouth bass moved extensively during the 2022 study. Five tagged smallmouth bass passed downstream from Bonneville Dam and two of these fish were detected on our downstream-most gate, 24 km below the dam. Eventually, two of the tagged fish that passed Bonneville Dam moved upstream, reascended the dam, and returned to our forebay monitoring array—one of which was subsequently detected on the upstream gates. Additionally, 10 tagged smallmouth bass moved upstream to the detection gates, including 2 fish that were detected 24 km upstream from the dam. Five of those fish eventually returned to the Bonneville Dam forebay—three of which made secondary movements to the upstream gates. These results demonstrate that smallmouth bass tend to have strong site fidelity in the Bonneville Dam forebay, but also show that some fish can move extensively and that upstream and downstream passage at Bonneville Dam occurs.
Observations from collection efforts are suggestive of a plentiful population of smallmouth bass in the forebay of Bonneville Dam with evidence for seasonal distribution patterns. During both studies, fish collection occurred for two separate purposes: (1) 40 smallmouth bass were collected, euthanized, and preserved each year for contaminants analysis (U.S. Army Corps of Engineers, 2021); and (2) approximately 40 smallmouth bass were collected, tagged, and released each year for the telemetry evaluation. During each year, we initially prioritized collection of smallmouth bass for contaminants analysis, yet we had no trouble subsequently collecting enough fish for acoustic tagging. Additionally, our recapture rate of previously tagged fish was very low. We did not recapture a single tagged fish during 2020 and we only recaptured one tagged fish during 2022. Although we met fish-collection targets during both years, we did observe apparent differences in fish distributions between years. During 2020, smallmouth bass seemed to be widely distributed throughout nearshore habitat in the Bonneville Dam forebay. We were able to collect smallmouth bass for contaminants analysis and acoustic tagging in all zones of our study area during that year (Kock and others, 2021). Because fish were readily accessible in all zones, we developed a prioritized collection, tagging, and release strategy that incorporated the allocation of tagged fish throughout the study area (five tagged fish in most zones) along with a comparatively large group of tagged fish (13 tagged fish) in the North Bradford zone (Kock and others, 2021). Conversely, during 2022, we were unable to collect smallmouth bass for tagging in the North Shore, Boat Rock, East Bradford, and Cascade Islands zones, and collection in the North Bradford zone was limited. We were able to routinely collect smallmouth bass in the Goose Island zone, and the South Bradford zone seemed to be a location where smallmouth bass were concentrated; it was not uncommon to collect several fish per hour in a small area of the South Bradford zone during spring 2022. Although these results are observational, they do suggest that habitat use by smallmouth bass in the Bonneville Dam forebay varies seasonally, which is supported by a strong body of literature (Munther, 1970; Langhurst and Schoenike, 1990; Gunderson VanArnum and others, 2004; McClure and others, 2019) from other locations throughout the United States.
In summary, results from the 2-year study at Bonneville Dam provided new insights into smallmouth bass behavior. This information should prove useful for resource managers who are working to better understand the ecological implications of contamination in the forebay of Bonneville Dam. Additionally, data on spatial movements of smallmouth bass away from the Bonneville Dam forebay, including upstream and downstream passage events, are likely to provide new insights into smallmouth bass behavior and dispersal in the Columbia River Basin.
References Cited
Deng, Z.D., Martinez, J.J., Li, H., Harnish, R.A., Woodley, C.M., Hughes, J.A., Li, X., Fu, T., Lu, J., McMichael, G.A., Weiland, M.A., Eppard, M.B., Skalski, J.R., and Townsend, R.L., 2017, Comparing the survival rate of juvenile Chinook salmon migrating through hydropower systems using injectable and surgical acoustic transmitters: Scientific Reports, v. 7, no. 1, 8 p., accessed December 4, 2020, at https://doi.org/10.1038/srep42999.
Gunderson VanArnum, C.J., Buynak, G.L., and Ross, J.R., 2004, Movement of smallmouth bass in Elkhorn Creek, Kentucky: North American Journal of Fisheries Management, v. 24, no. 1, p. 311–315, accessed February 9, 2023, at https://www.tandfonline.com/doi/abs/10.1577/M02-107.
Kahle, D., and Wickham, H., 2013, ggmap—Spatial visualization with ggplot2: The R Journal, v. 5, no. 1, p. 144–161, accessed January 23, 2022, at https://journal.r-project.org/archive/2013-1/kahle-wickham.pdf.
Kock, T.J., Hansen, G.S., and Evans, S.D., 2021, Behavior and movement of smallmouth bass (Micropterus dolomieu) in the forebay of Bonneville Dam, Columbia River, August–December 2020: U.S. Geological Survey Open-File Report 2021–1099, 13 p. [Also available at https://doi.org/10.3133/ofr20211099.]
Langhurst, R.W., and Schoenike, D.L., 1990, Seasonal migration of smallmouth bass in the Embarrass and Wolf Rivers, Wisconsin: North American Journal of Fisheries Management, v. 10, no. 2, p. 224–227, accessed February 9, 2023, at https://www.tandfonline.com/doi/abs/10.1577/1548-8675(1990)010%3C0224%3ASMOSBI%3E2.3.CO%3B2.
McClure, C., Quist, M.C., Kozfkay, J.R., Peterson, M.P., and Schill, D.J., 2019, Movement dynamics of smallmouth bass in a large western river system: North American Journal of Fisheries Management, v. 40, no. 1, p. 154–162, accessed February 9, 2023, at https://afspubs.onlinelibrary.wiley.com/doi/full/10.1002/nafm.10389.
McMichael, G.A., Eppard, M.B., Carlson, T.J., Carter, J.A., Ebberts, B.D., Brown, R.S., Weiland, M., Ploskey, G.R., Harnish, R.A., and Deng, Z.D., 2010, The juvenile salmon acoustic telemetry system—A new tool: Fisheries (Bethesda, Md.), v. 35, no. 1, p. 9–22, accessed January 20, 2021, at https://doi.org/10.1577/1548-8446-35.1.9.
Munther, G.L., 1970, Movement and distribution of smallmouth bass in the Middle Snake River: Transactions of the American Fisheries Society, v. 99, no. 1, p. 44–53, accessed February 9, 2023, at https://www.tandfonline.com/doi/abs/10.1577/1548-8659(1970)99%3C44%3AMADOSB%3E2.0.CO%3B2.
R Core Team, 2021, R version 3.6.1—A language and environment for statistical computing: Vienna, Austria, R Foundation for Statistical Computing software release, accessed February 16, 2022, at https://www.R-project.org/.
RStudio Team, 2021, RStudio—Integrated development environment for R: Boston, Massachusetts, RStudio, PBC, accessed February 16, 2022, at https://www.rstudio.com/.
URS Corporation, 2012, Upland and river operable units remedial investigation report: U.S. Army Corps of Engineers, prepared by URS Corporation, Bradford Island, Cascade Locks, Oregon, accessed November 20, 2000, at https://www.oregon.gov/deq/FilterDocs/BradfordRIfinal0612-1.pdf.
URS Corporation, 2016, Baseline human health and ecological risk assessment, river operable unit: U.S. Army Corps of Engineers, prepared by URS Corporation, Portland, Oregon, 88 p., accessed November 20, 2020, at https://usace.contentdm.oclc.org/digital/collection/p16021coll7/id/8609.
U.S. Army Corps of Engineers, 2017, Final feasibility study—Bradford Island upland operable unit, Cascade Locks, Oregon: U.S. Army Corps of Engineers, Portland, Oregon, 136 p., accessed November 20, 2020, at https://usace.contentdm.oclc.org/digital/collection/p16021coll7/id/4750.
U.S. Army Corps of Engineers, 2021, Smallmouth bass, crayfish, and clam data report: River Operable Unit, Bradford Island, Cascade Locks, Oregon: U.S. Army Corps of Engineers, Portland, Oregon, 162 p., accessed February 10, 2023, at https://usace.contentdm.oclc.org/digital/collection/p16021coll7/id/19394/rec/4.
Wickham, H., 2016, ggplot2—Elegant graphics for data analysis: New York, Springer-Verlag, accessed February 16, 2022, at https://ggplot2.tidyverse.org.
Conversion Factors
Supplemental Information
Data available upon request from funding organization, U.S. Army Corps of Engineers, Seattle District, at https://www.nws.usace.army.mil or 206-764-3750.
For information about the research in this report, contact
Director, Western Fisheries Research Center
U.S. Geological Survey
6505 NE 65th Street
Seattle, Washington 98115-5016
https://www.usgs.gov/centers/wfrc
Manuscript approved on June 5, 2023
Publishing support provided by the U.S. Geological Survey
Science Publishing Network, Tacoma Publishing Service Center
Disclaimers
Any use of trade, firm, or product names is for descriptive purposes only and does not imply endorsement by the U.S. Government.
Although this information product, for the most part, is in the public domain, it also may contain copyrighted materials as noted in the text. Permission to reproduce copyrighted items must be secured from the copyright owner.
Suggested Citation
Kock, T.J., and Hansen, G.S., 2023, Behavior and movement of smallmouth bass (Micropterus dolomieu) near Bonneville Dam, Columbia River, Washington and Oregon, March–October 2022: U.S. Geological Survey Open-File Report 2023–1046, 14 p., https://doi.org/10.3133/ofr20231046.
ISSN: 2331-1258 (online)
Study Area
| Publication type | Report |
|---|---|
| Publication Subtype | USGS Numbered Series |
| Title | Behavior and movement of smallmouth bass (Micropterus dolomieu) near Bonneville Dam, Columbia River, Washington and Oregon, March–October 2022 |
| Series title | Open-File Report |
| Series number | 2023-1046 |
| DOI | 10.3133/ofr20231046 |
| Publication Date | July 18, 2023 |
| Year Published | 2023 |
| Language | English |
| Publisher | U.S. Geological Survey |
| Publisher location | Reston, VA |
| Contributing office(s) | Western Fisheries Research Center |
| Description | vii, 14 p. |
| Country | United States |
| State | Oregon, Washington |
| Other Geospatial | Bonneville Dam |
| Online Only (Y/N) | Y |