

Summary of Data Collected During Field Efficacy Trials of Florfenicol and Oxytetracycline Dihydrate in Controlling Mortality in Walleye (Sander vitreus) Because of Motile Aeromonad Infections
Links
- Document: Report (1.7 MB pdf) , HTML , XML
- Appendix: Appendix 1 —Documentation and Data
- Data Release: USGS data release - Trial data for field effectiveness of florfenicol and oxytetracycline dihydrate in controlling mortality in walleye (Sander vitreus)
- Download citation as: RIS | Dublin Core
Acknowledgments
The authors would like to thank the entire staff of Spirit Lake Fish Hatchery for their untiring assistance and support during these field efficacy trials. The study would not have been possible without their support, especially that of Ms. Donna Muhm and Mr. Robert Benedict. Last, the authors thank the North Central Regional Aquaculture Center and the U.S. Food and Drug Administration for funding this study.
Abstract
Motile Aeromonad septicemia is a substantial concern during fish propagation and can be catastrophic for fish hatcheries. We tested the efficacy of two different drugs (florfenicol and oxytetracycline) offered with feed as possible treatment options to control mortality because of motile Aeromonad infection. We offered top-coated medicated feeds to hatchery-reared Sander vitreus (walleye) that were naturally infected with motile Aeromonad infection during two separate trials in 2011 and 2012. Substantial walleye mortality occurred before positive clinical outcomes from the medicated feed treatments were observed, and additional treatment measures were taken by hatchery staff to mitigate further mortality in their walleye production tanks. This report summarizes the data that were collected during medicated feed trials. Statistical inferences on treatment efficacy are not included because of the confounding treatments and possible secondary pathogens present throughout this study.
Introduction
Motile Aeromonad septicemia (MAS) is a bacterial disease of fish that causes substantial economic loss worldwide (Camus and others, 1998; Saharia and others, 2019; Mississippi State University Extension, 2022). Outbreaks can happen across a variety of fish species but are more common in warm-water and temperate species (Camus and others, 1998) and can result in complete fish loss. Environmental stressors such as accumulation of waste, high water temperature, handling, and low dissolved oxygen are often associated with MAS (Hanson and others, 2014). Early detection, diagnosis, and treatment of Aeromonad infections are critical to mitigate development of widespread MAS disease. Medicated feeds are one treatment option for MAS that has been demonstrated to reduce mortality associated with bacterial infections (U.S. Food and Drug Administration [FDA], 2022). Florfenicol (FFC) or oxytetracylcline (OTC) are two antibacterial drugs that are FDA-approved for the treatment of some bacterial infections in freshwater finfish and have demonstrated efficacy when medicated feeds are promptly offered.
The broad spectrum antibacterial agent FFC 2,2-dichloro-N-[(1R,2S)-3-fluoro-1-hydroxy-1-(4-methanesulfonylphenyl)propan-2-yl]acetamide as the active ingredient used for a feed topcoat premix, was approved in the United States for administration in feed at a dose rate of 10 milligrams per kilograms (mg/kg) bodyweight per day (BW/day) for 10 days to control enteric septicemia in catfish (2005), coldwater disease and furunculosis in trout (2007), and conditionally approved to control columnaris disease in catfish (2007; FDA, 2022). Globally, florfenicol is registered for use in Japan (1990), Norway (1993), Chile (1995), Canada (1997), the United Kingdom (1999), Ecuador, Venezuela (2005), Colombia, Honduras (2006), Brazil, China, Costa Rica, Philippines, and Vietnam (2007) to control various bacterial pathogens in a variety of commercially important freshwater and marine species.
Use of oxytetracyline dihydrate as the active ingredient for a feed topcoat premix is FDA approved for controlling multiple pathogenic bacterial species in certain cultured finfish (table 1).
Table 1.
Approved uses for oxytetracycline in U.S. aquaculture.The study objective was to evaluate the efficacy of FFC- and OTC-medicated feeds offered separately to control mortality associated with MAS in walleye. This final study report summarizes the clinical field trials done at Spirit Lake Fish Hatchery (SLFH) in 2011 and 2012.
Materials and Methods
The study protocol and amendments for this study are contained in appendix 1 (table 1.1; refer to 1_AEH-09-MAS-02_protocol.pdf; note that all documents listed in app. 1 tables are available for download at https://doi.org/10.3133/ofr20231056). The study was done at a state hatchery (SLFH, Spirit Lake, Iowa) in accordance with the Good Clinical Practice standards described in FDA Guidance for Industry 85 (Center for Veterinary Medicine, 2001). All methods and materials followed the written protocol and its amendments, except those instances that were identified as deviations. This study was done in two trials, one trial in 2011 and one trial in 2012. Unauthorized protocol deviations during the study are described in the following section. Detailed notes were kept in separate notebooks throughout each trial (table 1.1; refer to 1_Notebooks.pdf and 1_Recorded_Events.pdf).
Experimental Design
We tested the efficacy of florfenicol (FFC)-medicated feed when offered at a dose of 15 mg FFC/kg BW/day for 10 days and oxytetracycline (OTC)-medicated feed when offered at a dose of 82.5 mg OTC/kg BW/day for 10 days to control mortality caused by MAS. The efficacy trials were done onsite at SLFH, an Iowa Department of Natural Resources Fish Hatchery, using a single lot of fish in each trial with clinical signs and mortality indicative of an MAS outbreak. The study included three treatment groups equally divided among a nonmedicated control group, an FFC-medicated group, and an OTC-medicated group. In the 2011 trial, treatments were assigned to randomly designated raceways. For the 2012 trial, treatment designation was assigned to each tank according to a randomized-block design, consisting of two blocks with nine individual tanks contained within a single fiberglass unit (block). There were three tanks per treatment group per block. The experimental unit was the individual tank. Each test tank or raceway in each trial was independently supplied a continuous flow of filtered lake water.
Fish were distributed on July 15, 2011, to 10 raceways by hatchery staff and on June 15, 2012, to the test tanks by study staff according to a random assignment code (table 1.2; refer to 2_random_tx_allocation_code_2011.sas). For the 2012 trial, groups of 10 or fewer fish were transferred into test tanks according to the assignment code until each tank had 63 test fish. This was adjusted to 54 fish per tank because of variable mortality on June 25, 2012, before treatment initiation. Treatment (nonmedicated control, FFC-medicated, or OTC-medicated) was assigned to individual test tanks in a randomized block design according to a random assignment code (table 1.2; refer to 2_random_fish_allocation_code_2012.sas).
The nonmedicated control group was offered a nonmedicated control ration throughout the course of each trial except as noted in the next section; the medicated groups were offered either sufficient FFC-medicated feed to achieve a nominal dose of 15 mg FFC/kg BW/day or OTC-medicated feed to achieve a nominal dose of 82.5 mg OTC/kg BW/day for 10 consecutive days. All three groups were offered the nonmedicated control ration for the 14-day posttreatment observation period. It can be challenging to get walleye to eat enough commercial dry feed (Johnson, 2016; Piper, 2010), and adequate feeding is critical to receive an efficacious dose of the top-coated medication as well as required nutrition for the animals (Steve Redman, U.S. Geological Survey, oral commun., August 30, 2022); therefore, in the 2012 trial, we also recorded categorical observations of how much of the feed was eaten versus remained uneaten at the bottom of the tanks before cleaning each day scored as 75–100 percent feed remaining, 50–75 percent feed remaining, 25–50 percent feed remaining, or 0–25 percent feed remaining (table 1.3; refer to 3_Feed_Prep_and_Usage.pdf).
Unauthorized Deviations
In the 2011 trial, 10 hatchery raceways were used instead of the 18-tank block, because the 18-tank block was occupied by a concurrent Esox masquinongy (Muskellunge) trial. Additionally, the treatment types were unequally distributed. Four raceways were offered FFC-medicated feed; four raceways were offered OTC-medicated feed; and two raceways were offered nonmedicated control feed.
Completion of this study was reliant on hatchery staff. The fish used were supplied by the hatchery, and resulting mortalities reduced the available stock of the hatchery; therefore, whereas the hatchery had an interest in obtaining an outcome that could result in improved treatment methods for dealing with a MAS outbreak, they also had an interest in limiting the mortality of experimental animals.
In the 2011 trial, hatchery staff offered medicated feed to control raceways starting on day 7 (July 22, 2011). One control raceway was offered FFC-medicated feed and one was offered OTC-medicated feed. All raceways were treated with formalin each day (1,765 milliliter [mL] per raceway) after the 10-day medicated feed treatment period starting on July 26, 2011. Hatchery staff resumed offering medicated feed to all raceways 1 day after the beginning of the post-treatment observation period on July 27, 2011. Starting on July 30, 2011, all raceways were offered OTC-medicated feed regardless of treatment group until August 13, 2011. On August 18, 2011, hatchery staff treated all raceways with 10 parts per million (ppm) diquat.
In the 2012 trial, fish were offered medicated feed and treated with diquat on June 14, before distribution to the test tanks, to minimize handling stress. Fish were offered feed at a rate of 7 percent BW/day instead of the 5 percent rate used in the 2011 trial to account for the lower dose of medication in the feed. One day into the 10-day dosing period, the number of fish was verified in one randomly selected tank from each treatment group because there was some uncertainty about the accuracy of the fish counts. A hatchery staff member (who was blinded to treatment assignments) selected from slips of paper for each treatment group with tank identifications written on them. They then gave the three selected papers to a study staff member (who was also blinded to treatment assignment) to count all fish in the tanks. One tank was determined to have the expected number of fish; one tank had one less fish than expected; and one tank had one more fish than expected. It was decided that this indicated the counts were accurate enough to proceed without counting the rest of the tanks thereby avoiding unnecessary stress on the test animals.
Test Articles
The FFC test article was the commercially available formulation, Aquaflor 50 percent Type A Medicated Article (florfenicol, 2,2-dichloro-N-[(1R,2S)-3-fluoro-1-hydroxy-1-(4-methanesulfonylphenyl)propan-2-yl]acetamide; Schering-Plough, Bray, Ireland; lot number 035184).
The OTC dihydrate test article was Terramycin 200 for Fish Type A Medicated Article (4S,4aR,5S,5aR,6S,12aS)-4-(dimethylamino)-3,5,6,10,11,12a-hexahydroxy-6-methyl-1,12-dioxo-1,4,4a,5,5a,6,12,12a-octahydrotetracene-2-carboxamide; Phibro Animal Health, Ridgefield Park, N.J.; lot number N10110124XF).
Certificates of Analysis for the test articles are included in table 1.3 (refer to 3_Certificates_of_Analysis.pdf). Test article use was documented (table 1.3; refer to 3_Feed_Prep_and_Usage.pdf), and a portion of the test article was placed in the chemical archives of the U.S. Geological Survey Upper Midwest Environmental Sciences Center (UMESC) in La Crosse, Wisconsin.
Feed Preparation
Feed preparation was done onsite at SLFH on July 14, 2011, and at UMESC on June 9, 2012. Nelson and Sons Walleye Grower 9206 2.0 extruded slow sinking feed was used for the 2011 trial. Otohime EP1 weening feed was used for the 2012 trial. Control diets were the commercially prepared nonmedicated feeds and the medicated diets were prepared by top coating portions of the commercially prepared nonmedicated feeds. The FFC-medicated feed was prepared to provide nominal dose rates of 15 mg FFC/kg BW when fish were offered medicated feed at a rate of 5 percent BW/day. The target FFC feed concentration in the medicated diet was therefore 300 mg FFC/kg feed. Approximately 25 kg of the nonmedicated feed was placed into a clean portable 0.5-horsepower electric cement mixer. With the mixer running, approximately (~) 15 g of Aquaflor was poured on to the rotating feed. The medication and feed were allowed to mix for 2–3 minutes and then ~380 g of warmed Virginia Prime Fish Oil for Pets (Omega Protein Corporation, Houston, Texas) was sprayed on to the rotating mixture. The oiled, medicated feed was allowed to mix for ~15 minutes (mins). Once mixing was completed, the feed was poured into a large double-ply, heavy-duty paper leaf bag. Each of the three prepared batches was packaged separately in sequentially numbered bags. Actual feed, medication, and oil weights are included in table 1.3 (refer to 3_Feed_Prep_and_Usage.pdf).
The OTC-medicated feed was prepared to provide nominal dose rates of 82.5 mg OTC/kg BW when fish were offered medicated feed at a rate of 5 percent BW/day. The target OTC feed concentration in the medicated diet was therefore 1,650 mg OTC/kg feed. Each batch of feed was prepared in the same manner as the FFC-medicated feed but used ~95 g of Terramycin 200 for Fish rather than the 15 g Aquaflor. All other feed processing procedures were similar. Actual feed, medication, and oil weights are included in table 1.3 (refer to 3_Feed_Prep_and_Usage.pdf).
The labeled bags of study feed were stored in SLFH secure temperature and humidity-controlled storeroom until needed. When a bag of feed was needed, one was removed from the locked storeroom and transferred to the mobile laboratory, which was always locked when personnel were not present. Feed withdrawals were tracked on a combination of data sheets and separate logbooks included in table 1.3 (refer to 3_Feed_Prep_and_Usage.pdf).
Verification of Drug Concentration in Medicated Feed
FFC and OTC concentration in the feed were analyzed in samples collected on the day feed was made, at the initiation of dosing, and again at the completion of the dosing period. FFC and OTC concentrations were determined according to Eurofins method numbers SCH–102 and EAH–119, respectively. The absence of contaminants was confirmed by concurrent analysis of the control ration. FFC and OTC feed assay analyses conformed to Good Manufacturing Practices regulations, 21 C.F.R. § 225 (1976).
Approximately 600 g of each medicated feed type was collected by hand after mixing the contents of the selected bag. The samples were then divided into two equal aliquots and double bagged in sealable plastic bags. In the 2012 trial, 400-g samples were collected and equally divided for testing. For each trial, one aliquot of each feed type was submitted to Eurofins (Portage, Michigan) for analysis and the other was stored at −80 °C at UMESC. Feed samples submitted to Eurofins were frozen at approximately −20 °C and shipped overnight in coolers with ice packs according to UMESC chain of custody procedures (UMESC SOP ECO 513; table 1.1; refer to 1_SOPs_Used.pdf). In the 2012 trial, subsamples of the OTC-medicated feed were also sent to Covance (Greenfield, Iindiana) because of their more robust and sensitive OTC assay methods. Feed FFC and OTC concentrations are reported in table 2. Certificates of analysis from Eurofins and Covance are included in table 1.3 (refer to 3_Certificates_of_Analysis.pdf). Remaining feed at Eurofins after analysis was disposed of according to Eurofins standard procedures.
Table 2.
Florfenicol and oxytetracycline concentration in feed.[FFC, florfenicol; mg, milligram; /, per; kg, kilogram; OTC, oxytetracycline; <, less than; µg, microgram]
Feed Contaminant Status
On July 21, 2011, and on June 25, 2012, one sample (~4 kg) of the control ration was collected from the first bag used for the study and divided into two ~2-kg aliquots. Aliquots were stored in the freezer in the laboratory trailer until they could be returned to UMESC. In the 2012 trial, samples were put directly into the UMESC freezers. One aliquot was shipped to Eurofins on August 8, 2011, and one was shipped on September 17, 2012. The remaining aliquots were stored frozen (~ −80 °C) at UMESC. OTC-medicated and control feed subsamples (249.1 g and 266.2 g, respectively) were also shipped to Covance on September 17, 2012. Control rations were assayed to determine the concentrations of three potential medicated-feed contaminants: OTC, Romet (sulfadimethoxine+ormetoprim), and FFC. Contaminants were not detected in control feed (tables 2 and 1.3; refer to 3_Certificates_of_Analysis.pdf).
Test Animals
All animal procedures were reviewed and approved by the U.S. Geological Survey UMESC Animal Care and Use Committee (table 1.1; refer to 1_AEH-09-MAS-02_protocol.pdf). The 2011 trial was done directly in the hatchery raceways nos. 11–20, each of which contained more than 3,000 walleye fingerlings. Fish used in the 2012 trial were taken from raceways 11 and 20. Detailed records of study fish transfers were kept according to UMESC SOP GEN 133 (table 1.1; refer to 1_SOPs_Used.pdf) and are included in table 1.2 (refer to 2_Fish_Transfer_Records.pdf).
Fish size was determined at the initiation of dosing from fish removed for disease verification by measuring and weighing the euthanized fish (2 per raceway/tank, n=20 for the 2011 trial; n=34 for the 2012 trial). The mean (±standard deviation [s.d.]) mass of fish in the first trial was 8.9 g (±1.5 g). The mean (±s.d.) length of fish used in the first trial was 10.6 centimeters (cm; ±0.53 cm). The mean (±s.d.) mass of fish used in the second trial was 4.0 g (±0.74 g). The mean (±s.d.) length of fish used in the second trial was 8.3 cm (±0.54 cm). These data are recorded in table 3 from necropsy data sheets in table 1.5 (refer to 5_Necropsies.pdf).
Table 3.
Initial mass and length of walleye.[ID, identifier; g, gram; cm, centimeter]
Test Animal Care and Maintenance
An image of the walleye raceways used in the 2011 trial is shown in figure 1. For the 2012 trial, two insulated fiberglass tanks (~81 cm wide x 305 cm long) that contained 10 individually plumbed and drained test tanks (62 cm long x 28 cm wide x 22 cm deep [standpipe height]; ~38-liter [L] water volume) that were used as the experimental units (fig. 2). To prevent clogging, water for this system was prefiltered through a 200-micron (µm) filter bag to remove debris before passing through two 3.2-cm thick coarse polyester filters and being pumped to the test system by a 0.5-horsepower submersible pump. Filters were cleaned one to two times per day as needed. Water flow through each test tank was maintained at 600–750 mL/min to maintain at least two tank-volume exchanges per hour. Test tanks were aerated using ceramic air diffusers (5 x 2.5 cm) attached to a diaphragm air pump. Test tanks were cleaned twice daily during the trial.
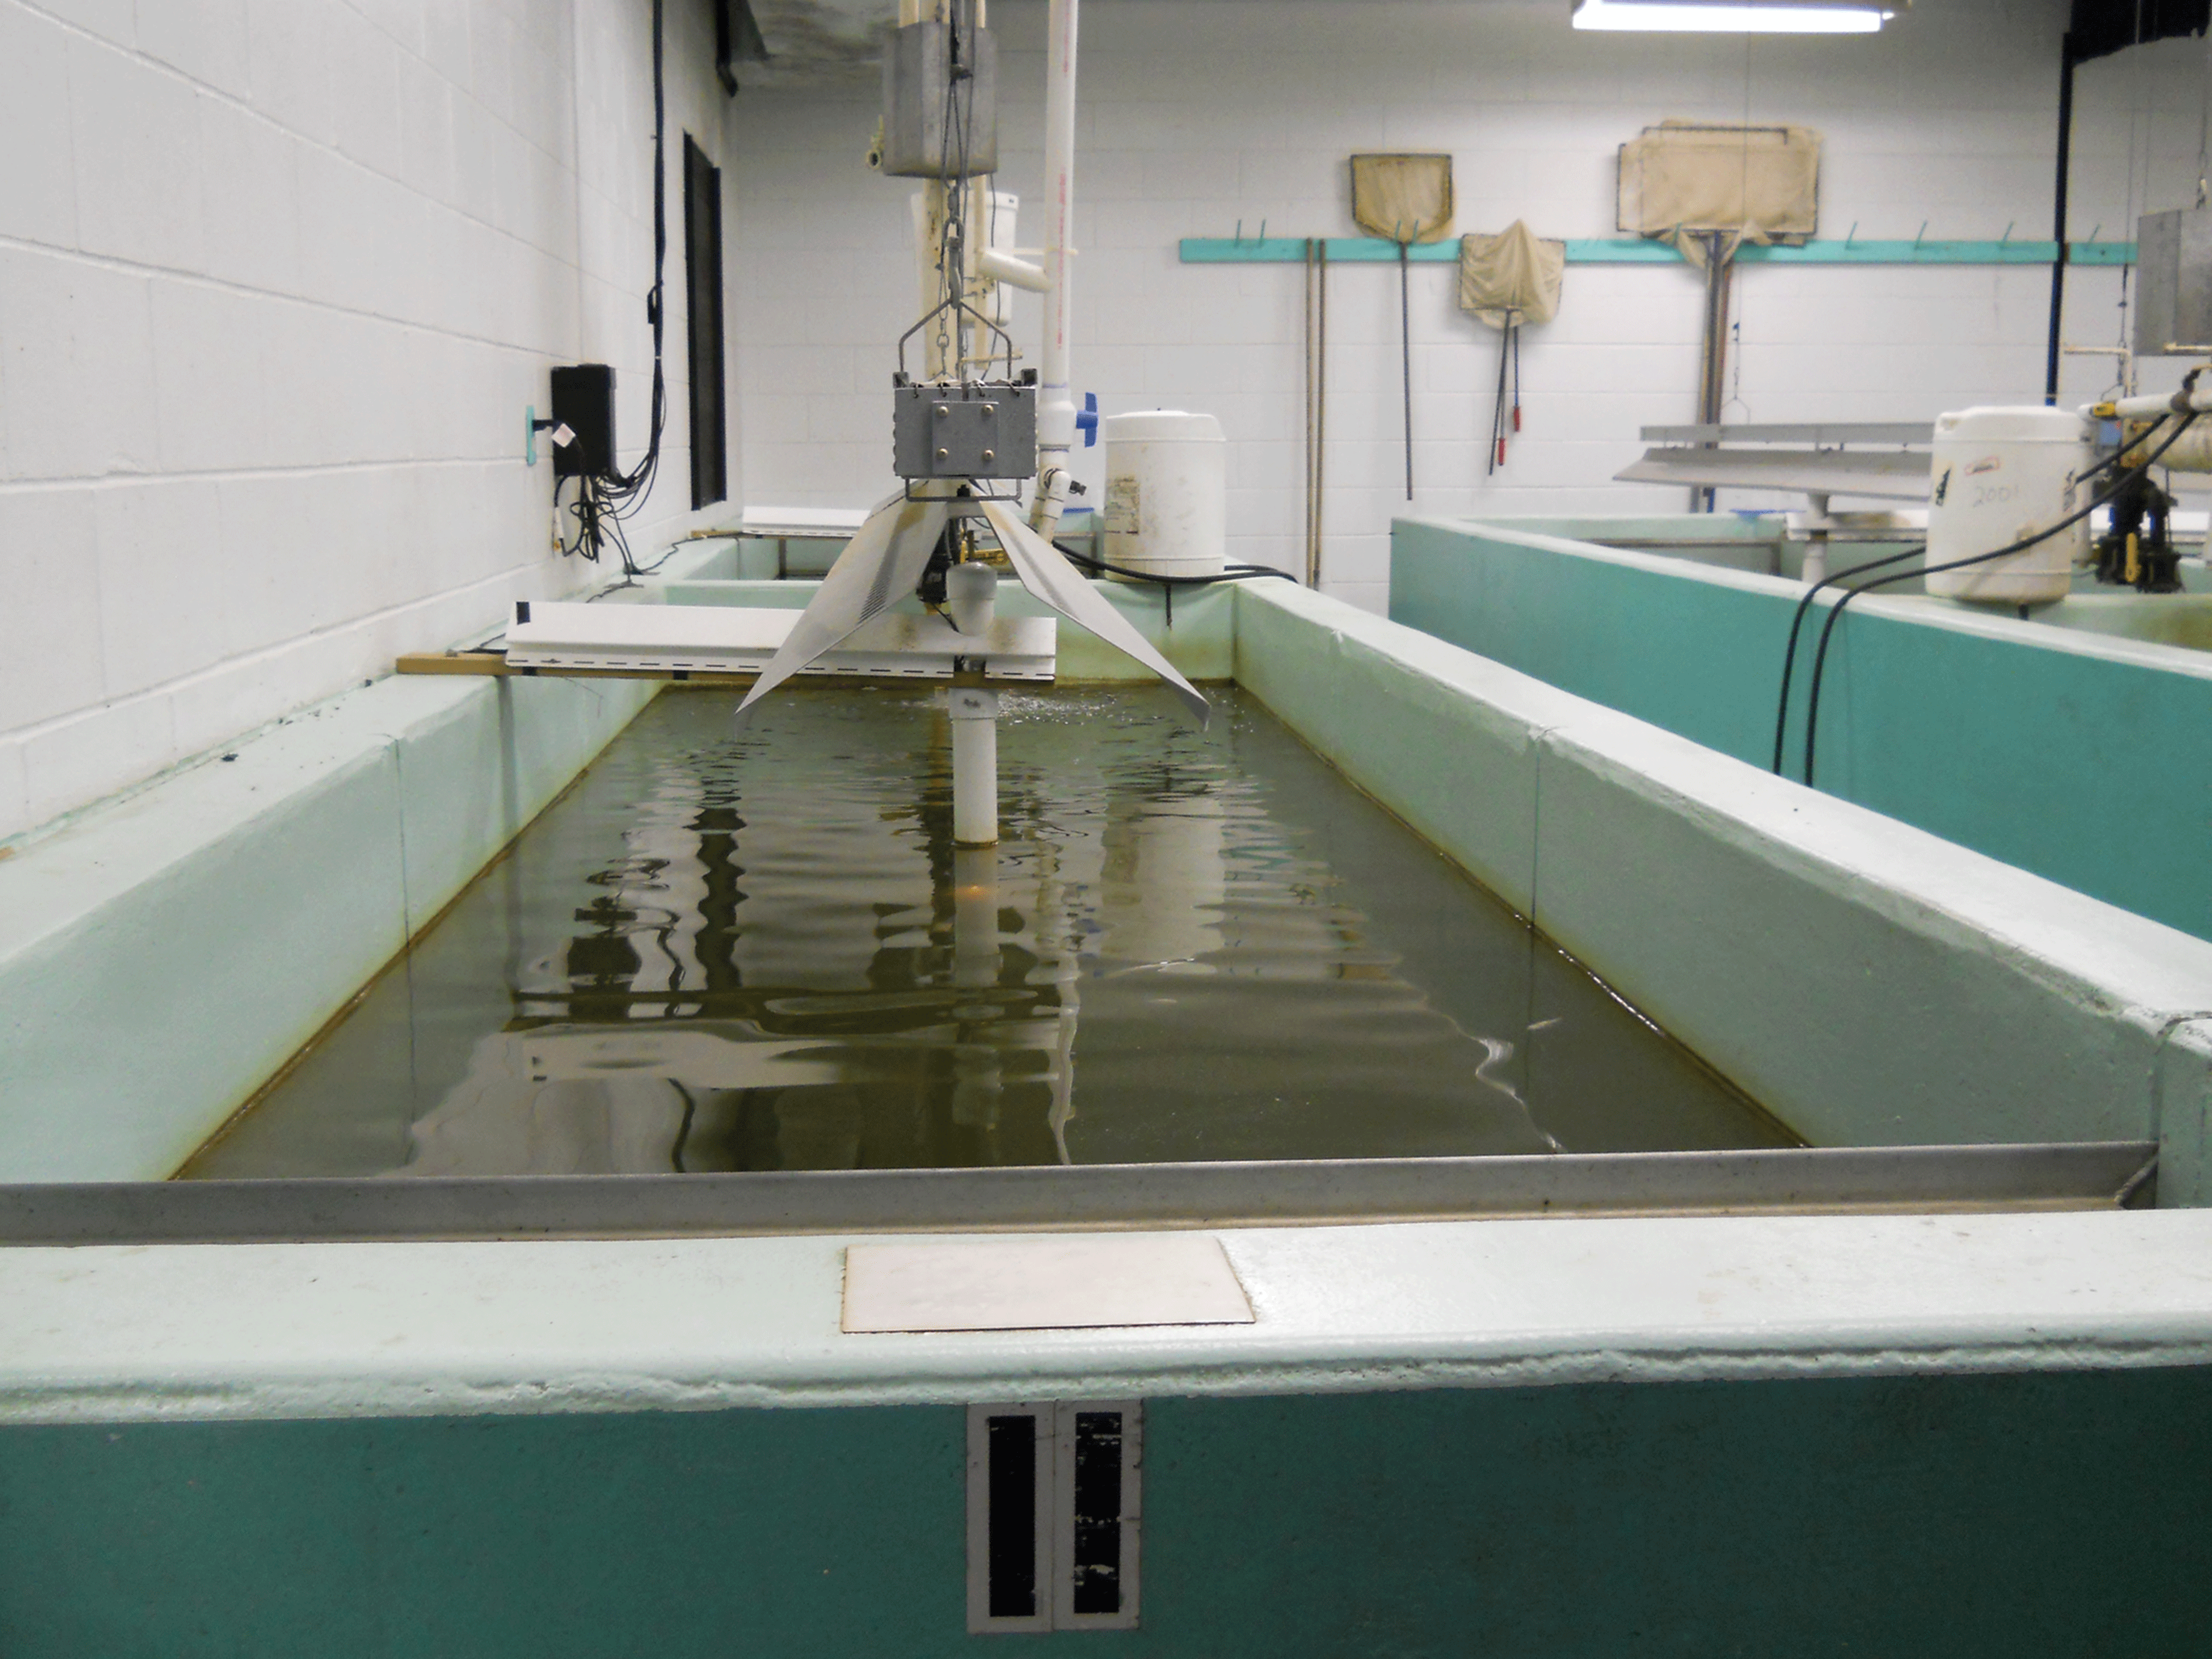
Hatchery raceway containing walleye (Sander vitreus). In the center of the raceway is the solenoid actuated feeder used to dispense the feed ration. Water flows in at the far end of the raceway and flows out behind the screen at the close end of the raceway.
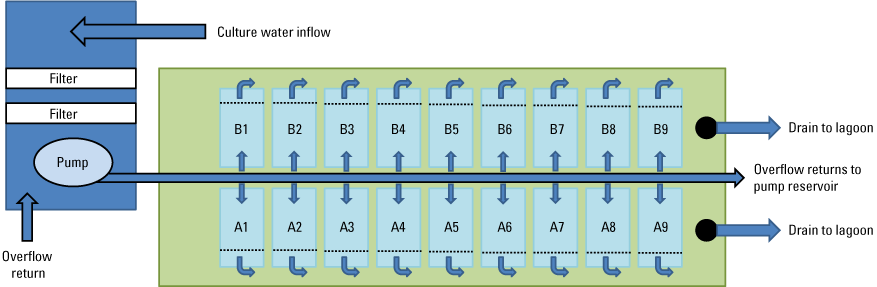
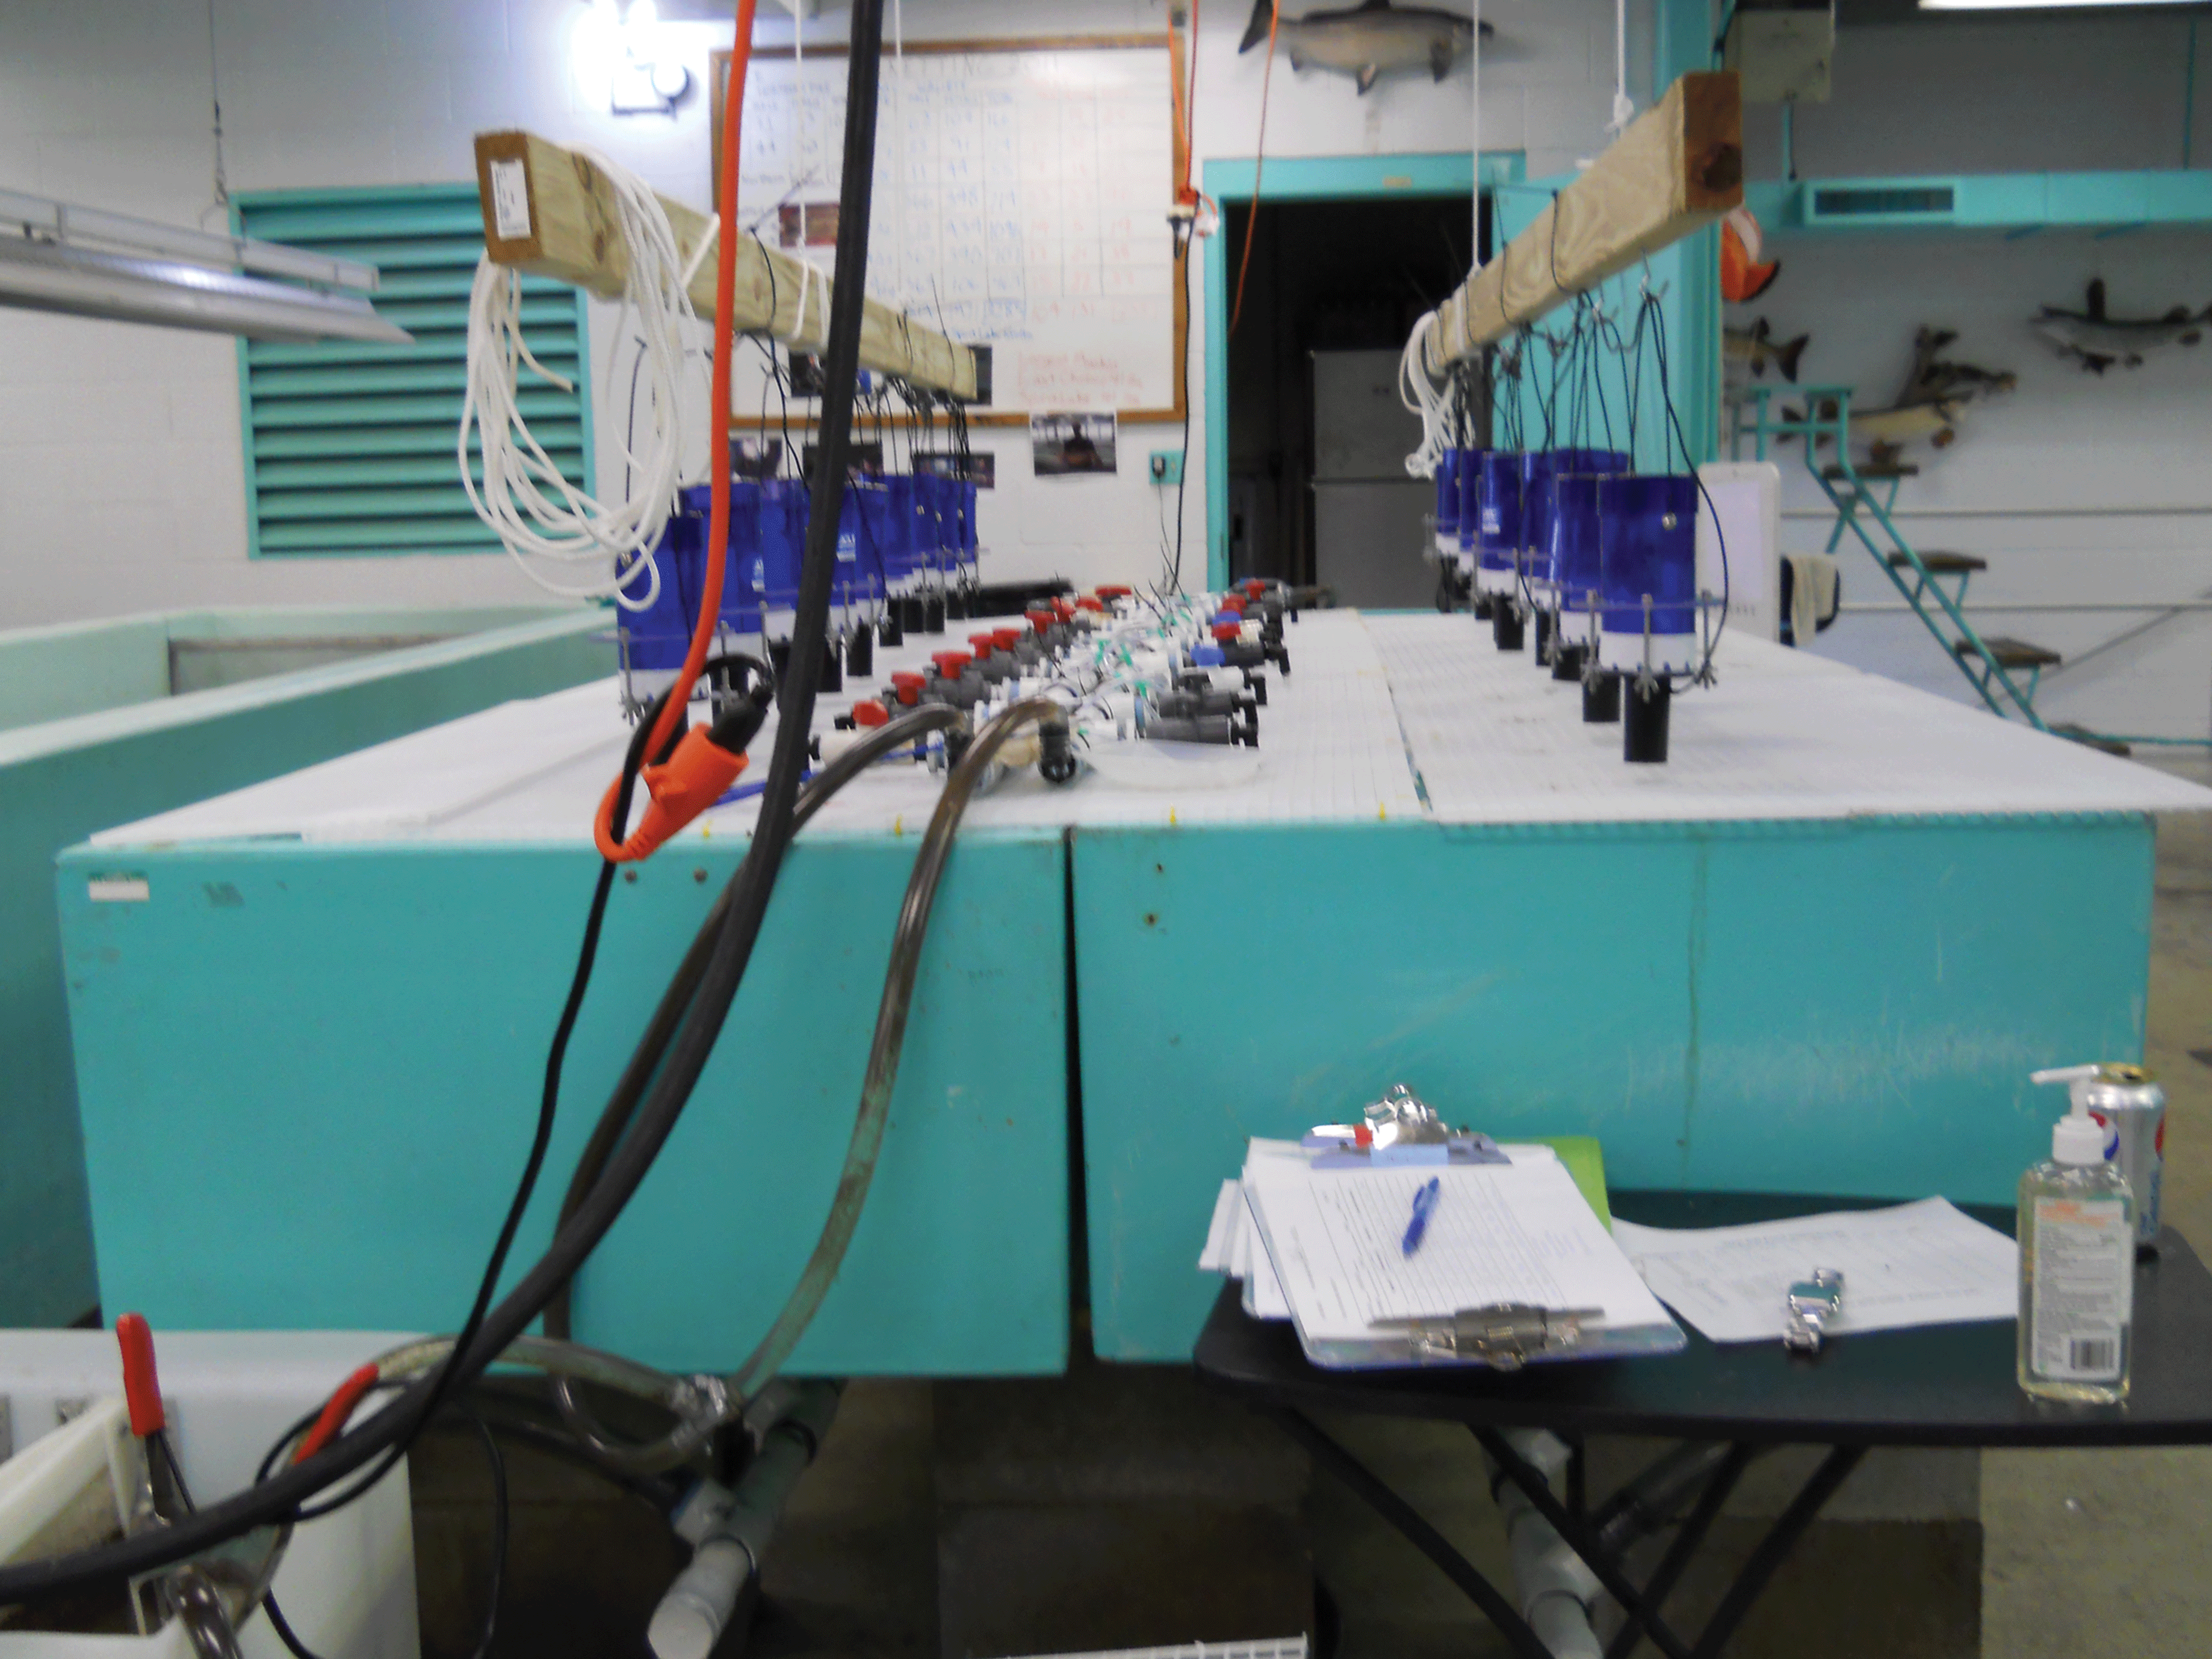
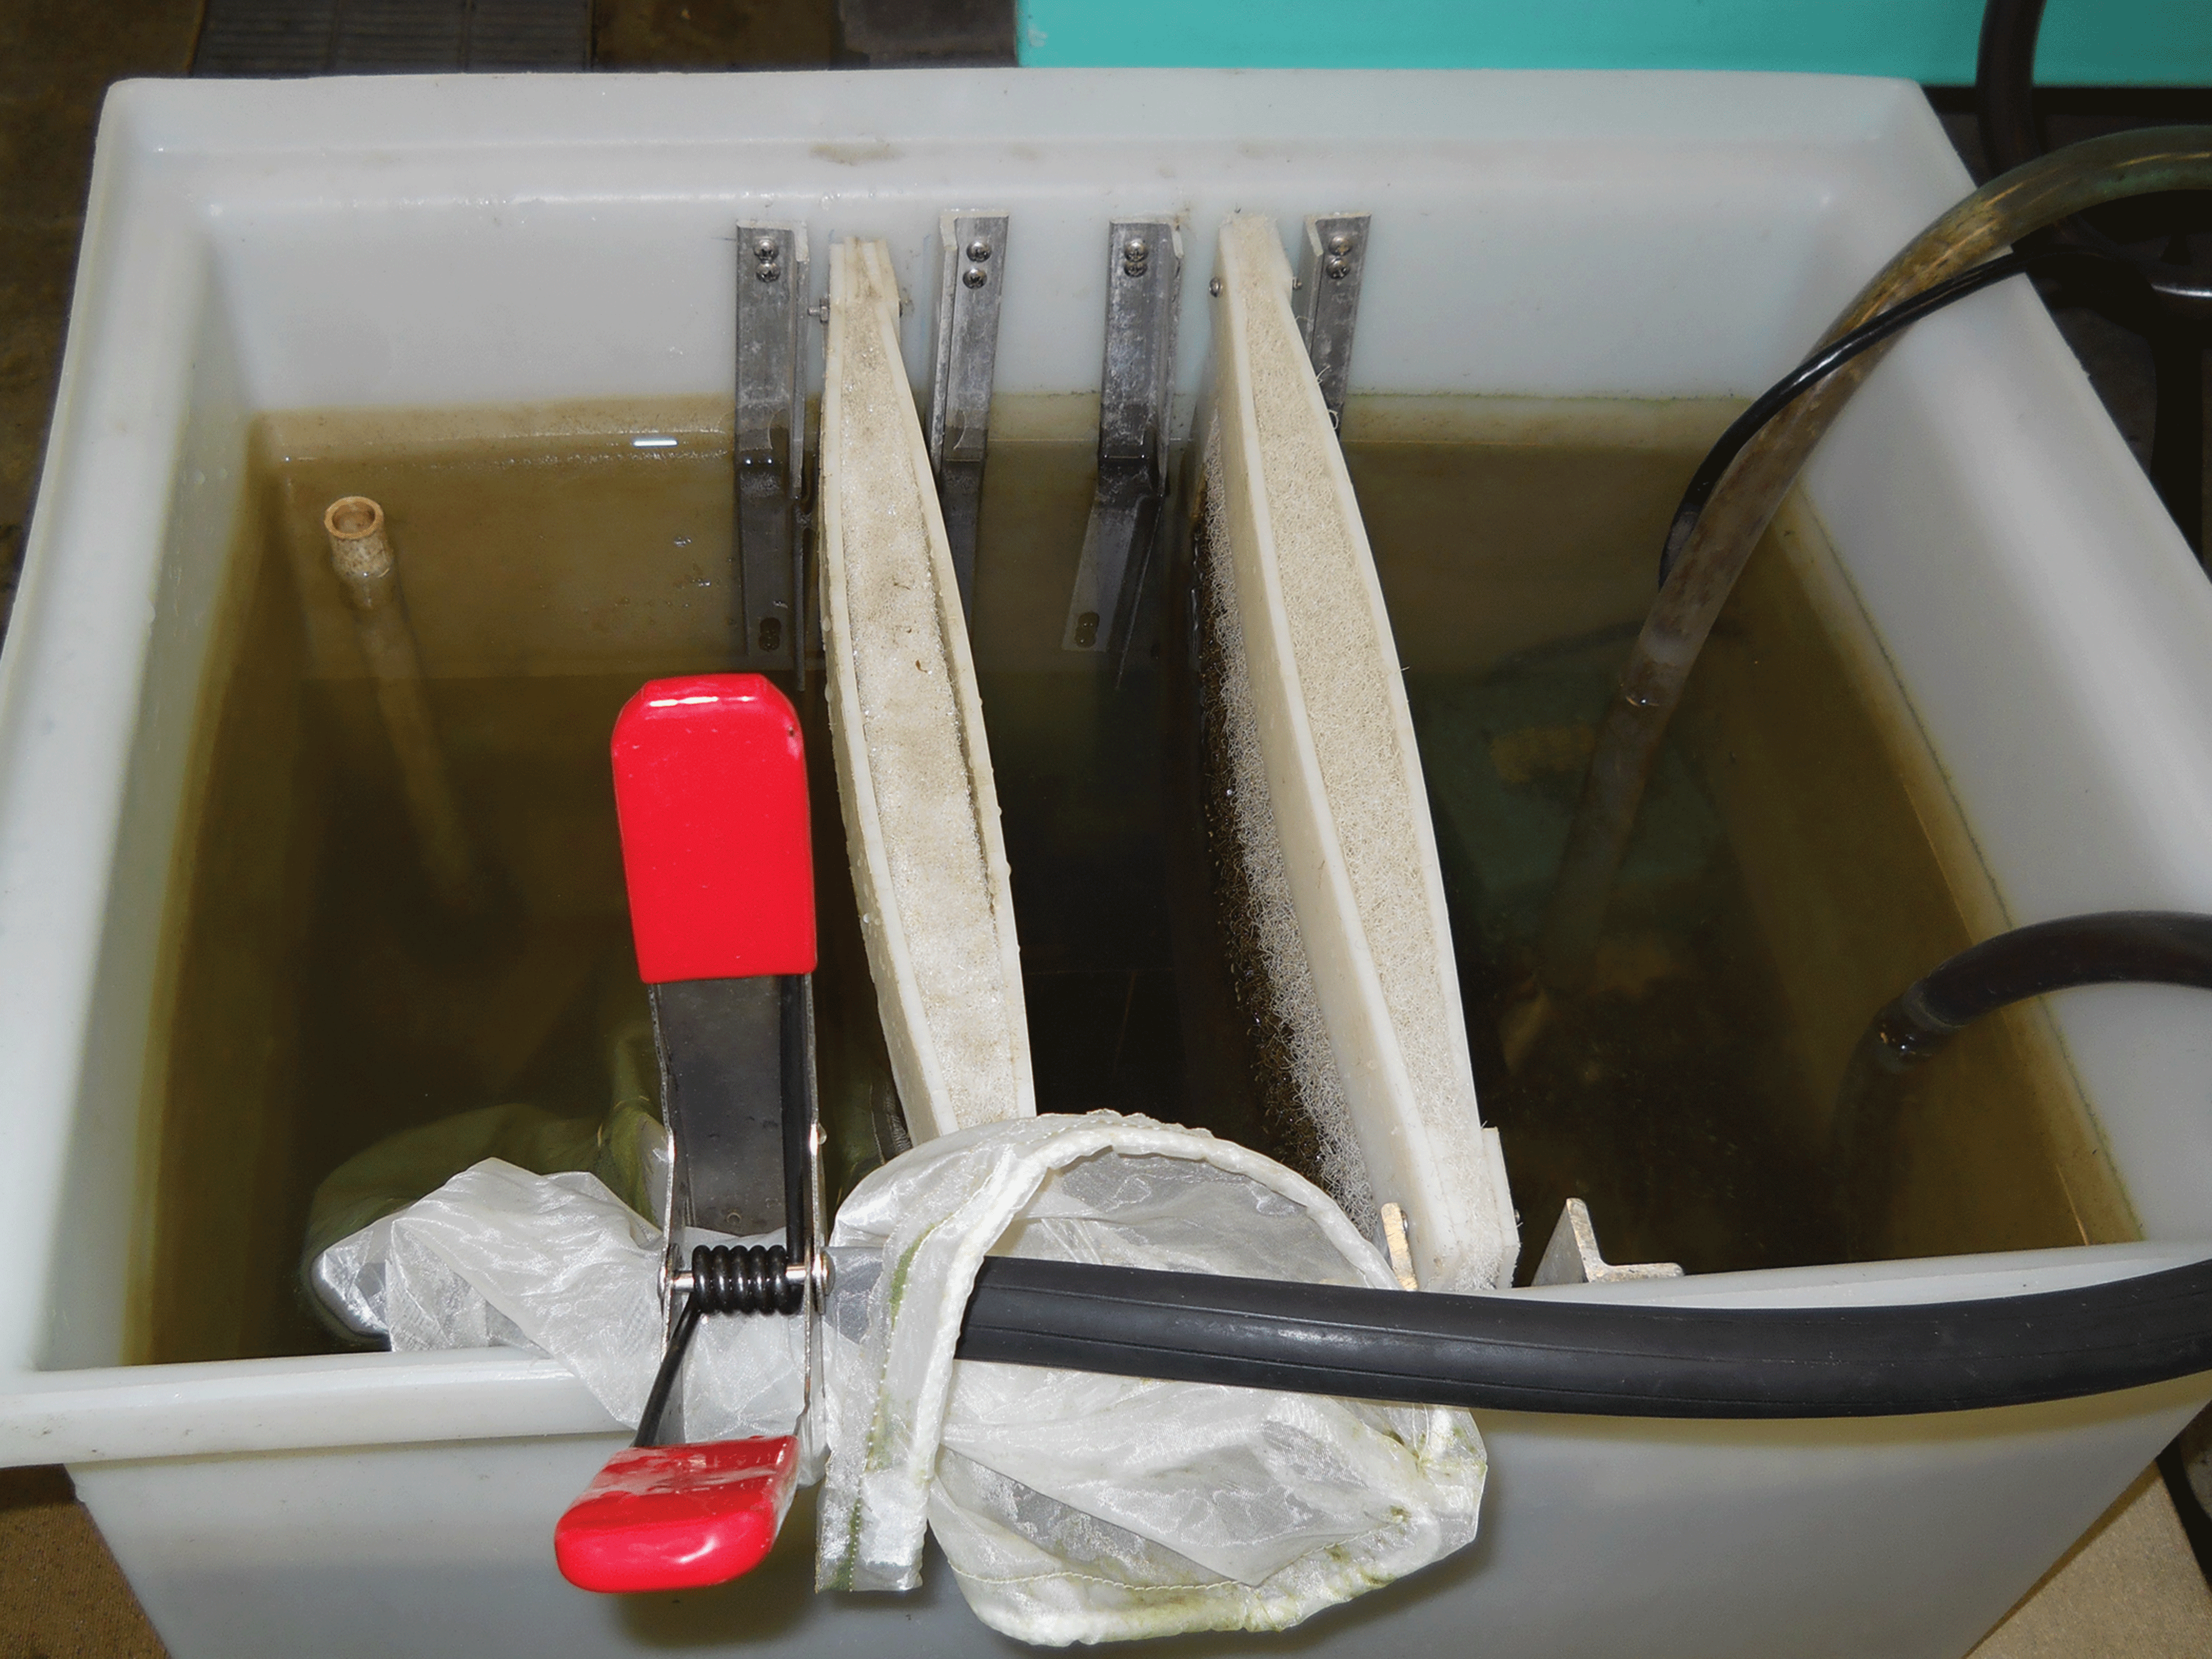
Test system setup showing, A, schematic of the flow of water through the test system, B, photograph of test chambers, and, C, photograph of test system reservoir.
Each test tank was numbered sequentially within a test block. Appropriate signage was placed near the test chambers to indicate that a disease trial was in progress. The area was roped off to indicate access was restricted to authorized study personnel. Test tanks were physically secured within a locked building when staff were not present on the grounds; however, the hatchery building itself is open to the public on weekdays, and tours were not supervised.
Disease Diagnosis and Microbiological Assessment
For the 2011 trial, 20 fish (2 per raceway) were collected, euthanized, and sampled for presumptive and definitive disease diagnosis by the hatchery manager on July 15, 2011. For the 2012 trial, 30 fish (from the source population) and 34 fish (2 per test tank) were collected, euthanized, and sampled for presumptive and definitive disease diagnosis by the study director on June 14, and June 25, 2012, respectively (table 1.4; refer to 4_Microbial_Observations.pdf). Microbiological samples were collected by inserting a sterile loop into the posterior kidney and streaking onto a tryptic soy agar (TSA) plate using the quadrant method.
Microbiological samples were also collected during necropsies using the same procedures. Plates that showed bacterial growth with creamy white to tan, round, raised colonies were presumed to be positive for motile Aeromonad species and subcultured onto Rimler-Shotts (RS) selective media for confirmation. RS plates with yellow growth were considered as confirmed positive for motile Aeromonad species, and these colonies were archived on Microbank beads and stored at −80 °C. Notes for the microbiological sampling and assessment are in the study notebooks (table 1.1; refer to 1_Notebooks.pdf), separate isolation and culture notebooks (table 1.4; refer to 4_Isolation_Logbooks.pdf), and data sheets (table 1.4; refer to 4_Microbial_Observations.pdf).
Mortality
Mortality was defined as lack of opercular movement and lack of response to physical stimulus of the caudal peduncle and was assessed twice daily. Mortalities were weighed, measured, and observed externally and internally (table 1.5; refer to 5_Morts.pdf and 5_Necropsies.pdf). Microbiological samples were collected during necropsies as described previously, and several mortalities were also sampled by skin scrape, fin clip, and gills spreads, which were then examined microscopically.
Dosing
The fingerling walleye at SLFH were offered feed at 5 percent BW/day in the 2011 trial by solenoid actuated feeders and 7 percent BW/day in the 2012 trial by automatic vibratory feeders that released small amounts of feed every 5 minutes. Upon dosing period initiation (on July 15, 2011, and June 25, 2012), fish were offered either the nonmedicated control ration or the medicated ration as the sole feed source during the 10-day dosing period except as noted in the “Unauthorized Deviations” section. Medicated feed was prepared in the 2011 trial at a nominal concentration of 300 mg FFC/kg feed or 1,650 mg OTC/kg feed requiring feeding at 5 percent BW/day to achieve dose rates of 15 mg FFC/kg BW/day or 82.5 mg OTC/kg BW/day. For the 2012 trial, medicated feed was prepared at a nominal concentration of 214.3 mg FFC/kg feed or 1,179 mg OTC/kg feed requiring feeding at 7 percent BW/day to achieve the same dose rates as in the 2011 trial. The amount of feed was adjusted each day for mortalities when it was weighed from containers labeled only with the tank or raceway ID. Feed was added to the feeders between 09:00 and 10:00 each day. During the postdosing observation period, the nonmedicated control ration was offered as the sole feed source except as noted in the “Unauthorized Deviations” section.
Blinding
The study director, supervisory biologist, and lead technician were the only personnel who had access to the treatment assignment codes. Study personnel collecting mortalities and doing microbiological sample preparation/analysis were blinded to the treatment assignment. The lead technician weighed sufficient feed for each test tank from the bulk feed bags into containers labeled with the appropriate tank number, with no indication of the nominal concentration.
Water Chemistry Recording and Analysis Methods
Dissolved oxygen (UMESC SOP AEH 394; table 1.1; refer to 1_SOPs_Used.pdf), temperature (using a thermometer whose calibration was been verified according to UMESC SOP AEH 903; table 1.1; refer to 1_SOPs_Used.pdf), and pH (UMESC SOP CAP 310 or AEH 334; table 1.1; refer to 1_SOPs_Used.pdf) were measured and recorded once daily in each test tank. Measurements were made with the following: Hach water chemistry meter (model HHQ40d); YSI D.O. meter (model 55/12FT); Hanna pH meter; Beckman pH meter (model Φ250); or a thermometer as noted in the study notebooks (table 1.1; refer to 1_Notebooks.pdf) and recorded on data sheets (table 1.6; refer to 6_Water_Quality.pdf). Alkalinity and hardness were also measured from one tank in the A block and one tank from the B block on July 4, 2012, and July 16, 2012, following UMESC SOP AEH 706 and 712 (table 1.1; refer to 1_SOPs_Used.pdf). Total water hardness was determined by titrating with ethylenediaminetetraacetic acid according to method 2340C, and alkalinity was determined by titrating to an endpoint of pH 4.5 with 0.02 normal sulfuric acid (H2SO4) according to method 2320B as described in Baird and others (2017).
Data Analysis
The data collected for this study are available at https://doi.org/10.5066/P9VHDBCW (Merkes and others, 2024). We analyzed water chemistry data to verify environmental factors that could affect the results and mortality data as the main experimental endpoint.
Water Chemistry
For both trials, we plotted dissolved oxygen, pH, and temperature over time by raceway or tank. We calculated means for each metric across tanks for each day. The mean value for pH was calculated based on hydronium ion concentration. Plots were generated in R version 4.1.2 (R Core Team, 2021) using RStudio version 2022.02.0 build 443 (RStudio Team, 2020), and the code used for these analyses is included in table 1.6 (refer to 6_WQ_Code.R).
Survival/Mortality
For the 2011 trial, we plotted cumulative mortality over time for each raceway. There was some unknown uncertainty in how many fish were in each raceway because they were stocked there by the hatchery staff and were not counted by study staff. However, each raceway started with roughly the same number of fish and was more than 3,000 fish per raceway.
For the 2012 trial, we were able to control the number of fish in each tank; therefore, we were able to plot cumulative percent mortality (number of mortalities divided by the total number of fish in the tank) over time for each tank. Additionally, we plotted the mean cumulative percent mortality across treatments over time with a loess regression. All plots were generated in R version 4.1.2 (R Core Team, 2021) using RStudio version 2022.02.0 build 443 (RStudio Team, 2020), and the code used for these analyses is included in table 1.5 (refer to 5_Mortality Figures Code.R).
Study Records and Archiving
All raw data, including the laboratory notebooks, electronic files, test material information, and other records pertaining to the study prepared by the study director or study staff are retained in the UMESC archives at La Crosse, Wisconsin (UMESC SOP GEN 007; table 1.1; refer to 1_SOPs_Used.pdf).
Results
Because there are protocol deviations that may have confounded the results, we present the data collected without drawing conclusions about the efficacy of either drug.
Microbiological Observations
Initial TSA plate inoculations for the 2011 trial produced bacterial growth typical of motile Aeromonad species (creamy white to tan, round, raised colonies) on 2 of 20 plates (table 1.4; refer to 4_Microbial_Observations.pdf). Because of increased mortality in the fish and similarity to previously confirmed Aeromonad outbreaks at SLFH, the study was started without further disease confirmation. Microbiological samples were collected from necropsied mortalities during the study period, and subcultures were prepared from colonies that appeared consistent with motile Aeromonad growth. Sixty presumptive Aeromonad samples (approximately 15 of each distinct colony morphology) were frozen but never further identified; however, there is no documentation tracking the subculturing and RS media results besides the brief entry in logbook IC–2 and the sample disposal memo included in table 1.4 (refer to 4_Isolation_Logbooks.pdf and 4_WAE Sample Destruction Memo.pdf).
Initial TSA plate inoculations for the 2012 trial had little growth and none of which resembled motile Aeromonad species; therefore, the plates were discarded. A second assessment was done by the study director on June 25, 2012. Fish that died in between that time were tested, and two fish from each tank were euthanized and microbiological samples were streaked onto TSA plates from posterior kidney stabs (table 1.4; refer to 4_Microbial_Observations.pdf). Some of the plates had growth indicative of motile Aeromonad species. Two of those plates (one isolated from a pretrial mortality and one isolated as part of the second assessment) were later confirmed by showing yellow growth when subcultured on RS media on June 27, 2012. Throughout the 2012 trial period, 140 of 146 TSA plates prepared showed bacterial growth (table 1.4; refer to 4_Microbial_Observations.pdf). From those plates, 133 colonies were subcultured on RS media, and 52 showed yellow growth indicating motile Aeromonad species (table 1.4; refer to 4_Microbial_Observations.pdf). These RS-positive cultures were then saved on microbank beads and stored at −80 °C, and they were later identified to species by barcoding the 16s ribosomal RNA and RNA polymerase sigma D factor genes, which is described in the attached report (table 1.4; refer to 4_Aeromonad_Speciation_Admin_Report_Final.pdf).
Concurrent Medications
Fish were also treated with FFC-medicated and OTC-medicated feed, an Ichthyophthirius multifiliis (Ich) drip of formalin, and diquat as noted in the “Unauthorized Deviations” section of the methods.
Delivered Dose
In the 2011 trial, the FFC and OTC concentrations were verified to be at the expected concentration and 83 percent of the expected concentration in the respective feeds (table 2). The fish were observed feeding; therefore, we think that the fish received a delivered dose equal to the nominal dose for FFC and 83 percent of the nominal dose for OTC. However, we did not record observations of whether any feed remained uneaten during the 2011 trial as would be needed to make a confident determination.
In the 2012 trial, the FFC and OTC concentrations were verified to be at 78 percent and 87 percent of the expected concentrations in the respective feeds (table 2). We observed that the fish ate all or nearly all the feed offered during the dosing period except for a few cases in the first two days (table 1.3; refer to 3_Feed_Prep_and_Usage.pdf); therefore, we estimate that in the 2012 trial, the fish received an average delivered dose of 11.8 mg FFC/kg BW/day or 71.8 mg OTC/kg BW/day in their respective treatment groups.
Water Chemistry
Water chemistry metrics were mostly similar between raceways or tanks with some variation over time (figs. 3 and 4; table 1.6; refer to 6_Water_Quality.pdf). In the 2011 trial, the mean dissolved oxygen ranged from 4.6 to 6.3 milligrams per liter (mg/L), mean pH ranged from 7.1 to 8.2, and mean temperature ranged from 24.1 to 27.6 °C (fig. 3; table 1.6; 6_Water_Quality.pdf). Alkalinity and water hardness were not measured in the 2011 trial.
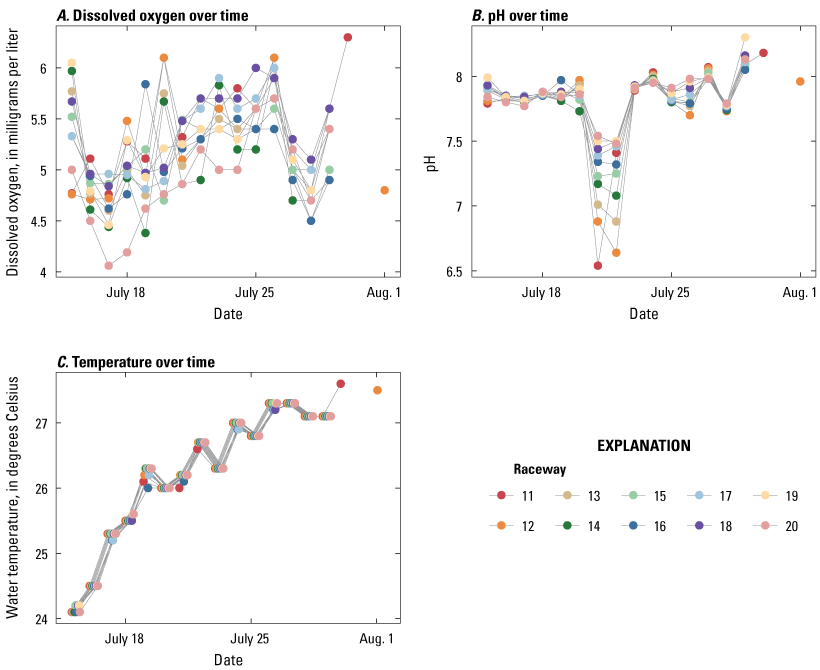
Water chemistry metrics for 2011 trial. A, dissolved oxygen; B, pH; and C, temperature over time. To avoid plotting most lines on top of each other, 1/20th of a day is added to the date per raceway from raceway 11 plotting on the true date to raceway 20 plotting on date plus 9/20th of a day.
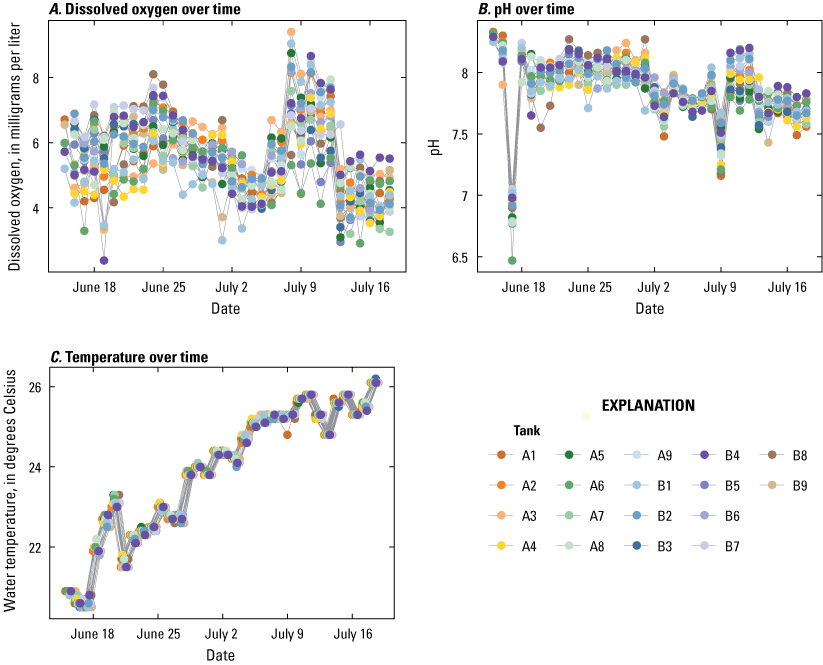
Water chemistry metrics for 2012 trial. A, dissolved oxygen; B, pH; and C, temperature over time. To avoid plotting most lines on top of each other, 1/20th of a day is added to the date per tank from tank A1 plotting on the true date to tank B9 plotting on date plus 17/20th of a day.
In the 2012 trial, the mean dissolved oxygen ranged from 4.1 to 7.3 mg/L, mean pH ranged from 6.9 to 8.3, and mean temperature ranged from 20.6 to 26.1 °C (fig. 4; table 1.6; refer to 6_Water_Quality.pdf). Alkalinity was 184 mg/L as calcium carbonate (CaCO3) in tank B1 and 187 mg/L CaCO3 in tank A9 on July 4, 2012, and it was 165 mg/L CaCO3 in tank B1 and 166 mg/L CaCO3 in tank A9 on July 16, 2012 (table 1.6; refer to 6_Water_Quality.pdf). Water hardness was 248 mg/L in tank B1 and 244 mg/L in tank A9 on July 4, 2012, and it was 224 mg/L in tanks B1 and A9 on July 16, 2012 (table 1.6; refer to 6_Water_Quality.pdf).
Dissolved oxygen remained reasonably consistent throughout both trial periods, although it had slightly more variation between raceways or tanks than either pH or temperature. This is likely because of the affect of individual airstones that were separately in each tank or raceway. Values of pH remained reasonably consistent throughout the 2011 trial, but we observed a substantial dip July 21–22, 2011 (fig. 3B). In the 2012 trial, pH also dipped substantially on June 17, 2012, and pH gradually decreased over time for the remainder of the trial period (fig. 4B). The cause of the pH change is unknown. Water temperature gradually increased over time in both trials (figs. 3C, 4C).
Survival
Mortality was substantial in all raceways during the 2011 trial (fig. 5, table 1.5; refer to 5_Morts.pdf). The minimum mortality for the duration of the 2011 trial (from the initiation of the dosing period to the end of the postdosing monitoring period) was 137 individuals in one of the OTC-medicated raceways followed by 165 mortalities in one of the control raceways. The greatest mortality for the duration of 2011 trial was 563 individuals in one of the FFC-medicated raceways followed by 553 mortalities in one of the OTC-medicated raceways. All raceways showed a sharp increase in mortalities at one or two points between July 18, 2011 (dosing day 3) and August 3, 2011 (5 days after putting all raceways on OTC-medicated feed; fig. 5). Mortality stabilized in all raceways by August 5, 2011. Mortality was more stable in the control raceways after being placed medicated feed on July 22, 2011, although the observed mortality appears to have been tapering off before that dosing began.
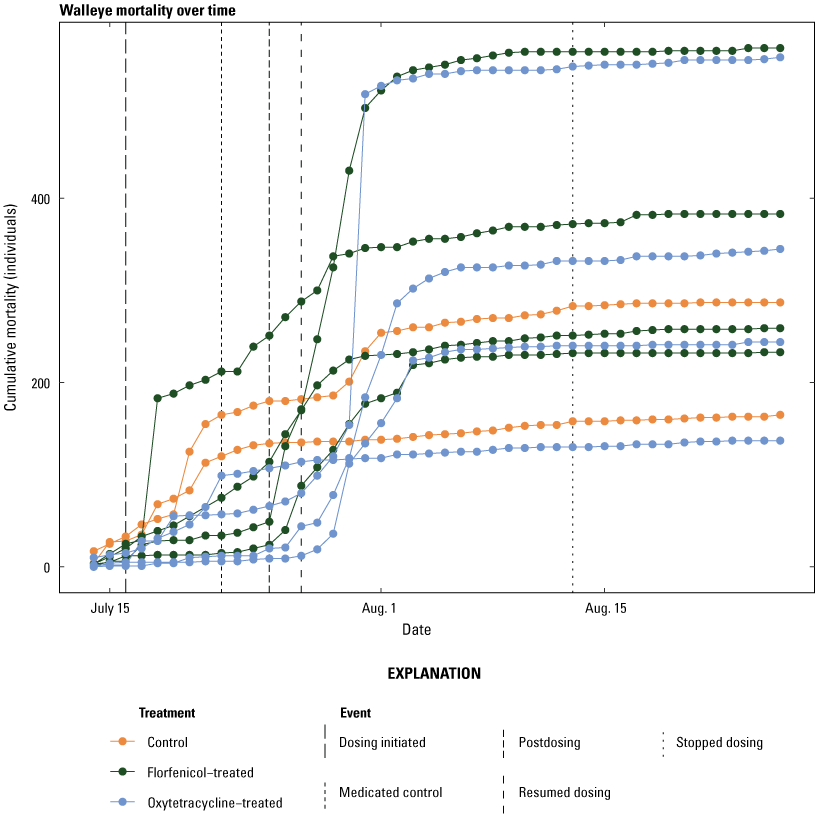
Cumulative mortality over time for 2011 trial. The cumulative number of mortalities for each raceway is shown on the y-axis with time on the x-axis. The data for each raceway are color-coded by treatment with control raceways in red, florfenicol-medicated raceways in green, and oxytetracycline-medicated raceways in blue. Reference points are shown as vertical lines for July 16 (medicated feed started), July 22 (control raceways placed on medicated feed), July 25 (medicated feed ended), July 27 (medicated feed resumed for all raceways), and August 13 (medicated feed stopped).
There was some variation in mortality throughout the study period in the 2012 trial (fig. 6; table 1.5; refer to 5_Morts.pdf). Final survival ranged from 41.8 percent to 92.3 percent for control tanks, from 30.9 percent to 82.6 percent for FFC-treated tanks, and 61.2 percent to 84.6 percent for OTC-treated tanks (fig. 6). Mean survival (84.3 percent, 86.6 percent, 82.0 percent for control, FFC-treated, and OTC-treated, respectively) at the end of the dosing period was indistinguishable among treatments (fig. 7). Mean survival (61.3 percent, 65.6 percent, 73.0 percent for control, FFC-treated, and OTC-treated, respectively) at the end of the postdosing observation period was indistinguishable between the control and FFC-treated tanks and marginally better in OTC-treated tanks with largely overlapping credible intervals (fig. 7). This is including 15 mortalities that were recorded on July 4 in one of the control tanks after the inflow became clogged and slowed to a drip overnight.
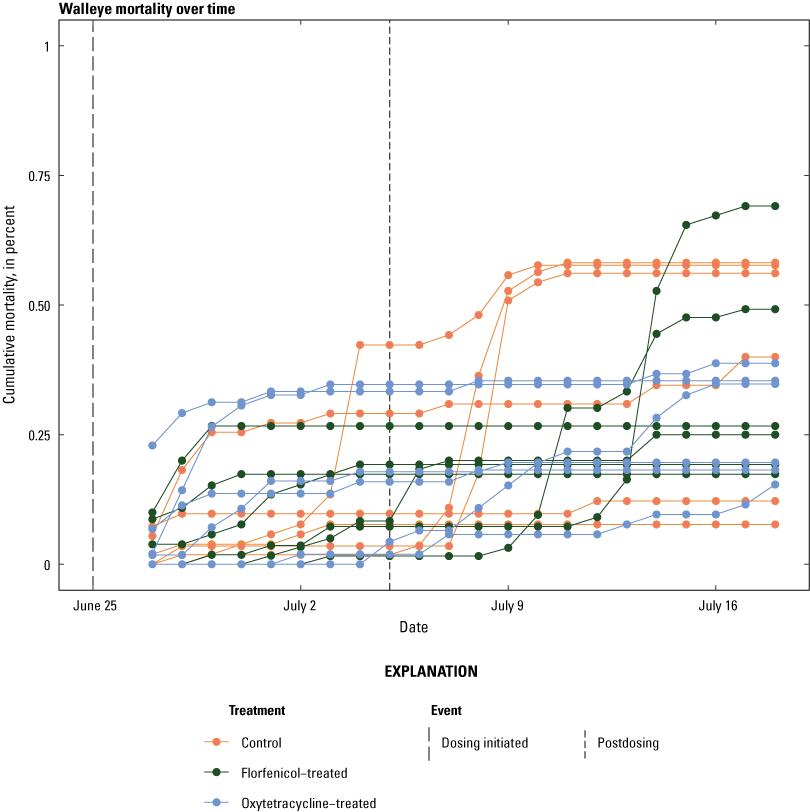
Cumulative percent mortality over time for 2012 trial. The cumulative percent mortality (mortalities divided by total starting fish) for each tank is shown on the y-axis with time on the x-axis. The data for each tank are color-coded by treatment with control tanks in red, florfenicol-medicated tanks in green, and oxytetracycline-medicated tanks in blue. Reference points are shown as vertical lines for June 25 (medicated feed started) and July 5 (medicated feed ended).
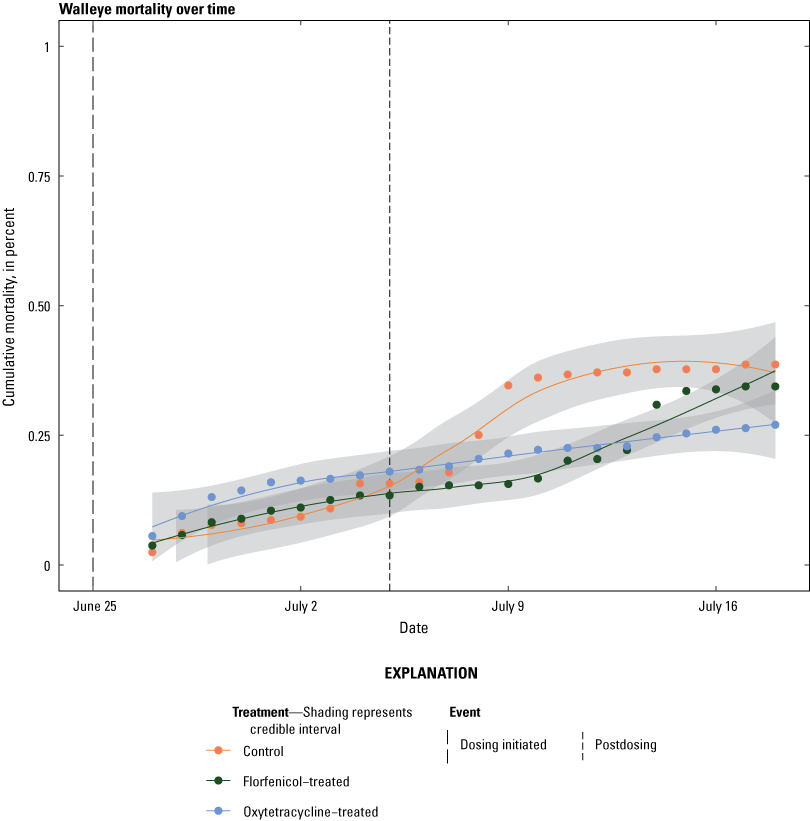
Mean cumulative percent mortality over time for 2012 trial. The mean cumulative percent mortality across tanks for each treatment is shown on the y-axis with time on the x-axis. The data are color-coded by treatment with control tanks in red, florfenicol-medicated tanks in green, and oxytetracycline-medicated tanks in blue. Data are fitted with a loess regression and shading represents the 95-percent credible interval. Reference points are shown as vertical lines for June 25 (medicated feed started) and July 5 (medicated feed ended). Data are fitted with a loess regression and shading represents the 95-percent credible interval.
References Cited
Camus, A.C., Durborow, R.M., Hemstreet, W.G., Thune, R.L., and Hawke, J.P., 1998, Aeromonas bacterial infections—Motile Aeromonad septicemia: Southern Regional Aquaculture Center publication no. 478, 4 p., accessed August 2022 at http://aquaculture.ca.uky.edu/sites/aquaculture.ca.uky.edu/files/srac_478_aeromonas_bacterial_infections-motile_Aeromonad_septicemia.pdf.
Center for Veterinary Medicine, 2001, Guidance for industry 85: Good clinical practice. U.S. Food and Drug Administration, accessed July 25, 2023, at https://www.fda.gov/regulatory-information/search-fda-guidance-documents/cvm-gfi-85-vich-gl9-good-clinical-practice.
Hanson, L.A., Liles, M.R., Hossain, M.J., Griffin, M.J., and Hemstreet, W.G., 2014, Motile Aeromonas septicemia (rev. September 2014), in FHS blue book—Suggested procedures for the detection and identification of certain finfish and shellfish pathogens (2012 ed.): Bethesda, Md., American Fisheries Society-Fish Health Section, 11 p. [Also available online at https://units.fisheries.org/fhs/wp-content/uploads/sites/30/2017/08/1.2.9-Motile-Aeromonas-Septicemia-2014.pdf.]
Johnson, J.A., 2016, Iowa DNR advanced fingerling walleye culture, in North Central Aquaculture Conference, Milwaukee, Wis., March 13, 2016, Proceedings: Milwaukee, Wis., Ohio Ecological Food and Farm Association, 29 p., accessed August 2022month year at https://www.ncrac.org/files/presentation/file/IA%20DNR%20Fingerling%20Walleye%2C%20Johnson.pdf.
Merkes, C.M., Tuttle-Lau, M.T., Schleis, S.M., and Cupp, A.R., 2024, Trial data for field effectiveness of florfenicol and oxytetracycline dihydrate in controlling mortality in walleye (Sander vitreus): U.S. Geological Survey data release, https://doi.org/10.5066/P9VHDBCW.
Mississippi State University Extension, 2022, Diseases: Mississippi State University Extension web page, accessed June 10, 2022, at http://extension.msstate.edu/agriculture/catfish/diseases.
R Core Team, 2021, R—A language and environment for statistical computing: Vienna, Austria, R Foundation for Statistical Computing, accessed January 2024 at https://www.R-project.org/.
RStudio Team, (2020). RStudio—Integrated development for R: Boston, RStudio Team, accessed January 2024 at http://www.rstudio.com/.
U.S. Food and Drug Administration [FDA], 2022, Approved aquaculture drugs: U.S. Food and Drug Administration web page, accessed June 10, 2022, at https://www.fda.gov/animal-veterinary/aquaculture/approved-aquaculture-drugs.
Appendix 1. Documentation and Data
Table 1.1.
Study protocol, amendments, and notebooks.[All documents are available for download at https://doi.org/10.3133/ofr20231056]
Table 1.2.
Fish distribution.[All documents are available for download at https://doi.org/10.3133/ofr20231056]
Table 1.3.
Test article and feed documentation.[All documents are available for download at https://doi.org/10.3133/ofr20231056]
Table 1.4.
Microbiology documentation.[All documents are available for download at https://doi.org/10.3133/ofr20231056. TSA, tryptic soy agar; RS, Rimler-Shotts]
Table 1.5.
Walleye mortality data.[All documents are available for download at https://doi.org/10.3133/ofr20231056]
| File | Description | Size |
|---|---|---|
| 5_Mortality Figures Code.R | This is the R code used to analyze the mortality data and generate figures 5–7. | Not paginated. |
| 5_Morts.pdf | This is the data sheets where mortality counts and gross necropsy observations were recorded. | 79 pages. |
| 5_Necropsies.pdf | This is the data sheets where detailed notes were recorded during necropsies. | 134 pages. |
Table 1.6.
Water-quality data.[All documents are available for download at https://doi.org/10.3133/ofr20231056]
Reference Cited
Merkes, C.M., Tuttle-Lau, M.T., Schleis, S.M., and Cupp, A.R., 2024, Trial data for field effectiveness of florfenicol and oxytetracycline dihydrate in controlling mortality in walleye (Sander vitreus): U.S. Geological Survey data release, https://doi.org/10.5066/P9VHDBCW.
Conversion Factors
International System of Units to U.S. customary units
Temperature in degrees Celsius (°C) may be converted to degrees Fahrenheit (°F) as follows:
°F = (1.8 × °C) + 32.
Supplemental Information
Concentrations of chemical constituents in water are given in milligrams per liter (mg/L).
For more information about this publication, contact:
Director, USGS Upper Midwest Environmental Sciences Center
2630 Fanta Reed Road
La Crosse, WI 54603
For additional information, visit: https://www.usgs.gov/centers/upper-midwest-environmental-sciences-center
Publishing support provided by the
Rolla Publishing Service Center
Disclaimers
Any use of trade, firm, or product names is for descriptive purposes only and does not imply endorsement by the U.S. Government.
Although this information product, for the most part, is in the public domain, it also may contain copyrighted materials as noted in the text. Permission to reproduce copyrighted items must be secured from the copyright owner.
Suggested Citation
Merkes, C.M., Tuttle-Lau, M.T., Schleis, S.M., and Cupp, A.R., 2024, Summary of data collected during field efficacy trials of florfenicol and oxytetracycline dihydrate in controlling mortality in walleye (Sander vitreus) because of motile Aeromonad infections: U.S. Geological Survey Open-File Report 2023–1056, 19 p., https://doi.org/10.3133/ofr20231056.
ISSN: 2331-1258 (online)
| Publication type | Report |
|---|---|
| Publication Subtype | USGS Numbered Series |
| Title | Summary of data collected during field efficacy trials of florfenicol and oxytetracycline dihydrate in controlling mortality in walleye (Sander vitreus) because of motile Aeromonad infections |
| Series title | Open-File Report |
| Series number | 2023-1056 |
| DOI | 10.3133/ofr20231056 |
| Publication Date | March 08, 2024 |
| Year Published | 2024 |
| Language | English |
| Publisher | U.S. Geological Survey |
| Publisher location | Reston, VA |
| Contributing office(s) | Upper Midwest Environmental Sciences Center |
| Description | Report: vii, 19 p.; Appendix; Data Release |
| Online Only (Y/N) | Y |
| Additional Online Files (Y/N) | Y |