

Drought-Vulnerability Assessment of Public Water Systems in West Virginia
Links
- Document: Report (1.25 MB pdf) , HTML , XML
- Data Release: USGS data release - Water withdrawal data of selected public water systems in West Virginia, 2014–2020
- NGMDB Index Page: National Geologic Map Database Index Page (html)
- Download citation as: RIS | Dublin Core
Acknowledgments
The authors would like to acknowledge the U.S. Geological Survey’s Risk Research and Applications Community of Practice for their support with funding and the West Virginia Department of Environmental Protection, the West Virginia Department of Health and Human Services, the West Virginia Division of Emergency Management, and the National Weather Service for their assistance with data provision and end-user feedback.
The authors also thank Sam Austin, Cheryl Dieter, Katherine Trickey, and Mitchell McAdoo of the U.S. Geological Survey for their review of the manuscript for this report, the data release, and the web tool.
Abstract
Water withdrawn from rivers and streams accounts for approximately 80 percent of the public water supply in West Virginia. Localized and (or) seasonal droughts may threaten future water availability in the state, particularly in rural communities located in the headwaters of unregulated watersheds. Monthly water withdrawal data obtained from the West Virginia Department of Environmental Protection’s Large Quantity User program’s regulatory database was used to calculate all-time, seasonal, and monthly 75th quantile withdrawal rates for 109 public water system (PWS) intakes withdrawing from surface waters in West Virginia. A drought-vulnerability assessment value was calculated by comparing PWS withdrawal rates to the 1-day, 10-year hydrologically based streamflow statistic (1Q10) for 71 of the 109 PWS in locations with valid streamflow statistics. Withdrawal rates were evaluated against thresholds representing different levels of drought-related impacts from the West Virginia interagency drought plan and ecological-flow literature. The drought-vulnerability assessment found 33 of 71 PWS have 75th quantile withdrawal rates greater than 100 percent of 1Q10 streamflow. Forty-five of 71 PWS have 75th quantile withdrawal rates more than 10 percent of 1Q10 streamflow, suggesting some level of ecological impairment during severe drought. Additionally, a publicly available, near real-time drought-awareness web tool was created to compare the estimated withdrawal rate for 109 PWS with forecast streamflows from the National Water Model to support decision-making for emergency and water managers.
Introduction
Approximately 80 percent of West Virginia’s public water supply comes from rivers and streams (Dieter and others, 2018; West Virginia Department of Environmental Protection, 2022). Although Appalachia historically has enjoyed an abundance of water across large geographical and temporal scales, localized and (or) seasonal drought conditions do occur. In October 2019, 50 percent of the state experienced moderate to severe drought and the remainder experienced abnormally dry conditions, resulting in the Governor of West Virginia declaring a drought emergency (Justice, 2019; National Drought Mitigation Center, 2022). Furthermore, regional climate modeling suggests that seasonal droughts may increase in frequency or severity throughout much of West Virginia because of increased evapotranspiration and aridity driven by rising temperatures (Fernandez and Zegre, 2019).
Drought impacts are not experienced uniformly across the state. The public water systems (PWS) of West Virginia’s largest municipalities are located along or near major watercourses with streamflow regulated by dams. These municipalities are likely to be affected only during the most severe or prolonged droughts. The PWS in smaller, rural communities located in the headwaters of unregulated watersheds may be at the greatest risk for drought-related supply shortfalls, as suggested by local reporting from the 2019 drought (Steelhammer, 2019).
Although there are several metrics and indices to measure the meteorological and hydrologic severity of drought, there is less understanding of when these environmental conditions begin to have societal impact (Bachmair and others, 2016). This report uses local data and nationally available models to provide a basic understanding of PWS drought vulnerability in West Virginia. Additionally, a monitoring tool was developed to help West Virginia’s emergency, environmental, and public health managers at the Federal, State, and local levels with drought planning, forecasting, or decision making.
Purpose and Scope
This report documents a drought-vulnerability assessment and the methods used to create a near real-time drought-awareness web tool for West Virginia PWS. This analysis informs at-risk municipalities and the Federal and State agencies tasked with drought response under the direction of West Virginia Division of Emergency Management’s Incident Specific Annex 6 (IS-6) drought guidelines (West Virginia Division of Emergency Management, 2016). These agencies include the National Weather Service, West Virginia Department of Environmental Protection (WVDEP), West Virginia Department of Health and Human Resources (WVDHHR), and West Virginia Division of Emergency Management (WVDEM), all of which cooperated on this study.
Description of Study Area
West Virginia is located among the Appalachian Mountains of the eastern United States. River systems west of the eastern continental divide drain into the Ohio River watershed; river systems east of the eastern continental divide drain into the Chesapeake Bay watershed. The state has a continental climate with an average of 45 inches of precipitation annually: spring and early summer are the wettest periods of the year; late summer and fall are the driest periods of the year (Wiley and Atkins, 2010). Runoff from precipitation is the primary surface water source for 109 PWS, comprising approximately 80 percent of all PWS withdrawals by volume (West Virginia Department of Environmental Protection, 2022). Most of West Virginia’s biggest municipalities utilize source water from large river systems with multi-purpose dams actively managed by the U.S. Army Corps of Engineers. However, there are dozens of smaller communities located higher in the watersheds of West Virginia’s mountainous terrain, upstream from active flow regulation or management structures, which are heavily reliant upon natural streamflow for their water supply. These PWS are the focus of the drought vulnerability-assessment and are shown in figure 1.
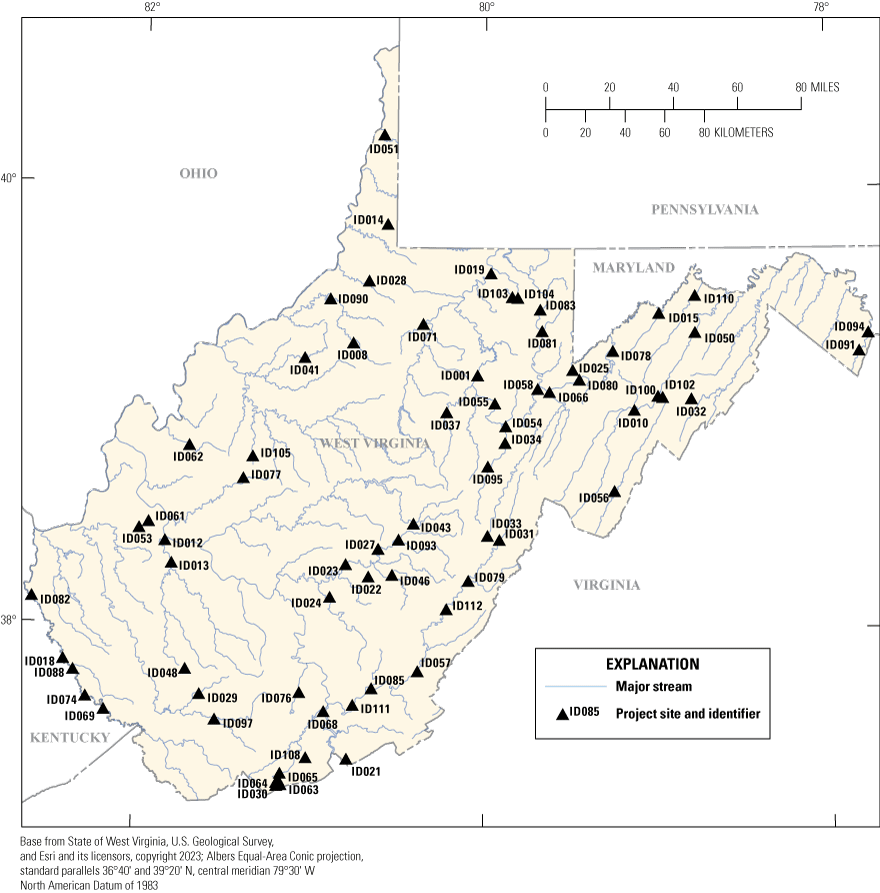
Map showing approximate locations of 71 surface water withdrawal intakes for public water systems in West Virginia included in the drought-vulnerability assessment.
Study Methods
The drought-vulnerability assessment compares PWS surface water withdrawal rates derived from a WVDEP regulatory database against U.S. Geological Survey (USGS) streamflow statistics (Wiley, 2008). A higher ratio of PWS water withdrawal to low-flow water availability suggests greater vulnerability during drought conditions. To support decision-making for water resource managers, the ratio of PWS surface-water withdrawals to forecast streamflows from the National Water Model (NWM; Cosgrove and Gochis, 2018; Cosgrove and Klemmer, undated) are calculated and are publicly available through a near real-time drought-awareness web tool (https://rconnect.usgs.gov/wv-surface-withdrawals/).
Drought-Vulnerability Assessment
Water Withdrawal Rates
Monthly water-withdrawal information was obtained upon request from the WVDEP Large Quantity User (LQU) program, which requires annual reports from all water users that withdraw more than 300,000 gallons per month from West Virginia’s water resources (West Virginia Department of Environmental Protection, 2022). The LQU database was filtered to include only those PWS intakes using surface water sources, with at least two years of available data, and still in operation as of 2022. PWS intakes using springs and groundwater wells were excluded from the study, as these water sources are not comparable with USGS streamflow statistics. With these restrictions in place, the database yielded LQU data from 2003 onwards; data collected from 2014 through 2020 were judged most consistent due to regulatory and reporting changes over time. Quality-control checks of data, including basic plots and summary statistics, identified infrequent errors that were subsequently corrected. The most common identifiable error (3.5 percent of PWS) stemmed from water operators submitting annual reports with monthly withdrawals recorded in “thousands of gallons” and not “gallons” as the LQU program requests. The error was discoverable as a three-orders-of-magnitude stepwise change in water use from year to year.
To safeguard PWS identities in accordance with USGS guidance (N. Booth, U.S. Geological Survey, written commun., 2014), each PWS withdrawal intake was given a unique identifier (Project ID) specific to this project. Each PWS intake’s reported monthly withdrawal in gallons was converted to cubic feet per second (ft3/s), assuming a constant withdrawal rate throughout a given month and a conversion factor of 7.4805 gallons to 1 cubic foot. Five PWS with redundant intakes on the same waterbody (a “primary” and “secondary”) were assumed to use only the primary intake. For this assessment, any withdrawals reported from a secondary intake were added to the primary intake withdrawal and the secondary intakes (ID007, ID073, ID084, ID098, ID101) were removed from the analysis. Failure to complete this step for these systems would artificially lower the ratio of withdrawal rate to streamflow during subsequent analysis.
The open-source statistical programming language “R” (version 4.0.3, R Core Team, 2020) was used to derive and plot all-time (2014–2020), seasonal, and monthly summary statistics for each PWS intake’s withdrawal rate. Upon review of time-series and box plots, and in consultation with State-agency cooperators, the 75th quantile withdrawal rate was selected as the best representation of water use for the drought-vulnerability assessment and web tool. The all-time 75th quantile withdrawal rate is representative of the typical seasonal increase in PWS withdrawals during the summer months when drought is most likely. On seasonal or monthly scales, the 75th quantile withdrawal rate represents moderately high-use scenarios while also avoiding outlier withdrawal rates. Outlier values are likely related to water system leaks and maintenance (West Virginia Department of Environmental Protection, 2022).
All PWS monthly withdrawal volumes and calculated withdrawal rates included in this study are available from Kearns and Faunce (2023).
Streamflow Statistics
Specific locations of PWS withdrawal intakes were provided by State-agency cooperators for this analysis but are not included in any subsequent report, data release, or web tool to comply with USGS guidance (N. Booth, U.S. Geological Survey, written commun., 2014) and West Virginia state law (West Virginia Legislature, 2023). Coordinates for each PWS withdrawal intake were visually compared to satellite and aerial imagery for accuracy and corrected as needed. Coordinates for 19 percent of the PWS intakes were corrected, resulting in locations changing by more than 100 meters. PWS withdrawal intakes were then assigned to the nearest 10-meter stream-grid cell used by the USGS StreamStats batch-processing application (U.S. Geological Survey, 2022). StreamStats solves regional regression equations to estimate annual and seasonal low-flow statistics (Wiley, 2008; Wiley and Atkins, 2010). Drainage-area transfer equations were used to estimate streamflow for streams with published streamgage statistics, and regional-regression equations were used to estimate streamflow for ungaged and gaged streams without published streamgage statistics (Wiley 2006; Wiley, 2008).
Streamflow estimates derived from low-flow regression equations or drainage-area transfer from streamgage statistics computed from unregulated periods of record are not valid on regulated streams (Wiley, 2008). Of the 109 PWS surface-water intakes in this study, 38 are located below dams with active flow regulation, as determined by a WVDEP-provided watershed flow tool (Technical Applications and GIS Unit, undated). Therefore, these 38 PWS are excluded from the drought-vulnerability assessment but are included in the near real-time drought-awareness web tool, which does not use the low-flow stream statistics.
From the regression and drainage-area transfer equations, the 1-day, 10-year hydrologically based streamflow (1Q10) statistic was selected as the best available representation of a severe drought. The 1Q10 statistic is the minimum average one-day streamflow expected (on average) once every 10 years (Wiley, 2008). The 1Q10 is the lowest-magnitude streamflow statistic currently available for West Virginia. Droughts at intervals with a lower probability of occurrence (for example 20-, 50-, or 100-year droughts) would all be expected to have lower magnitudes than the 1Q10 streamflow statistic.
The drought-vulnerability assessment described in this report uses a simple assumption: a PWS that withdraws a greater percentage of the available streamflow is more likely to be impacted by droughts. The 75th quantile of all monthly withdrawal rates (2014–2020) was divided by the 1Q10 streamflow statistic to derive a withdrawal to streamflow ratio (table 1). These 75th quantile withdrawal to 1Q10 streamflow ratios are the drought-vulnerability assessment: the greater the ratio, the greater vulnerability of the PWS to drought, and the greater the potential impact on human and (or) ecological systems during drought. Variations in drought vulnerability due to seasonal fluctuation of both 1Q10 (Wiley and Atkins, 2010) and the PWS 75th quantile withdrawal rate are provided in appendix 1.
Table 1.
Drought-vulnerability assessment of 71 selected public water systems in West Virginia.[mi2, square mile; 1Q10, 1-day, 10-year hydrologically based flow; ft3/s, cubic feet per second; WD, withdrawal; 75th WD/1Q10, 75th quantile withdrawal to 1-day, 10-year hydrologically based flow ratio; *, “divide by zero” error in 75th WD/1Q10 ratio; NA, not available; —, null values; contents organized from highest risk (greatest ratio) to lowest risk (smallest ratio)]
Drainage area from USGS StreamStats (U.S. Geological Survey, 2022).
1Q10 computed using methods from Wiley (2008).
WD calculated as the 75th quantile of all reported monthly withdrawals 2014–2020 (West Virginia Department of Environmental Protection, 2022).
On-stream storage indicated as either “reservoir” suggesting documented impoundment or “weir” suggesting a smaller in-stream control structure.
Reservoir storage data from National Inventory of Dams (U.S. Army Corps of Engineers, 2023).
Near Real-Time PWS Drought-Awareness Web Tool
Although the drought-vulnerability assessment suggests the likelihood of a drought impacting a PWS, it does not provide the real-time information that emergency managers, water utilities, and others need to make decisions regarding potential impacts of drought on the water supply. West Virginia’s interagency drought plan (West Virginia Division of Emergency Management, 2016) states that water-conservation measures should be enacted whenever water withdrawals exceed 25 percent of streamflow. However, there is no real-time PWS withdrawal rate reporting requirements and the majority of PWS considered by this report do not occur on stream reaches where continuous streamflow monitoring is available to inform these decisions. To increase awareness of those actionable drought-management thresholds, the PWS withdrawal rates used to assess drought vulnerability are leveraged in a publicly available web tool that calculates and displays PWS water-withdrawal ratios using hourly streamflow estimates from the NWM short-range forecasts (Cosgrove and Gochis, 2018; Cosgrove and Klemmer, undated).
The NWM is a hydrologic model built upon the Weather Research and Forecasting Model (WRF-Hydro; Gochis and others, 2013) that incorporates real-time meteorological data, reservoir levels, and measured streamflows from the USGS and U.S. Army Corps of Engineers gages (Cosgrove and Gochis, 2018). The NWM simulates water movement for 2.7 million river reaches of the 1:100,000 scale National Hydrology Dataset Plus Version 2.1 (NHDPlus; U.S. Environmental Protection Agency, 2012). NWM short-range forecasts are updated hourly and fill spatial gaps where monitored streamflow data are not available.
Because assumptions regarding actively managed and regulated flows are not present in the NWM, 38 PWS withdrawal intakes excluded from the drought-vulnerability assessment are included in the drought-awareness web tool. The web tool subsequently shares information for 109 PWS withdrawal intakes. To link PWS intakes with the NWM, each PWS intake location was assigned to the nearest NHDPlus stream reach with a valid NWM output. Four PWS (ID048, ID054, ID061, ID068) did not return a valid NWM output (“-9999,” indicating missing data in the model) and were instead linked to the nearest downstream stream reach with a valid output. Once assigned a reach, the forecasted streamflow is evaluated against the PWS intake’s 75th quantile withdrawal rate for the applicable month.
The web-tool user interface groups PWS by county or watershed (10-digit hydrologic code, HUC10; U.S. Environmental Protection Agency, 2012) without showing specific PWS intake locations, which could conflict with USGS guidance (N. Booth, U.S. Geological Survey, written commun., 2014) and West Virginia state law (West Virginia Legislature, 2023). A user selects a county or watershed in the web tool, and information for each PWS within that area is provided in an information panel. The information panel displays the estimated PWS withdrawal rate (75th quantile of historical monthly withdrawal rate), current short-range NWM streamflow forecast for the reach associated with the intake, the estimated-withdrawal to forecast-streamflow ratio, and other relevant information regarding the source waters for each PWS in the selected area. Information in the tool is updated hourly to coincide with the frequency of NWM short-range forecast updates.
The web tool’s user interface is color-coded for easy identification of potential PWS drought-related impacts. Estimated PWS 75th quantile monthly withdrawals greater than 25 percent of NWM forecast streamflow (the conservation threshold from WVDEM IS-6) are used as the uppermost category, displayed in orange. Estimated PWS 75th quantile monthly withdrawals between 10 to 25 percent of NWM forecast streamflow were selected as an intermediate category displayed in yellow. Estimated PWS 75th quantile monthly withdrawals less than 10 percent of NWM forecast streamflow are colored green. The 10 percent streamflow-withdrawal threshold was selected as a “presumptive standard” from the literature of ecological-flow science, which suggests that in the absence of more detailed analysis, a utilization rate of no more than 10 percent of streamflow offers high ecological protection for aquatic habitats (Richter and others, 2012). Counties or watersheds with more than one PWS intake are represented by the PWS intake with the greatest estimated withdrawal to streamflow ratio. Information for all PWS in the web tool is also summarized in a downloadable data table, organized from the PWS with the greatest estimated-withdrawal to forecast-streamflow ratio to the least.
Withdrawal-rate data and ancillary information for PWS used by the web tool are available from Kearns and Faunce (2023). The near real-time PWS drought-awareness web tool is available at https://rconnect.usgs.gov/wv-surface-withdrawals/.
Discussion of Drought-Vulnerability Assessment
The drought-vulnerability assessment (the ratio of 75th quantile PWS withdrawals to 1Q10 streamflow statistic) suggests that 33 of the 71 PWS (46 percent) have 75th quantile withdrawal rates greater than 100 percent of available low-flow streamflow (table 1). Twelve of these 33 PWS have a 1Q10 of zero, indicating that they may not have any available streamflow during low-flow events that approach or exceed the 1Q10. Forty-one of the 71 PWS (58 percent) have 75th quantile withdrawal rates that exceed the 25 percent threshold of 1Q10 streamflow in WVDEM IS-6 that may trigger additional considerations for water conservation.
Six of 71 PWS have 75th quantile withdrawal to 1Q10 streamflow ratios between 10 and 25 percent. While this range does not exceed the water-conservation threshold from WVDEM (25 percent), it is above the 10 percent presumptive standard for ecological protection of streamflow, suggesting potential impairment of aquatic habitat during drought (Richter and others, 2012). Additionally, 13 PWS with 75th quantile withdrawal rates exceeding 10 percent of 1Q10 streamflow are without any on-stream water storage, suggesting limited options for the PWS to mitigate the social or ecological impact of a severe drought.
Seasonal variability in both 75th quantile withdrawals and 1Q10 low-flow statistics suggests that the highest 75th quantile withdrawal to 1Q10 streamflow ratios—and the greatest drought risk—occurs in summer (July to September) and continues to a slightly lesser extent into the fall (October to December; appendix 1). The primary driver of increased seasonal risk is the sharp decline in the 1Q10 streamflow statistic during the summer and fall months.
Limitations of Drought-Vulnerability Assessment
The withdrawal rates and 1Q10 streamflow statistics used in this drought-vulnerability assessment are estimates created from statistical analysis of available data. The ratios derived from these statistics represent a hypothetical condition. The 75th quantile of all reported monthly withdrawals was used to represent a moderately-high water demand scenario that could be expected during drought-like conditions while avoiding outliers resulting from system leaks or other anomalies. A “normal” (median or average) withdrawal rate would likely be lower than the 75th quantile value and may have resulted in an underestimate of drought vulnerability.
The 1Q10 low-flow statistic was selected as the best representation of a severe drought. It is the smallest magnitude low-flow statistic with available estimates and equations; however, historical data suggest that streamflow during extreme droughts may be well below the 1Q10 and therefore underestimated by the drought-vulnerability assessment. For example, the 1Q10 at a USGS streamgage on the Tygart Valley River (USGS site 03054500) is 9.37 ft3/s and the minimum flow on record is 4.90 ft3/s on October 10, 1953 (Wiley, 2006). As another example, the Big Coal River at Ashford, West Virginia (USGS Site 03198500) with a 1Q10 of 4.76 ft3/s recorded zero flow for over a week in late September 1930 (Wiley, 2006). Tree ring studies in the Potomac River watershed, which includes eastern West Virginia, contain evidence of droughts more severe than anything in the period of record for streamgage instrumentation (Maxwell and others, 2011).
Thirty-eight of the 109 PWS withdrawal intakes are below actively managed dams where regulated streamflow does not follow natural patterns. Such conditions did not meet the basic assumption of the available low-flow estimation methods, so these PWS were excluded from the drought-vulnerability assessment. However, many stream control and storage structures on smaller rivers and streams without reported flow regulation were noted while reviewing databases, geospatial information, and satellite and aerial imagery for the remaining 71 PWS. These structures may provide low-flow augmentation for PWS. As used in this report, a “reservoir” includes a documented impoundment, and a “weir” suggests a smaller in-stream “run-of-river” control structure. Twenty-five reservoirs and 15 weirs were noted. These structures are noted with the drought-vulnerability assessment to provide additional context for high withdrawal rates, which could be sustained during low-flow scenarios given enough water storage. Table 1 includes the normal water storage for reservoirs (in acre-feet) from the National Inventory of Dams (U.S. Army Corps of Engineers, 2023). Estimating the amount of water storage for other in-stream structures is beyond the scope of this assessment.
Limitations of Near Real-Time Drought-Awareness Web Tool
The greatest limitation of the web tool is the relatively static nature of the estimated PWS withdrawal rate (75th quantile of historical monthly withdrawal rates) in comparison to the hourly updates of the NWM short-range streamflow forecast. Monthly PWS withdrawal volumes are the best available information under current regulatory and reporting requirements. Monthly PWS withdrawal volumes were converted to monthly PWS withdrawal rates assuming a constant operating schedule (24 hours a day, 7 days a week) and the lowest possible withdrawal rate to meet the reported withdrawal volume. A PWS withdrawing the same volume of water over a shorter period (for example, an 8- or 12-hour workday) could drastically increase the actual withdrawal rate over the estimated rate used in the web tool. Additionally, on-stream water storage at some PWS intake sites can skew the forecast streamflow and (or) sustain high estimated withdrawal to forecast streamflow ratios.
By incorporating the NWM short-range streamflow forecasts, the web tool also contains any assumptions, limitations, uncertainty, or errors present in the NWM and the datasets and models (such as WRF-Hydro) the NWM is built upon. At the time of this report’s publication, the NWM continues updates and versioning. The National Oceanic and Atmospheric Administration’s Office of Weather Prediction considers the current NWM “experimental” and not an official river level forecast. The authors acknowledge these limitations and recognize the difficulty of modeling and forecasting streamflow without continuous, real-time monitoring on every stream reach. The NWM, however, represents the best available near real-time estimates of ungaged streams at state-wide scale. While the NWM offers multiple streamflow forecasting capabilities, State-agency cooperators determined that “current conditions” were sufficient to meet their needs (B. Carr, West Virginia Department of Health and Human Resources, and D. Newell, West Virginia Department of Environmental Protection, written commun., 2023). Uncertainties in NWM streamflow forecasts greatly increase as the forecast range increases, with the short-range forecast having the least uncertainty. Therefore, the short-range NWM streamflow forecasts were used for the web tool.
The intent of the drought-vulnerability assessment, the near real-time PWS drought-awareness web tool, and this report is to increase understanding and awareness of drought risk for PWS in West Virginia. These products are intended to support planning and decision-making of water operators and government agencies in accordance with drought-response guidelines from WVDEM IS-6. The estimates and assumptions inherent in this approach are best used as a screening tool and would require in situ measurements and verification of withdrawal rates, water-supply storage, and streamflow for greatest accuracy. Users of the web tool should compare forecast conditions to actual conditions prior to taking any other action.
Summary
Surface-water withdrawals account for the majority (approximately 80 percent) of West Virginia’s public water supply. Historic climate data and future climate modeling suggest localized and (or) seasonal droughts will continue to threaten water availability in the state, particularly in rural communities located in the headwaters of unregulated watersheds. Members of West Virginia’s interagency drought task force lack key information about the potential impact of drought on public-water supplies to sufficiently prepare for and manage drought situations.
To assist water managers, a drought-vulnerability assessment was developed and conducted. Monthly water-withdrawal data obtained from the West Virginia Department of Environmental Protection’s Large Quantity User program’s regulatory database were used to calculate all-time, seasonal, and monthly 75th quantile withdrawal rates for 109 public water system (PWS) intakes withdrawing from surface waters in West Virginia. The drought-vulnerability assessment compares the all-time 75th quantile withdrawal rate to the 1-day, 10-year (1Q10) low-flow streamflow statistic calculated from U.S. Geological Survey tools and reports (U.S. Geological Survey, 2022; Wiley, 2008) for 71 of the 109 PWS with valid streamflow statistics (not below dams with regulated flow).
The drought-vulnerability assessment found 33 of 71 PWS with 75th quantile withdrawal rates greater than 100 percent of 1Q10 streamflow. Forty-one of 71 PWS have 75th quantile withdrawal rates more than 25 percent of 1Q10 streamflow, exceeding the State’s drought-response threshold for water conservation. Forty-five of 71 PWS (63 percent) have 75th quantile withdrawals rates greater than 10 percent of 1Q10 streamflow, suggesting some level of ecological impairment during severe drought.
To support decision-making for emergency and water managers across West Virginia at the Federal, State, and local level, a near real-time drought-awareness web tool compares monthly 75th quantile withdrawal rates for 109 PWS to hourly streamflow forecasts from the National Water Model (Cosgrove and Gochis, 2018; Cosgrove and Klemmer, undated) and thresholds representing different levels of drought-related impacts from the West Virginia interagency drought plan and ecological-flow literature. Monthly PWS water withdrawal data for 2014–2020 and other ancillary site information used in this report and by the web tool are available from Kearns and Faunce (2023).
References Cited
Bachmair, S., Stahl, K., Collins, K., Hannaford, J., Acreman, M., Svoboda, M., Knutson, C., Helm Smith, K., Wall, N., Fuchs, B., Crossman, N., and Overton, I., 2016, Drought indicators revisited—The need for a wider consideration of environment and society: WIREs. Water, v. 3, p. 516–536, accessed January 26, 2022, at https://doi.org/10.1002/wat2.1154.
Cosgrove, B., and Gochis, D., 2018, The National Water Model: Overview and Future Development: USGS National Hydrography Dataset Newsletter, v. 17, no. 6, accessed January 26, 2022, at https://www.usgs.gov/national-hydrography/nhd-newsletter-archive.
Cosgrove, B., and Klemmer, C., [eds.], [undated], The national water model: Office of Water Prediction web page, accessed January 26, 2022, at https://water.noaa.gov/about/nwm.
Dieter, C.A., Maupin, M.A., Caldwell, R.R., Harris, M.A., Ivahnenko, T.I., Lovelace, J.K., Barber, N.L., and Linsey, K.S., 2018, Estimated use of water in the United States in 2015: U.S. Geological Survey Circular 1441, 65 p. [Also available at https://doi.org/10.3133/cir1441.]
Gochis, D.J., Barlage, M., Dugger, A., Fitzgerald, K., Karsten, L., McAllister, M., McCreight, J., Mills, J., RafieeiNasab, A., Read, L., Sampson, K., Yates, D., Yu, W., 2013, The WRF-Hydro modeling system technical description (ver. 5.0, updated 2018): NCAR Technical Note, 107 p., accessed January 26, 2023, at https://ral.ucar.edu/sites/default/files/public/WRF-HydroV5TechnicalDescription_update512019_0.pdf.
Fernandez, R., and Zegre, N., 2019, Seasonal changes in water and energy balances over the Appalachian Region and beyond throughout the twenty-first century: Journal of Applied Meteorology and Climatology, v. 58, no. 5, p. 1079–1102, accessed January 26, 2022, at https://journals.ametsoc.org/view/journals/apme/58/5/jamc-d-18-0093.1.xml. [Also available at https://doi.org/10.1175/JAMC-D-18-0093.1.]
Justice, J., 2019, State of West Virginia Executive Order on State of Emergency—October 3, 2019: West Virginia web page, accessed January 26, 2022, at https://governor.wv.gov/Documents/2019%20Proclamations/2019-October-Drought-State-of-Emergency-Declaration.pdf.
Kearns, M.R., and Faunce, K.E., 2023, Water withdrawal data of selected public water systems in West Virginia, 2014–2020: U.S. Geological Survey data release, https://doi.org/10.5066/P9GHK4Y0.
Maxwell, R.S., Hessl, A.E., Cook, E.R., and Pederson, N., 2011, A multispecies tree ring reconstruction of Potomac River streamflow (950–2001): Water Resources Research, v. 47, no. 5. [Also available at https://doi.org/10.1029/2010WR010019.]
National Drought Mitigation Center, [2022], U.S. drought monitor: University of Nebraska-Lincoln website, accessed January 26, 2022, at https://droughtmonitor.unl.edu/Data.aspx.
R Core Team, 2020, R—A language and environment for statistical computing, version 4.0.3: R Foundation for Statistical Computing, accessed January 14, 2021, at https://www.R-project.org.
Richter, B.D., Davis, M.M., Aspe, C., and Konrad, C., 2012, A presumptive standard for environmental flow protection: River Research and Applications, v. 28, no. 8, p. 1312–1321. [Also available at https://doi.org/10.1002/rra.1511.]
Steelhammer, R., 2019, Drought threatens drinking water supplies in southern WV counties: Charleston Gazette, September 30, 2019, accessed January 26, 2022, at https://www.wvgazettemail.com/news/drought-threatens-drinking-water-supplies-in-southern-wv-counties/article_4f4db555-73f4-5144-b737-cc9fdc58e40f.html.
Technical Applications and GIS Unit, [undated], 7Q10 flow estimates mapping application: West Virginia Department of Environmental Protection, accessed August 24, 2022, at https://tagis.dep.wv.gov/streamflow/.
U.S. Army Corps of Engineers, 2023, National inventory of dams: U.S. Army Corps of Engineers website, accessed March 6, 2023, at https://nid.sec.usace.army.mil/.
U.S. Geological Survey, 2022, The StreamStats program: U.S. Geological Survey website, accessed December 13, 2022, at https://www.usgs.gov/streamstats.
U.S. Environmental Protection Agency, 2012, National Hydrography Dataset Plus streams—NHDPlus (version 2.1): U.S. Environmental Protection Agency website at https://www.epa.gov/waterdata/nhdplus-national-hydrography-dataset-plus.
West Virginia Department of Environmental Protection, 2022, 2022 Annual water resources report: Joint Legislative Oversight Commission on State Water Resources, prepared by West Virginia Department of Environmental Protection, Division of Water and Waste Management, and Water Use Program, accessed February 22, 2023, at https://dep.wv.gov/WWE/wateruse/Documents/2022%20Annual%20Report.pdf.
West Virginia Division of Emergency Management, 2016, Incident Specific Annex 6—Drought: West Virginia Emergency Operations Plan, accessed January 26, 2022, at http://dhsem.wv.gov/Preparedness/Resources/Documents/WV%20EOP%202016/IS%2006%20-%20Drought%20FINAL%201-6-16.pdf.
West Virginia Legislature, 2023, Article 26—Water Resources Protection Act, chap. 22 article 26 of Environmental Resources: West Virginia Code web page, accessed May 24, 2023, at https://code.wvlegislature.gov/22-26/.
Wiley, J.B., 2006, Low-flow analysis and selected flow statistics representative of 1930–2002 for streamflow-gaging stations in or near West Virginia: U.S. Geological Survey Scientific Investigations Report 2006–5002, 190 p. [Also available at https://doi.org/10.3133/sir20065002.]
Wiley, J.B., 2008, Estimating selected streamflow statistics representative of 1930–2002 in West Virginia: U.S. Geological Survey Scientific Investigations Report 2008–5105, 24 p. [Also available at https://doi.org/10.3133/sir20085105.]
Wiley, J.B., and Atkins, J.T., Jr., 2010, Estimation of selected seasonal streamflow statistics representative of 1930–2002 in West Virginia: U.S. Geological Survey Scientific Investigations Report 2010–5185, 20 p. [Also available at https://doi.org/10.3133/sir20105185.]
Appendix 1. Seasonal Variation in Drought-Vulnerability Assessment of Public Water Systems in West Virginia
Table 1.1.
Seasonal variation in drought-vulnerability assessment of 71 selected West Virginia public water systems.[Seasonal 1-day, 10-year hydrologically based flow (1Q10) in cubic-feet-per-second (ft3/s) computed using methods from Wiley and Atkins (2010). Withdrawal (WD) rate in ft3/s calculated as the 75th quantile of all reported in-season monthly withdrawals 2014–2020 (West Virginia Department of Environmental Protection, 2022). WD/1Q10, withdrawal to 1-day, 10-year hydrologically based flow ratio; *, “divide by zero” error in 75th WD/1Q10 ratio.]
References Cited
West Virginia Department of Environmental Protection, 2022, 2022 Annual water resources report: Joint Legislative Oversight Commission on State Water Resources, prepared by West Virginia Department of Environmental Protection, Division of Water and Waste Management, and Water Use Program, accessed February 22, 2023, at https://dep.wv.gov/WWE/wateruse/Documents/2022%20Annual%20Report.pdf.
Wiley, J.B., and Atkins, J.T., Jr., 2010, Estimation of selected seasonal streamflow statistics representative of 1930–2002 in West Virginia: U.S. Geological Survey Scientific Investigations Report 2010–5185, 20 p. [Also available at https://doi.org/10.3133/sir20105185.]
Conversion Factors
U.S. customary units to International System of Units
International System of Units to U.S. customary units
Abbreviations
1Q10
1-day, 10-year hydrologically based flow
IS-6
Incident Specific Annex 6
LQU
Large Quantity User
NWM
National Water Model
PWS
public water system
USGS
U.S. Geological Survey
WVDEM
West Virginia Division of Emergency Management
WVDEP
West Virginia Department of Environmental Protection
WVDHHR
West Virginia Department of Health and Human Resources
For more information, contact
Director, Virginia and West Virginia Water Science Center
U.S. Geological Survey
1730 East Parham Road
Richmond, VA 23228
Or visit our website at https://www.usgs.gov/centers/virginia-and-west-virginia-water-science-center.
Publishing support provided by the Baltimore Publishing Service Center
Disclaimers
Any use of trade, firm, or product names is for descriptive purposes only and does not imply endorsement by the U.S. Government.
Although this information product, for the most part, is in the public domain, it also may contain copyrighted materials as noted in the text. Permission to reproduce copyrighted items must be secured from the copyright owner.
Suggested Citation
Kearns, M.R., Faunce, K.E., and Messinger, T., 2023, Drought-vulnerability assessment of public water systems in West Virginia: U.S. Geological Survey Open-File Report 2023–1057, 14 p., https://doi.org/10.3133/ofr20231057.
ISSN: 2331-1258 (online)
Study Area
| Publication type | Report |
|---|---|
| Publication Subtype | USGS Numbered Series |
| Title | Drought-vulnerability assessment of public water systems in West Virginia |
| Series title | Open-File Report |
| Series number | 2023-1057 |
| DOI | 10.3133/ofr20231057 |
| Publication Date | August 18, 2023 |
| Year Published | 2023 |
| Language | English |
| Publisher | U.S. Geological Survey |
| Publisher location | Reston, VA |
| Contributing office(s) | Virginia and West Virginia Water Science Center |
| Description | Report: viii, 14 p.; Data Release |
| Country | United States |
| State | West Virginia |
| Online Only (Y/N) | Y |
| Additional Online Files (Y/N) | N |