

Fall Contributions of Phosphorus and Nitrogen in Stormwater Runoff through Weekly Street Cleaning
Links
- Document: Report (1.1 MB pdf) , HTML , XML
- Dataset: USGS National Water Information System database —USGS water data for the Nation
- NGMDB Index Page: National Geologic Map Database Index Page (html)
- Download citation as: RIS | Dublin Core
Acknowledgments
The authors would like to acknowledge Phil Gaebler at the City of Madison for his help identifying suitable monitoring locations and coordination with municipal operations and homeowners. We also would like to acknowledge the more than 30 municipalities in Wisconsin that financially contributed to this project and the League of Wisconsin Municipalities, which organized and championed the effort.
The authors also would like to acknowledge Caitlin Wienkes and Rami Badreddine of the U.S. Geological Survey for their efforts towards assuring high quality data.
Abstract
This report describes a study that characterized reductions in total and dissolved forms of phosphorus and nitrogen in stormwater runoff through implementation of a municipal leaf collection and street cleaning program in two medium-density residential catchments in Madison, Wisconsin. One catchment was established as a control in which no effort was made to remove leaf litter and other organic detritus from streets. The second catchment served as the test catchment in which leaf litter was removed through a combination of biweekly leaf collection and weekly mechanical-broom street cleaning. Loads of total and dissolved phosphorus in the test catchment were reduced by 46 and 51 percent (probability less than 0.20), respectively, and total and dissolved nitrogen by 42 and 52 percent (probability less than 0.20), respectively, with an active leaf collection and street cleaning program compared to no program in the control catchment. Results from this study support an ongoing effort to characterize how various combinations of municipal leaf collection and street cleaning can affect nutrient loads in urban runoff.
Introduction
Like many States around the Nation, Wisconsin is actively engaged in the development of total maximum daily loads for impaired waters under Section §303(d) of the Clean Water Act (U.S. Environmental Protection Agency, 2023). Permitted municipalities in the State are obligated to reduce nutrient contributions from urban areas to receiving waterbodies that have an approved total maximum daily load. To achieve prescribed pollution reduction requirements, municipalities implement a variety of structural and nonstructural practices designed to reduce solids, nutrients, and other contaminants that are typically detected in urban stormwater runoff. Leaf management, through the collection of leaf piles and street cleaning, is one type of nonstructural practice that has recently been determined to effectively reduce the amount of phosphorus and nitrogen entering storm drains in the fall (Hobbie and others, 2014; Selbig, 2016; Janke and others, 2017; Selbig and others, 2020). In response, the Wisconsin Department of Natural Resources has issued phosphorus reduction credits to municipalities who follow leaf management protocols outlined in published guidance documents (Wisconsin Department of Natural Resources, 2020). Although the credits offered by the Wisconsin Department of Natural Resources are based on some of the more commonly used municipal practices in the Midwest, they do not cover the full range of technologies and frequencies available. Because leaf collection and street cleaning are already done by many Wisconsin municipalities, improving our knowledge of the potential reduction of nutrients to stormwater through a broad range of leaf removal and street cleaning options could help tailor more targeted municipal leaf collection programs.
In 2014, the U.S. Geological Survey (USGS) began a series of evaluations to determine if, and by how much, removing leaves and other organic detritus from streets, through various municipal leaf collection and street cleaning programs, could reduce nutrient contributions to stormwater drainage networks. Concentrations and loads of phosphorus and nitrogen in stormwater runoff were measured from paired medium-density residential catchments during the fall. A summary of results representing eight variations of leaf collection and street cleaning technology and frequency were previously reported by Selbig and others (2020). This study supports that effort by addressing another commonly used municipal approach to leaf removal and street cleaning that was not measured by Selbig and others (2020)—biweekly leaf collection using a transfer method coupled with weekly street cleaning using a mechanical-broom street cleaner.
Materials and Methods
This section of the report describes the materials and methods used in this study and the study sites. Methods for sample collection and measurement of nutrient concentrations and street cleaning practices and statistical analyses used in this study also are described. Water-quality concentration and discharge data are available in the USGS National Water Information System (U.S. Geological Survey, 2023).
Site Description
This study characterized concentrations and loads of selected nutrients in stormwater runoff from two residential catchments in Madison, Wisconsin (fig. 1). The catchments were selected to represent typical medium-density residential land use with moderate (greater than 25 percent) overhead tree canopy in the right-of-way. Surface runoff in each catchment was routed to a network of underground storm drainage pipes that flowed into a stormwater treatment pond. Two pipes were located at the terminus of the drainage network in each catchment: (1) a pipe that was 0.9 meter (m) in diameter and a box culvert that was 2.1 m long by 0.9 m wide at the outfall of the test catchment (USGS station 430854089223101) and (2) two pipes that were 0.9 m in diameter at the outfall of the control catchment (USGS station 430855089224701).
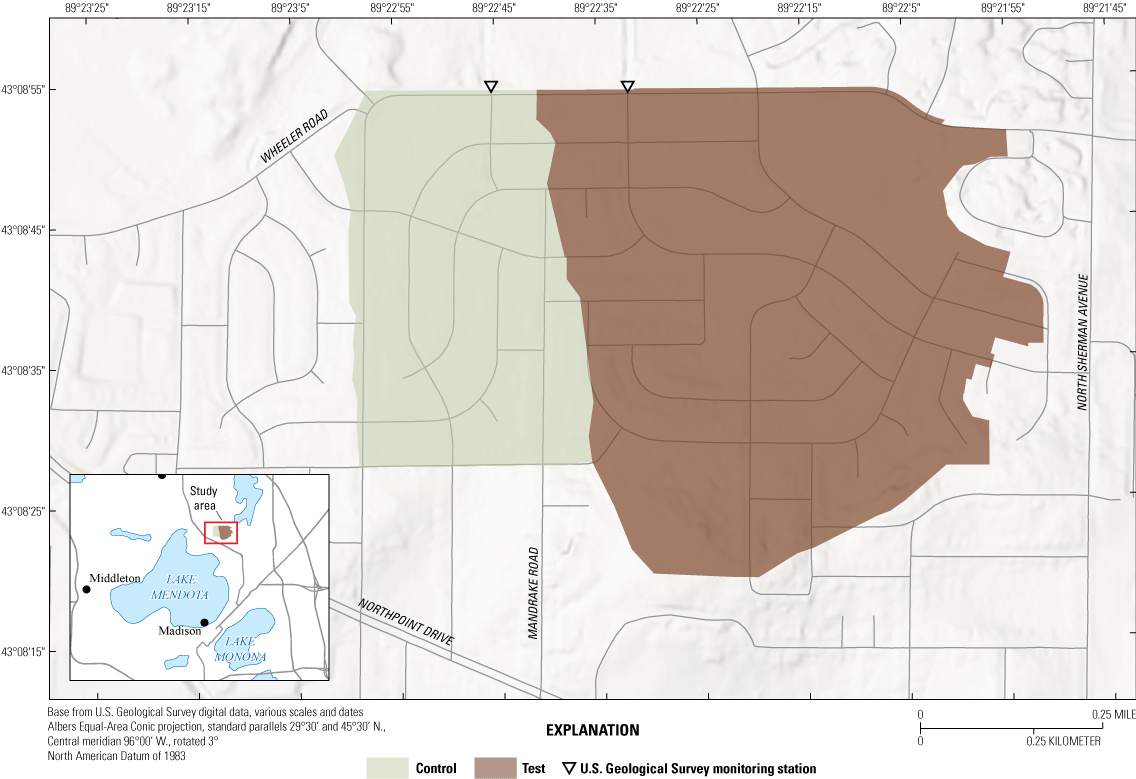
Location of two U.S. Geological Survey monitoring stations used as study catchments in Madison, Wisconsin.
Estimates of overhead street tree canopy were made using a combination of aerial imagery coupled with geographic information system software and field surveys (City of Madison, oral commun., 2023). The percentage of tree canopy covering streets was slightly higher in the control catchment (36 percent) than in the test catchment (30 percent). Trees were generally a mix of mature, deciduous hard and softwood species and most were characterized as Acer platanoides L. (Norway maple), Gleditsia triacanthos L. (honey locust), and Fraxinus pennsylvanica Marsh. (green ash). Because the amount of leachable phosphorus can vary appreciably amongst different tree species (Dorney, 1986; Wang and others, 2020), the range of nutrient concentrations reported herein may not be like other areas with different tree species.
Sample Collection and Measurement of Nutrient Concentrations
A monitoring station was used to measure flow and collect water samples at the storm sewer outfall of the control and test catchments. Storm event loads were computed by multiplying the event mean concentration by stormwater runoff volumes. A detailed description of equipment and methods used to collect a water sample is provided in Selbig and others (2020) and is briefly highlighted herein.
Each monitoring station was equipped with water level and velocity sensors in each pipe that were used to compute discharge. Precipitation data were collected using tipping-bucket rain gages calibrated to 0.25 millimeter (mm). No dry weather flow was detected in either the test or control storm drain network. Automated stormwater-quality samplers collected flow-weighted discrete samples over the duration of an event hydrograph and were later combined into a single composite sample resulting in an event mean concentration. Water-quality samples were typically collected within 24 hours after runoff cessation. Samples were analyzed at the Wisconsin State Laboratory of Hygiene in Madison, Wis., for total phosphorus (TP) and dissolved phosphorus (DP) according to U.S. Environmental Protection Agency (EPA) Method 200.7 (U.S. Environmental Protection Agency, 2001) and total nitrogen (TN) and dissolved nitrogen (DN) according to EPA Method 353.2 (U.S. Environmental Protection Agency, 1993).
Leaf Collection and Street Cleaning Practices
Municipal leaf collection in the State of Wisconsin typically begins in late September to early October each year and continues through November, or until snowfall precludes further collection. Leaf collection vehicles are deployed to collect and remove bulk leaf litter and other organic detritus from residential areas. Residents are asked to pile their leaves adjacent to the street to limit excess debris in the street gutter. After leaf piles are removed, street cleaners pass through the service area to remove leftover organic residue from the street and gutter (Selbig and others, 2020). The form of leaf collection for this study adopted a “transfer” method, which uses a vehicle equipped with a modified bristled plow to rapidly transfer piles of leaves placed near the curb into the street. The leaves are then pushed into a garbage collection vehicle for removal. Leaf piles were collected three times in the fall of each study year in the control and test catchments, approximating a frequency of once every other week.
The frequency and form of street cleaning and leaf collection used in this study were designed to supplement the matrix of municipal practices previously described in Selbig and others (2020; table 1). Although the methods described in table 1 are not inclusive of all municipal leaf collection and street cleaning options, they represent practices that are more commonly used by municipalities throughout the Midwest and Northeast (Selbig and others, 2020). Starting in October 2020, mechanical-broom street cleaners operated at a frequency of once per week in the test catchment, whereas no cleaning was done in the control. During this time, leaf piles placed between the street curb and sidewalk were collected about every other week using the transfer method. This schedule represented the “treatment” phase. Because of the small number of storm events measured in 2020, the treatment phase was repeated in 2021. Starting in October 2022, the method and frequency of leaf pile collection remained the same as in 2020 and 2021; however, no street cleaning was done in either the control or test catchments. This schedule represented the “calibration” phase of the study.
Table 1.
Combination of municipal leaf collection and street cleaning methods and frequencies evaluated for nutrient load reductions in stormwater runoff during the fall.[A naming convention for each paired catchment study treatment follows the format of (1) leaf collection method and frequency (in weeks) and (2) street cleaning method and frequency (in weeks), where T is transfer, M is mechanical broom, R is regenerative air, and V is vacuum mulch. Values in bold represent the leaf collection and street cleaning scenario evaluated in this study. --, not done]
Although leaf litter has been determined to be the primary source of nutrients in runoff during the fall (for example, Selbig, 2016; Janke and others, 2017; Selbig and others, 2020), contributions of phosphorus from leaf piles placed in the street terrace (that is, the pervious area between the street curb and sidewalk) were assumed to be minimal. This assumption was based on evidence reported by Selbig and others (2020), which indicated catchments having a rigorous leaf collection program, but no street cleaning resulted in no change in the amount of phosphorus measured in runoff. It was concluded that the mass of leaf litter and other organic detritus on a street has a much greater effect on phosphorus in runoff than leaves piled adjacent to the street. Therefore, results of the study described herein are more a reflection of the method and frequency of street cleaning than collection of leaf piles.
Statistical Analyses
A paired-catchment design was used to help evaluate the effectiveness of leaf collection based on differences in loads measured in the control and test catchments between calibration and treatment phases of the study. The basis behind the paired-catchment approach is discussed in detail in Selbig and others (2020) and is briefly described herein. The paired-catchment statistical design assumes that a quantifiable relation exists between paired water-quality data and that this relation is valid until a major change (that is, treatment) is made in one of the catchments (Clausen and Spooner, 1993). At that time, a new relation will develop. The strength of this approach is that it does not require the assumption that the control and test catchments are statistically the same; however, it does require that the two catchments respond in a predictable manner together and that their relation remains the same over time except for the effect of leaf collection and street cleaning.
Following procedures outlined in Clausen and Spooner (1993), the significance of the effect of leaf collection and street cleaning was determined using analysis of covariance (ANCOVA). The analysis is a series of steps determining the significance of the treatment regression; the significance of the overall regression, which combines the calibration and treatment phase data; the difference between the slopes of the calibration and treatment regressions; and the difference between the intercepts of the calibration and treatment regressions. A change in intercepts but not slopes between the calibration and treatment phase indicates an overall parallel shift in the regression equation. If the treatment regression shifted below that of the calibration phase, the form of treatment can be considered effective at reducing nutrient loads. Results were reported if they met the 80-percent significance level (probability less than or equal to 0.20). If the results of the ANCOVA test for slope and (or) intercept reveal a significant difference between the calibration and treatment regressions, the regression equation representing the calibration period can be used to predict what the mean runoff event loads should have been in the test catchment during the treatment period. The overall reduction because of leaf collection and street cleaning can then be expressed as a percentage change based on the mean predicted and observed values during the treatment phase (Clausen and Spooner, 1993).
Results of Calibration and Treatment Phase Analyses
Nutrient concentrations and loads in runoff from each catchment were characterized during leaf senescence (October through November) over a period of 2 years beginning in 2020 and ending in 2022. A total of 15 paired samples were collected over the study period with 5 and 10 paired samples representing the calibration and treatment phases, respectively. Complete lists of paired concentrations and loads are provided in tables 2 and 3, respectively.
Table 2.
Nutrient concentrations for paired samples in the control and test catchments during the calibration and treatment phases.[Dates are in month/day/year format. All values are in milligrams per liter]
Table 3.
Nutrient loads for paired samples in the control and test catchments during the calibration and treatment phases.[Dates are in month/day/year format. All values are in grams]
Nutrient Concentrations in Stormwater With and Without Treatment
Mean concentrations of phosphorus during the calibration phase ranged from 1.75 to 2.45 milligrams per liter (mg/L) in the test and control catchments for TP, respectively, and from 1.47 to 2.04 mg/L for DP (table 2). Selbig and others (2020) determined medium-density residential catchments having less than 30-percent street tree canopy generally resulted in mean TP concentrations of less than 1 mg/L in the fall when no leaf collection or street cleaning occurred, whereas catchments having more than 40-percent street tree canopy had mean concentrations of more than twice that value. With street tree canopy in the control and test catchments at less than 40 percent (36 percent in the control and 30 percent in the test), mean concentrations of TP reported in table 2 are generally higher than reported by Selbig and others (2020) for catchments without leaf collection or street cleaning. This difference could be due, in part, to the small number of samples representing the calibration phase (number of samples=5). A larger dataset would reduce the effect of uncertainty in the collected data, resulting in tighter confidence intervals for the regressions. Selbig and others (2020) also asserted that depending on the distribution and abundance of tree species, concentrations of phosphorus in runoff can be elevated even in areas with less street canopy. This finding was supported in laboratory tests by Wang and others (2020) and Dorney (1986), indicating the amount of leachable phosphorus can vary considerably depending on tree species. This phenomenon was observed by Selbig and others (2020) in one study catchment having relatively low street tree canopy cover (21 percent) but a mean TP concentration that was similar to catchments with twice the amount of tree canopy. The difference was attributed to the larger percentage of honey locust, a species that has a higher concentration of leachable phosphorus than other species of trees in the study catchment (Dorney, 1986).
All mean and median concentrations of phosphorus in the test catchment were lower during the treatment phase (table 2). Unexpectedly, concentrations in the control catchment also decreased, although to a lesser degree than in the test catchment (about a 30-percent reduction in the control compared to 40 to 50 percent in the test). It is unclear why concentrations of TP and DP decreased in the control, particularly because no changes were made to street cleaning or leaf collection in both phases of the study. One explanation may again be attributed to the small number of samples representing the calibration phase. The event on October 25, 2022, resulted in phosphorus concentrations that were more than double what was measured for any event during the calibration phase in both catchments (table 2). Leaf litter accumulated for nearly 2 weeks before the October 25 event, longer than any other interevent dry period during the calibration phase. Wang and others (2020) determined phosphorus load in stormwater runoff is highly correlated to the leaf mass on streets before a storm event. Concentrations of phosphorus in runoff were likely elevated because of the large mass of leaf litter that accumulated on streets before the October 25 event. Censoring this event from the dataset would result in mean concentrations of TP and DP in the control catchment to be within 1 and 5 percent, respectively, of those measured during the treatment phase, whereas the test catchment still indicated appreciable reductions of 22 and 30 percent for TP and DP, respectively. However, no reasonable justification exists to censor the October 25 event from table 2.
Mean concentrations of nitrogen during the calibration phase ranged from 2.88 to 3.28 mg/L in the test and control catchments for TN, respectively, and 1.98 to 2.11 mg/L in the test and control catchments for DN, respectively (table 2). In general, a positive correlation between mean concentrations of phosphorus and nitrogen was observed in each catchment; higher amounts of phosphorus also would produce higher amounts of nitrogen (fig. 2). Like phosphorus, mean concentrations of TN and DN were generally within the range of values reported in Selbig and others (2020) for residential catchments but higher overall than those with a similar percentage of street tree canopy. Although leaf litter is recognized as a primary contributor of nitrogen in stormwater, other factors, such as residential fertilizer application, may have elevated concentrations. Hobbie and others (2017) determined household fertilizer resulted in 37 to 59 percent of nitrogen inputs in urban drainage basins in St. Paul, Minnesota (not shown).
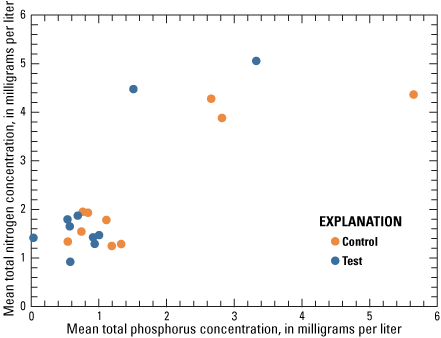
A positive correlation between total phosphorus and total nitrogen was observed in the control and test catchments.
Changes in Nutrient Loads as a Result of Leaf Collection and Street Cleaning
Paired loads from the control and test catchments (table 3) were evaluated to determine if changes in the relation established during the calibration phase of the study can be attributed directly to activities related to leaf collection and street cleaning during the treatment phase. Because the frequency and method of collecting leaf piles did not change between phases, differences in nutrient load reflect the amount of organic material removed from streets by street cleaning. As shown in figure 3, the relations in fall loads of TP, DP, TN, and DN developed between the control and test catchments during the calibration and treatment phase. Differences in these relations were quantified if results of the ANCOVA test for differences in slopes or intercepts exceeded an 80-percent statistical significance (probability less than or equal to 0.20).
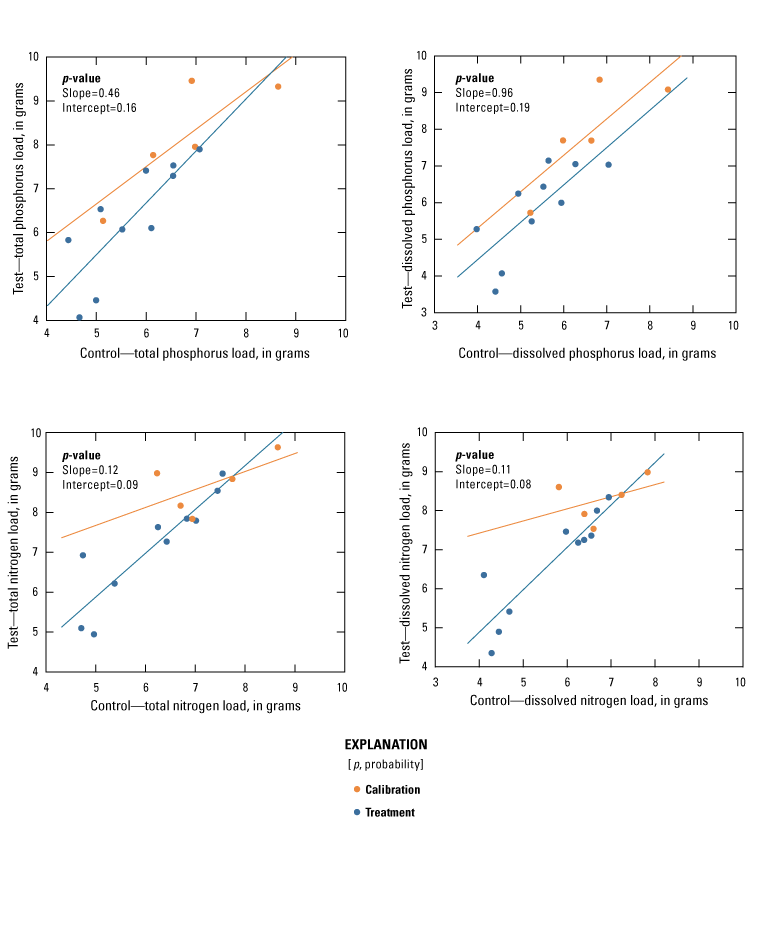
Logarithmically transformed loads of total phosphorus, dissolved phosphorus, total nitrogen, and dissolved nitrogen for paired samples collected in the control and test catchments during the calibration and treatment phases of the study.
Quantification of the overall effect of leaf collection and street cleaning frequency and method of removing leaf litter and other organic detritus is presented as a percentage reduction in nutrient load (table 4). The weekly use of a mechanical-broom street cleaner and biweekly leaf collection using a transfer method were able to reduce fall loads for all measured nutrients in stormwater runoff. Nutrients in the dissolved phase had the greatest reductions at 51 and 52 percent for DP and DN, respectively. This result was expected given that most of the phosphorus and nitrogen are in the dissolved phase (Selbig, 2016; Selbig and others, 2020). Reductions in TP and TN were slightly lower, but still significant, at 46 and 42 percent, respectively. Comparison of slopes indicates a clear difference between phases for TN and DN but not TP and DP (fig. 3). This difference is due to a single paired load during the calibration phase that seems to hold leverage on the resulting trendlines, affecting both slopes and intercepts. This point again corresponds to the October 25, 2022, event. Additional samples representing the calibration phase of the study across the same range of loads measured during the treatment phase would potentially reduce the effect of outliers and improve statistical outcomes.
Table 4.
Results of paired-catchment analysis of covariance test and calculated percentage reduction.[Values in bold are significant at the 80-percent confidence level. p, probability]
Unlike nitrogen, paired loads of TP and DP during the calibration phase were more evenly distributed across the range of values measured during the treatment phase. Although results of the ANCOVA test did not indicate any significant changes in slope between phases, an overall downward vertical shift during the treatment phase resulted in a significant difference in intercept (table 4). Although additional samples during the calibration phase would have reduced variability and improved statistical confidence for TP and DP, the overall conclusion that a mechanical-broom street cleaner is able to reduce nutrient loads in runoff would likely not change.
Comparison to Previous Municipal Leaf Collection and Street Cleaning Programs
Results presented in table 4 represent the last in a series of evaluations on the effectiveness of municipal leaf collection and street cleaning programs (fig. 4). Although the frequency and technology presented in figure 4 are not inclusive of all municipal options, they represent practices that are more commonly used by cities in the Midwest and Northeast. From figure 4, significant reductions in TP and DP loads are not observed until tree canopy approximates 30-percent coverage over streets. The exception is the V2 study treatment, which represents biweekly leaf pile collection only using a vacuum-mulch collection system and no street cleaning. Despite having the highest overhead tree canopy in the series of evaluations presented in figure 4, the lack of street cleaning allowed the accumulation of leaf litter in the street to overcome any reduction in phosphorus that may have resulted from leaf pile collection on the side of the street.
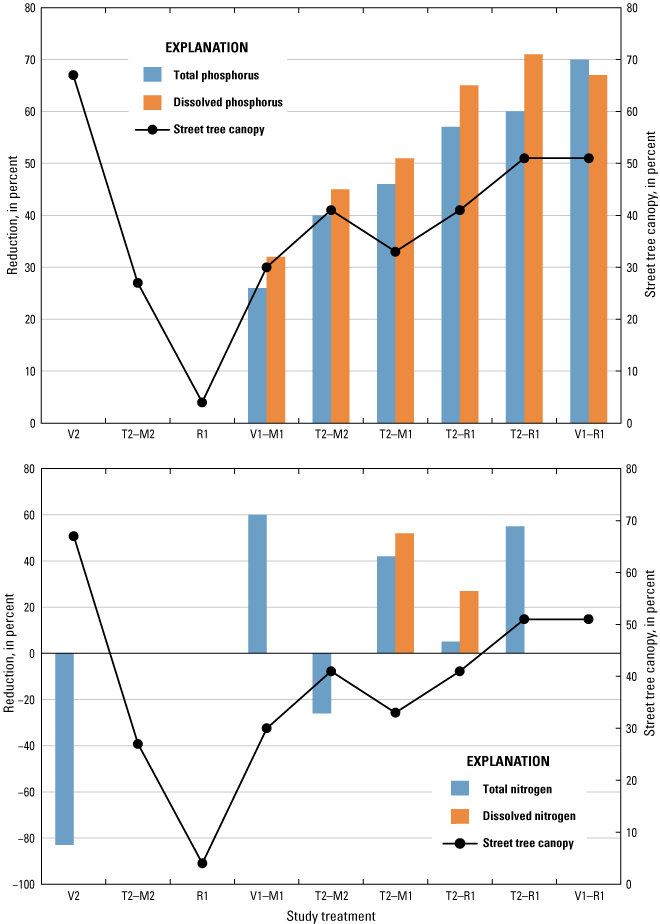
Percentage reduction of event total phosphorus and dissolved phosphorus loads and event total nitrogen and dissolved nitrogen loads after treatment compared against the percentage of streets covered by tree canopy. A negative value indicates an increase in load. [A naming convention for each paired catchment study treatment follows the format of (1) leaf collection method and frequency (in weeks) and (2) street cleaning method and frequency (in weeks), where V is vacuum mulch, T is transfer, M is mechanical broom, and R is regenerative air]
The frequency and method of street cleaning rather than leaf pile collection have more effect on phosphorus load reduction in runoff. Selbig and others (2020) previously determined regenerative-air street cleaners operating at a frequency of once per week (indicated by “R1” in fig. 4) have the greatest percentage of TP and DP reduction regardless of form and frequency of leaf pile collection. The exception was in a study catchment having less than 10-percent street tree canopy, an indication that the mass of leaf litter on streets in this catchment likely was not enough to detect a significant difference in phosphorus load compared to no street cleaning. Selbig and others (2020) also reported mechanical-broom street cleaners, having less capacity to removed solids from street surfaces than regenerative-air cleaners (Selbig and Bannerman, 2007), resulted in lower reductions of TP and DP loads. In that study, catchments using the transfer method for leaf pile removal every other week and a mechanical-broom street cleaner operating once every other week (indicated by “T2–M2” in fig. 4) reduced TP and DP loads by 40 and 45 percent, respectively. Increasing the frequency of street cleaning to once per week (indicated by “T2–M1” in fig. 4), as was tested as part of this study, elevated the percentage reduction of TP and DP loads to 46 and 51 percent, respectively. This result indicates the reduction of phosphorus in stormwater runoff from residential areas with about 30-percent or more overhead street tree canopy is more a function of the cleanliness of the street before a storm event than the removal of leaf piles on the side of the street.
Selbig and others (2020) determined that unlike phosphorus, reductions in nitrogen loads were not as prevalent and, in some cases, increased after treatment (fig. 4). The T2–M1 treatment described as part of this study was only one of two leaf collection and street cleaning combinations that resulted in a reduction of TN and DN, the other being T2–R1. With one exception, catchments undergoing weekly street cleaning, regardless of technology, indicated reductions in TN, DN, or both. When the frequency of street cleaning decreased to every other week, nitrogen load in runoff increased or did not significantly change from a condition with no street cleaning.
Summary
Biweekly leaf collection and weekly street cleaning using a mechanical-broom street cleaner in a medium-density residential catchment resulted in reduced nutrient load in runoff compared to a second catchment undergoing no treatment. The range in percentage reduction of nutrients fell in line with previous evaluations of municipal leaf collection and street cleaning practices based on the type and frequency of street cleaning and the amount of overhead tree canopy. By increasing the frequency of street cleaning from once every other week to once per week, as was tested as part of this study, the percentage reduction of nutrient load increased from 40 to 46 percent for TP and from 45 to 51 percent for DP. This finding indicates the reduction of phosphorus in stormwater runoff from residential areas with about 30-percent or more overhead street tree canopy is largely a function of the cleanliness of the street before a storm event. This information can be used by municipalities to help meet water-quality targets and standards imposed by regulating authorities (for example, total maximum daily loads).
References Cited
Dorney, J.R., 1986, Leachable and total phosphorus in urban street tree leaves: Water, Air, and Soil Pollution, v. 28, no. 3–4, p. 439–443. [Also available at https://doi.org/10.1007/BF00583506.]
Hobbie, S.E., Baker, L.A., Buyarski, C., Nidzgorski, D., and Finlay, J.C., 2014, Decomposition of tree leaf litter on pavement—Implications for urban water quality: Urban Ecosystems, v. 17, no. 2, p. 369–385. [Also available at https://doi.org/10.1007/s11252-013-0329-9.]
Hobbie, S.E., Finlay, J.C., Janke, B.D., Nidzgorski, D.A., Millet, D.B., and Baker, L.A., 2017, Contrasting nitrogen and phosphorus budgets in urban watersheds and implications for managing urban water pollution: Proceedings of the National Academy of Sciences of the United States of America, v. 114, no. 16, p. 4177–4182. [Also available at https://doi.org/10.1073/pnas.1618536114.]
Janke, B.D., Finlay, J.C., and Hobbie, S.E., 2017, Trees and streets as drivers of urban stormwater nutrient pollution: Environmental Science & Technology, v. 51, no. 17, p. 9569–9579. [Also available at https://doi.org/10.1021/acs.est.7b02225.]
Selbig, W.R., 2016, Evaluation of leaf removal as a means to reduce nutrient concentrations and loads in urban stormwater: Science of the Total Environment, v. 571, p. 124–133. [Also available at https://doi.org/10.1016/j.scitotenv.2016.07.003.]
Selbig, W.R., and Bannerman, R.T., 2007, Evaluation of street sweeping as a stormwater-quality-management tool in three residential basins in Madison, Wisconsin: U.S. Geological Survey Scientific Investigations Report 2007–5156, 103 p. [Also available at https://doi.org/10.3133/sir20075156.]
Selbig, W.R., Buer, N.H., Bannerman, R.T., and Gaebler, P., 2020, Reducing leaf litter contributions of phosphorus and nitrogen to urban stormwater through municipal leaf collection and street cleaning practices: U.S. Geological Survey Scientific Investigations Report 2020–5109, 17 p., accessed July 5, 2023, at https://doi.org/10.3133/sir20205109.
U.S. Environmental Protection Agency, 1993, Method 353.2, revision 2.0—Determination of nitrate-nitrite nitrogen by automated colorimetry: Cincinnati, Ohio, U.S. Environmental Protection Agency, 15 p., accessed February 20, 2020, at https://www.epa.gov/sites/production/files/2015-08/documents/method_353-2_1993.pdf.
U.S. Environmental Protection Agency, 2001, Method 200.7, revision 5.0—Trace elements in water, solids, and biosolids by inductively coupled plasma-atomic emission spectrometry: Washington, D.C., U.S. Environmental Protection Agency, EPA–821–R–01–010, [variously paged], accessed March 9, 2023, at https://www.epa.gov/sites/default/files/2015-08/documents/method_200-7_rev_5_2001.pdf.
U.S. Environmental Protection Agency, 2023, Clean Water Act Section 303(d)—Impaired waters and total maximum daily loads (TMDLs): U.S. Environmental Protection Agency web page, accessed July 5, 2023, at https://water.epa.gov/lawsregs/lawsguidance/cwa/tmdl.
U.S. Geological Survey, 2023, USGS water data for the Nation: U.S. Geological Survey National Water Information System database, accessed August 20, 2023, at https://doi.org/10.5066/F7P55KJN.
Wang, Y., Thompson, A.M., and Selbig, W.R., 2020, Leachable phosphorus from senesced green ash and Norway maple leaves in urban watersheds: Science of the Total Environment, v. 743, no. 4, 10 p., accessed July 5, 2023, at https://doi.org/10.1016/j.scitotenv.2020.140662.
Wisconsin Department of Natural Resources, 2020, Bureau of watershed management program guidance—Interim municipal phosphorus reduction credit for leaf management programs: Wisconsin Department of Natural Resources, 9 p., accessed March 9, 2023, at https://dnr.wisconsin.gov/sites/default/files/topic/Stormwater/draft/PN_Draft_Revised_Leaf_Management_Credit_07-22-2020.pdf.
Supplemental Information
Concentrations of chemical constituents in water are given in milligrams per liter (mg/L).
For more information about this publication, contact:
Director, USGS Upper Midwest Water Science Center
1 Gifford Pinchot Drive
Madison, WI 53726
608–828–9901
For additional information, visit: https://www.usgs.gov/centers/umid-water
Publishing support provided by the
Rolla Publishing Service Center
Disclaimers
Any use of trade, firm, or product names is for descriptive purposes only and does not imply endorsement by the U.S. Government.
Although this information product, for the most part, is in the public domain, it also may contain copyrighted materials as noted in the text. Permission to reproduce copyrighted items must be secured from the copyright owner.
Suggested Citation
Selbig, W.R., and Stenehjem, K.J., 2023, Fall contributions of phosphorus and nitrogen in stormwater runoff through weekly street cleaning: U.S. Geological Survey Open-File Report 2023–1061, 11 p., https://doi.org/10.3133/ofr20231061.
ISSN: 2331-1258 (online)
Study Area
| Publication type | Report |
|---|---|
| Publication Subtype | USGS Numbered Series |
| Title | Fall contributions of phosphorus and nitrogen in stormwater runoff through weekly street cleaning |
| Series title | Open-File Report |
| Series number | 2023-1061 |
| DOI | 10.3133/ofr20231061 |
| Publication Date | August 15, 2023 |
| Year Published | 2023 |
| Language | English |
| Publisher | U.S. Geological Survey |
| Publisher location | Reston, VA |
| Contributing office(s) | Upper Midwest Water Science Center |
| Description | Report: vi, 11 p.; Dataset |
| Country | United States |
| State | Wisconsin |
| County | Dane County |
| City | Madison |
| Online Only (Y/N) | Y |