

Monitoring Nesting Waterbirds for the South Bay Salt Pond Restoration Project: 2022 Breeding Season
Links
- Document: Report (9 MB pdf) , HTML , XML
- Download citation as: RIS | Dublin Core
Acknowledgments
Funding for this study was provided by a grant from the California State Coastal Conservancy to the California Wildlife Foundation. We thank Nadya Dooley, Amy Parsons, Breanne Cooney, and Brady Fettig of the U.S. Geological Survey for assistance in the field and data entry. We thank the U.S. Fish and Wildlife Service’s Don Edwards San Francisco Bay National Wildlife Refuge, the California Department of Fish and Wildlife’s Eden Landing Ecological Reserve, and the South Bay Salt Pond Restoration Project for logistical and project support. Digital data tables in this report are available upon request.
Abstract
The San Francisco Bay supports thousands of breeding waterbirds annually and hosts large populations of American avocets (Recurvirostra americana), black-necked stilts (Himantopus mexicanus), and Forster’s terns (Sterna forsteri). These three species have relied largely on former commercial salt ponds in South San Francisco Bay, which provide wetland foraging habitat and island nesting habitat. The South Bay Salt Pond Restoration Project is in the process of restoring 50–90 percent of 15,100 acres of these former salt ponds to tidal marsh and tidal mudflats. Although this restoration is expected to have numerous benefits, including providing habitat for tidal wetland-dependent species, improving water quality, buffering against storm surge, and protecting inland areas from sea level rise, the reduction in former salt pond habitat and nesting islands may negatively affect breeding waterbirds. To address the reduction in former salt pond habitat available to waterbirds, the South Bay Salt Pond Restoration Project also includes enhancements to remaining pond habitat, such as the construction of new islands for nesting. Moreover, the South Bay Salt Pond Restoration Project follows an adaptive management plan in which waterbird response to the changing landscape is monitored over time to ensure that existing breeding waterbird populations are maintained. In this report, we provide results of waterbird nest monitoring in South San Francisco Bay during the 2022 breeding season and present these results in the context of annual nest monitoring in South San Francisco Bay since 2005. Overall, nest abundance in 2022 remained at or near 18-year lows for American avocets (176 nests) and black-necked stilts (97 nests), but Forster’s tern nest abundance (1,727 nests) was at an 18-year high, reversing historically low abundance observed during 2015–2017. In 2022, there were only 6 American avocet, 4 black-necked stilt, and 4 Forster’s tern major colony nesting sites, which is down from annual averages of 12.4, 6.6, and 6.6 observed during 2005–2009. Nest success (30 percent for American avocets, 29 percent for black-necked stilt, and 53 percent for Forster’s terns) was below the 2005–2007 baseline values established for the South Bay Salt Pond Restoration Project. Average egg-hatching success (98 percent, 100 percent, and 90 percent), and clutch sizes (3.68, 3.70, and 2.63 eggs) of American avocets, black-necked stilts, and Forster’s terns, respectively, were similar to values observed during 2005–2010. All three species displayed notable shifts in nest initiation dates in 2022, with American avocets and Forster’s terns nesting 10–11 days earlier and black-necked stilts nesting 10 days later than during 2005–2010. Finally, the enhanced, managed ponds with newly constructed islands (Ponds A16 and SF2) supported 86 percent of all the Forster’s tern nests recorded in South San Francisco Bay in 2022, which is the first time these managed ponds have hosted such a substantial number of tern nests.
Introduction
The San Francisco Bay is a designated site of hemispheric importance to shorebirds and supports more than 1 million waterbirds annually (Page and others, 1999; Stenzel and others, 2002; Takekawa and others, 2011, 2012). Long recognized for its importance to migrating and wintering waterbirds, the San Francisco Bay also supports thousands of breeding waterbirds every year. In particular, managed pond habitat in South San Francisco Bay has supported the largest breeding populations of American avocets (Recurvirostra americana) and black-necked stilts (Himantopus mexicanus), and nearly 30 percent of the breeding population of Forster’s terns (Sterna forsteri) along the Pacific coast (Stenzel and others, 2002; Rintoul and others, 2003; Strong and others, 2004; McNicholl and others, 2020). These three species have some of the largest populations among the colonial nesting waterbirds in the San Francisco Bay and greatly depend on managed ponds for nesting habitat, with more than 70 percent of American avocet and more than 90 percent of Forster’s tern nests on islands in managed pond habitats (Strong and others, 2004; Ackerman and Herzog, 2012; Ackerman and others, 2014a, 2020; Hartman and others, 2016a, b).
The South Bay Salt Pond Restoration Project (https://www.southbayrestoration.org/), which is working to restore 50–90 percent of 15,100 acres of managed ponds to tidal marsh habitats (Goals Project, 1999), is in Phase 2 of the effort. In Phase 1 (2003–2018), about 3,000 acres of managed ponds were converted to tidal influence to begin the process of tidal restoration. These Phase 1 changes included Ponds A7 and A8, where islands that had supported large waterbird nesting colonies (Strong and others, 2004; Ackerman and Herzog, 2012) have become inundated and are no longer available for nesting. Other previously important nesting sites, which no longer support nesting, at Ponds A1 and A2W also will be converted to tidal marsh as part of Phase 2 implementation, but new nesting island construction is planned. In addition, habitat enhancements for birds, in the form of nesting island construction also have been carried out at Ravenswood Pond SF2 (30 islands built in 2010), Alviso Pond A16 (16 islands built in 2013), and Ponds E12 and E13 at the Eden Landing Ecological Reserve (6 islands built in 2015), and new nesting islands are planned at Ponds A1 and A2W. Because breeding waterbirds are dependent on nesting islands in managed ponds, evaluating how nesting populations are responding to habitat changes associated with the South Bay Salt Pond Restoration Project (loss of historic nesting habitat due to levee breaches and gain of potential nesting habitat from newly constructed islands) is critical to the adaptive management plan.
The U.S. Geological Survey (USGS) monitored nesting waterbird populations in the South Bay Salt Pond Restoration Project area from 2005 to 2019, including nesting sites at the U.S. Fish and Wildlife Service’s Don Edwards San Francisco Bay National Wildlife Refuge and the California Department of Fish and Wildlife’s Eden Landing Ecological Reserve. The USGS’s comprehensive dataset includes more than 22,000 nests of Forster’s terns, American avocets, and black-necked stilts at more than 80 wetland sites in the South Bay Salt Pond Restoration Project area (fig. 1; tables 1–3) and additional nesting data for black skimmers (Rynchops niger) and Caspian terns (Hydroprogne caspia). This comprehensive dataset (Ackerman and Herzog, 2012) has proven useful to management in the following ways: (1) the creation of a recipe for building nesting islands for implementation of future phases of the South Bay Salt Pond Restoration Project (Ackerman and others, 2014a; Hartman and others, 2016a, b); (2) identifying gull predation as the primary factor affecting chick survival and a contributing factor to egg survival (Herring and others, 2011; Ackerman and others, 2014b, c; Takekawa and others, 2015); (3) informing management of ponds and the Pond A8 Notch (Ackerman and others, 2010, 2012, 2013a; J.T. Ackerman, U.S. Geological Survey, unpub. data, 2014d, 2015, 2016b, 2017); (4) evaluating bird use of managed habitats (Ackerman and others, 2007, 2008a, 2009); and (5) understanding mercury contamination and ecotoxicological risk to birds in ponds of the South Bay Salt Pond Restoration Project (Ackerman and others, 2008b, 2013b, 2014e, f, 2016a; Ackerman and Eagles-Smith, 2009). Importantly, this USGS nest monitoring dataset has indicated that the number of nests and nesting colonies in the South Bay Salt Pond Restoration Project area have declined for Forster’s terns, American avocets, and black-necked stilts between 2005 and 2019 (Hartman and others, 2021; fig. 2). In collaboration with the California State Coastal Conservancy, California Wildlife Foundation, the U.S. Fish and Wildlife Service’s Don Edwards San Francisco Bay National Wildlife Refuge, the California Department of Fish and Wildlife’s Eden Landing Ecological Reserve, and the South Bay Salt Pond Restoration Project, we provide a summary of nesting ecology data for Forster’s terns, American avocets, and black-necked stilts in areas of the South Bay Salt Pond Restoration Project for the 2022 breeding season. Moreover, we compare current (2022) nest abundance, distribution, and reproductive success to historical data collected during 2005–2019. These results provide the most recent assessment of the breeding waterbird populations and nesting population trends in South San Francisco Bay.
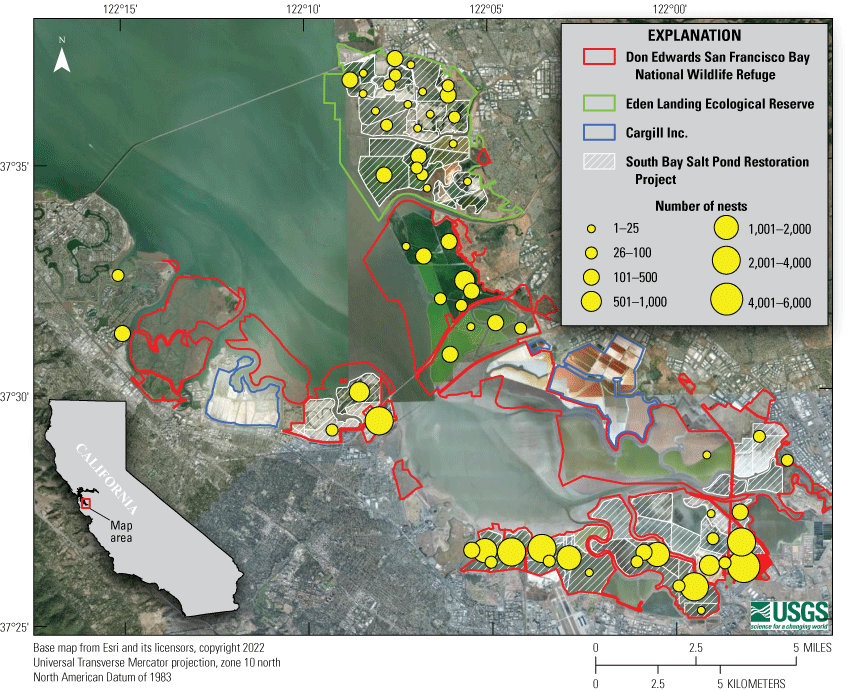
Distribution and total abundance of American avocet, black-necked stilt, and Forster’s tern nests in South San Francisco Bay during 2005–2019 and 2022.
Table 1.
American avocet nests monitored by complex, site, and year in South San Francisco Bay during 2005–2019 and 2022.[For site-years with (0) nests, we are fairly confident no nests occurred at that site in that year. For site-years with (—) nests, we are confident there were not large numbers of nests at that site in that year; however, it is possible that a few nests may have been active briefly and missed by investigators because limited staff necessitated not monitoring all potential nesting sites each year. Major colonies were defined as those containing greater than or equal to the median number of American avocet nests among all sites in all years (greater than or equal to 12 nests) during 2015–2019. Abbreviation: NA, not applicable]
Table 2.
Black-necked stilt nests monitored by complex, site, and year in South San Francisco Bay during 2005–2019 and 2022.[For site-years with (0) nests, we are fairly confident no nests occurred at that site in that year. For site-years with (—) nests, we are confident there were not large numbers of nests at that site in that year; however, it is possible that a few nests may have been active briefly and missed by investigators because limited staff necessitated not monitoring all potential nesting sites each year. Major colonies were defined as those containing greater than or equal to the median number of black-necked stilt nests among all sites in all years (greater than or equal to 6 nests) during 2015–2019. Abbreviation: NA, not applicable]
Table 3.
Forster’s tern nests monitored by complex, site, and year in South San Francisco Bay during 2005–2019 and 2022.[For site-years with (0) nests, we are fairly confident no nests occurred at that site in that year. For site-years with (—) nests, we are confident there were not large numbers of nests at that site in that year; however, it is possible that a few nests may have been active briefly and missed by investigators because limited staff necessitated not monitoring all potential nesting sites each year. Major colonies were defined as those containing greater than or equal to the median number of Forster’s tern nests among all sites in all years (greater than or equal to 40 nests) during 2015–2019. Abbreviation: NA, not applicable]
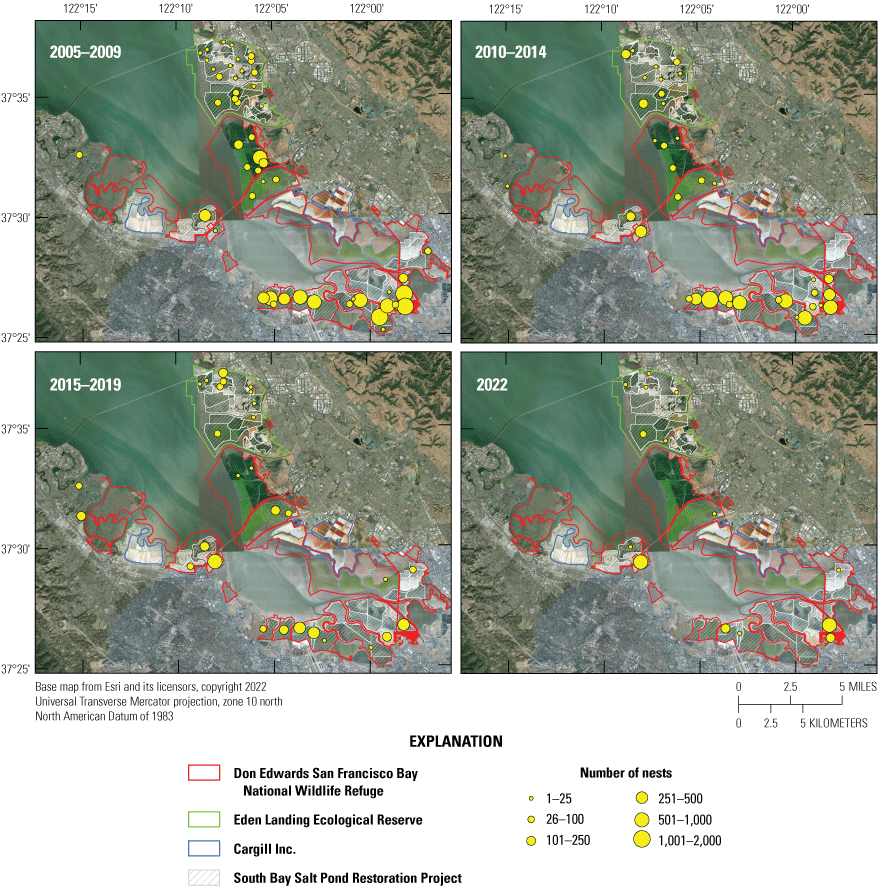
Distribution and abundance of American avocet, black-necked stilt, and Forster’s tern nests in South San Francisco Bay during four periods: (1) 2005–2009 (n=10,759 nests), (2) 2010–2014 (n=8,156 nests), (3) 2015–2019 (n=6,564 nests), and (4) 2022 (n=2,000 nests).
Methods
Nest Abundance and Distribution
From April to September 2022, we surveyed wetland habitats in South San Francisco Bay for waterbird nesting activity. This survey included areas on the Don Edwards San Francisco Bay National Wildlife Refuge, the Eden Landing Ecological Reserve, and nearby sites. Sites with high nesting activity in previous years, as well as sites with newly constructed islands, were prioritized for weekly monitoring. However, we visited many other wetlands at the peak of nesting to try and find additional colonies and to count any additional nests at sites with lower nesting activity. We accessed nesting colonies weekly, located and marked all new nests, floated eggs to determine stage of embryo development and estimate nest initiation date (Ackerman and Eagles-Smith, 2010), and revisited previously discovered nests to monitor progression and determine nest fate. We also assessed habitat and vegetation at the nest site. At each nest, we visually estimated the amount of ground within a 1-square meter (m2) area centered on the nest bowl that was covered by vegetation (percent cover) and measured the average height of vegetation within the 1-m2 area.
Nest abundance was defined as the cumulative total number of nests initiated throughout the entire breeding season and was estimated separately for Forster’s terns, American avocets, and black-necked stilts by summing the total number of unique nests discovered at each site from our weekly nest monitoring efforts. However, at Ponds A16, SF2, and New Chicago Marsh, the number of nests at the peak of the nesting season were too numerous for us to monitor each individual nest during each weekly visit. Therefore, we performed additional counts for nests at these sites, either by physically accessing the nesting islands or from a nearby vantage point (adjacent island or levee) using binoculars and spotting scopes. We then used the high, or peak, count of nests at these two sites in combination with direct nest monitoring data to estimate nest abundance throughout the breeding season. However, all demographic variables (nest survival, egg hatching success, clutch size, and nest initiation dates) were accurately estimated using the weekly nest monitoring data for a smaller subset of nests at each site.
Nest Success and Egg Hatching Success
A successful nest was defined as a nest where at least one egg hatched (Klett and Johnson, 1982). Nest daily survival rate, or the probability that a nest survived 1 day, was estimated separately for each species by performing a logistic exposure model (Shaffer, 2004). In this model, daily survival rate varied by nest age. Once daily nest survival rates by nest age were estimated, nest success was calculated as the product of the individual daily survival rates from the laying of the first egg (nest age=1 day) through hatching (nest age=27 days) for American avocets and black-necked stilts [5 days of egg laying and 22 days of incubation] and nest age=28 days for Forster’s terns [4 days of egg laying and 24 days of incubation]; Ackerman and others, 2020; McNicholl and others, 2020; Robinson and others, 2020). Unlike apparent nest success, in which nest success is calculated by dividing the number of nests that hatch by the number of nests observed, the logistic exposure method accounts for nests that fail before they can be discovered, thereby providing a much more accurate assessment of nest success (Mayfield, 1961; Shaffer, 2004).
Egg-hatching success was defined as the proportion of eggs from successful nests that hatched and produced a chick. We calculated egg-hatching success for each successful nest by dividing the number of hatched eggs by the full clutch size and then averaging all nests by species. Our egg-hatching success estimates only included nests that we confirmed to have hatched, contained a known full clutch size, and the fate of each egg was known.
Nest Initiation Date
Nest initiation date is the date that the first egg was laid in the nest. For nests found during the incubation stage after clutch completion, we floated eggs (Ackerman and Eagles-Smith, 2010) to determine incubation stage (which is the number of days since clutch completion) and then subtracted the average egg-laying period of 5 days for avocets and stilts and 4 days for Forster’s terns (Ackerman and others, 2020; McNicholl and others, 2020; Robinson and others, 2020) to estimate nest initiation date. For nests found during egg-laying, we subtracted the number of eggs in the nest from the date of discovery to estimate the nest initiation date. We present the median and 80-percent central span (the range of dates in which the central 80 percent of individuals nests were initiated) of nest initiation dates.
Because of the large number of Forster’s tern nests at Ponds A16 and SF2, we were unable to monitor all nests and float eggs to determine the nest initiation date. Therefore, during site visits, we counted the number of nests at Ponds A16 and SF2 and used counts during these visits to estimate the number of new nests initiated since the prior visit. We then set the nest initiation date of these new nests as 3 days before the current visit (when new nests were first observed). This process allowed us to adjust our nest initiation date estimates to account for nests for which we were unable to float individual eggs.
Clutch Size
Clutch size for each nest was defined as the number of eggs in the nest after egg-laying was completed. We estimated average clutch size for each species and only used nests that we were confident that the final clutch size had been observed. Thus, nests that failed during egg-laying or were found later in incubation (after 8 days) when there is more opportunity for partial clutch depredation to occur (Ackerman and others, 2003) were excluded from estimates of clutch size.
Results and Discussion
Nest Abundance and Distribution
During the 2022 breeding season, we observed a total of 176 American avocet nests, 97 black-necked stilt nests, and 1,727 Forster’s tern nests among wetland nesting sites in South San Francisco Bay (tables 1–3, figs. 3, 4). Compared to 2019, the last year waterbird nest monitoring was done, the nest totals in 2022 represent a 54-percent decrease in abundance for American avocet nests (386 nests in 2019), a 10-percent increase in abundance for black-necked stilt nests (88 nests in 2019), and a 186-percent increase in abundance for Forster’s tern nests (604 nests in 2019; fig. 3). Forster’s tern nests were on constructed islands (61 percent of nests), exposed mudflat islands (32 percent of nests, mostly at Pond A16), or marsh habitat (7 percent). American avocet nests were on constructed islands (65 percent of nests), levees and peninsulas (15 percent), marsh habitat (12 percent), or exposed mudflat islands (7 percent). In contrast, only 11 percent of black-necked stilt nests were on islands (7 percent on constructed islands, 4 percent on exposed mudflat islands), 9 percent were on levees and peninsulas, and 80 percent were in marsh habitat, particularly within New Chicago Marsh. We did not monitor or had to stop monitoring mid-season in areas closed for nesting western snowy plovers (Charadrius nivosus nivosus) or California least tern (Sternula antillarum browni), including Ponds E12 and E13 at the Eden Landing Ecological Reserve and Pond NPP1 in the Newark Complex of the Don Edwards San Francisco Bay National Wildlife Refuge. Additionally, Ravenswood Ponds R3 and R5 were closed because of levee restrictions and construction activities associated with the South Bay Salt Pond Restoration Project; and therefore, were not monitored.
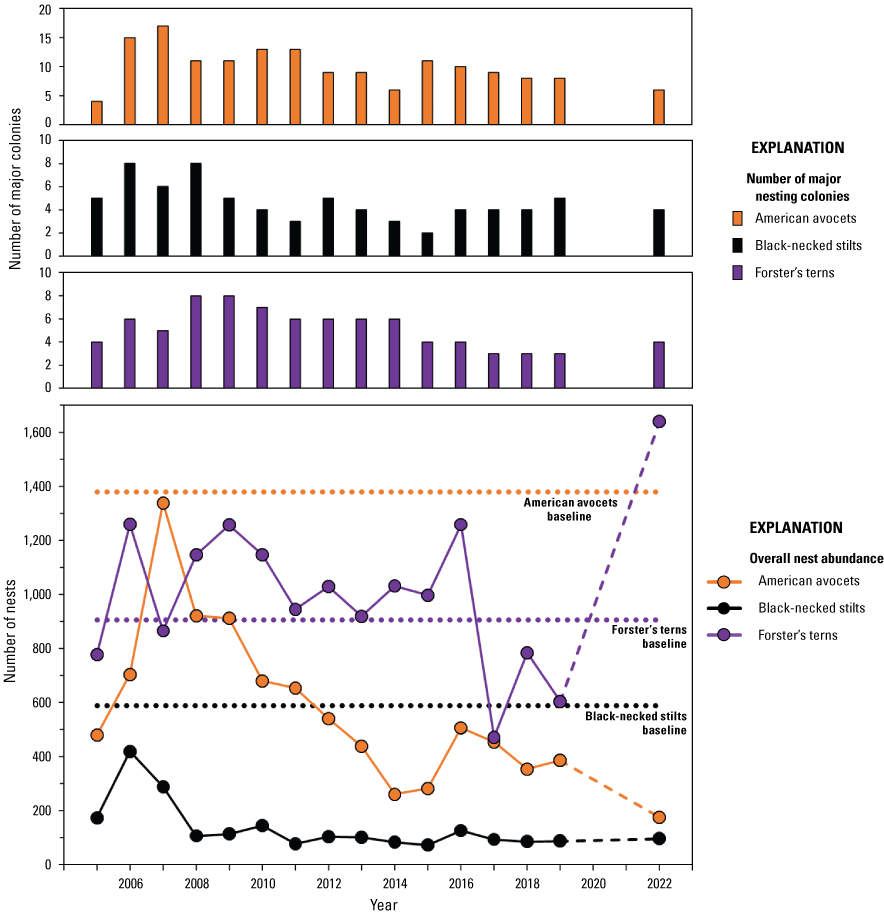
The number of major nesting colonies (top three panels) and overall nest abundance (bottom panel) of American avocets (orange bars, solid orange line), black-necked stilts (black bars, solid black line), and Forster’s terns (purple bars, solid purple line) in south San Francisco Bay during 2005–2019 and 2022. Nest monitoring was not completed in 2020 or 2021 during the COVID pandemic. Horizontal-stippled lines denote the South Bay Salt Pond Restoration Project baseline abundance (Rachel Tertes, personal communication) for American avocet nests (1,380 nests, orange-stippled line), black-necked stilt nests (590 nests, black-stippled line), and Forster’s tern nests (907 nests, purple-stippled line), which were derived by dividing by two the number of breeding birds observed during South San Francisco Bay surveys done by Rintoul and others (2003; American avocets and black-necked stilts) and Strong and others (2004; Forster’s terns).
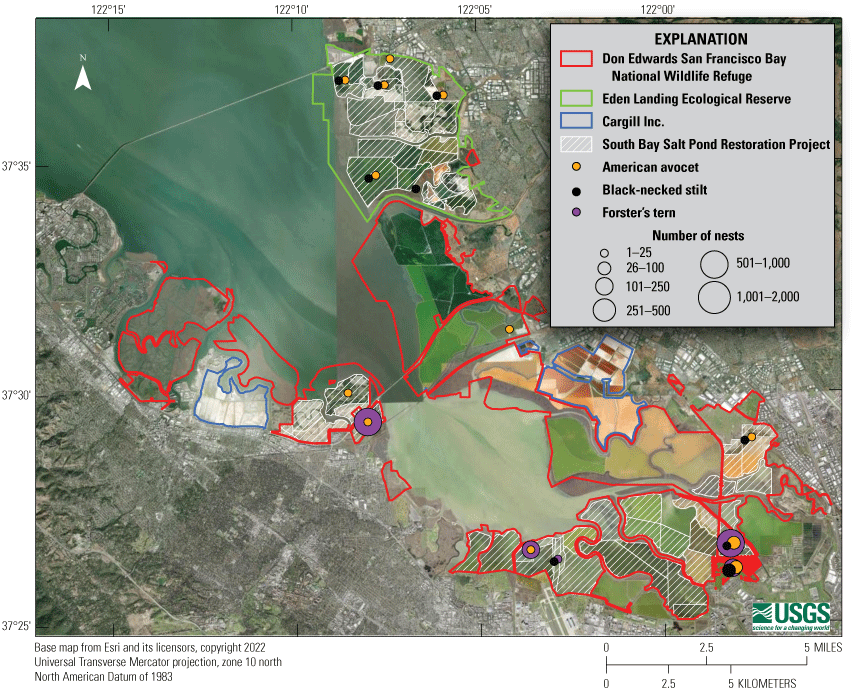
Distribution and abundance of American avocet (orange circles), black-necked stilt (black circles), and Forster’s tern (purple circles) nests monitored in 2022.
Major colony sites were defined as those with nest numbers greater than or equal to the median number of nests among all sites and years from 2005 to 2019 for each species (greater than or equal to 12 American avocet nests, greater than or equal to 6 black-necked stilt nests, greater than or equal to 40 Forster’s tern nests). In 2022, we observed a continuation of the decline in the number of major colony sites (fig. 3; Hartman and others, 2021). There were only six, four, and four major colonies of American avocets, black-necked stilts, and Forster’s terns, respectively, in 2022 (fig. 3). In comparison, between 2005 and 2009, the average number of major colonies was 12.4, 6.6, and 6.6 for American avocet, black-necked stilt, and Forster’s terns, respectively (Hartman and others, 2021), which is double the numbers of colonies observed in 2022. For Forster’s terns, Ponds A16 and SF2 accounted for 86 percent (1,488 of 1,727 nests) of all recorded Forster’s tern nests in South San Francisco Bay in 2022. For comparison, in 2019, Ponds A16 and SF2 accounted for only 12 percent (72 of 604 nests) of all recorded Forster’s tern nest in South San Francisco Bay. During 2022, in Pond SF2, Forster’s terns nested on constructed islands in Cells 1 and 2 and on dredge spoil islands at the northeast corner of Cell 2 (fig. 5). However, in Pond A16, no Forster’s tern nests were observed on the constructed islands in 2022; instead, Forster’s tern nested only on the exposed mudflats (fig. 5). In 2022, water levels were lowered in Pond A16 resulting in abundant exposed mudflat habitat. Moreover, there was considerable construction activity at the south end of the pond associated with the South San Francisco Bay Shoreline Project and the historic long and narrow southern islands in the pond were purposely covered to prevent birds from nesting; however, in 2019, when there was not any construction activities in Pond A16, none of the 36 Forster’s tern nests observed in that year were on newly constructed islands (three tern nests were on the historic long and narrow southern islands, where social attraction was implemented). These results largely confirm our previous conclusions that large, constructed islands in Ponds A16 and SF2 are less preferred nesting habitat, but are still used when alternative nesting habitats are not available (Ackerman and others, 2014a). When an alternate habitat was present (exposed mudflats in Pond A16), Forster’s terns preferentially selected the exposed mudflats over the larger constructed islands. After the construction of islands in Ponds SF2 and A16, we were able to examine waterbird nesting island preferences and published suggestions for future island construction (Ackerman and others, 2014a; Hartman and others, 2016a, b). These suggestions include making islands smaller and more linear in shape, which is preferred by waterbirds compared to larger and more rounded islands.
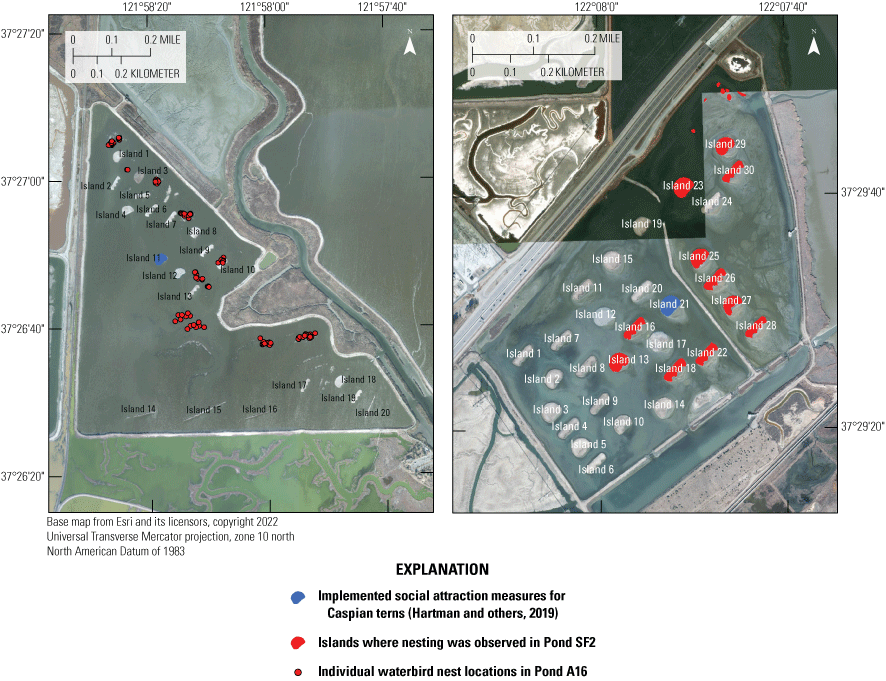
Individual waterbird nest locations in Pond A16 (left panel, red circles) and islands where nesting was observed in Pond SF2 (right panel, red islands) in 2022. Also shown in blue is the island in each pond where the U.S. Geological Survey implemented social attraction measures for Caspian terns from 2015 to 2017 (Hartman and others, 2019) and where the Caspian tern colony nested in 2022. Islands 14–20 at the south end of Pond A16 were covered in 2022 to prevent birds from nesting during construction associated with the South San Francisco Bay Shoreline Project.
In addition to the three focal species (American avocet, black-necked stilt, and Forster’s tern), we observed a high count of 150 Caspian tern nests on island 11 in Pond A16 and 175 Caspian tern nests on island 21 in Pond SF2 in 2022 (fig. 5). These relatively large Caspian tern colonies are the continuation of the social attraction efforts we performed in partnership with the U.S. Fish and Wildlife Service and U.S. Army Corps of Engineers in 2015–2017, which established two of the largest Caspian tern nesting colonies in San Francisco Bay (Hartman and others, 2018, 2019). The high count of 150 nests at the Pond A16 island 11 colony was similar to the high count of 167 nests observed in 2017, the last year of social attraction efforts, whereas the 175 nests on the Pond SF2 island 21 colony were below the high count of 334 nests observed in 2017. However, we note that funding was not available during 2022 for the intensive biweekly Caspian tern nesting surveys that were completed during 2015–2017. Thus, the 2022 counts for Caspian tern nests should be considered minimum values. We also observed a high count of 20 black skimmer nests on island 12 in Pond A16, a single black skimmer nest on one of the islands in the southwest corner of Pond R1, and 6 elegant tern (Thalasseus elegans) nests on island 21 in Pond SF2.
Clutch Size
Average clutch size in 2022 was 3.68 eggs for American avocets, 3.70 eggs for black-necked stilts, and 2.63 eggs for Forster’s terns (table 4), which is similar to values observed during 2005–2010 (American avocets: 3.47 eggs, black-necked stilts: 3.48 eggs, Forster’s terns: 2.27 eggs; Ackerman and Herzog, 2012). Clutch size estimates by site for each species are provided in table 5.
Table 4.
Summary of nesting demographic and habitat parameters for American avocets, black-necked stilts, and Forster’s terns in South San Francisco Bay, California in 2022.[cm, centimeter; NA, not applicable]
Total number of nests monitored weekly and used for estimating demographic and nest habitat parameters.
In 2022, Forster’s tern nesting populations in Ponds A16, SF2, and New Chicago Marsh were extremely large, so we counted all nests and monitored a subset of nests weekly to estimate demographic variables.
Data from Ackerman and Herzog (2012).
Table 5.
Summary nesting information for American avocets, black-necked stilts, and Forster’s terns in South San Francisco Bay, California in 2022.[Not applicable (NA) means that we were not able to estimate the value due to low sample sizes at specific sites. Abbreviations: cm, centimeters; %, percent]
Nest Success
Overall, average nest success in 2022 was 30 percent for American avocets, 29 percent for black-necked stilts, and 53 percent for Forster’s terns (table 4). Total egg depredation by predators accounted for most of the nest failures among American avocets (78 percent of nest failures) and black-necked stilts (70 percent of nest failures), but only 32 percent of Forster’s tern nest failures. Nest success in 2022 was lower for American avocets and Forster’s terns and higher for black-necked stilts compared to the average for 2005–2010, in which nest success was 37 percent for American avocets, 24 percent for black-necked stilts, and 61 percent for Forster’s terns (table 4; Ackerman and Herzog, 2012). Nest success estimates by site for each species are provided in table 5.
Egg Hatching Success
In 2022, egg hatching success averaged 98 percent for American avocets, 100 percent for black-necked stilts, and 90 percent for Forster’s terns (table 4), which were similar values to what was observed in previous years (American avocets: 93 percent, black-necked stilt: 99 percent, Forster’s terns: 95 percent, table 4; Ackerman and Herzog, 2012). Because there is limited partial depredation of clutches for such an island-nesting situation (Ackerman and others, 2003; Herring and others, 2011), we expected egg hatching success to be generally high. Egg hatching success estimates by site for each species are provided in table 5.
Nest Initiation Date
American avocets and Forster’s terns nested earlier, and black-necked stilt nested later in 2022 than in previous years. During 2005–2010, the median nest initiation date was May 15 for American avocets, May 3 for black-necked stilt, and May 30 for Forster’s terns (Ackerman and Herzog, 2012; table 4). In 2022, the median nest initiation date was May 4 (11 days earlier than 2005–2010) for American avocets, May 13 (10 days later than 2005–2010) for black-necked stilts, and May 20 (10 days earlier than 2005–2010) for Forster’s terns (table 4). In 2022, the central span of nest initiation dates (when the central 80 percent of nests were initiated) was 58 days (April 9–June 5) for American avocets, 56 days (May 1–June 25) for black-necked stilts, and 31 days (May 11–June 10) for Forster’s terns (table 4). Nest initiation dates by site are provided in table 5.
Nesting Vegetation and Habitat
Vegetation at the nest varied by species. Black-necked stilt nests were characterized by taller, denser vegetation cover, and less exposed bare ground than Forster’s tern and American avocet nests. In contrast, Forster’s terns and American avocets preferred shorter, sparser vegetation with a large amount of bare ground for the nest site (Ackerman and others, 2014c). In 2022, average vegetation height at the nest was 6.5 centimeters (cm) for American avocets, 12.0 cm for black-necked stilts, and 8.0 cm for Forster’s terns (table 4). Vegetation cover at the nest averaged 41.7 percent for American avocets, 77.0 percent for black-necked stilts, and 56.4 percent for Forster’s terns (table 4). The percentage of bare ground at the nest averaged 58.2 percent for American avocets, 22.1 percent for black-necked stilts, and 44.1 percent for Forster’s terns (table 4). Vegetation characteristics at the nest by site are provided in table 5.
Management Implications
Short-Term Waterbird Nesting Trends (2017–2022)
Nest abundance of all three species during 2017–2019 (the most recent 3-year period for which we have data) were among the lowest recorded since annual nest monitoring began in 2005 (fig. 3). Compared to 2017–2019, Forster’s tern nest abundance increased by 179 percent, black-necked stilt nest abundance increased slightly by 9 percent, and American avocet nest abundance continued their decline by 56 percent (fig. 3) during the 2022 breeding season. Loss of historic nesting habitat, without the establishment of new nesting colonies may have contributed to the low nest abundance observed in 2017–2019. Ponds A1, A2W, A7, and A8 previously hosted hundreds of Forster’s tern and American avocet nests annually, but loss of island nesting habitat because of inundation (Ponds A7 and A8) or island erosion (Ponds A1 and A2W) ended nesting activity in these ponds (Hartman and others, 2021). Moreover, Pond A16, another site that historically supported hundreds of Forster’s tern and American avocet nests annually, went unused by nesting Forster’s terns after the pond was drained for construction of new islands in 2012, until, with the aid of social attraction efforts by USGS in 2017 and 2019, 36 Forster’s terns nested in 2019 for the first time since 2011 (Hartman and others, 2020).
The large rebound in Forster’s tern nest numbers observed in 2022 was due to the establishment of large nesting colonies in Pond A16 (523 nests) and Pond SF2 (965 nests) that accounted for 86 percent of all monitored Forster’s tern nests in the South San Francisco Bay. Forster’s terns have now nested at Pond SF2 in every year since 2016 when USGS used social attraction techniques for Caspian terns (Hartman and others, 2019), although nest monitoring did not occur in 2020 and 2021. At Pond SF2, the 2022 Forster’s tern nesting population was the largest number ever observed and the most nests within any single site since annual nest monitoring began in 2005 (table 3). At Pond A16, Forster’s terns have now nested since 2019 (after successful social attraction efforts by USGS; Hartman and others, 2020), and more Forster’s tern nests were observed at Pond A16 in 2022 than in any other year since annual nest monitoring began in 2005 (table 3).
We did not observe similar rebounds in nest abundance for American avocets or black-necked stilts. Among the three focal species, black-necked stilts are the least tied to island nesting habitat (21 percent), prefer taller and denser vegetation cover (table 4) and are more likely to nest in marsh habitats (Ackerman and others, 2014c). Thus, black-necked stilt nest abundance is likely to be more affected by marsh habitat availability, particularly non-tidal or muted tidal marshes like New Chicago Marsh in the Alviso Complex and ‘Stilt Marsh’ in the Eden Landing Ecological Reserve. American avocets, on the other hand, are more dependent on island nesting habitat, with more than 73 percent of their nests, and 96 percent of Forster’s tern nests, observed on islands in South San Francisco Bay (Hartman and others, 2016a).
Long-Term Waterbird Nesting Trends (2005–2022) and Comparison to Baseline
The South Bay Salt Pond Restoration Project follows an adaptive management plan, in which concurrent monitoring of the effects of restoration and management actions are used to guide decision-making as the restoration progresses (Trulio and others, 2007). For breeding American avocets, black-necked stilts, and Forster’s terns, the adaptive management plan calls for “maintaining numbers of breeding avocets, stilts, and terns using the South Bay at pre-ISP baseline numbers, if known, or as close to that baseline as can be determined” and includes management triggers of declines in abundance or reproductive success below baseline numbers for 2 consecutive years (Trulio and others, 2007, appendix 3). Baseline triggers for the South Bay Salt Pond Restoration Project include 2 consecutive years of decline to less than 2,760 breeding American avocets or less than 55 percent nest success, less than 1,180 breeding black-necked stilts or less than 48 percent nest success, and less than 1,813 breeding Forster’s terns or less than 68 percent nest success (Rachel Tertes, personal communication). These triggers were based on counts of the number of adult American avocets, black-necked stilts (Rintoul and others, 2003) and Forster’s terns (Strong and others, 2004) adults during the breeding season in South San Francisco Bay before Phase 1 of the restoration project, and nest success estimates for all three species were based on the USGS’s long-term nest monitoring data (Ackerman and Herzog, 2012). Dividing these baseline triggers for adult abundance by two provides a close approximation of expected baseline nest abundance: 1,380 nests for American avocets, 590 nests for black-necked stilts, and 907 nests for Forster’s terns. Using observed nest abundance from our annual monitoring, the number of breeding American avocets and black-necked stilts in South San Francisco Bay has been below the baseline triggers in every year since 2005 (fig. 3; tables 1–2). Conversely, Forster’s terns have been below their baseline trigger for breeding adults in only 5 of the past 16 years and only in 2 consecutive years during 2017–2019, when nest abundance averaged only 620 nests annually (fig. 3; table 3).
Overall, American avocet and black-necked stilt nest abundance in 2022 remained at or near 18-year lows (fig. 3; tables 1–2). Before the 2022 breeding season, the same was true for Forster’s terns, with only 604 nests observed in 2019, which is the second fewest since 2005. The large increase of 1,727 Forster’s tern nests in 2022 is primarily the result of the large colonies observed at Ponds A16 and SF2. Thus, at least in 2022, these two managed ponds supported Forster’s tern nesting populations above baseline values observed before 2017. With the large and rapid changes in waterbird nest abundance and distribution in South San Francisco Bay, continued nest monitoring would provide data critical to evaluate the effect of habitat changes associated with the South Bay Salt Pond Restoration Project and guide management actions that optimize nest and chick survival.
Nest success estimates for American avocets (30 percent), black-necked stilts (29 percent), and Forster’s terns (53 percent) in 2022 were all below baseline values (2005–2007: 55 percent for American avocets, 48 percent for black-necked stilts, and 68 percent for Forster’s terns). The relatively greater nest success of Forster’s terns than the shorebirds in 2022 may be partly associated with their greater use of island nesting habitat (92 percent of nests) where terrestrial predator access is more limited, compared to American avocets (72 percent of nests) and black-necked stilts (12 percent of nests). Indeed, nest success estimates for American avocets and black-necked stilts were among the lowest at sites without nesting islands, such as New Chicago Marsh, Stilt Marsh, and A22 (table 5). These results highlight the importance of maintaining suitable island nesting habitat in multiple locations in South San Francisco Bay because island habitats provide greater protection from nest predation than marsh habitats.
Island Nesting Habitat and Water-Level Management
In Pond SF2, most nests were observed on islands constructed in 2010 as part of the South Bay Salt Pond Restoration Project. In contrast, few nests (and no Forster’s tern nests) were observed on Pond A16 islands constructed in 2013 as part of the South Bay Salt Pond Restoration Project. Instead, Forster’s terns nested on the relatively abundant low-lying mudflats throughout Pond A16. However, these Pond A16 mudflats are not ideal nesting habitat because fluctuations in water levels resulted in some nests failing and chick mortality due to flooding. Managing water levels so that mudflats are not available during the breeding season may lead to greater use of constructed islands as well as lower nest and chick mortality associated with flooding of lower-lying mudflats.
California Gull Management
The high nest abundance observed at Ponds A16 and SF2, as well as the continuing high nest abundance at historic sites at Pond AB1 and New Chicago Marsh, enabled Forster’s tern nest abundance to rebound to levels not observed since the 1990s (Strong and others, 2004). Another pond site where Forster’s tern nest abundance has been large in recent years is Pond AB2, with 122 nests observed in 2019 (table 3). In 2022, California gulls (Larus californicus) completely dominated the nesting islands used by Forster’s terns in past years in the Moffett complex of ponds, and we observed only a single Forster’s tern nest and a single, black-necked stilt nest, both of which promptly failed, in Pond AB2. Without gull management or gull hazing and dissuasion, Pond AB2 and other Moffett complex ponds may continue to be an ineffective nesting habitat for other waterbirds in the future. Furthermore, as documented previously, the California gull population in South San Francisco Bay has almost tripled since 2001 (Burns and others, 2018; Tarjan and Burns, 2019), and gulls are key predators of waterbird eggs and chicks (Herring and others, 2011; Ackerman and others, 2014b, c; Takekawa and others, 2015; Peterson and others, 2017). Thus, management of California gulls to prevent occupation of island nesting habitat and reduce predation on waterbird nesting colonies is an important consideration for ensuring healthy waterbird nesting populations in South San Francisco Bay.
References Cited
Ackerman, J.T., Bluso-Demers, J.D., and Takekawa, J.Y., 2009, Post fledging Forster’s tern movements, habitat selection, and colony attendance in San Francisco Bay: The Condor, v. 111, no. 1, p. 100–110. [Available at https://doi.org/10.1525/cond.2009.080054.]
Ackerman, J.T., Eadie, J.M., Loughman, D.L., Yarris, G.S., and McLandress, M.R., 2003, The influence of partial clutch depredation on duckling production: The Journal of Wildlife Management, v. 67, no. 3, p. 576–587. [Available at https://doi.org/10.2307/3802715.]
Ackerman, J.T., and Eagles-Smith, C.A., 2009, Integrating toxicity risk in bird eggs and chicks—Using chick down feathers to estimate mercury concentrations in eggs: Environmental Science & Technology, v. 43, no. 6, p. 2166–2172. [Available at https://doi.org/10.1021/es803159c.]
Ackerman, J.T., and Eagles-Smith, C.A., 2010, Accuracy of egg flotation throughout incubation to determine embryo age and incubation day in waterbird nests: The Condor, v. 112, no. 3, p. 438–446. [Available at https://doi.org/10.1525/cond.2010.090070.]
Ackerman, J.T., Eagles-Smith, C.A., Herzog, M.P., Herring, G., Strong, C.M., and Mruz, E., 2010, Response of waterbird breeding effort, nest success, and mercury concentrations in eggs and fish to wetland management: Davis, Calif., U.S. Geological Survey, Western Ecological Research Center, Data Summary, 28 p. [Available at https://www.southbayrestoration.org/document/response-waterbird-breeding-effort-nest-success-and-mercury-concentrations-eggs-and-fish.]
Ackerman, J.T., Eagles-Smith, C.A., Takekawa, J.Y., Bluso, J.D., and Adelsbach, T.L., 2008a, Mercury concentrations in blood and feathers of prebreeding Forster’s terns in relation to space use of San Francisco Bay, California, USA, habitats: Environmental Toxicology and Chemistry, v. 27, no. 4, p. 897–908. [Available at https://doi.org/10.1897/07-230.1.]
Ackerman, J.T., Takekawa, J.Y., Eagles-Smith, C.A., and Iverson, S.A., 2008b, Mercury contamination and effects on survival of American avocet and black-necked stilt chicks in San Francisco Bay: Ecotoxicology, v. 17, p. 103–116. [Available at https://doi.org/10.1007/s10646-007-0164-y.]
Ackerman, J.T., Eagles-Smith, C.A., Takekawa, J.Y., Demers, S.A., Adelsbach, T.L., Bluso, J.D., Miles, A.K., Warnock, N., Suchanek, T.H., and Schwarzbach, S.E., 2007, Mercury concentrations and space use of pre-breeding American avocets and black-necked stilts in San Francisco Bay: Science of the Total Environment, v. 384, nos. 1–3, p. 452–466. [Available at https://doi.org/10.1016/j.scitotenv.2007.04.027.]
Ackerman, J.T., Marvin-DiPasquale, M., Slotton, D., Eagles-Smith, C.A., Herzog, M.P., Hartman, C.A., Agee, J.L., and Ayers, S., 2013a, The South Bay Mercury Project—Using biosentinels to monitor effects of wetland restoration for the South Bay Salt Pond Restoration Project: Davis, Calif., South Bay Salt Pond Restoration Project and Resources Legacy Fund, U.S. Geological Survey, 227 p.
Ackerman, J.T., Herzog, M.P., and Schwarzbach, S.E., 2013b, Methylmercury is the predominant form of mercury in bird eggs—A synthesis: Environmental Science & Technology, v. 47, no. 4, p. 2052–2060. [Available at https://doi.org/10.1021/es304385y.]
Ackerman, J.T., Hartman, C.A., Herzog, M.P., Takekawa, J.Y., Robinson, J.A., Oring, L.W., Skorupa, J.P., and Boettcher, R., 2020, American avocet (Recurvirostra americana), version 1.0, in Poole, A.F., ed., Birds of the world: Ithaca, N.Y., Cornell Lab of Ornithology. [Available at https://doi.org/10.2173/bow.ameavo.01.]
Ackerman, J.T., and Herzog, M.P., 2012, Waterbird nest monitoring program in San Francisco Bay (2005–10): U.S. Geological Survey Open-File Report 2012–1145, 16 p. [Available at https://doi.org/10.3133/ofr20121145.]
Ackerman, J.T., Herzog, M.P., and Hartman, C.A., 2012, The South Bay Mercury Project—Using biosentinels to monitor effects of wetland restoration for the South Bay Salt Pond Restoration Project (waterbird mercury component): Davis, Calif., U.S. Geological Survey, Western Ecological Research Center, 79 p. [Available at https://www.southbayrestoration.org/document/south-bay-mercury-project-using-biosentinels-monitor-effects-wetland-restoration-south-bay.]
Ackerman, J.T., Hartman, C.A., Herzog, M.P., Smith, L.M., Moskal, S.M., De La Cruz, S.E., Yee, J.L., and Takekawa, J.Y., 2014a, The critical role of islands for waterbird breeding and foraging habitat in managed ponds of the South Bay Salt Pond Restoration Project, South San Francisco Bay, California: U.S. Geological Survey Open-File Report 2014–1263, 108 p. [Available at https://doi.org/10.3133/ofr20141263.]
Ackerman, J.T., Herzog, M.P., Hartman, C.A., and Herring, G., 2014b, Forster’s tern chick survival in response to a managed relocation of predatory California gulls: The Journal of Wildlife Management, v. 78, no. 5, p. 818–829. [Available at https://doi.org/10.1002/jwmg.728.]
Ackerman, J.T., Herzog, M.P., Takekawa, J.Y., and Hartman, C.A., 2014c, Comparative reproductive biology of sympatric species—Nest and chick survival of American avocets and black-necked stilts: Journal of Avian Biology, v. 45, no. 6, p. 609–623. [Available at https://doi.org/10.1111/jav.00385.]
Ackerman, J.T., Eagles-Smith, C.A., Heinz, G., De La Cruz, S.E., Takekawa, J.Y., Miles, A.K., Adelsbach, T.L., Herzog, M.P., Bluso-Demers, J.D., Demers, S.A., Herring, G., Hoffman, D.J., Hartman, C.A., Willacker, J.J., Suchanek, T.H., Schwarzbach, S.E., and Maurer, T.M., 2014e, Mercury in birds of San Francisco Bay-Delta, California—Trophic pathways, bioaccumulation, and ecotoxicological risk to avian reproduction: U.S. Geological Survey Open-File Report 2014–1251, 202 p. [Available at https://doi.org/10.3133/ofr20141251.]
Ackerman, J.T., Herzog, M.P., Hartman, C.A., Watts, T., and Barr, J., 2014f, Waterbird egg mercury concentrations in response to wetland restoration in south San Francisco Bay, California: U.S. Geological Survey Open-File Report 2014–1189, 22 p. [Available at https://doi.org/10.3133/ofr20141189.]
Ackerman, J.T., Eagles-Smith, C.A., Herzog, M.P., Yee, J.L., and Hartman, C.A., 2016a, Egg-laying sequence influences egg mercury concentrations and egg size in three bird species—Implications for contaminant monitoring programs: Environmental Toxicology and Chemistry, v. 35, no. 6, p. 1458–1469. [Available at https://doi.org/10.1002/etc.3291.]
Burns, C.E., Ackerman, J.T., Washburn, N.B., Bluso-Demers, J., Robinson-Nilsen, C., and Strong, C., 2018, California Gull population growth and ecological impacts in the San Francisco Bay estuary, 1980–2016, in Shuford, W.D., Gill, R.E., Jr., and Handel, C.M., eds., Trends and traditions—Avifaunal change in western North America: Camarillo, Calif., Western Field Ornithologists, p. 180–189. [Available at https://doi.org/10.21199/SWB3.9.]
Hartman, C.A., Ackerman, J.T., and Herzog, M.P., 2016a, Island characteristics within wetlands influence waterbird nest success and abundance: The Journal of Wildlife Management, v. 80, no. 7, p. 1177–1188. [Available at https://doi.org/10.1002/jwmg.21120.]
Hartman, C.A., Ackerman, J.T., Herzog, M.P., Strong, C., and Trachtenbarg, D., 2019, Social attraction used to establish Caspian tern nesting colonies in San Francisco Bay: Global Ecology and Conservation, v. 20, 11 p. [Available at https://doi.org/10.1016/j.gecco.2019.e00757.]
Hartman, C.A., Ackerman, J.T., Herzog, M.P., Strong, C., Trachtenbarg, D., and Shore, C.A., 2018, Social attraction used to establish Caspian tern (Hydroprogne caspia) nesting colonies on modified islands at the Don Edwards San Francisco Bay National Wildlife Refuge, California—Final Report: U.S. Geological Survey Open-File Report 2018–1136, 41 p. [Available at https://doi.org/10.3133/ofr20181136.]
Hartman, C.A., Ackerman, J.T., Herzog, M.P., Wang, Y., and Strong, C., 2020, Establishing Forster’s tern (Sterna forsteri) nesting sites at Pond A16 using social attraction for the South Bay Salt Pond restoration project: U.S. Geological Survey Open-File Report 2020–1081, 28 p. [Available at https://doi.org/10.3133/ofr20201081.]
Hartman, C.A., Ackerman, J.T., Schacter, C.R., Herzog, M.P., Tarjan, L.M., Wang, Y., Strong, C., Tertes, R., and Warnock, N., 2021, Breeding waterbird populations have declined in South San Francisco Bay—An assessment over two decades: San Francisco Estuary and Watershed Science, v. 19, no. 3, p. 1–8. [Available at https://doi.org/10.15447/sfews.2021v19iss3art4.]
Hartman, C.A., Ackerman, J.T., Takekawa, J.Y., and Herzog, M.P., 2016b, Waterbird nest-site selection is influenced by neighboring nests and island topography: The Journal of Wildlife Management, v. 80, no. 7, p. 1267–1279. [Available at https://doi.org/10.1002/jwmg.21105.]
Herring, G., Ackerman, J.T., Takekawa, J.Y., Eagles-Smith, C.A., and Eadie, J.M., 2011, Identifying nest predators of American avocets (Recurvirostra americana) and black-necked stilts (Himantopus mexicanus) in San Francisco Bay, California: The Southwestern Naturalist, v. 56, no. 1, p. 35–43. [Available at https://doi.org/10.1894/KF-14.1.]
Klett, A.T., and Johnson, D.H., 1982, Variability in nest survival rates and implications to nesting studies: The Auk, v. 99, no. 1, p. 77–87. [Available at https://doi.org/10.2307/4086023.]
McNicholl, M.K., Lowther, P.E., and Hall, J.A., 2020, Forster’s tern (Sterna forsteri), in Poole, A.F., and Gill, F.B., eds., Birds of the world: Ithaca, N.Y., Cornell Lab of Ornithology. [Available at https://doi.org/10.2173/bow.forter.01.]
Page, G.W., Stenzel, L.E., and Kjelmyr, J.E., 1999, Overview of shorebird abundance and distribution in wetlands of the Pacific Coast of the contiguous United States: The Condor, v. 101, no. 3, p. 461–471. [Available at https://doi.org/10.2307/1370176.]
Peterson, S.H., Ackerman, J.T., and Eagles-Smith, C.A., 2017, Mercury contamination and stable isotopes reveal variability in foraging ecology of generalist California gulls: Ecological Indicators, v. 74, p. 205–215. [Available at https://doi.org/10.1016/j.ecolind.2016.11.025.]
Robinson, J.A., Reed, J.M., Skorupa, J.P., and Oring, L.W., 2020, Black-necked stilt (Himantopus mexicanus), in Poole, A.F., and Gill, F.B., eds., Birds of the world: Ithaca, N.Y., Cornell Lab of Ornithology. [Available at https://doi.org/10.2173/bow.bknsti.01.]
Shaffer, T.L., 2004, A unified approach to analyzing nest success: The Auk, v. 121, no. 2, p. 526–540. [Available at https://academic.oup.com/auk/article/121/2/526/5562433.]
Strong, C.M., Spear, L.B., Ryan, T.P., and Dakin, R.E., 2004, Forster’s tern, Caspian tern, and California gull colonies in San Francisco Bay—Habitat use, numbers, and trends, 1982–2003: Waterbirds, v. 27, no. 4, p. 411–423. [Available at https://doi.org/10.1675/1524-4695(2004)027[0411:FTCTAC]2.0.CO;2.]
Takekawa, J.Y., Ackerman, J.T., Brand, L.A., Graham, T.R., Eagles-Smith, C.A., Herzog, M.P., Topping, B.R., Shellenbarger, G.G., Kuwabara, J.S., Mruz, E., Piotter, S.L., and Athearn, N.D., 2015, Unintended consequences of management actions in salt pond restoration—Cascading effects in trophic interactions: PLoS One, v. 10, no. 6, 15 p. [Available at https://doi.org/10.1371/journal.pone.0119345.]
Takekawa, J.Y., Woo, I., Gardiner, R., Casazza, M., Ackerman, J.T., Nur, N., Liu, L., and Spautz, H., 2011, Avian communities in tidal salt marshes of San Francisco Bay—A review of functional groups by foraging guild and habitat association: San Francisco Estuary and Watershed Science, v. 9, no. 3, p. 1–24. [Available at https://doi.org/10.15447/sfews.2011v9iss3art4.]
Takekawa, J.Y., Woo, I., Thorne, K.M., Buffington, K.J., Nur, N., Casazza, M.L., and Ackerman, J.T., 2012, Bird communities—Effects of fragmentation, disturbance, and sea level rise on population viability, chap. 12 of Palaima, A., ed., Ecology, conservation, and restoration of tidal marshes—The San Francisco Estuary: Berkeley, Calif., University of California Press, p. 175–194. [Available at https://doi.org/10.1525/california/9780520274297.003.0012.]
For more information concerning the research in this report, contact the
Director, Western Ecological Research Center
U.S. Geological Survey
3020 State University Drive East
Sacramento, California 95819
https://www.usgs.gov/centers/werc
Publishing support provided by the U.S. Geological Survey
Science Publishing Network, Sacramento Publishing Service Center
Disclaimers
Any use of trade, firm, or product names is for descriptive purposes only and does not imply endorsement by the U.S. Government.
Although this information product, for the most part, is in the public domain, it also may contain copyrighted materials as noted in the text. Permission to reproduce copyrighted items must be secured from the copyright owner.
Suggested Citation
Ackerman, J.T., Hartman, C.A., and Herzog, M., 2023, Monitoring nesting waterbirds for the South Bay Salt Pond Restoration Project—2022 breeding season: U.S. Geological Survey Open-File Report 2023–1067, 25 p., https://doi.org/10.3133/ofr20231067.
ISSN: 2331-1258 (online)
Study Area
| Publication type | Report |
|---|---|
| Publication Subtype | USGS Numbered Series |
| Title | Monitoring nesting waterbirds for the South Bay Salt Pond Restoration Project—2022 breeding season |
| Series title | Open-File Report |
| Series number | 2023-1067 |
| DOI | 10.3133/ofr20231067 |
| Publication Date | September 29, 2023 |
| Year Published | 2023 |
| Language | English |
| Publisher | U.S. Geological Center |
| Publisher location | Reston, VA |
| Contributing office(s) | Western Ecological Research Center |
| Description | vi, 25 p. |
| Country | United States |
| State | California |
| Other Geospatial | South Bay Salt Pond |
| Online Only (Y/N) | Y |