

Resurvey of Cross Sections on the Yampa and Little Snake Rivers in Lily and Deerlodge Parks, Colorado
Links
- Document: Report (8 MB pdf) , HTML , XML
- NGMDB Index Page: National Geologic Map Database Index Page (html)
- Download citation as: RIS | Dublin Core
Acknowledgments
We would like to thank the National Park Service for funding this research. In addition, we would like to thank Mark Wondzell and Paul Grams, whose comments and suggestions greatly improved this manuscript, and Emily Spencer for her support of this research.
Abstract
Resurveys of seven geomorphologic cross sections located in the Lily Park and Deerlodge Park, Colorado, reaches of the Yampa and Little Snake Rivers were conducted in October 2017. These cross sections extend from Lily Park, at the confluence of the two rivers, to Deerlodge Park within Dinosaur National Monument. Four cross sections were first surveyed in 1983 and then resurveyed in 1997. The remaining three cross sections were first surveyed in 1997. Analysis of historical aerial photographs (taken from 1961 to 2015) was conducted to contextualize the measured changes in the cross sections, confirm cross-section longitudinal positions along the rivers, and verify the timing of artificial realignment and straightening of the Little Snake River. Erosion occurred between 1983 and 1997 in all four cross sections first surveyed in 1983, largely through channel widening. Continued erosion occurred between 1997 and 2017 in six of the seven cross sections, also largely by channel widening with only minor changes in channel depth. Though erosion occurred over a longer time period, the net erosion observed at these cross sections over three decades is consistent with the net erosion documented by a sediment-transport-based monitoring program on the Yampa River and Little Snake Rivers from 2013 to 2020.
Introduction
Long-term monitoring of river-channel cross sections can help detect and document channel changes as well as changes in sediment storage. To provide longer-term context for the sediment-budgeting results from an ongoing U.S. Geological Survey (USGS) sediment-transport monitoring program, we resurveyed seven previously established cross sections on the Yampa and Little Snake Rivers (Griffiths and others, 2022) in Lily and Deerlodge Parks, Colorado (Colo.; herein referred to as the Deerlodge Park area; fig. 1). The Deerlodge Park area is a broad alluvial valley with a relatively large accommodation space for sediment storage (Elliott and Anders, 2005; Topping and others, 2018). Additionally, cross-section endpoints were documented using modern Global Positioning System (GPS) measurements, allowing future researchers to easily replicate these surveys.
Early studies of sediment transport in the Yampa and Little Snake Rivers either largely neglected the importance of the Deerlodge Park area as a source or sink of sediment or used approaches that required equilibrium sediment transport. Some of these earlier studies used measured daily sediment loads at gaging stations on the Yampa and Little Snake Rivers upstream from Deerlodge Park to estimate the sediment and sand loads of the Yampa River downstream from Deerlodge Park (Andrews, 1978, 1986; O’Brien, 1984; Grams and Schmidt, 2005), thereby assuming negligible change in total sediment or sand storage in the Deerlodge Park area. In addition, these studies used gaging stations with different periods of sediment measurements, therefore assuming stable sediment rating relations at each gaging station, that is, equilibrium sediment transport. Although Elliott and Anders (2005) measured sediment transport at the gaging stations bracketing the Deerlodge Park area, their approach was to develop sediment rating relations for the purpose of constructing sediment budgets. The existence of stable sediment relations requires equilibrium sediment transport, meaning the approach of Elliott and Anders (2005) was invalid for the Deerlodge Park area (Topping and others, 2018). Of the earlier sediment-transport studies in the Deerlodge Park area, only Resource Consultants (1991) concluded that the Yampa River at Deerlodge Park was likely characterized by disequilibrium sediment transport given the large amount of data scatter about their sediment rating relation, even though they also used sediment rating relations. On the basis of analyses of historical suspended-sand measurements and continuous sediment-transport measurements from 2013 to 2016, Topping and others (2018) concluded that the Deerlodge Park area is characterized by disequilibrium sediment transport and that sand is likely eroded from this area during most years.
In contrast to most of the 1978–2005 sediment-transport studies, two geomorphic studies conducted during that era did document changes in channel width in the Deerlodge Park area, implying the presence of disequilibrium sediment transport. A cross-section resurvey study by FLO Engineering, Inc. (1998) showed that the Little Snake and Yampa Rivers widened between 1983 and 1997, strongly implying a negative sediment budget and therefore disequilibrium sediment transport. Merritt and Cooper (2000) reached a different conclusion on changes in channel width by observing changes in vegetation coverage from aerial photographs. Merritt and Cooper (2000) concluded that the Yampa River in the Deerlodge Park area first widened from 1938 to 1973 and then narrowed on average by approximately (~) 20 meters (m) from 1973 to 1994. Though the vegetation-based results of Merritt and Cooper (2000) appear to contradict the cross-section-based results of FLO Engineering, Inc. (1998), it is important to recognize that vegetation coverage changes in aerial photographs do not necessarily equate to topographic changes, and that the 1973–1994 period of apparent narrowing from Merritt and Cooper (2000) does not completely overlap with the 1983–1997 period of widening from FLO Engineering, Inc. (1998).
The USGS initiated continuous sediment-transport monitoring at a network of gaging stations on the Little Snake, Yampa, and Green Rivers to study sediment transport and inform National Park Service resource managers (Topping and others, 2018). The part of this network used to calculate the sediment budget for the Deerlodge Park area consists of three gaging stations: Yampa River near Maybell, Colo., station 09251000, ~60 kilometers (km) upstream from the confluence of the Little Snake and Yampa Rivers; Little Snake River near Lily, Colo., station 09260000, ~15 km upstream from the confluence; and the Yampa River at Deerlodge Park, Colo., station 092610050, ~8 km downstream from the confluence (fig. 1). The downstream export of sediment from the Deerlodge Park area is the sediment load measured at the Yampa River at Deerlodge Park station (fig. 1) whereas the upstream supply of sediment to the Deerlodge Park area is the sum of the sediment loads measured at the other two stations. No major tributaries enter the Yampa or Little Snake Rivers between the three gaging stations that bracket the Deerlodge Park sediment-budget area; therefore, tributary sediment supply is neglected in this sediment budget. Data from this monitoring network are available at https://www.gcmrc.gov/discharge_qw_sediment/.
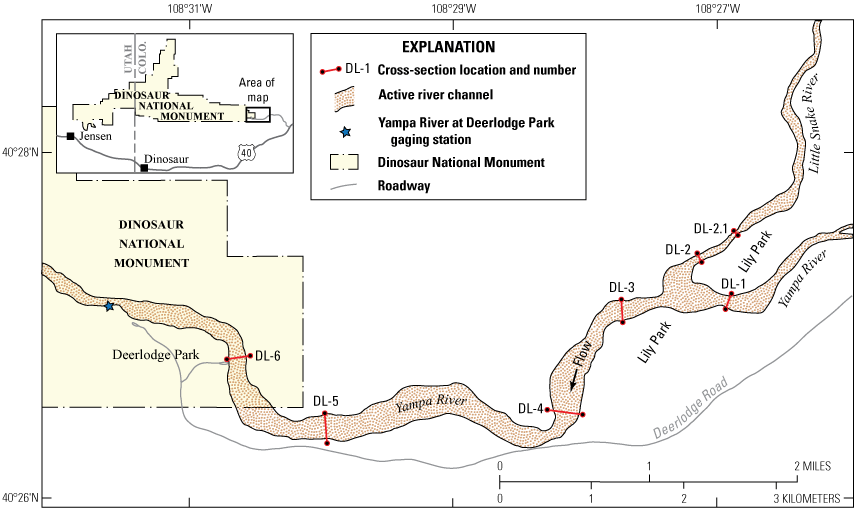
Schematic map showing the locations of the surveyed cross sections on the Yampa and Little Snake Rivers in northwest Colorado. The active river channel is defined as the channel extent devoid of vegetation in orthorectified aerial photographs from August 28, 2015 (fig. 2; U.S. Geological Survey, 2020).
Purpose and Scope
The purpose and scope of this study were to resurvey previously established cross sections on the Yampa and Little Snake Rivers in the Deerlodge Park area to document changes in channel width, depth, and cross-sectional area. Additionally, cross-section endpoints were documented using modern Global Positioning System (GPS) measurements, allowing future researchers to easily replicate these surveys.
Previous Surveys of Cross Sections in the Deerlodge Park Area
Six of the cross sections on the Yampa and Little Snake Rivers in the Deerlodge Park area were established and first surveyed in the fall of 1983 as part of a sediment-transport study funded by the National Park Service (FLO Engineering, Inc., 1998). The endpoints of these six cross sections were not monumented during the 1983 survey, the 1983 survey used trees, rocks, and I-bolts for endpoints. Field notes from the 1983 survey were used to relocate the cross sections in 1997 (FLO Engineering, Inc., 1998). The lack of monumented endpoints led to the likely mis-location of two of the 1983 cross sections during the 1997 survey (see “Historical Aerial-Photograph Analysis” section). Four of the 1983 cross sections were successfully relocated and resurveyed in August 1997, with the addition of one new cross section on the Little Snake River. The 1997 cross-section survey was part of a channel monitoring program conducted by FLO Engineering, Inc. (1998), funded by the U.S. Fish and Wildlife Service. During the 1997 survey, the endpoints of the seven cross sections were monumented with rebar driven flush with the ground surface. The rebar monuments were topped with aluminum caps stamped with the cross-section name and riverbank designation, L for left bank or R for right bank. The terms left bank and right bank are referenced from a mid-channel observer facing downstream; the local horizontal origin of each cross section was the left-bank endpoint, the local vertical origin of each cross section was 100 feet below the left-bank endpoint. The cross sections were named DL-1 through DL-6. Although cross section DL-1 is on the Yampa River upstream from the present confluence with the Little Snake River, this part of the Yampa River was downstream from the confluence before ~1975 (see “Historical Aerial-Photograph Analysis” section). Cross sections DL-2 and DL-2.1, the cross section added in 1997, are on the Little Snake River upstream from the confluence with the Yampa River, and cross sections DL-3, DL-4, DL-5, and DL-6 are on the Yampa River downstream from the confluence (fig. 1).
Of the original six cross sections on the Yampa and Little Snake Rivers in the Deerlodge Park area, five had lost one or both endpoints by 1997; therefore, locating the exact positions of the upstream three cross sections (DL-1, DL-2, and DL-3) was not possible. The unlocated cross sections were reestablished in 1997 within 15 m of their 1983 locations (FLO Engineering, Inc., 1998). Cross sections DL-3 and DL-4 were likely mis-located during the 1997 resurvey, with new cross sections effectively established ~400 m downstream and 350 m upstream from the 1983 locations. In addition to installing capped rebar monuments and resurveying four of the six original 1983 cross sections, new cross sections DL-3 and DL-4 were established on the Yampa River and new cross section DL-2.1 was established on the Little Snake River in 1997. FLO Engineering, Inc. (1998) notes that the lowermost part of the Little Snake River channel that included cross sections DL-2 and DL-2.1 had been artificially realigned “[s]ometime in the early 1980's (probably 1980 to 1982).” This realignment shortened the Little Snake River and shifted the location of its confluence with the Yampa River downstream on the Yampa River (see “Historical Aerial-Photograph Analysis” section), steepening the lowermost part of the Little Snake River. Cross section DL-2.1 was established in 1997 to help monitor the potentially rapid change in the channel geometry of the steeper, realigned part of the Little Snake River.
During the 1997 survey, the locations of the endpoints were recorded using a then state of the art GPS unit. The reported horizonal accuracy of the GPS endpoint locations ranged from ±4.9 m to ±6.7 m (FLO Engineering, Inc., 1998). Horizontal positions along each cross section were measured using a Kevlar tagline strung between the endpoints, a survey level and rod were used to measure the elevation of the water surface and topography above the water surface, and a survey rod was used to measure bathymetry (FLO Engineering, Inc., 1998). The 1997 survey was reported in local coordinate systems with the left-bank endpoint of each cross section set at 0 horizontal feet and 100 vertical feet (30.48 m); the 1983 survey data were reported in the same manner. Some of the 1983 and 1997 cross-section endpoint positions did not match, most likely because the cross sections were not exactly relocated. FLO Engineering, Inc. (1998) made slight adjustments to the positions of the 1983 cross sections on the basis of their 1997 resurvey using persistent features, such as bank-top elevation.
Cross section DL-6 was resurveyed September 1 or 2, 2011, by a National Park Service field crew (Dusty Perkins, National Park Service, written commun., August 17, 2017). The 2011 cross section DL-6 survey is presented in the “Changes in the Deerlodge Park Area Cross Sections” section; however, because only one of the seven cross sections of interest was surveyed 2011, the 2011 survey will not be discussed at length.
Methods
Approximate locations of cross-section endpoints were determined using photographs and GPS coordinates from FLO Engineering, Inc. (1998) and aerial photographs with the reported GPS coordinates superimposed. Historical aerial photographs (U.S. Geological Survey, 2020) were used to better estimate the timing of the Little Snake River channel realignment at the confluence and to confirm the accuracy of relocation of 1983 survey cross-section endpoints during the 1997 survey (FLO Engineering, Inc., 1998). A magnetic detector was used to recover the location of cross-section endpoint monuments covered by debris or eroded during bank retreat in the 20 years since initial monumentation. In cases where only one endpoint monument was found, which occurred in 2 of the 7 cross sections (table 1), the missing endpoint was re-located using the 1997 GPS coordinates and the documented distance between the cross-section endpoints (FLO Engineering, Inc., 1998). Eroded endpoint monuments were re-monumented farther back (table 1) from the bank edge with uncapped rebar. In cases where neither endpoint monument was found or the identity of the endpoint was in question, which occurred in 2 of the 7 cross sections (table 1), the 1997 GPS coordinates were used to reestablish the endpoints. The condition of cross-section endpoint monuments as they were found in 2017 survey are as follows:
-
• DL-1: Bank retreat caused the left-bank monument to fall to the riverbed at the toe of the cutbank. Using the location of the found monument and the original 1997 GPS coordinates, this capped rebar monument was re-installed in line with the original cross section ~20 m farther from the river centerline. The right-bank endpoint monument was found. This cross section is located just below a low gravel check dam regularly maintained by a local ranch.
-
• DL-2: Both left- and right-bank endpoint monuments were found.
-
• DL-2.1: Both left- and right-bank endpoint monuments were found. The right-bank monument currently protrudes ~6 inches above the ground surface.
-
• DL-3: The left-bank endpoint monument was eroded and not found. Using the original 1997 GPS coordinates, a new uncapped rebar monument was installed in line with the original cross section ~20 m farther from the river centerline. Although the right-bank endpoint monument was also not found, well established vegetation and lack of a cut bank indicated that this monument had not been eroded by bank retreat. The right-bank endpoint monument was reestablished with uncapped rebar at the original 1997 GPS coordinates.
-
• DL-4: The left-bank endpoint monument was found at the base of a large cottonwood tree. The right-bank endpoint monument was eroded and not found. Using original 1997 GPS coordinates, a new uncapped rebar monument was installed in line with the original cross section ~110 m farther from the river centerline.
-
• DL-5: Both the left- and right-bank endpoint monuments were found, though a cottonwood tree had fallen on the left-bank endpoint.
-
• DL-6: A buried, uncapped rebar monument was found near the left-bank endpoint monument location indicated in the photographs of the 1997 survey (FLO Engineering, Inc., 1998). This monument was buried in a vertical orientation near the base of a large cottonwood tree within the Deerlodge Park Campground, and despite having no cap, was assumed to be the left-bank monument. The rebar monument was ~7.3 m from its reported 1997 GPS coordinates, within the calculated error of the original survey (table 1). Likewise, a buried, uncapped rebar monument was found near reported 1997 GPS coordinates of the right-bank endpoint monument. As with the left-bank endpoint, this rebar monument was buried in a vertical orientation. Unlike the left-bank monument, the right-bank rebar monument pierced a 25-centimeter (cm)-wide plastic square, located ~2.5 cm below the top of the rebar. This rebar was found ~6.7 m from its reported 1997 GPS coordinates, also within the calculated error of the original survey (table 1). No other rebar was found nearby using the magnetic locator; therefore, this rebar was assumed to be, and used for, the right-bank endpoint monument.
Table 1.
Locations of the cross-section endpoint monuments from the 1997 study and locations and elevations of the cross-section endpoint monuments from the 2017 resurvey.[L and R in cross-section endpoint names indicate left and right bank as seen by an observer in the middle of the river channel facing downstream. The reported accuracy of the FLO Engineering, Inc. (1998) endpoint elevations was ±100 feet (30.48 m), those data are not included in this table. Values in the “horizonal difference between surveys” column are the distances between the reported original endpoint monument location and this same monument location measured in 2017. Locations are Global Positioning System (GPS) coordinates. m, meters. Latitudes and longitudes reported in degrees north and west, respectively.]
After the cross-section endpoints were found and (or) reestablished, the endpoints were surveyed using real-time kinematic (RTK) GPS. Base-station control was established on rebar driven nearly flush with the ground surface; the position of the base station was established with a National Geodetic Survey Online Positioning User Service (OPUS) solution. The cross sections were then surveyed using the same RTK unit along the line defined by the two endpoints. The density of survey points was dependent on the complexity of the terrain surveyed; points were surveyed at each break in slope and every 2–5 m in areas of no substantial topographic/bathymetric variability. Cross-section surveys were extended past the endpoint monuments where substantial active bank erosion was observed to ensure future resurveys can easily reproduce the 2017 ground surface. The density of survey points for all cross sections surveyed in 2017 exceeded those collected in either 1983 or 1997. The network accuracy of the base-station control with respect to the National Geodetic Survey’s network of continuously operating reference stations was <0.01 m in horizontal-circular error and <0.029 m in ellipsoid-height error. At the 95-percent-confidence level, the precision of RTK GPS vectors was 0.028 m horizontal and 0.034 m vertical.
Because no digital or tabular copies of the survey data from 1983 or 1997 were found, we digitized the survey data from the cross-section plots in FLO Engineering, Inc. (1998). To check the accuracy of the digitization, we compared our digitized survey data to plotted horizontal and elevation values from FLO Engineering, Inc. (1998) for cases where the left-bank endpoint was located at 0 feet horizontal and 100 feet (30.48 m) vertical in the 1997 survey. These cases were chosen because these were the only cases where we could be certain of the plotted values from FLO Engineering, Inc. (1998). The elevation data from cross sections DL-2.1 and DL-5 were not used for this analysis because their left-bank endpoints were not at a plotted elevation of 100 feet (30.48 m). The differences between the digitized point and the known coordinates ranged from −0.16 to 0.20 feet (mean 0.036 feet) in the horizontal and from −0.055 to 0 feet (mean −0.024 feet) in the vertical. Thus, the accuracy of our digitization of the cross-section plots was more than sufficient for detecting changes in cross-section geometry between surveys reported herein.
To calculate cross-sectional changes between the three surveys, we used FLO Engineering, Inc.’s (1998) local elevation and distance from the left-bank endpoint and converted our surveyed NAD83 (2011)–NAVD88 coordinates into their local two-dimensional coordinate system specific to each cross section. For cross sections where one or both endpoint monuments were found, we converted our NAD83 (2011) cross-section coordinates into FLO Engineering, Inc.’s (1998) horizontal coordinate system using our surveyed coordinates for these endpoint monuments. Where the left-bank monument was found, we converted our NAVD88 elevations into FLO Engineering, Inc.’s (1998) vertical coordinate system using their reported elevation of the left-bank monument. Where only the right-bank monument was found, we converted our NAVD88 elevations into FLO Engineering, Inc.’s (1998) vertical coordinate system using their reported elevation of the right-bank monument. In the one case where neither endpoint monument was found (cross section DL-3) we used FLO Engineering, Inc.’s (1998) reported GPS coordinates to convert our NAD83 (2011) coordinates into FLO Engineering, Inc.’s (1998) horizontal coordinate system, and we used geomorphic features common to both the 1997 survey and the 2017 resurvey (that is, bank-top elevation and right-bank floodplain topography) to convert our NAVD88 elevations into the vertical coordinate system of FLO Engineering, Inc. (1998).
Channel cross-section width and depths were measured along and relative to a horizontal line between the two endpoints at the elevation of the lower elevation endpoint, herein referred to as the local reference elevation (LRE). Channel width was measured as the distance between the two points where the cross-section topography intersected the LRE. Widths of features that exceed the LRE, such as aeolian dunes, were subtracted from the channel width. Mean channel depth was calculated using the cross-sectional area below the LRE and channel width. Changes in cross-sectional area between surveys were calculated to include changes in total cross-sectional area—area above and below the LRE—over the full extent of the 2017 cross sections. For cases where bank retreat exceeded the limits of an earlier survey, we interpolated the ground surface elevation between the last point in the earlier cross-section survey and the first point at similar elevation (moving away from the river centerline) in the subsequent cross-section survey.
Historical Aerial-Photograph Analysis
Historical aerial photographs (U.S. Geological Survey, 2020) were analyzed to contextualize measured changes at the cross sections, confirm the longitudinal positions of cross sections along the rivers, and verify the timing of artificial relocation and straightening of the Little Snake River. This analysis indicates that FLO Engineering, Inc. (1998) was inexact in their assessment that the artificial relocation and straightening of the confluence of the Little Snake and Yampa rivers occurred between 1980 and 1982. Our analysis indicates that the relocation and straightening occurred earlier between September 1961 and August 1975 (fig. 2A, B, respectively). The diversion dam and artificially constructed channel were present in the August 1975 aerial photograph (fig. 2B) but not in the September 1961 aerial photograph (fig. 2A). The narrow width of the artificial channel and its straight, parallel banks in the August 1975 aerial photograph (fig. 2B) indicate the channel had not been reworked by a spring snowmelt flood and that the realignment occurred just prior to the acquisition of this photograph, likely in the summer of 1975. The October 1977 aerial photograph (fig. 2C) shows the artificially realigned channel had begun to widen, and by June 1981 (fig. 2D) the channel was well established in its new alignment, with only widening occurring between 1981 and 2015 (fig. 2D, E respectively). Cross sections DL-2 and DL-2.1 are on the artificially realigned part of the Little Snake River—monitoring changes in channel geometry as the river adjusted to the realignment was the impetus behind the 1997 establishment of cross section DL-2.1. The realignment of the Little Snake River channel at the confluence reduced the length of the Little Snake River by ~1 km and completely reconfigured the confluence of the Little Snake and Yampa Rivers.
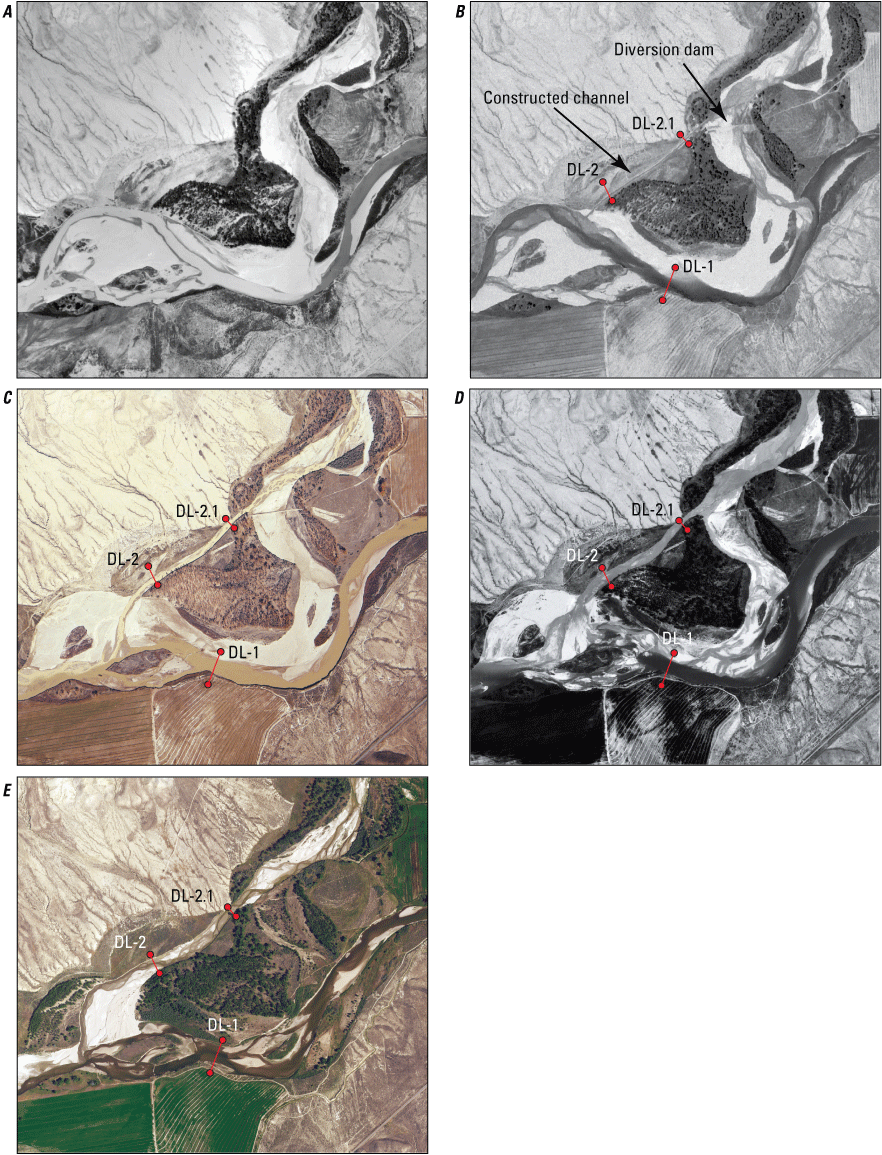
Aerial photographs of the confluence of the Little Snake and Yampa Rivers, Colorado, showing the reconfiguration of the confluence: A, September 6, 1961; B, August 29, 1975; C, October 12, 1977; D, June 21, 1981; and E, August 28, 2015 (U.S. Geological Survey, 2020). The approximate locations of cross sections DL-1, DL-2, and DL-2.1 as well as the location of the diversion dam and constructed realigned channel are shown in parts B–E.
Between September 1961 and August 1965, a reach of the Little Snake River channel, ~2.9 km upstream from the current confluence and ~2.3 km upstream from cross section DL-2.1, was also artificially realigned into a straighter channel (figs. 3A, B). The Little Snake River was well established in the artificially realigned channel by October 1977 (fig. 3C). This channel reconfiguration reduced the length of the Little Snake River by ~0.6 km. This reduction in channel length, in addition to the 1-km channel-length reduction in ~1975, substantially steepened the gradient of the Little Snake River through this reach. The steeper gradient likely promoted erosion in the lowermost part of the Little Snake River above the confluence with the Yampa River.
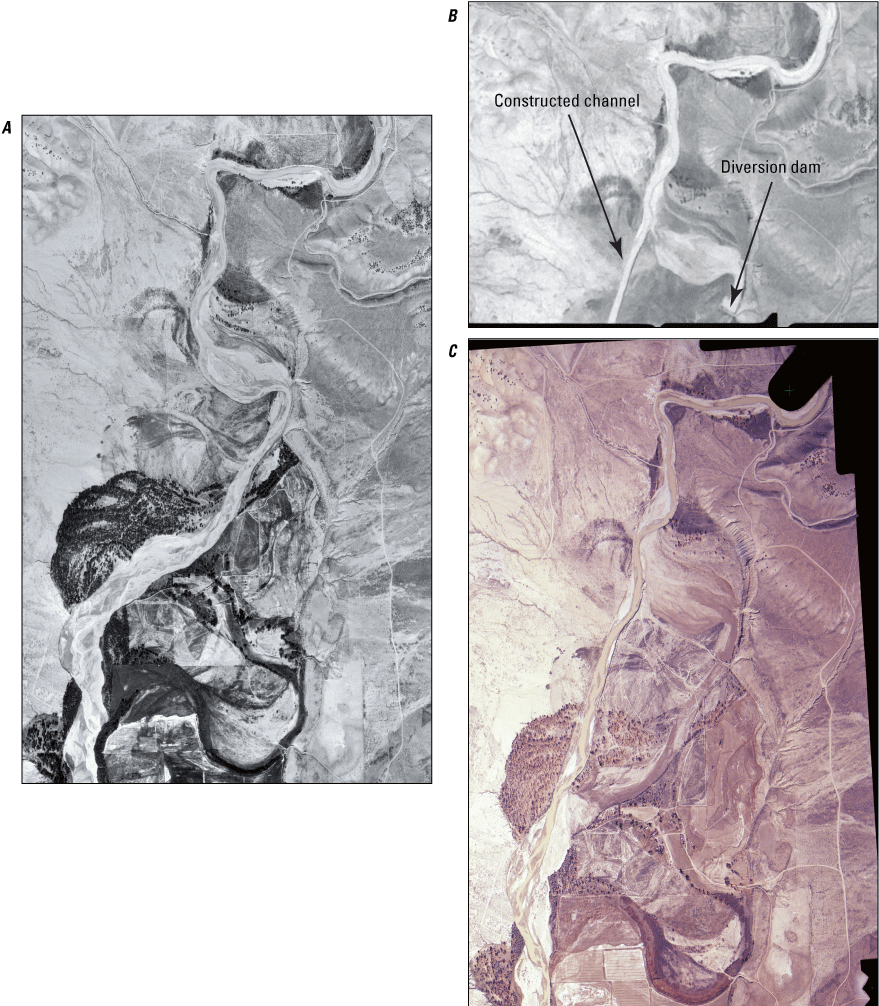
Aerial photographs of Little Snake River, Colorado, ~2.9 kilometers upstream from its confluence with the Yampa River showing the realignment of the Little Snake River into a constructed straighter channel: A, September 6, 1961; B; August 27, 1965; and C, October 12, 1977 (U.S. Geological Survey, 2020). The location of the diversion dam and constructed channel are shown. The bottom borders of photographs A and C are ~150 meters upstream from the top borders of the photographs shown in figure 2.
Historical aerial photographs taken June 1981 show that the 1997 relocation of the 1983 cross-section endpoints were consistent with the likely positions of the 1983 riverbanks, except in cross sections DL-3 and DL-4. The 1983 right-bank endpoints of these cross sections determined during the 1997 resurvey are impossibly located mid-channel in the June 1981 aerial photograph (fig.4). The likely 1997 mis-relocation of cross sections DL-3 and DL-4 would require 80 and 60 m of lateral sediment deposition, respectively, on the right bank between June of 1981 and the fall of 1983, up to the elevation of the modern bank top. There is no evidence in 1975, 1982, 1984, or 1988 aerial photographs to indicate deposition of that magnitude occurring at the 1997 locations of cross sections DL-3 and DL-4. The locations of these cross sections were likely mis-identified from the 1983 field notes during the 1997 resurvey. Because the 1997 relocation of the original 1983 cross sections DL-3 and DL-4 do not correspond to available imagery, we excluded the 1983 data at these cross sections from our analysis of cross-sectional change and treated cross sections DL-3 and DL-4 as “new” 1997 cross sections.
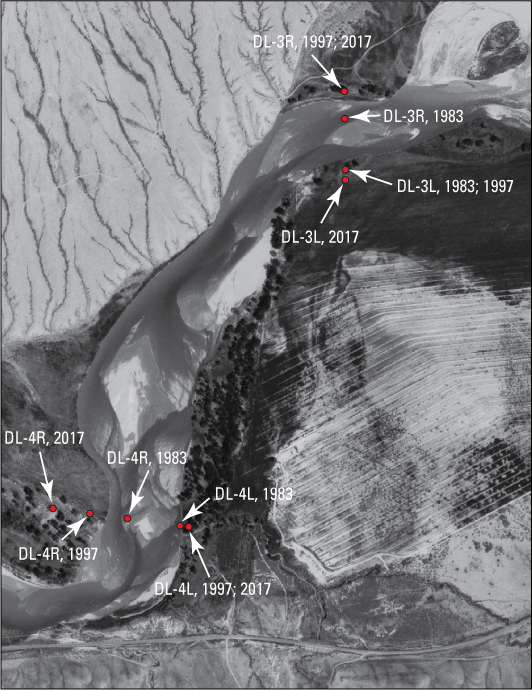
Aerial photograph, taken June 21, 1981, showing the supposed locations of the DL-3 and DL-4 left-bank (L) and right-bank (R) cross-section endpoints in the 1983 survey and the known locations of these endpoints in the 1997 and 2017 surveys (U.S. Geological Survey, 2020).
Changes in the Deerlodge Park Area Cross Sections
The cross sections of the river channel have generally increased in area between surveys, indicating progressive net erosion of sediment (fig. 5, table 2). Because most of the perimeters of these river cross sections are composed of sand, with lesser amounts of silt and clay (silt and clay is mostly present near the bank tops), net erosion of sediment corresponds to net erosion of sand. Cross-sectional area increase has generally occurred through substantial (≥ 20 m) widening (bank retreat) with only minor increases in depth, indicated by an increase in mean and (or) maximum depth below the LRE (table 2). The mean and maximum depths below the LRE decreased between 1983 and 1997 but increased between 1997 and 2017. The only instances in which the cross-sectional area decreased between surveys occurred at cross section DL-5 between 1997 and 2017 and cross section DL-6 between 1997 and 2011. In these two cases, widening occurred between 1997 and 2017 or 2011, respectively, but the mean depth below the LRE decreased.
Despite net erosion being the primary geomorphological change among cross sections, local deposition has also occurred in most cross sections. The most notable example of local deposition is the development of an aeolian dune near the right bank of cross section DL-6. Dune development in cross section DL-6 resulted in a net decrease in channel width between 1997 and 2017, despite a large increase in cross-sectional area (table 2). The two cross sections on the artificially realigned channel of the Little Snake River, DL-2 and DL 2.1, both increased in width and mean depth between 1997 and 2017. The changes to the artificially realigned channel are not unexpected as the constructed channel was narrower and steeper than the natural Little Snake River channel (fig. 2). Cross section DL-2 increased in area below the LRE by 57 percent between 1982 and 1997 and by an additional 15 percent between 1997 and 2017. Similarly, cross section DL-2.1 increased in area by 21 percent between 1997 and 2017 (table 2). With only seven cross sections, our small sample size precludes knowing the sign (positive or negative change in sediment storage), and magnitude of the sand budget in the Deerlodge Park area with certainty (after Grams and others, 2019). However, all cross sections exhibited net erosion between 1983 and 1997 and all but one exhibited net erosion between 1997 and 2017, strongly suggesting that net erosion of sand from the Little Snake and Yampa Rivers in the Deerlodge Park area occurred between 1983 and 1997 and between 1997 and 2017.
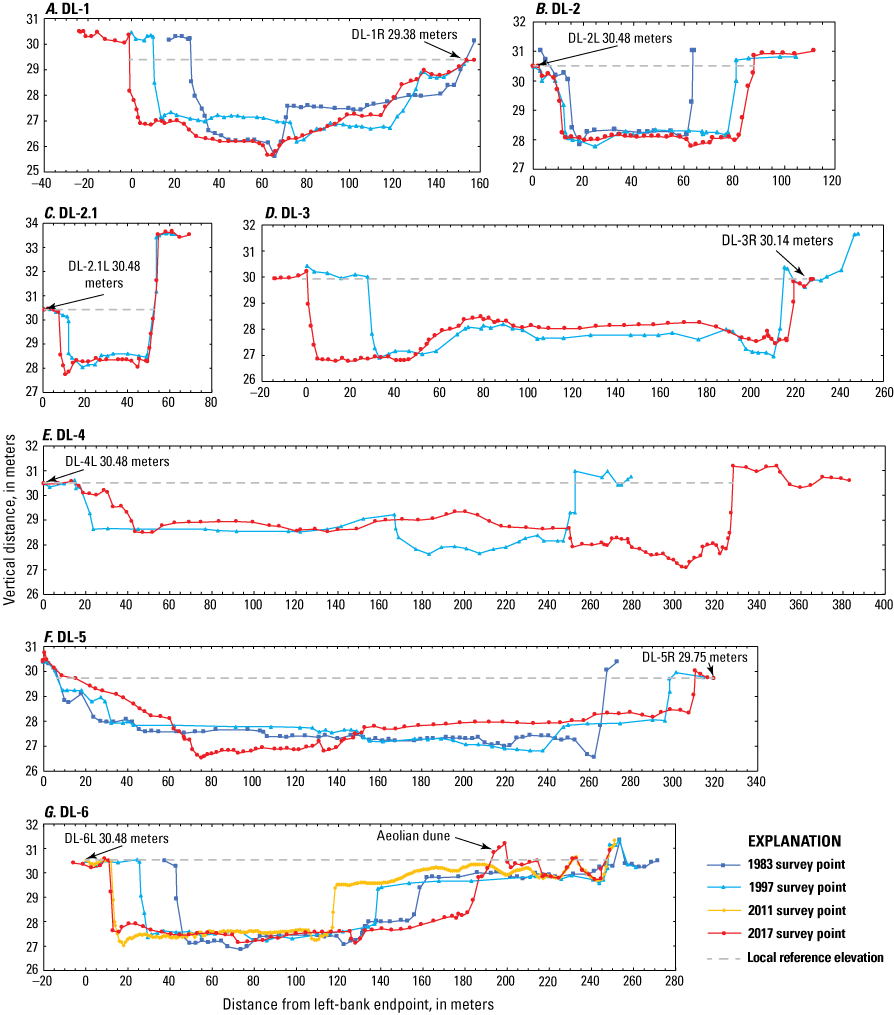
Plots of cross-section survey data from 1983, 1997, 2011, and 2017. A, DL-1. B, DL-2. C, DL-2.1. D, DL-3. E, DL-4. F, DL-5, G, DL-6. The lower of the two cross-section endpoints, indicated with its elevation on each cross-section plot, was used to determine the local reference elevation used to calculate channel width and depth. Cross sections are depicted as they would be seen by an observer facing downstream. The vertical distance is local to each cross section.
The ~1975 artificial reconfiguration of the Little Snake and Yampa River confluence changed the future location of cross section DL-1 on the Yampa River from downstream of the confluence to upstream of the confluence. Because the Little Snake River contributes the majority of the sand that passes the Yampa River at Deerlodge Park, Colo., gaging station but the minority of the discharge (Andrews, 1978; O’Brien, 1984; Topping and others, 2018), the confluence repositioning thus increased the sand deficit at cross section DL-1.
Consequently, substantial widening and deepening has occurred at cross section DL-1 since it was first surveyed in 1983 (fig. 5, table 2). The reduction in the sand supply to cross section DL-1 caused by the confluence reconfiguration is evident in figure 2A and E. The composition of the Yampa River bed at cross section DL-1 is now much more like the Yampa River bed upstream of the former confluence, dominantly gravel with only patches of sand, and completely unlike the almost fully sand-bedded Yampa River downstream from the current confluence. The documented artificial reduction in the sand supply to this cross section indicates substantial widening and mean bed scour can be expected at other cross sections in response to a major reduction in sand load.
The net erosion, or increase in channel cross-sectional area, among the cross sections on the Yampa River downstream from the reconfigured confluence was a result of channel widening with relatively little change in depth. On average, between 1983 and 1997, the two cross sections with survey data starting in 1983 widened by 21.4 m, (table 2). Between 1997 and 2017 the average of the four cross sections below the current confluence of the Little Snake and Yampa Rivers widened by 29.3 m. This widening was accompanied by an average decrease in mean depth of 0.01 m and an average increase in maximum depth of 0.26 m.
Despite spanning different time periods and the small sample size, estimated annual sand erosion rate from the Yampa River, based on four cross sections downstream from the confluence of the Little Snake and Yampa Rivers, is consistent with the sand-transport-based erosion rate measured by Topping and others (2018). The 2011 resurvey of cross section DL-6 indicates that most of this erosion may have occurred between 2011 and 2017. Topping and others (2018) measured a sand erosion rate of 120,000±79,000 metric tons per year (error value is the average of the annual uncertainties) from the Deerlodge Park area during water years 2013 through 2016 on the basis of continuous suspended-sediment measurements. Though the measurements of Topping and others (2018) applied to a longer segment of the Yampa River than only the reach downstream of the confluence and also included the lower segment of the Little Snake River, Topping and others (2018) suggested that sand erosion likely occurred mostly in the sand-bedded alluvial reaches of the Yampa and Little Snake Rivers in the Deerlodge Park sediment-budget area. Topping and others (2018) argued that erosion likely occurred in the 8-km-long alluvial reach of the Yampa River downstream from the Little Snake River and the 4.5-km-long alluvial reach of the Little Snake River upstream of the confluence. Recalculation based on more years of sediment-transport data (2013–2020) yields a sand erosion rate of 100,000±83,000 metric tons per year from the Deerlodge Park area (U.S. Geological Survey, 2021). Owing to quartz density (2,650 kg/m3) and a ~40-percent porosity (Curry and others, 2004), the dry bulk density of riverbed sand is ~1,590 kg/m3, a value consistent with those reported by Lane and Koelzer (1943) for the sand that comprises most of the bed and banks of the Yampa River. To compare with the sediment-transport-based erosion rates, we calculated the erosion rates for the 8-km-long reach of the Yampa River between the Little Snake River confluence and the Yampa River at Deerlodge Park, Colo., gaging station using this dry bulk density and the average change in total cross-sectional area among cross sections DL-3, DL-4, DL-5, and DL-6. By this approach, we estimated that ~37,000 metric tons of sand were eroded per year from this reach between August 1997 and October 2017. Because of the uncertainty surrounding some of the 1997 relocations of the 1983 cross sections, no erosion rate was calculated for the 1983 to 1997 period. This 1997 to 2017 erosion rate agrees within the uncertainties associated with the annual sand erosion rates of both 120,000±79,000 metric tons per year from Topping and others (2018) and 100,000±83,000 metric tons per year calculated using the 2013–2020 sediment-transport data (U.S. Geological Survey, 2021). This agreement is especially notable given that the sediment-transport-based erosion rates apply to a much longer segment of the Yampa River and the lower segment of the Little Snake River (fig. 1 in Topping and others, 2018). Because of the increased gradient, and thus increased erosion, from the artificial channel straightening, sediment erosion rates were not calculated for the two cross sections located on the Little Snake River.
Table 2.
Cross-section channel width, mean depth below the local reference elevation (LRE), maximum depth below the LRE, and total area from each survey[Channel cross-sectional areas and depths are reported for below the LRE as well as above the LRE. Net changes in cross-sectional area include changes both below and above the LRE. m, meters; m2, square meters]
Conclusions
A resurvey of cross sections on the Yampa and Little Snake Rivers in the Deerlodge Park area, Colorado (Griffiths and others, 2022), shows that channel erosion has been occurring during the last 34 years, with the river channels generally becoming both wider and slightly deeper. Changes in cross-sectional area measured in the Little Snake River likely reflect ongoing, but slowing, channel adjustments to the ~1975 artificial realignment and straightening of the Little Snake River. Channel widening and deepening measured in the cross section located on the Yampa River above its current confluence with the Little Snake River show the effect of a reduction in upstream sand supply to this short reach of the Yampa River following the ~1975 artificial relocation of the confluence. The four cross sections in the reach of the Yampa River between the Little Snake River confluence and the Deerlodge Park gaging station have predominantly widened, with only one of the four cross sections exhibiting minimal net change in width during the last 34 years. Estimates of sand erosion based on the resurvey of these four cross sections indicate that, during the last 20 years, ~37,000 metric tons of sand per year have been eroded from this reach. This result is consistent with sediment-transport-based measurements of sand erosion rates from 2013 to 2016 (Topping and others, 2018) and 2013 to 2020 (U.S. Geological Survey, 2021), especially when the greater geographic scope of the sediment-transport-based erosion rates of Topping and others (2018) is taken into account.
References Cited
Andrews, E.D., 1986, Downstream effects of Flaming Gorge Reservoir on the Green River, Colorado and Utah: Geological Society of America Bulletin, v. 97, no. 8, p. 1012–1023, https://doi.org/10.1130/0016-7606(1986)97<1012:DEOFGR>2.0.CO;2.
Curry, C.W., Bennett, R.H., Hulbert, M.H., Curry, K.J., and Faas, R.W., 2004, Comparative study of sand porosity and a technique for determining porosity of undisturbed marine sediment: Marine Georesources and Geotechnology, v. 22, no. 4, p. 231–252, https://doi.org/10.1080/10641190490900844.
FLO Engineering, Inc., 1998, Green River channel monitoring field data collection—Yampa and Little Snake Rivers: Denver, Colo., U.S. Fish and Wildlife Service, Recovery Implementation Program for Endangered Fish Species in the Upper Colorado River Basin project no. 72–BC final report, prepared by FLO Engineering, Inc., Breckenridge, Colo., 15 p. [Also available at https://docslib.org/doc/3243669/green-river-channel-monitoring-field-data-collection-yampa-and-little-snake-rivers.]
Grams, P.E., and Schmidt, J.C., 2005, Equilibrium or indeterminate? Where sediment budgets fail—Sediment mass balance and adjustment of channel form, Green River downstream from Flaming Gorge Dam, Utah and Colorado: Geomorphology, v. 71, nos. 1–2, p. 156–181, https://doi.org/10.1016/j.geomorph.2004.10.012.
Grams, P.E., Buscombe, D., Topping, D.J., Kaplinski, M., and Hazel, J.E., Jr., 2019, How many measurements are required to construct an accurate sand budget in a large river? Insights from analyses of signal and noise: Earth Surface Processes and Landforms, v. 44, no. 1, p. 160–178, https://doi.org/10.1002/esp.4489.
Griffiths, R.G., Kohl, K.A, and Unema, J.A., 2022, Surveyed coordinates and elevations in a 2017 resurvey of previously established cross sections on the Little Snake and Yampa rivers in Lily and Deerlodge parks, Colorado: U.S. Geological Survey data release, https://doi.org/10.5066/P9KYZUPT.
Lane, E.W., and Koelzer, V.A., 1943. Density of sediments deposited in reservoirs [Report no. 9 of A study of methods used in measurement and analysis of sediment loads in streams]: University of Iowa Hydraulic Laboratory, Iowa City, Iowa, Federal Interagency Sedimentation Project, 60 p., https://water.usgs.gov/fisp/docs/Report_9.pdf.
Merritt, D.M., and Cooper, D.J., 2000, Riparian vegetation and channel change in response to river regulation—A comparative study of regulated and unregulated stream in the Green River basin, USA: Regulated Rivers, v. 16, no. 6, p. 543–564, https://doi.org/10.1002/1099-1646(200011/12)16:6<543::AID-RRR590>3.0.CO;2-N.
Topping, D.J., Mueller, E.R., Schmidt, J.C., Griffiths, R.E., Dean, D.J., and Grams, P.E., 2018, Long-term evolution of sand transport through a river network—Relative influences of a dam versus natural changes in grain size from sand waves: Journal of Geophysical Research, Earth Surface, v. 123, no. 8, p. 1879–1909, https://doi.org/10.1029/2017JF004534.
U.S. Geological Survey, 2020, Aerial images 1961–2015—Yampa River near Little Snake River confluence, Colo. (40°27'14.42” N 108°27'00.11” W): U.S. Geological Survey EarthExplorer website, https://earthexplorer.usgs.gov.
U.S. Geological Survey, 2021, Deerlodge Park discharge, sediment, and water quality monitoring data: U.S. Geological Survery Grand Canyon Monitoring and Research Center Discharge, Sediment, and Water Quality Monitoring database, accessed August 24, 2021, at https://www.gcmrc.gov/discharge_qw_sediment/reach/DINO/09251000/09260050.
Datums
Vertical coordinate information is referenced to NAVD88 orthometric elevation modeled from GEOID12b.
Horizontal coordinate information is referenced to NAD83 (2011).
Moffett Field Publishing Service Center, California
Manuscript approved August 28, 2023
Edited by Mitchell Phillips
Layout by Cory Hurd
Disclaimers
Any use of trade, firm, or product names is for descriptive purposes only and does not imply endorsement by the U.S. Government.
Although this information product, for the most part, is in the public domain, it also may contain copyrighted materials as noted in the text. Permission to reproduce copyrighted items must be secured from the copyright owner.
Suggested Citation
Griffiths, R.E., Topping, D.J., Leonard, C., and Unema, J.A., 2023, Resurvey of cross sections on the Yampa and Little Snake Rivers in Lily and Deerlodge Parks, Colorado: U.S. Geological Survey Open File Report 2023–1070, 12 p., https://doi.org/10.3133/ofr20231070.
ISSN: 2331-1258 (online)
Study Area
| Publication type | Report |
|---|---|
| Publication Subtype | USGS Numbered Series |
| Title | Resurvey of cross sections on the Yampa and Little Snake Rivers in Lily and Deerlodge Parks, Colorado |
| Series title | Open-File Report |
| Series number | 2023-1070 |
| DOI | 10.3133/ofr20231070 |
| Publication Date | January 22, 2024 |
| Year Published | 2024 |
| Language | English |
| Publisher | U.S. Geological Survey |
| Publisher location | Reston, VA |
| Contributing office(s) | Arizona Water Science Center, Southwest Biological Science Center |
| Description | v, 12 p. |
| Country | United States |
| State | Colorado |
| Online Only (Y/N) | Y |