

Southern (California) Sea Otter Population Status and Trends at San Nicolas Island, 2020–2023
Links
- Document: Report (11 MB pdf) , HTML , XML
- Download citation as: RIS | Dublin Core
Acknowledgments
This study was done in partnership with the U.S. Fish and Wildlife Service and the U.S. Navy, with assistance from the California Department of Fish and Wildlife and the Monterey Bay Aquarium. We thank the U.S. Navy for funding and facilitating this research project. We also thank the following numerous field observers throughout the 2020–2023 sea otter surveys at San Nicolas Island, California: (in alphabetical order) Heather Barrett, Lilian Carswell, Sarah Espinosa, Leilani Konrad, Sophia Lyon, Karl Mayer, Thomas Murphey, Greg Sanders, Elizabeth Seacord, and Colleen Young. We are grateful to Tim Tinker, Lilian Carswell, and John Ugoretz for contributing to the study design and the inception of this project, to James Estes who established the sea otter monitoring program at San Nicolas Island, and to Grace Smith, Claudia Makeyev, Greg Sanders, and Elizabeth Seacord for facilitating the continuation of this project over time. This report was greatly clarified and improved by thoughtful comments and suggestions made by David Douglas and Lilian Carswell.
Abstract
The population of southern sea otters (Enhydra lutris nereis) at San Nicolas Island, California, has been monitored annually since the translocation of 140 southern sea otters to the island was completed in 1990. Monitoring efforts have varied in frequency and type across years. In 2017, the U.S. Navy and the U.S. Fish and Wildlife Service initiated a southern sea otter monitoring and research plan to determine the effects of military readiness activities on the growth or decline of the southern sea otter population at San Nicolas Island. The southern sea otter is the only subspecies of sea otter in California (hereafter, “sea otter"). The monitoring program, at its basic level, includes seasonal surveys of population abundance, distribution, and foraging activity. From 2020 to 2023, we measured a 10-percent per annum increase in population abundance (95-percent confidence interval =0–20 percent), with 146 total individuals as of April 2023. Coinciding with the recent population growth, the sea otter distribution, which previously tended to concentrate on the island’s west end during 2003–2006 before shifting toward more use in the north and south sides during 2017–2019, appears to have shifted again during 2020–2023 to concentrate at the island’s east end. Forage data were collected between February 2020 and April 2023. There was a total of 773 forage dives in 60 forage bouts, with most of the identified prey on successful dives (n=401) recorded as sea urchins (66 percent), followed by bivalves (15 percent), snails (12 percent), and crabs (5.2 percent). Two lobsters and three abalone also were identified among the sea otter prey. Estimates of energy intake rates averaged 14.0 kilocalories per minute (95-percent confidence interval =10.8–17.2 kilocalories per minute). Monitoring data from the past two decades indicate that sea otters at San Nicolas Island have maintained a steady pattern of energy intake and population growth characteristic of a robust population, including a sixfold growth between 2000 and 2023. There was no conclusive evidence of density-dependent effects based on these patterns; however, estimates of energy intake rates for 2020–2023 were slightly lower than previous estimates from 2017 to 2019. Additionally, subtidal monitoring results at four sites around San Nicolas Island indicated that counts of purple sea urchins (Strongylocentrotus purpuratus) have increased between 2003 and 2023, whereas sea otter foraging surveys completed during the same period revealed that some sea otters have shifted toward higher consumption of purple sea urchins and bivalves compared to red sea urchins (S. fransicanus), which generally are the preferred larger prey of sea otters. These results contribute to the understanding of population dynamics and to the conservation and planning of future monitoring and research of sea otters at San Nicolas Island.
Introduction
The southern sea otter (Enhydra lutris nereis), also known as the California sea otter, is a subspecies of sea otter (E. lutris) native to California. Before the fur trade of the 18th and 19th centuries, sea otters were estimated to range from 150,000 to 300,000 individuals along the continental shelf of the northern Pacific Ocean from Japan through Mexico (Bodkin, 2015). Sea otters were extensively hunted for their fur during that period and were nearly extinct by the time of their protection under the North Pacific Fur Seal Treaty of 1911. The California population was believed to be extirpated until a remnant group of about 50 southern sea otters was discovered near Big Sur, California. The population of southern sea otters is listed as threatened under the Endangered Species Act of 1973 (ESA) and considered depleted under the Marine Mammal Protection Act of 1972 (MMPA). The surviving California population of sea otters gradually increased in range and number, reaching about 1,500 individuals by the mid-1980s. However, concerns remained about the survival of this population because of the narrow range of its habitat, particularly if an oil spill were to occur. The U.S. Fish and Wildlife Service (USFWS) developed a program to reintroduce as many as 250 southern sea otters to San Nicolas Island (SNI), California, as a reserve population (USFWS, 2012). Despite the translocation of 140 southern sea otters between 1987 and 1990, fewer than 20 sea otters were counted at SNI for nearly a decade thereafter (table 1). Most of the translocated animals disappeared, but many returned to the mainland population, and some moved to and stayed in other areas (Rathbun and others, 2000; Hatfield 2005). From the beginning of the translocation, the USFWS and later the National Biological Survey and U.S. Geological Survey (USGS) monitored the status and trends of the SNI population. Spring and fall surveys were done in all years, with the spring survey at SNI taking place within a few weeks of the mainland California sea otter census; as many as four surveys were done at SNI in some years.
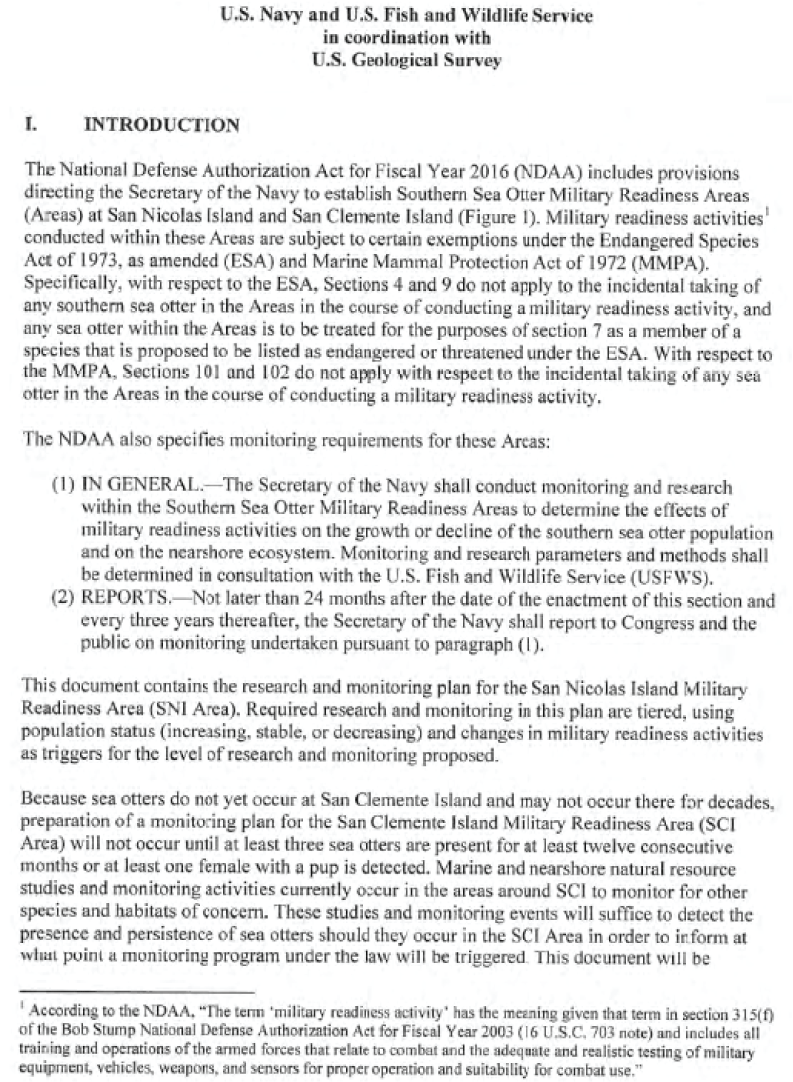
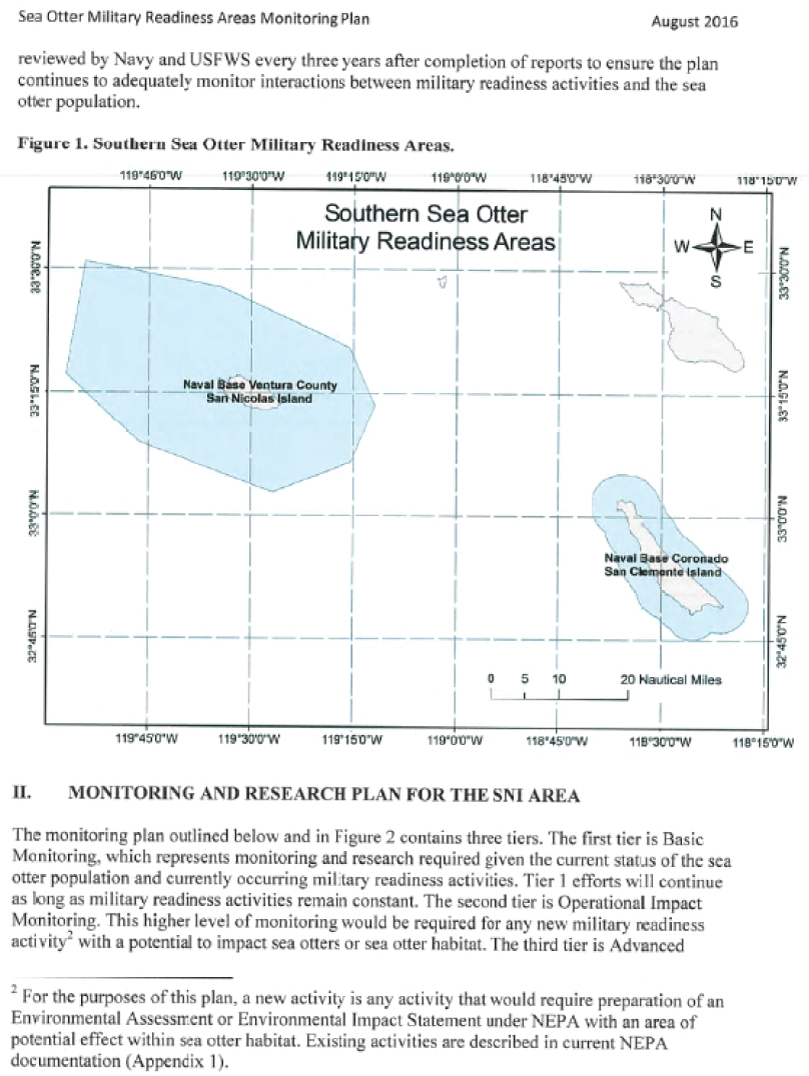
The U.S. Navy (USN) owns SNI and supported the translocation of southern sea otters to the island with a provision that defense-related actions were exempt from ESA consultation requirements (Public Law 99-625). After the USFWS declared the translocation program a failure in 2012, additional provisions for military readiness activities were legislated through the National Defense Authorization Act (NDAA) for Fiscal Year 2016. As required by the NDAA, the USN and the USFWS, in coordination with the USGS, developed a monitoring and research plan for the study of southern sea otters in the military readiness areas of SNI and San Clemente Island, which are among the California Channel Islands (appendix 1). The southern sea otter is the only subspecies of sea otter to occupy California (hereafter, “sea otter”). Of the two islands, sea otters are currently (2023) only known to occupy SNI. Consequently, all monitoring efforts within this research program were focused at SNI.
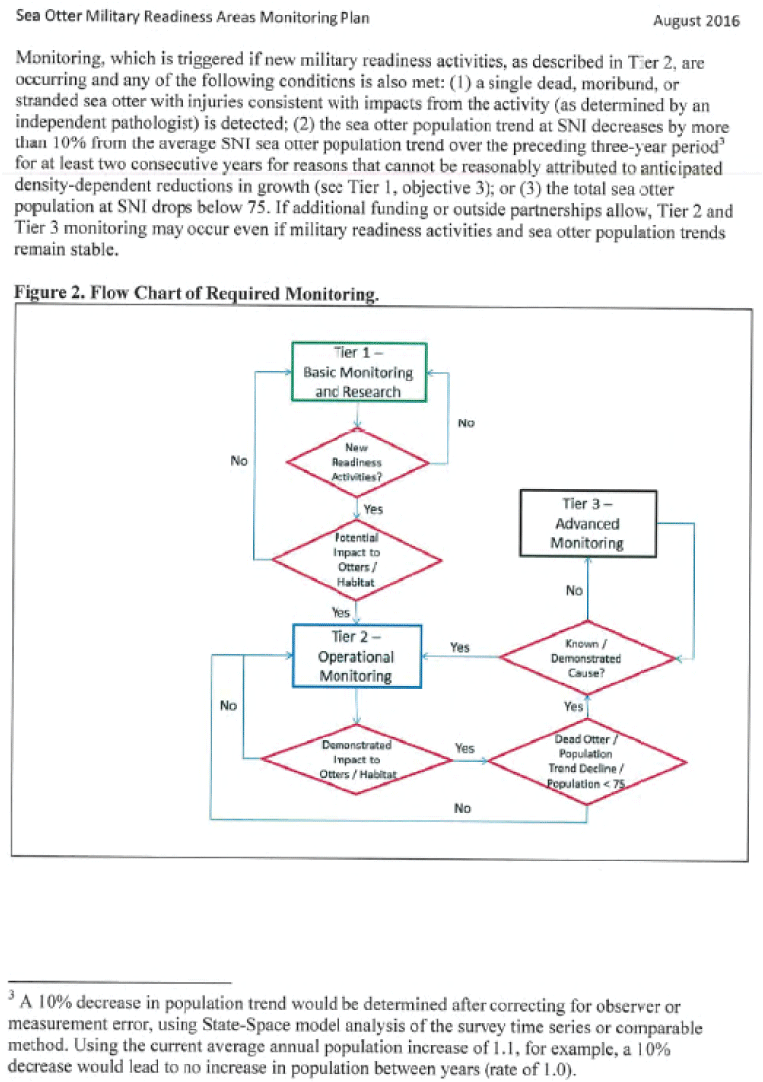
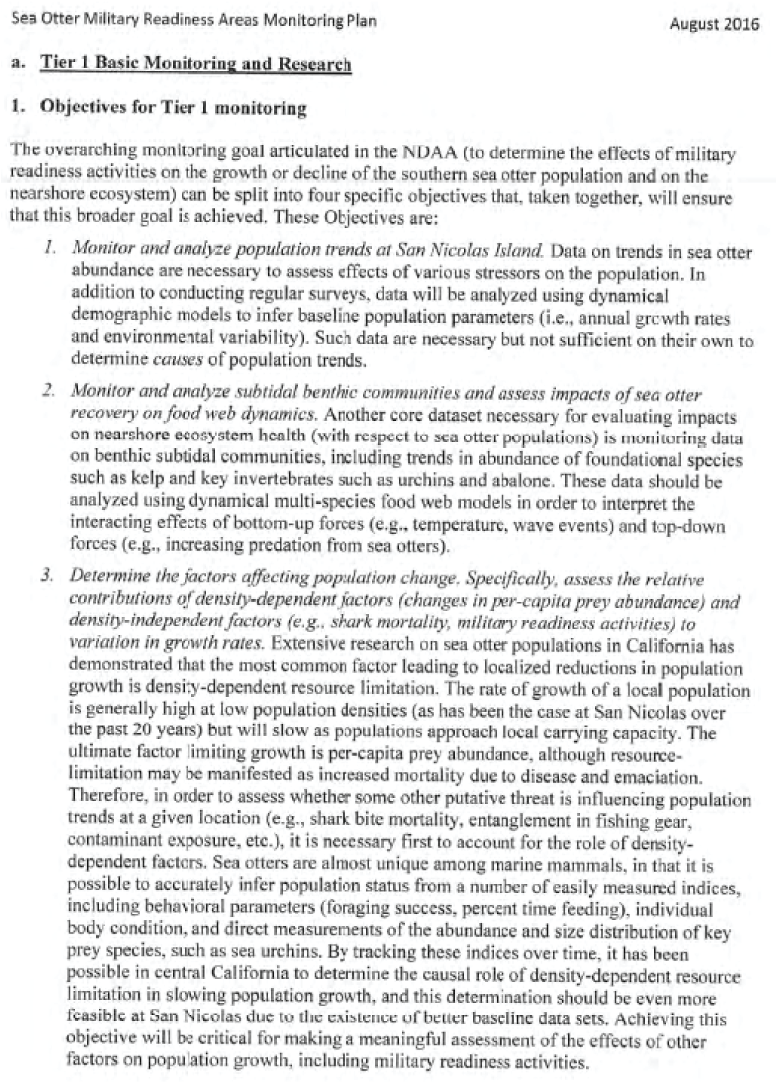
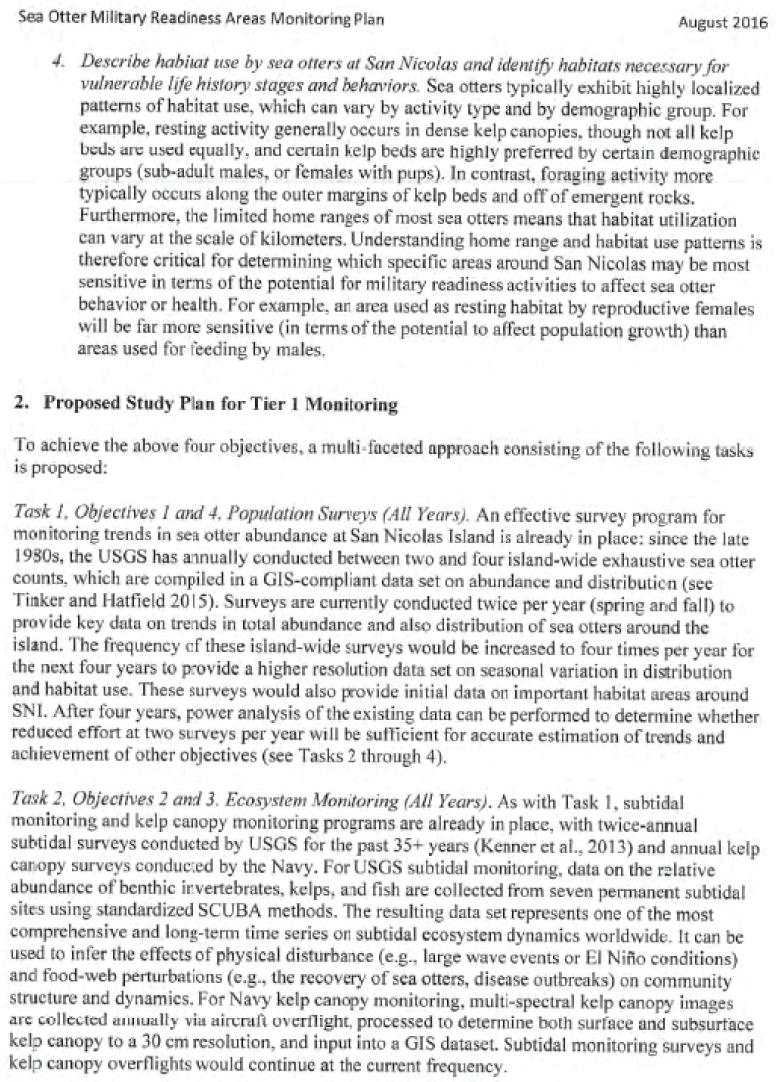
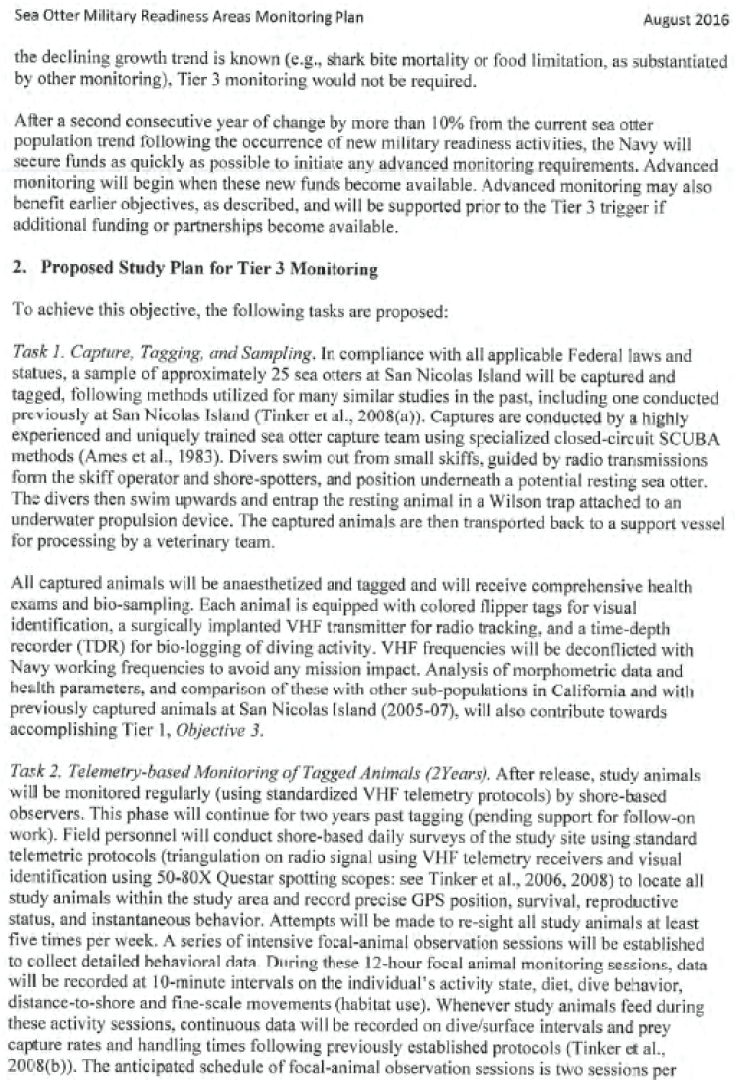
The military readiness area monitoring and research plan aims to “monitor interactions between military readiness activities and the sea otter population” (appendix 1). The plan defines three tiers of monitoring in order of increasing responsiveness to triggers that can indicate an effect to the SNI sea otter population from military readiness activities. The population is currently (2023) monitored in accordance with tier 1 (“basic monitoring and research”), in which the objectives are to (1) monitor and analyze population trends at SNI; (2) monitor and analyze subtidal benthic communities and assess effects of sea otter recovery on food dynamics; and (3) determine factors affecting population change, including relative contributions of density-dependent factors (changes in per-capita prey abundance) and density-independent factors (for example, shark mortality or military readiness activities) to variations in growth rates. The plan prescribes a strategy in which any new military readiness activities that could affect sea otters would trigger increased (tier 2) monitoring (“operational monitoring”). Additional (tier 3) monitoring (“advanced monitoring”) is triggered if, in addition to new military activities, one of the following three events occur: (1) a dead moribund or stranded sea otter is found with injuries consistent with military activities; (2) the population trend decreases by more than 10 percent from the average trend during the preceding 3-year period for at least 2 consecutive years for reasons unattributable to density dependence; or (3) the total sea otter population drops below 75. As of August 2023, tier 2 and tier 3 responses have not been triggered.
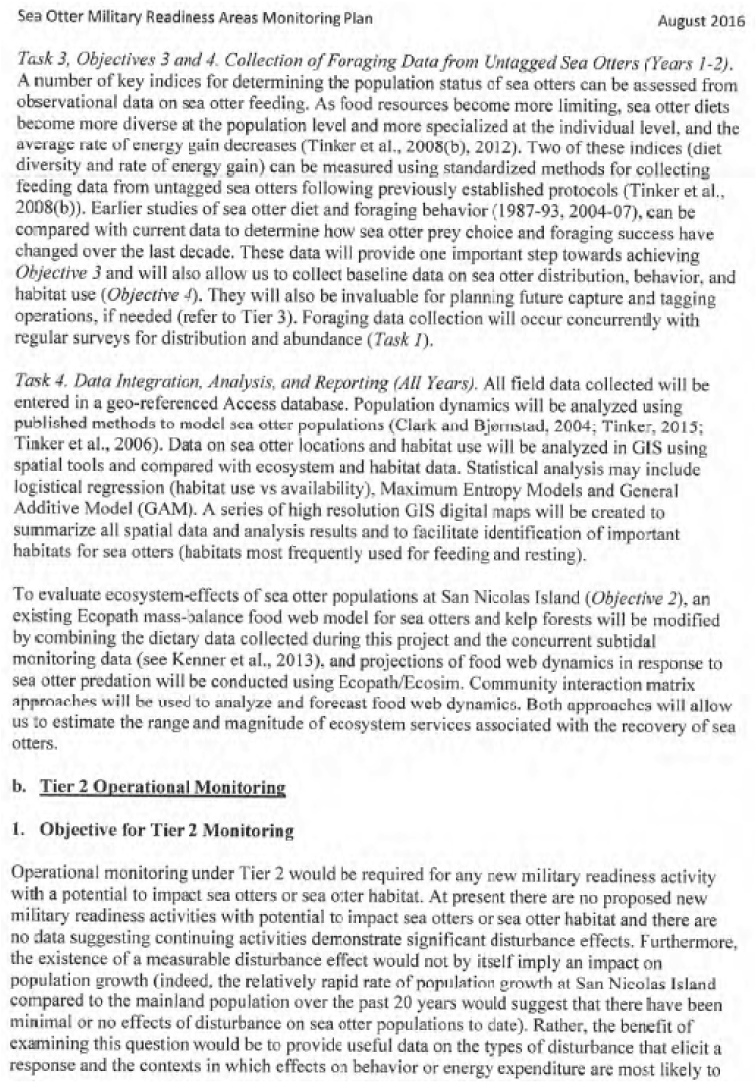
The USGS addresses the objectives of tier 1 by doing seasonal sea otter population and foraging surveys and semi-annual subtidal surveys of the kelp habitat community consistent with long-term monitoring programs and by developing quantitative models that describe patterns of population change in relation to environmental variables. This report presents information and analyses of data collected from February 2020 through April 2023 and is an update to an earlier report (Yee and others, 2020) that covered the seasonal sea otter surveys from February 2017, the time of initiation of the military readiness area monitoring plan, to February 2020. New information collected by the long-term subtidal kelp monitoring program is presented in a separate report (Kenner and Tomoleoni, 2021). Herein, we evaluate sea otter population abundance, distribution around SNI, and foraging activity, and we compare those findings to those from previous survey periods, 2003–2006 and 2017–2019, when comparable types of monitoring were done. We present sea otter density maps with annual imagery snapshots of kelp distribution around SNI. We also analyze foraging success, including prey compositions and energy intake.
Kelp beds are underwater thickets of a type of large brown algae that provide habitat and food resources for a community of fish and invertebrate species, including sea urchins (Strongylocentrotus), snails, and other species that provide forage for sea otters. Kelp forests are a type of kelp bed in which certain kelp species, such as giant kelp (Macrocystis pyrifera), grow to form tall underwater forest structures that support the associated community. Kelp canopy refers to the blades or fronds of multiple kelp plants when they form a layer near the water’s surface that shades the ocean bottom and is visible from above water. Kelp canopy that has emerged at the water’s surface, also known as surface kelp, is where sea otters typically concentrate when resting; however, sea otters also can be found away from canopies. In this report, we use the terms “kelp beds” for historically persistent kelp and probable areas of sea otter distribution, “kelp forests” when referencing subtidal surveys of species in kelp communities at permanently marked transects where kelp forests have historically occurred, “kelp canopy” when describing kelp at or near the surface where it is visible from above water, and “surface kelp” when referencing areas with kelp on the water surface where it is associated with resting sea otters.
Methods
In this section, we describe the protocols used at SNI to survey and analyze sea otter population abundance and spatial distribution, the subtidal kelp forest ecosystem, and sea otter foraging activity and outcomes. For summary and descriptive purposes, we divided the nearshore habitat surrounding SNI into nine survey areas grouped into four sections (fig. 1): (1) west end (areas 1–3), (2) north side (areas 4–6), (3) east end (area 7), and (4) south side (areas 8–9). Area 3 is completely offshore between areas 1 and 2 and nicknamed “The Boilers” for an expansive rocky outcrop with kelp beds 2–3 kilometers from shore that give the illusion of boiling water. Sea otter surveys were done in all nine areas, whereas subtidal surveys of kelp forests were done at four sets of permanently marked transects, with one set done in each of the four sections (area 1 on the west end, area 5 on the north side, area 7 on the east end near Daytona, and area 8 on the south side near Dutch Harbor).
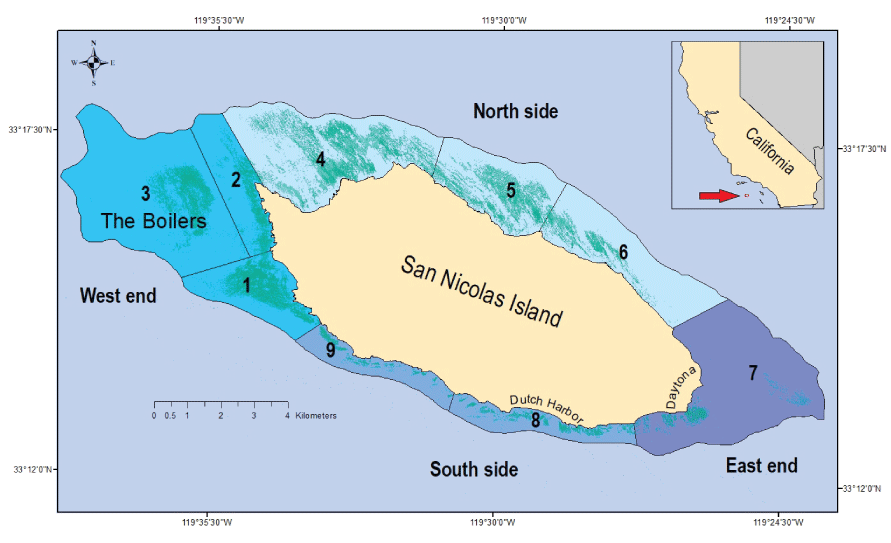
Sea otter habitat within a 30-meter isobath around San Nicolas Island, California. Sea otter counts are tallied into nine naturally distinct and contiguous survey areas numbered from 1 to 9 and grouped into four sections (blue shades). Mapped kelp canopies (shaded dim green) are derived and merged from aerial imagery taken in the fall seasons of 2017–2019.
Population and Distribution Surveys
From 2017 through 2023, winter surveys of sea otters were done in early to mid-February, spring surveys in mid to late April, summer surveys in July, and fall surveys in late October to early December (as weather conditions and island access permitted). Seasonal surveys were suspended from spring 2020 through spring 2021 due to limited access of USGS personnel to the island during the coronavirus disease 2019 (COVID-19); only one fall survey was completed in December 2020, and it was done with a reduced survey team. Seasonal surveys were resumed in summer 2021 and have continued uninterrupted to 2023, except for the winter 2023 survey, which was cancelled after strong storms caused extended road closures and poor overall survey conditions.
Surveys were completed following similar protocols as the annual range-wide southern sea otter census in California (Hatfield and others, 2019), with the exception that an experienced observer surveyed alone at SNI (whereas a principal observer usually surveys with an assistant during the mainland range-wide census), and there were usually two or three attempts to count the entire island on different days of the survey trip. For each survey day, each observer was assigned to a section of the island spanning one or more of the nine survey areas (fig. 1). Each observer was equipped with a high power 50–80X spotting scope (Questar Inc., New Hope, Pennsylvania) and binoculars (10X). The observers started at one end of their assigned section and selected an observation point that provided good vantage of a viewable segment of habitat. In most cases, observers used the same counting locations year after year, for consistency. The observers scanned the segment with unaided eye and with binoculars for sea otters or objects that were suspected to be sea otters. Large groups, distant areas, and suspicious objects were scanned with the spotting scope. After sufficient time elapsed (15–30 minutes, depending on viewing conditions and extent) to make a thorough count of all sea otters in the first surveyed segment of habitat, the observer moved to another location that provided good viewing of the next segment of habitat, contiguous with the first segment. This process was repeated until the entire section was counted.
All sea otter observations were marked as “points” directly onto paper field maps, using the area’s primary stationary features, such as the shoreline and offshore rocks, for spatial reference. Kelp canopies from an earlier year also were displayed on the maps for use as secondary reference features due to their tendency to persist; however, kelp contracts, expands, and shifts across months and years, making the kelp distributions somewhat less reliable than stationary features for marking the precise locations of sea otters for comparisons across surveys. The kelp features, however, allowed sea otter locations to be mapped relative to all available visual cues within the same survey, which reduced the chances of double-counting or undercounting when the observer moved to the next observation point.
To minimize double-counting or detection biases because of sea otter movements, each total island count included surveys of all nine areas of the island on one survey day. In addition to the sea otter locations, other data recorded directly onto the maps included the number of independent sea otters, number and relative age of pups (pups are classed as either small or large depending on the presence or absence of natal pelage, relative size, and behavior), behavior (resting, foraging, or other), group size, and micro-habitat type (open water or kelp). Time and general survey conditions also were recorded. Viewing conditions were rated from excellent to poor (coded 4=excellent, 3=very good, 2=good, 1=fair, 0=poor), and survey trips were done when fair or better conditions could be anticipated. Shore-based surveys are estimated to detect about 90–95 percent of the sea otters located in the nearshore area (Estes and Jameson, 1988), but distances exceeding 1-kilometer (km) offshore and factors such as viewing conditions, sea otter grouping, and behaviors can influence detectability. Surveys were repeated on multiple days during each seasonal survey trip to SNI, and the maximum single-day total was taken as the island-wide count to minimize undercounting due to detection biases.
Ecosystem Monitoring
Underwater divers performed subtidal monitoring of kelp forest species community composition at four sets of permanently established transects at SNI (areas 1, 5, 7, and 8) semi-annually in April and October in most years since October 1980. Information on these surveys through fall 2019 are reported in detail in Kenner and Tomoleoni (2021). Subtidal kelp forest monitoring was suspended in 2020 and 2021 due to the COVID-19 pandemic, was partially resumed in 2022, and was fully resumed by spring 2023. Because sea urchins are a primary prey item of sea otters, we examined the subtidal counts of red sea urchins (Strongylocentrotus franciscanus) and purple sea urchins (S. purpuratus) and compared their patterns during the same periods as the sea otter surveys.
In addition to subtidal kelp forest monitoring, we obtained multi-spectral digital island-wide imagery of the survey areas around SNI annually (during fall 2014 through 2019 and 2022). This work was contracted by the U.S. Navy and collected from aircraft by the Ocean Imaging Corporation (http://www.oceani.com). The digital imagery was recorded with 0.2 meter and 1.0 meter resolution as red, green, blue, and near-infrared bands, and pixels were subsequently classified into exposed or submerged giant kelp (Macrocystis pyrifera) canopies based on supervised learning algorithms. We obtained the georeferenced aerial imagery and kelp classifications in raster and shapefile format and used them with geographic information systems (GIS) to develop maps of sea otter distributions relative to areas with kelp canopy.
Foraging Surveys
Sea otter foraging data were collected during the same seasonal trips as the sea otter population surveys, opportunistically during the times that were not already dedicated to those population surveys. Observation methods followed well-established protocols (Estes and others, 1981; Ralls and others, 1995; Tinker and others, 2008). Field observations were done during daylight hours by teams of 1–2 observers that searched for foraging sea otters near enough to shore that they could be visually distinguished from other sea otter individuals. The sea otters were monitored using a 50–80X spotting scope. Foraging bouts, which are defined as contiguous sequences of feeding dives made by a focal sea otter, were observed until data from at least 20 dives in the bout were recorded or until visual contact with the focal sea otter was lost. The information recorded during these bouts included location, date and time, duration of the subsurface dive interval (dive time) and the post-dive surface interval (surface time) for each feeding dive (in seconds), outcome of each dive (in other words, whether or not prey was captured), species of prey captured, number and size of prey items, per-item handling time (number of seconds required to handle and consume each item), whether or not tools were used to handle the prey, and ambient conditions (including sea-state, wind, and so forth). Prey size was recorded as the estimated diameter of the shell or maximum body dimension (excluding appendages) and categorized into 5-centimeter incremented size-classes. Each 5-centimeter increment represents one typical sea otter paw-width and was subdivided further into thirds within that size-class for increased precision. For observations where prey could not be reliably identified to species, the items in question were assigned to the lowest possible taxonomic unit. Any items that could not be reliably categorized to any taxonomic level were listed as unknown prey, although size class and number of items were still recorded. Additional information recorded by observers included numbers of prey items that were carried over from a previous dive or stolen by or from the focal animal and, in the case of females with dependent pups, the amounts of these prey that were shared with the pups.
Analysis
Abundance and Trends
We graphically modeled trends in island-wide sea otter abundance using nonlinear regressions fitted by locally estimated sum of squares (LOESS). LOESS trends were fitted locally by the “geom_smooth” function of the “ggplot2” package in R statistical software using a default span of 0.75 of data observations (Wickham 2016; R Core Team, 2022). We used generalized linear models (GLM) on 3-year moving intervals to estimate variable rates of population growth across time beginning with the 1990–1993 interval and ending with the 2020–2023 interval. We modeled sea otter counts (, for year ) within each interval by fitting a linear trend where replicate counts vary according to an overdispersed Poisson model with mean and variance . The multiplier () in the variance represents an overdispersion factor, in other words, the amount by which the variance of count data exceeds that of a standard Poisson distribution, in which both the mean and the variance are (McCullagh and Nelder, 1989). We used the estimated slope coefficient () to calculate and test multiplicative rates of annual change in population size, , based on the mathematical equivalence between and the ratio in expected counts between two consecutive years, that is, . For the 2017–2023 years, we included replicate counts from all available seasons (, for season ) and tested for seasonal differences in island-wide total counts. We calculated the pup-to-independent ratio by summing the counts of sea otter pups across surveys and dividing by the corresponding sum of counts of independent sea otters, and we multiplied this ratio by 100 to derive an index of the number of sea otter pups per 100 independent sea otters. We used R statistical software to complete all statistical analyses and the “ggplot2” package to create graphics (Wickham 2016; R Core Team, 2022).
Distributions
We used ArcGIS software (Environmental Systems Research Institute, Inc., Redlands, California) to illustrate and interpret the spatial distribution of sea otter locations around San Nicolas Island for the years 2020–2023 and to compare it with the previous period (2017–2019). We used GLM to statistically test for changes in distributions for the periods 2017–2019 and 2020–2023, among years within periods, and among seasons. We also tested for interaction effects. We modeled spatial distributions by aggregating sea otter locations from the high-count dates across multiple survey trips, and we used kernel density estimation techniques with a 2-km smoothing parameter to model spatially explicit estimates of relative sea otter density. We evaluated this density for the aggregation of nine seasonal surveys from February 2020 through April 2023, and we compared this density to that of 12 seasonal surveys completed in the previous period from February 2017 through November 2019. We used descriptive bar charts and circular charts that represent the periphery around SNI to analyze changes in sea otter distributions among the nine areas. For statistically analyzing changes in distribution, we aggregated the areas into four sections of the island (west end, north side, east end, and south side) to ensure adequate sample sizes within each area category, and we used GLM to test for significant changes in distributions among years and seasons.
Foraging
We categorized foraging data into years (2020–2023), seasons (winter, spring, summer, and fall), and sex (males, females, and unknown) and report foraging outcomes by these categories. We also examined prey composition within these categories in terms of the proportion of items within eight prey classes: (1) abalone, (2) bivalves, (3) crabs, (4) lobsters, (5) octopus, (6) snails, (7) urchins, and (8) other. However, for comparisons with the years of the previous periods, 2003–2006 and 2017–2019, sample sizes of the forage data collected from 2020 through 2023 were too small to calculate reliable estimates of prey composition and energy intake rates separately by year, and we combined all forage data from the years 2020–2023 for those comparisons. To obtain quantitative measures of the composition of various prey species and energy intake rates (kilocalories per minute), field counts of prey capture frequency and prey shell diameter were converted to estimates of consumed biomass and caloric content using species-specific formulas for converting prey diameter to wet edible biomass and kilocalories per gram (Oftedal and others, 2007). These data were then analyzed using a Monte-Carlo simulation procedure to estimate diet composition (in terms of the proportion of consumed biomass contributed by each prey group) and rate of energy gain or kilocalories consumed per minute of feeding (Tinker and others, 2008). The Monte-Carlo procedure incorporates sampling uncertainty and adjusts for recognized biases associated with direct observations of sea otter foraging; a detailed description of the algorithm is provided elsewhere (Tinker and others, 2012; Tinker, 2015). We also used the Shannon-Weiner index to compare diet diversity between the 2020–2023 period and the previous 3 years (from 2017 to 2019; Tinker and others, 2008).
Finally, during 2003–2023, we examined long-term trends in the abundance of sea urchins, which are a primary prey item of sea otters, at four sites around SNI where subtidal monitoring was done (Kenner and Tomoleoni, 2021). We estimated overall trends in red sea urchins and purple sea urchins, separately, by using the “lme4” package in R statistical software to fit linear mixed effects models on log-transformed urchin counts in relation to year, with random site effects to account for variations among sites (Bates and others, 2015; R Core Team, 2022).
Results
Abundance and Trends
Shortly after the translocation of 140 sea otters to SNI from 1987 to 1989, most of those sea otters disappeared from SNI, leaving a population of fewer than 20 sea otters during most of the first decade (table 1). However, this population had gradually grown to exceed 100 individuals by the time of the spring 2016 survey and continued to exceed 100 individuals in all 14 surveys from fall 2018 through spring 2023 (fig. 2). Current survey estimates average about 150 total individuals, which is a sixfold increase in the population since 2000 when sea otters numbered fewer than 25 (table 2; figs. 2, 3).
Table 1.
Count of independent sea otters and pups at San Nicolas Island, California, during spring surveys from 1990 through 2023. Spring surveys were cancelled during 2020 and 2021 due to the coronavirus disease 2019 pandemic restrictions.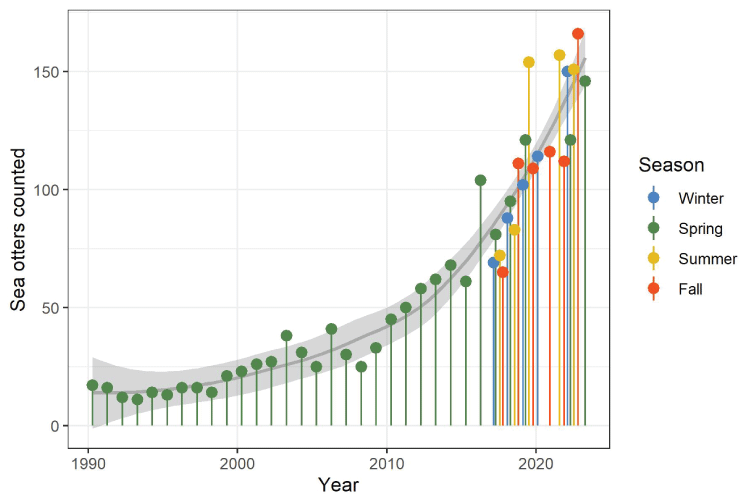
Number of sea otters counted at San Nicolas Island, California, during spring surveys from 1990 to 2023 (green pins) and seasonal surveys from 2017 to 2023 (multi-colored pins). Solid gray curve represents a smooth regression of the sea otter counts across years, fitted by the locally estimated sum of squares (LOESS) method and light gray-shaded by 95-percent confidence intervals. The LOESS regression was smoothed using a 0.75 proportion of the plotted data localized around each year.
Table 2.
Count of independent sea otters and pups at San Nicolas Island, California, during seasonal surveys from winter 2017 through spring 2023, by area.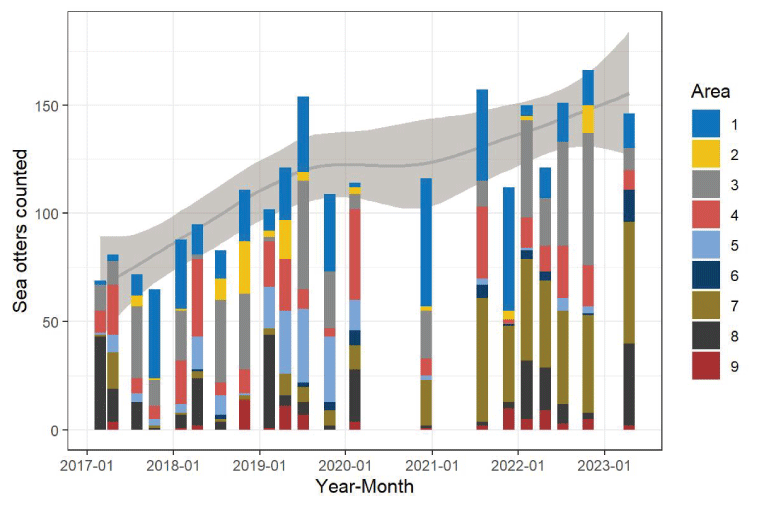
Number of sea otters counted at each of the 9 areas at San Nicolas Island, California, during 21 seasonal surveys from February 2017 to April 2023. Solid gray curve represents a smooth regression of the total sea otter counts in relationship to year, fitted by the locally estimated sum of squares (LOESS) method (gray line), and light gray-shaded with 95-percent confidence intervals. The LOESS regression was smoothed using a 0.75 proportion of the plotted data localized around each year. Count data are presented in table 2.
The sea otter count, as of the last spring survey in April 2023, was 146, which included 134 independents and 12 pups, and the estimated rate of population growth during the 2020–2023 period was (95-percent CI =1.00–1.20), corresponding to a 10-percent annual growth rate during this period (95-percent CI = 0–20 percent). Annual population growth rates varied during the past three decades, with about half of the estimates and 95-percent CI exceeding 1, representing statistically positive annual growth, with most growth occurring after 2010 (figs. 2, 4).
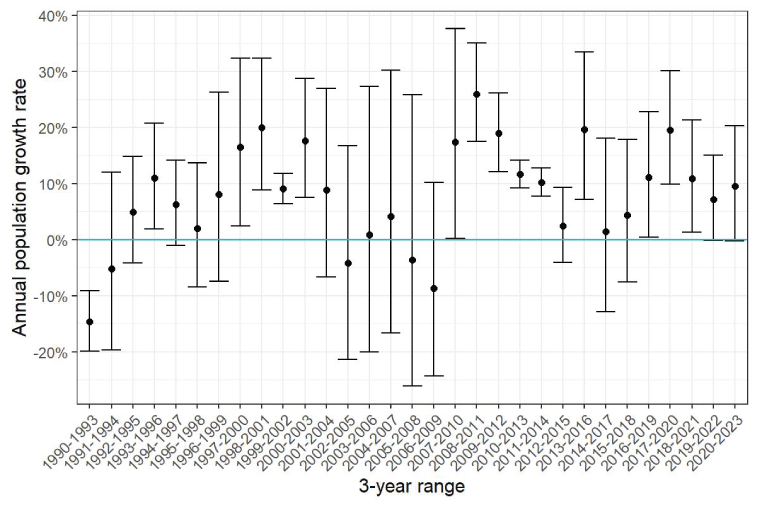
Estimated rates of annual population growth of sea otters at San Nicolas Island, California, during 3-year moving windows from 1990 to 2023, with 95-percent confidence intervals. Positive rates represent population growth, whereas negative rates represent population decline. Confidence intervals that overlap with 0 represent insufficient evidence to conclude growth or decline.
The pup-to-independent ratio for surveys in the 2020–2023 period was 8.8 pups to 100 independent sea otters, which was lower than the pup-to-independent ratio for surveys in the previous period (2017–2019; 12 pups per 100 independent sea otters). Lower pup ratios are associated with periods following larger rates of growth as more juveniles and subadults recruit into the pre-breeding population.
Densities and Distributions
We compared the densities and distributions of sea otters during surveys from the 2020–2023 period with those of the 2017–2019 period. Sea otter locations were aggregated across all surveys during each period to develop kernel density surfaces representing the relative density of cumulative counts (fig. 5). In these maps, sea otters appear to have shifted from concentrations distributed around the island, primarily at the west end (areas 1–3) and north side (areas 4 and 5) during 2017–2019, to a large concentration at the east end (area 7) during 2020–2023, leaving less dense concentrations in the west and northwest.
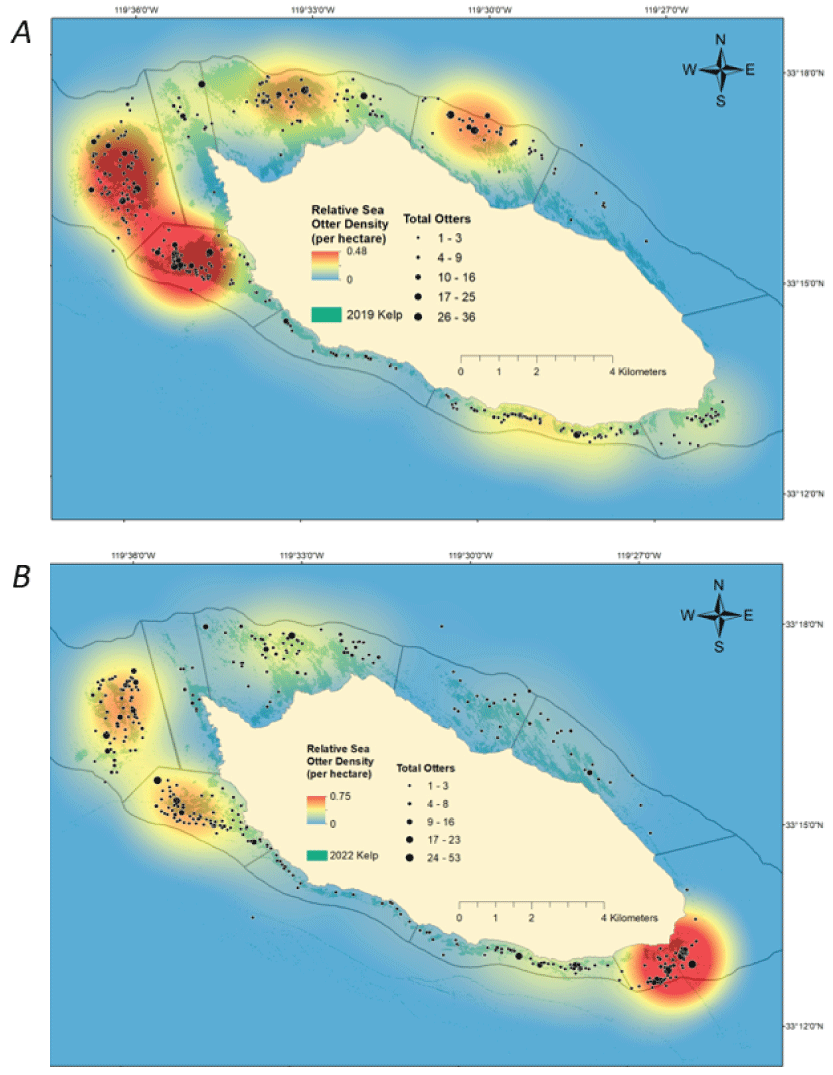
Relative sea otter density during seasonal surveys at San Nicolas Island, California, when combined from A, 2017 through 2019 (12 surveys); and B, 2020 through spring 2023 (9 surveys). Relative densities were spatially modeled using kernel density methods on the cumulative sea otters counted per hectare across surveys in each comparison period. Mapped kelp canopies (shaded dim green) are derived from aerial imagery taken in the fall seasons of 2019 and 2022.
The maps on figure 5 also display sea otter densities overlaid with kelp canopy distributions derived from aerial imagery collected during the last fall within each respective sea otter survey period. Surface kelp changes significantly over the seasons, with the maximum extent typically occurring in the fall. Kelp surveys were done once annually and were scheduled in the fall with the intent of capturing images of the maximum extent of kelp canopy for that year. After winter storms, the area of surface kelp is largely reduced, and the distribution changes seasonally. Thus, these kelp distributions are not strictly representative of where kelp beds were across the other seasons when sea otter surveys were done, but they are an indicator of where kelp beds had the most potential to be present.
Radial plots (also known as radar or spider plots) provide a graphical summary of the distribution of sea otters counted around the perimeter of the island (Bion, 2020; Nakazawa, 2023). The nine areas defined on figure 1 are arranged on circular plots in the general cardinal direction as they are oriented around the island (figs. 6, 7). Most of the population distribution, which was formerly concentrated on the island’s west end (areas 1 and 3), expanded and increased on the north and south side during 2017–2020 but has since concentrated more toward the southeast end (areas 7 and 8) during the past several years (fig. 7).
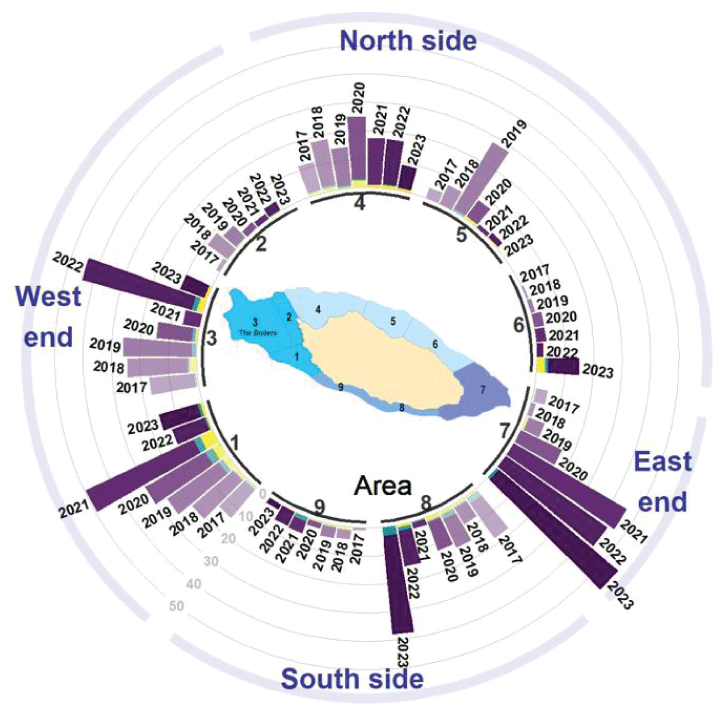
Average number of sea otters counted per year (2017–2023) at nine survey areas (see map inset for locations of numbered areas) around San Nicolas Island, California. Bars are grouped by area, color coded by age-size class (purple=adults, green=large pups, and yellow=small pups), and shades darken with later years (2017 is lightest and 2023 is darkest). Rotating clockwise around the cardinal directions of the island, starting at the southwest, areas 1, 2, and 3 represent the west end of the island; areas 4, 5, and 6 represent the north side; area 7 represents the east end; and areas 8 and 9 represent the south side.
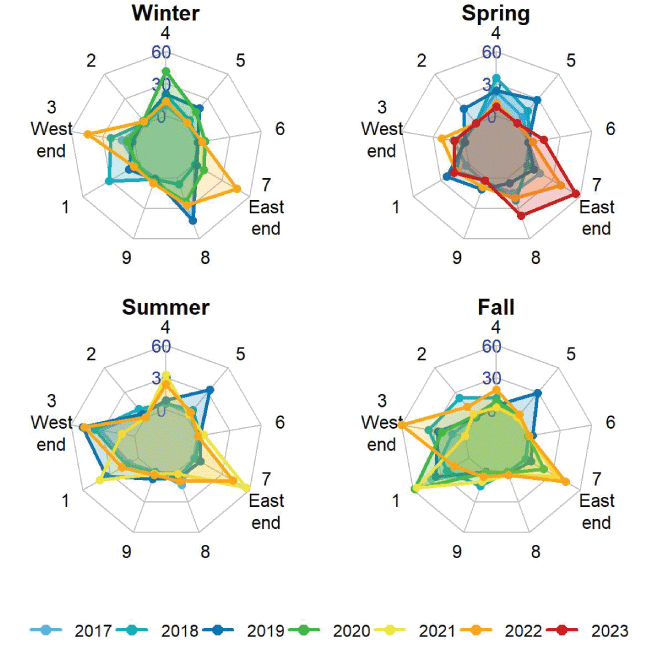
The abundance of sea otters around the periphery of San Nicolas Island, California, by season (winter, spring, summer, and fall), 2017–2023. Each plot displays the number of sea otters counted at nine areas around the island on the high-count date of each seasonal survey, for each year. The west end includes areas 1–3, with area 3 located between areas 1 and 2, and the east end consists of area 7. Concentric polygons represent a minimum count of 0 sea otters (inner polygon), a maximum count of 60 (outer polygon), and a middle value of 30.
Radial plots display the distribution of sea otter use around the island as it varied seasonally and by year (fig. 7). Areas 1 and 3, which include The Boilers, on the west end have consistently had among the largest sea otter counts in the summer and fall from 2017 through 2022. From summer 2019 through winter 2020, areas 4 and 5 combined had a visible spike in sea otter use, starting in area 5 and then shifting more to area 4. The south side of the island did not have much use except sometimes at area 8 near the east end (area 7) where sea otter use has increased from 2020 to 2023, mostly in the spring but also in the summer and fall. Area 6, which is on the eastern end of the north side, where there is almost no kelp, has had very few sea otters in all seasons and years.
Spatial density maps for each of the four seasons reflect these seasonal spatial distribution patterns in greater detail for the recent years (from 2020 through 2023; fig. 8). Sea otters continued to frequent areas at the island’s west end in all seasons and years. However, during 2020–2023, sea otters were observed to aggregate in higher concentrations near Daytona (in area 7 at the east end), notably in spring, summer, and fall, and they were observed near Dutch Harbor in area 8, on the south side in spring.
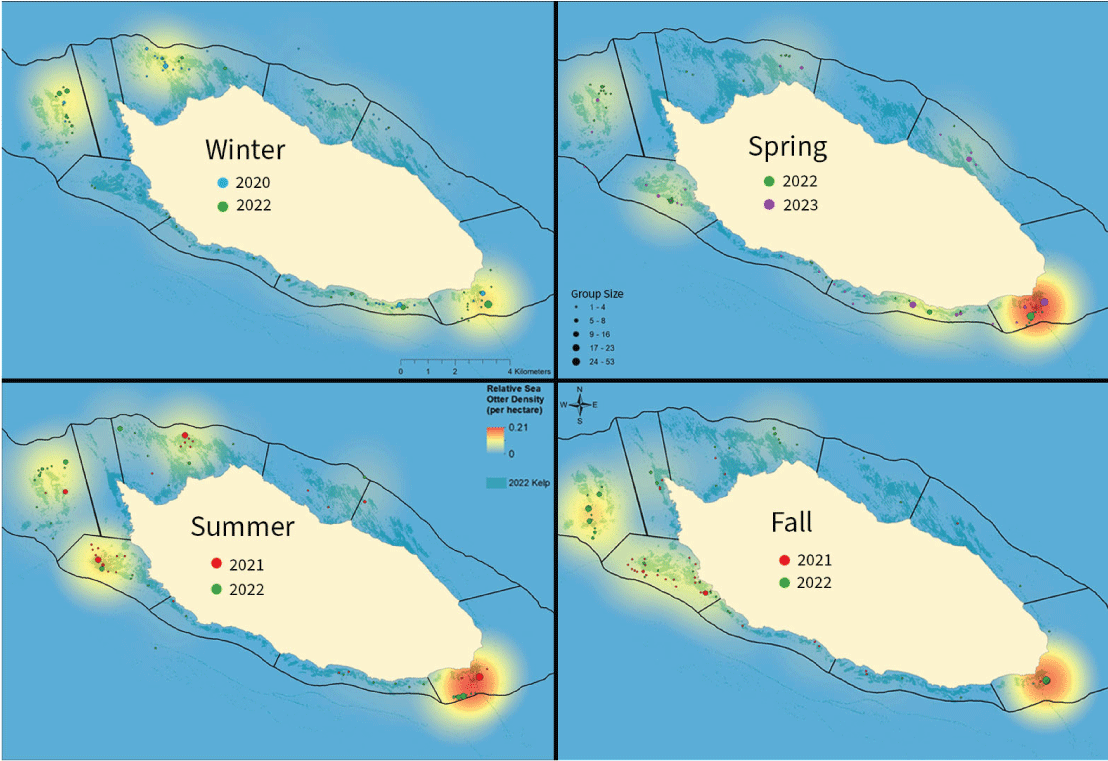
Seasonal distribution of relative sea otter density during surveys completed annually in winter (February), spring (April), summer (July), and fall (October/November) from 2020 to 2023, San Nicolas Island, California. Sea otter locations were aggregated across the two surveys for each season to develop kernel density surfaces representing the relative density of total counts distributed around the island. The same legends for group size and relative sea otter density apply to all seasons. Mapped kelp canopies (shaded dim green) are derived from aerial imagery taken in the fall season of 2022.
To estimate and test seasonal differences in the spatial distribution of sea otters generally, we aggregated sea otter counts within the west end, north side, east end, and south side sections (fig. 1). We detected significant differences in distribution among sections between the 2017–2019 and 2020–2023 periods (, ) and season (, ), but there was no significant evidence of trends among years within either of the two periods (, 0.15) or interaction effects between period and season (, ). Concentrations of sea otters were on the west end each season, in areas associated with historically persistent kelp, but concentrations tended to be lowest in winter or spring (figs. 8, 9). Despite indications that sea otter distributions expanded to both the north and south sides of the island during the 2017–2019 period, when the south side was formerly defined to include area 7 (Yee and others, 2020), there was little indication that this pattern of growth on the north side continued into the 2020–2023 period (figs. 5, 6, 7, 8). However, large concentrations of sea otters continued to persist and grow in area 7, herein referred to as “the east end,” and in area 8 of the south side during the 2020–2023 period (area 7; figs. 5, 6, 7, 8, 9).
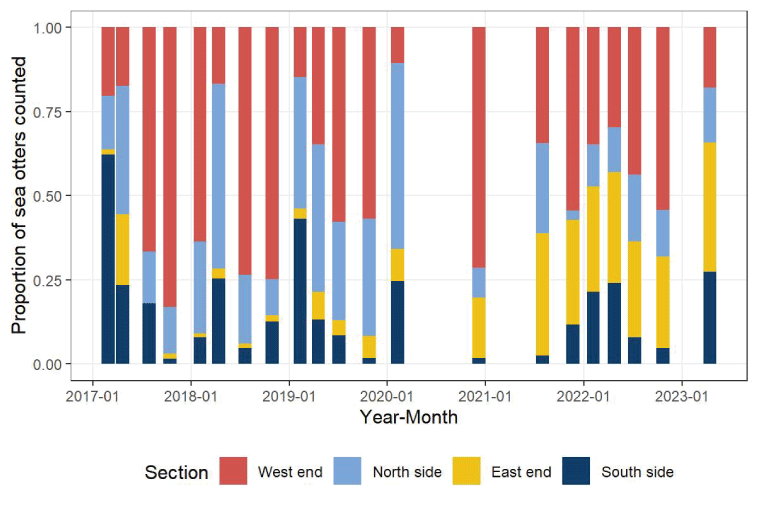
Proportional distribution of sea otters within four sections (west end=areas 1–3, north side=areas 4–6, east end=area 7, south side=areas 8–9) around San Nicolas Island, California, observed during seasonal surveys (winter, spring, summer, and fall) from winter 2017 through spring 2023.
Foraging
Sea otter foraging data were collected opportunistically as time and viewing conditions allowed. Consequently, the numbers of foraging observations varied by survey and location. A total of 60 sea otter foraging bouts were observed from winter 2020 through spring 2023, for a total of 773 diving observations (tables 3, 4). The amount of forage data collected from 2020 through spring 2023 was substantially less than that collected in the previous period 2017–2019 (2,581 dives) due to fewer surveys completed during the COVID-19 pandemic and sometimes poorer survey conditions. Most foraging bouts were recorded on the east end (70 percent) compared to the north side (18 percent), south side (7 percent), and west end (5 percent). Among all dives, 368 were observed on 21 female foraging bouts, 179 were observed on 15 male foraging bouts, and the remaining 226 were observed on 24 foraging bouts of unknown sex.
Table 3.
Number of sea otter foraging bouts surveyed by season, sex, age class, and section of San Nicolas Island, California, 2020–2023, summarized by year and for all years combined.Table 4.
Number of sea otter foraging dives observed by season and sex and diving outcomes at San Nicolas Island, California, 2020–2023, summarized by year and for all years combined.We classified identifiable prey species into taxonomic groups based on highest prevalence in the diet (urchins, bivalves, snails, crabs) or energetic content of less prevalent prey species (abalone, lobsters, octopus) and lumped all other species (other). Of the 587 successful dives observed during 2020–2023, 32 percent resulted in unidentified prey items (table 5). We used Monte-Carlo simulations to estimate the likely caloric values of unidentified prey based on partial data about the prey, such as their size and the lowest taxonomic level to which they could be identified. These simulations use empirical information about the likelihood of different prey species and the associated caloric values for their size class, based on the frequency with which specific species and sizes were identified in the data. This process enabled us to derive 95-percent confidence intervals to account for prey uncertainty. These simulations require robust sample sizes to provide sufficient information on prey. Because our foraging observations in the 2020–2023 period were fewer compared to those of previous years, we aggregated those data across years to calculate an average energy intake rate for the 2020–2023 period.
Table 5.
Number of successful dives with prey categorized into eight prey classes observed during foraging surveys at San Nicolas Island, California, 2020–2023.Sea urchins, including the red sea urchin (Strongylocentrotus franciscanus) and purple sea urchin (S. purpuratus), composed the majority (66 percent) of identified prey types among all successful diving outcomes, with the remaining successful diving outcomes comprised mostly of bivalves (15 percent), snails (12 percent), and crabs (5.2 percent; fig. 10). Three abalone, two lobsters, and one mollusk also were observed to be consumed (table 5). Bivalves comprised a larger proportion of prey in the 2020–2023 period than previously observed and were recorded for 61 dives from 11 bouts, including 1 bout where 21 rock jingles (Pododesmus macroschisma) and 3 clams were observed to be consumed and another 8 bouts where a total of 23 giant rock scallops (Crassodoma gigantea) were observed to be consumed.
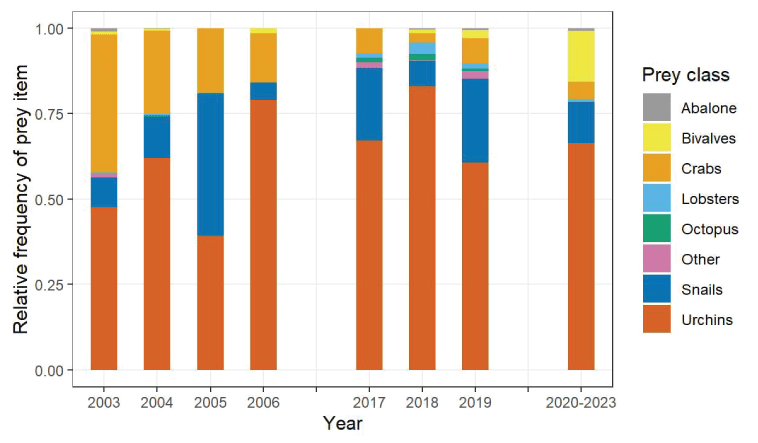
Relative frequency at which items from eight different prey classes were observed in sea otter diets during three periods of foraging surveys at San Nicolas Island, California, 2003–2006 and 2017–2019 (years shown individually and 2020–2023 years aggregated).
We examined the composition of sea urchin species, which is the most identified prey among successful sea otter foraging dives. Red sea urchins generally are larger (median diameter =53 millimeters, interquartile range [IQR; 25–75-percentile] = 41–65 mm) at SNI and thus have higher caloric value than purple sea urchins (median diameter =28 mm, IQR =21–36 mm; Kenner and Tomoleoni, 2020). Because sea otters are size-selective predators, they tend to prefer red sea urchins when larger size classes of red sea urchins are more available. As such, changes in the ratio of red to purple sea urchins consumed may correlate with prey availability. We inspected this ratio during the 2020–2023 period and compared it to ratios calculated annually from 2003 to 2006 and from 2017 to 2019 when similar sea otter foraging surveys were done at SNI. Results indicated a decreasing trend in the ratio of red to purple sea urchins consumed, detectable in 2017–2019, and pronounced by 2020–2023 (fig. 11).
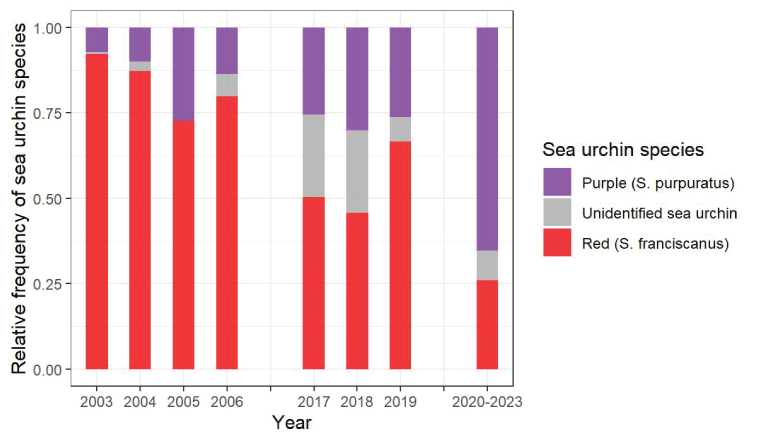
Relative frequency at which different species of sea urchins (Strongylocentrotus) were observed in sea otter diets during three periods of forage surveys at San Nicolas Island, California, 2003–2006 and 2017–2019 (years shown individually and 2020–2023 years aggregated).
Simulated estimates of energy intake rates averaged 14.0 kilocalories per minute (kcal/min; 95-percent CI =10.8–17.2) during 2020–2023. This estimated rate, slightly lower than the average rate that was previously estimated for 2019 (15.5 kcal/min; 95-percent CI =12.9–18.0), continues a declining trend of energy intake rate estimates beginning with 2017 (20.9 kcal/min; 95-percent CI =16.4–25.3; fig. 12; Yee and others, 2020); however, the confidence intervals of these estimates overlapped and did not conclusively indicate a decline. Dietary diversity trended positively from 2017 to 2018 and 2019 (Shannon-Weiner index [SWI] =0.67, 0.86 and 0.95, respectively), but this pattern of increase did not continue into 2020–2023 (SWI =0.81).
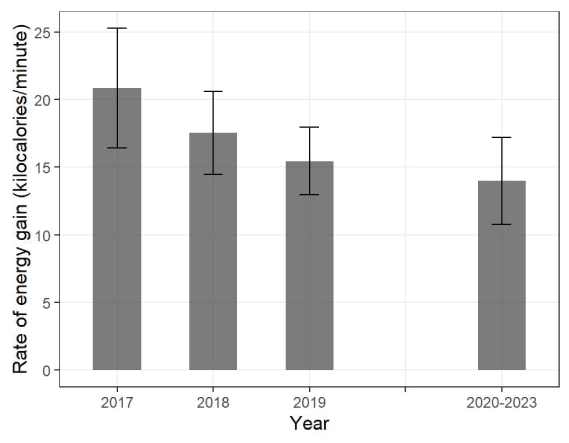
Rate of energy gain (kilocalories per minute with 95-percent confidence interval) for sea otters observed foraging during two periods of surveys at San Nicolas Island, California, 2017–2019 (years shown individually and 2020–2023 years aggregated).
Subtidal monitoring at four sites surrounding SNI following the methods of Kenner and Tomoleoni (2021) showed variations in abundance and trends of sea urchins, by site and by species (fig. 13). Counts of red sea urchins increased by 1–2 orders of magnitude at the west end site but decreased by the same degree at the Daytona site on the east end. Because of these site differences, we did not detect an overall trend in the abundance of red sea urchins (, ). However, purple sea urchins experienced larger and more substantial increases over time (, ) compared to red sea urchins, especially at the Daytona site in area 7 on the east end. Counts of purple sea urchins were larger than or close to those of red sea urchins across sites during the 2003–2006 period, when foraging survey results indicated that sea otters had consumed disproportionately high numbers of red sea urchins compared to purple sea urchins. However, by 2020–2023, purple sea urchins exceeded red sea urchins by 1–3 orders of magnitude across all sites, coinciding with the distributional shift of sea otters to the east end and the dietary shift toward higher relative consumption of purple sea urchins.
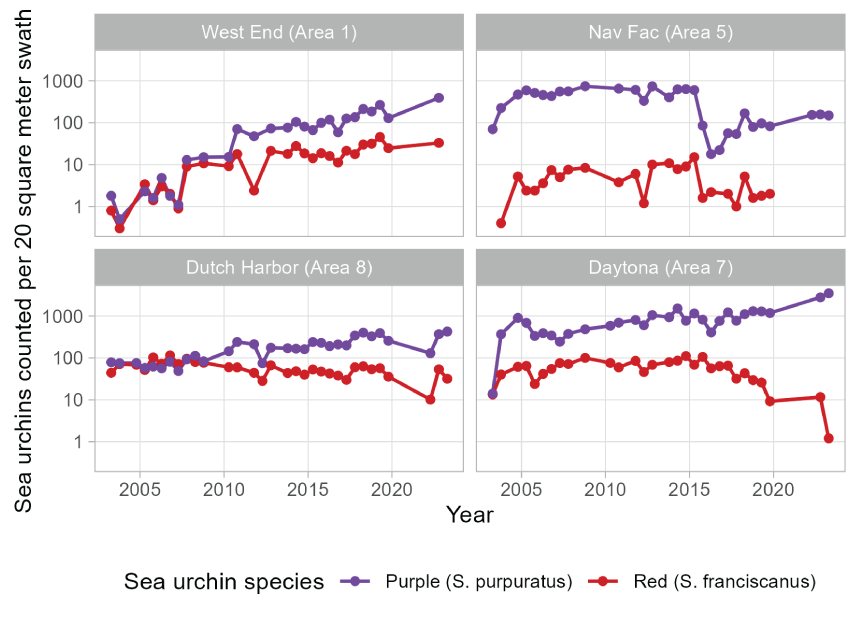
Trends in abundance of purple sea urchins (Strongylocentrotus purpuratus) and red sea urchins (Strongylocentrotus franciscanus; mean count per 20-square meter swath, shown on log scale) at four subtidal survey sites at San Nicolas Island, California, 2003–2023. Sites named “West End,” “Nav Fac,” “Dutch Harbor,” and “Daytona” are described by Kenner and Tomoleoni (2021) and located in areas 1, 5, 8, and 7, respectively. Zero red sea urchins were counted in spring 2022, fall 2022, and spring 2023 subtidal surveys at the Nav Fac site and do not appear on the log-scale plot.
Discussion
Changes in the abundance and distribution of SNI sea otters were evident between 2017 and 2023. Population size grew at an estimated rate of 10 percent per year (95-percent CI =0–20 percent per year) during the 2020–2023 interval. This estimate is significantly positive but somewhat lower than the 22-percent per year rate of growth at SNI that was previously estimated for the 2017–2020 interval (95-percent CI =11–34; Yee and others, 2020) as well as those for other recovering populations in the Aleutian Islands, Alaska, British Columbia, and Washington (17.2–25.9 percent per year), which are among the maximum growth rates that can be achieved by sea otter populations (19.6–23.7 percent per year)–theorized based on the reproductive rates, ages of reproductive activity, and average lifespan of females (Estes, 1990). The sea otter survey at SNI in April 2023 yielded a count of 146 individuals (table 2). Sea otter distribution, which was formerly concentrated on the west end of the island during 2003–2006, expanded by 2019 to include more use of the north and south sides and further shifted during 2020–2023 toward a new and seasonally persistent concentration on the east end of the island. The distribution of the remaining sea otters oscillated seasonally toward more use of the north and south sides during summer and then traveled back to the west end during fall (fig. 7). Because sea otters tend to rest in surface kelp and often forage underneath among the kelp holdfasts, seasonal changes in kelp are likely to be an important driver of the seasonal variations in sea otter distributions that we observed. However, information on kelp distribution is currently (2023) limited to images collected annually in the fall. Whether or not these seasonal variations are related to changes in kelp distribution, the recent population growth, or both, might be determined by additional studies, such as increased collection and analysis of seasonal kelp patterns and an examination of historical data to determine if these seasonal changes in sea otter distributions also occurred before the recent population growth.
There were indications that energy intake from foraging activity might have slightly changed during the past several years, but fewer foraging observations collected in 2020–2023 resulted in wider and less precise confidence intervals for estimating energy intake rates. We aggregated the foraging data to estimate an energy intake rate for the period of 2020–2023, and we compared this rate to previously estimated rates for the years of 2017 through 2019 to examine potential changes. Foraging habits are known to change as sea otter populations increase and food resources become more difficult to obtain, and these density-dependent processes can signal that a population is approaching carrying capacity (Estes and others 2003; Tinker and others 2008; Tinker and others, 2012; Tinker and others, 2019). A decline in energy intake rate in conjunction with an increase in population size would be expected for a population that is beginning to experience density-dependent effects. The rate we measured (14.0 kcal/min) for 2020–2023 continued a trend of decreasing rates from 2017 through 2019 based on foraging data collected at SNI during those years, but confidence intervals overlapped too widely to statistically conclude a decline had occurred. Furthermore, these rates are close to other rates typically observed with recently established and rapidly growing populations at sites considered to have abundant resources (12–20 kcal/min; Tinker and others, 2019, fig. 28). By comparison, the intake rates for long-established and stable or slowly growing populations at sites considered to be resource-limited are estimated to be less than 10 kcal/min, which was exceeded by the 95-percent confidence interval limits for the estimates of energy intake at SNI.
The shift in urchin prey from large energy-rich red sea urchins toward smaller purple sea urchins between 2003 and 2023 indicates that a shift in the availability of the two urchin species has likely occurred. Subtidal monitoring at four sites around San Nicolas Island have shown long-term patterns in urchin counts (Kenner and Tomoleoni, 2021). The counts of purple sea urchins at these sites were consistently higher than counts of red sea urchins, sometimes by one or two orders of magnitude (fig. 13). This information, along with our findings of higher consumption of red sea urchins relative to purple sea urchins observed in foraging surveys from 2003 to 2006, is consistent with expectations that sea otters preferentially select larger red sea urchins instead of smaller purple sea urchins. However, a trend analysis of the subtidal data from 2003 to 2023 indicated a significant increase in the overall counts of purple sea urchins, whereas counts of red sea urchins remained relatively low. Additionally, from 2017 to 2019 to 2020–2023, seasonally persistent concentrations of sea otters developed at the island’s east end where the highest counts of purple sea urchins were (fig. 13). It is unclear whether the dietary shift toward higher consumption of purple sea urchins is a consequence or a driver of the shift in distribution of sea otters toward the east end or how the overall increase in counts of purple sea urchins might have factored into these changes. Additional study would be needed to document if other patterns in foraging activity are changing and what the patterns might reveal about sea otter population growth and carrying capacity at SNI.
Foraging results should be interpreted cautiously because the nature of foraging surveys can introduce potential biases that do not occur with population survey counts. Survey effort at SNI prioritized counting sea otters, which occurred on days with the most optimal viewing conditions within each survey trip. Sea otters were systematically counted around the island as synchronously as possible, always within a day, to minimize detection errors due to sea otter movements. These daily surveys were repeated during multiple days each survey trip to minimize undercounting due to variable survey conditions, sea otter grouping, behavior, and detectability. The highest single-day count for each survey trip was considered a robust estimate of the population size. In contrast, foraging surveys were done opportunistically as time allowed, viewing conditions, and distance of foraging sea otter from shore. As a result, the amount of available foraging information is more limited and uneven across survey trips, locations, and individual sea otters. Because surveys during 2020–2023 were reduced by COVID-19, we aggregated foraging data to compute and compare energy intake rates by period. However, if foraging activity differs by sex or season, then those effects can potentially confound unbalanced aggregations of data when comparing other factors. Systematic biases also could exist. Foraging observations have an unavoidable bias toward prey acquired during daytime. Previous studies have shown that sea otter foraging bouts occur during day and night with equal frequency (Tinker and others, 2006). Additionally, during the 2003–2006 SNI studies, data obtained from implanted time-depth recorders indicated variation between daytime and nighttime dive characteristics that could result from sea otters seeking different prey nocturnally (Newsome and others, 2010). Furthermore, foraging observations require translation into energy intake values based on prey species and size, and unidentified items are translated into an average value for the size class. Accuracy of these translations depends on detailed and reliable information on the nutritional content of prey items, which have been documented by Oftedal and others (2007), although it remains a work in progress to update and expand these keys for different locations and periods.
Computerized simulations have demonstrated the information value of replicating seasonal surveys at SNI (Yee and others, 2020); however, the COVID-19 pandemic led to the suspension of four of the seasonal surveys that would have otherwise occurred during this reporting period. We did not find seasonal patterns in island-wide counts in either the previous (2017–2019) or current (2020–2023) periods, and the available replicate surveys were pooled to derive robust estimates of 10-percent annual growth. Current estimates of the population size average about 150 sea otters, representing a cumulative sixfold increase from counts that averaged about 25 in the early 2000s. Replicate seasonal surveys also revealed significant shifts in the spatial distribution of sea otters around SNI. From 2017 to 2023, sea otters began to aggregate in increasing concentrations on the island’s east end where a boom in purple sea urchins has been observed (fig. 13; Kenner and Tomoleoni, 2021). Seasonal patterns in sea otter distribution also were significant; seasonal change in kelp distribution could be a potential driver of these shifts, but additional study would be needed to confirm this relationship.
Density-dependent processes, such as changes in sea otter foraging habits associated with changes in densities of sea otters, are known to occur for growing populations of sea otters as they deplete abundances of preferred prey resources and must increasingly compete for prey, generally indicated by reduced energy intake rates and increased dietary diversity. We did not find significant changes in the energy intake rates of foraging sea otters nor an increase in dietary diversity, but there were other signs that foraging patterns have potentially begun to change. We observed a pronounced trend from 2003 to 2023 of sea otters increasingly foraging on purple sea urchins instead of the preferred larger red sea urchins, as well as a proportionally higher consumption of bivalves in 2022 and 2023 than previously observed among sea otters at SNI. Annual subtidal surveys showed supporting evidence of an overall increase in purple sea urchins on the island’s east end where sea otters now concentrate (Kenner and Tomoleoni, 2021). We also estimated slightly lower energy intake rates for 2020–2023 than estimated for the previous 3 years, continuing a pattern of decline, but the differences are small, and sample sizes were too small and confidence intervals were too wide to conclude significant change. A continuation of these monitoring efforts can provide further insights to the spatial and foraging dynamics of the growing population of sea otters at SNI and its relationship to the surrounding nearshore ecosystem.
References Cited
Bates, D., Mächler, M., Bolker, B., and Walker, S., 2015, Fitting linear mixed-effects models using lme4: Journal of Statistical Software, v. 67, no. 1, p. 1–48, accessed August 15, 2023, at https://doi.org/10.18637/jss.v067.i01.
Bion, R., 2020, ggradar—Create radar charts using ggplot2 (R package version 0.2): R Documentation, accessed June 12, 2020, at https://www.rdocumentation.org/packages/ggradar/versions/0.2.
Bodkin, J.L., 2015, Historic and contemporary status of sea otters in the North Pacific, chap. 3 of Larson, S.E., Bodkin, J.L., and VanBlaricom, G.R., eds., Sea otter conservation (1st ed.): London, Academic Press, p. 43–61, accessed August 15, 2023, at https://doi.org/10.1016/B978-0-12-801402-8.00003-2.
Estes, J.A., 1990, Growth and equilibrium in sea otter populations: Journal of Animal Ecology, v. 59, no. 2, p. 385–401, accessed August 15, 2023, at https://doi.org/10.2307/4870.
Estes, J.A., and Jameson, R.J., 1988, A double-survey estimate for sighting probability of sea otters in California: The Journal of Wildlife Management, v. 52, no. 1, p. 70–76, accessed August 15, 2023, at https://doi.org/10.2307/3801061.
Estes, J.A., Riedman, M.L., Staedler, M.M., Tinker, M.T., and Lyon, B.E., 2003, Individual variation in prey selection by sea otters—Patterns, causes and implications: Journal of Animal Ecology, v. 72, no. 1, p. 144–155, accessed August 15, 2023, at https://doi.org/10.1046/j.1365-2656.2003.00690.x.
Hatfield, B.B., Yee, J.L., Kenner, M.C., and Tomoleoni, J.A., 2019, California sea otter (Enhydra lutris nereis) census results, spring 2019: U.S. Geological Survey Data Series 1118, 12 p., accessed August 15, 2023, at https://doi.org/10.3133/ds1118.
Kenner, M.C., and Tomoleoni, J.A., 2020, Kelp forest monitoring at Naval Base Ventura County, San Nicolas Island, California—Fall 2018 and spring 2019, fifth annual report: U.S. Geological Survey Open-File Report 2020–1091, 93 p., accessed August 15, 2023, at https://doi.org/10.3133/ofr20201091.
Kenner, M.C., and Tomoleoni, J.A., 2021, Kelp forest monitoring at Naval Base Ventura County, San Nicolas Island, California—Fall 2019, sixth annual report: U.S. Geological Survey Open-File Report 2021–1081, 97 p., accessed August 15, 2023, at https://doi.org/10.3133/ofr20211081.
Nakazawa, M., 2023, Package fmsb—Functions for medical statistics book with some demographic data (version 0.7.5): Cran R Project, accessed August 15, 2023, at https://CRAN.R-project.org/package=fmsb.
Newsome, S.D., Bentall, G.B., Tinker, M.T., Oftedal, O.T., Ralls, K., Estes, J.A., and Fogel, M.L., 2010, Variation in δ13C and δ15N diet-vibrissae trophic discrimination factors in a wild population of California sea otters: Ecological Applications, v. 20, no. 6, p. 1744–1752, accessed August 15, 2023, at https://doi.org/10.1890/09-1502.1.
Oftedal, O.T., Ralls, K., Tinker, M.T., and Green, A., 2007, Nutritional constraints on the southern sea otter in the Monterey Bay National Marine Sanctuary, and a comparison to sea otter populations at San Nicolas Island, California and Glacier Bay, Alaska: Monterey Bay National Marine Sanctuary and the Marine Mammal Commission, 23 p.
R Core Team, 2022, The R project for statistical computing: Vienna, Austria, R Foundation, accessed August 15, 2023, at https://www.R-project.org/.
Ralls, K., Hatfield, B.B., and Siniff, D.B., 1995, Foraging patterns of California sea otters as indicated by telemetry: Canadian Journal of Zoology, v. 73, no. 3, p. 523–531, accessed August 15, 2023, at https://doi.org/10.1139/z95-060.
Rathbun, G.B., Hatfield, B.B., and Murphey, T.G., 2000, Status of translocated sea otters at San Nicolas Island, California: The Southwestern Naturalist, v. 45, no. 3, p. 322–328, accessed August 15, 2023, at https://doi.org/10.2307/3672835.
Tinker, M.T., 2015, The use of quantitative models in sea otter conservation, chap. 10 of Larson, S.E., Bodkin, J.L., and VanBlaricom, G.R., eds., Sea otter conservation (1st ed.): London, Academic Press, p. 257–300, accessed August 15, 2023, at https://doi.org/10.1016/B978-0-12-801402-8.00010-X.
Tinker, M.T., Bentall, G., and Estes, J.A., 2008, Food limitation leads to behavioral diversification and dietary specialization in sea otters: Proceedings of the National Academy of Sciences of the United States of America, v. 105, no. 2, p. 560–565, accessed August 15, 2023, at https://doi.org/10.1073/pnas.0709263105.
Tinker, M.T., Estes, J.A., Ralls, K., Williams, T.M., Jessup, D., and Costa, D.P., 2006, Population dynamics and biology of the California sea otter (Enhydra lutris nereis) at the southern end of its range: Santa Barbara, Calif., University of California, Coastal Research Center, Marine Science Institute, Minerals Management Service Pacific Outer Continental Shelf Region Study 2006–007, Minerals management Service Cooperative Agreement Number 14-35-0001-31063.
Tinker, M.T., Guimarães, P.R., Jr., Novak, M., Marquitti, F.M.D., Bodkin, J.L., Staedler, M., Bentall, G., and Estes, J.A., 2012, Structure and mechanism of diet specialisation—Testing models of individual variation in resource use with sea otters: Ecology Letters, v. 15, no. 5, p. 475–483, accessed August 15, 2023, at https://doi.org/10.1111/j.1461-0248.2012.01760.x.
Tinker, M.T., Tomoleoni, J.A., Weitzman, B.P., Staedler, M., Jessup, D., Murray, M.J., Miller, M., Burgess, T., Bowen, L., Miles, A.K., Thometz, N., Tarjan, L., Golson, E., Batac, F., Dodd, E., Berberich, E., Kunz, J., Bentall, G., Fujii, J., Nicholson, T., Newsome, S., Melli, A., LaRoche, N., MacCormick, H., Johnson, A., Henkel, L., Kreuder-Johnson, C., and Conrad, P., 2019, Southern sea otter (Enhydra lutris nereis) population biology at Big Sur and Monterey, California—Investigating the consequences of resource abundance and anthropogenic stressors for sea otter recovery: U.S. Geological Survey Open-File Report 2019–1022, 225 p., accessed August 15, 2023, at https://doi.org/10.3133/ofr20191022.
Wickham, H., 2016, ggplot2—Elegant graphics for data analysis: Springer-Verlag New York, ISBN 978-3-319-24277-4, accessed August 15, 2023, at https://ggplot2.tidyverse.org.
Yee, J.L., Tomoleoni, J.A., Kenner, M.C., Fujii, J., Bentall, G.B., Tinker, M.T., and Hatfield, B.B., 2020, Southern (California) sea otter population status and trends at San Nicolas Island, 2017–2020: U.S. Geological Survey Open-File Report 2020–1115, 38 p., accessed August 15, 2023, at https://doi.org/10.3133/ofr20201115.
Appendix 1. Figures of Pages from the Monitoring and Research Plan for Southern Sea Otter Military Readiness Area
Page 1 of Monitoring and Research Plan for Southern Sea Otter Military Readiness Area.
Page 2 of Monitoring and Research Plan for Southern Sea Otter Military Readiness Area.
Page 3 of Monitoring and Research Plan for Southern Sea Otter Military Readiness Area.
Page 4 of Monitoring and Research Plan for Southern Sea Otter Military Readiness Area.
Page 5 of Monitoring and Research Plan for Southern Sea Otter Military Readiness Area.
Page 6 of Monitoring and Research Plan for Southern Sea Otter Military Readiness Area.

Page 7 of Monitoring and Research Plan for Southern Sea Otter Military Readiness Area.
Page 8 of Monitoring and Research Plan for Southern Sea Otter Military Readiness Area.
Page 9 of Monitoring and Research Plan for Southern Sea Otter Military Readiness Area.
References for Monitoring and Research Plan for Southern Sea Otter Military Readiness Area.
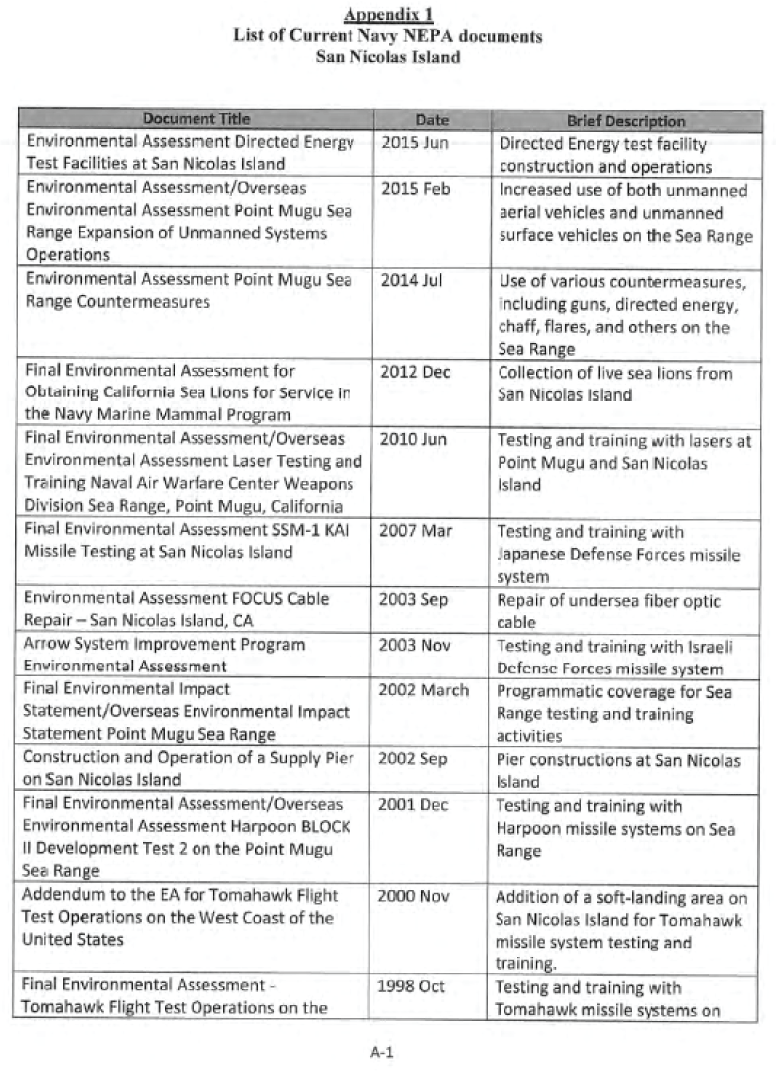
Page A-1 of appendix 1 for Monitoring and Research Plan for Southern Sea Otter Military Readiness Area.
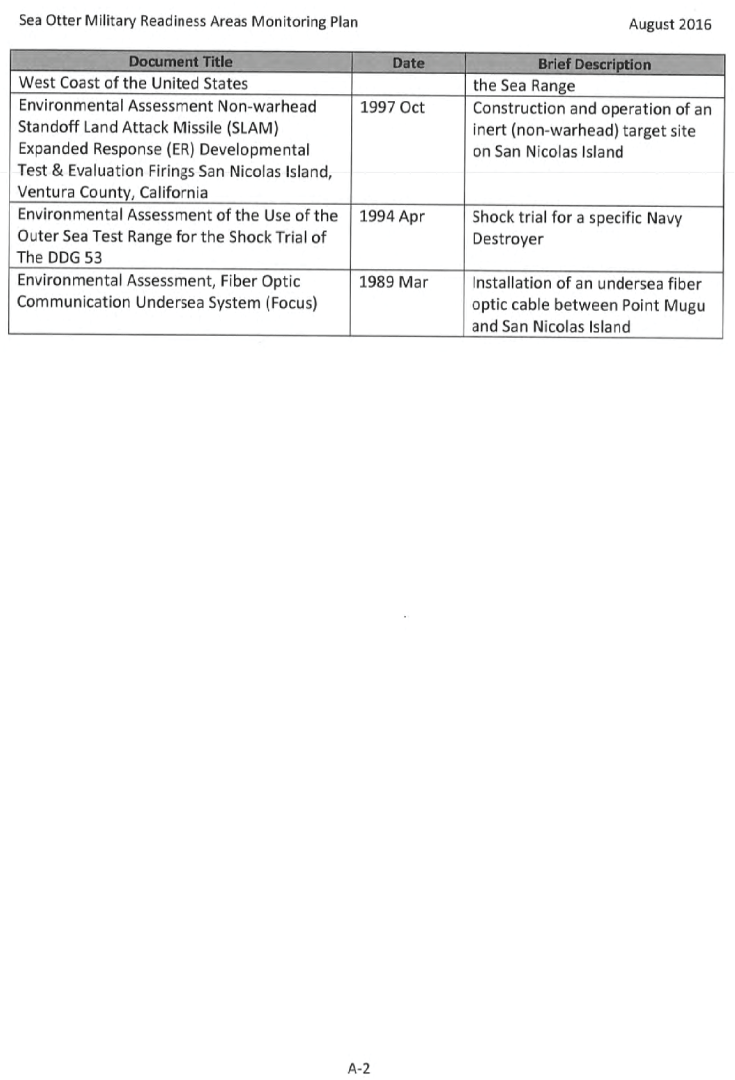
Page A-2 of appendix 1 for Monitoring and Research Plan for Southern Sea Otter Military Readiness Area.
Abbreviations
CI
confidence interval
COVID-19
coronavirus disease 2019
ESA
Endangered Species Act
GIS
Geographic Information Systems
GLM
generalized linear models
LOESS
locally estimated sum of squares
MMPA
Marine Mammal Protection Act
NDAA
National Defense Authorization Act
SNI
San Nicolas Island
SE
standard error
USFWS
U.S. Fish and Wildlife Service
USGS
U.S. Geological Survey
USN
U.S. Navy
For more information concerning the research in this report, contact the
Director, Western Ecological Research Center
U.S. Geological Survey
3020 State University Drive East
Sacramento, California 95819
https://www.usgs.gov/centers/werc
Publishing support provided by the U.S. Geological Survey
Science Publishing Network, Sacramento Publishing Service Center
Disclaimers
Any use of trade, firm, or product names is for descriptive purposes only and does not imply endorsement by the U.S. Government.
Although this information product, for the most part, is in the public domain, it also may contain copyrighted materials as noted in the text. Permission to reproduce copyrighted items must be secured from the copyright owner.
Suggested Citation
Yee, J.L., Tomoleoni, J.A., Kenner, M.C., Fujii, J.A., Bentall, G.B., Staedler, M.M., and Hatfield, B.B., 2023, Southern (California) sea otter population status and trends at San Nicolas Island, 2020–2023: U.S. Geological Survey Open-File Report 2023–1071, 37 p., https://doi.org/10.3133/ofr20231071.
ISSN: 2331-1258 (online)
Study Area
| Publication type | Report |
|---|---|
| Publication Subtype | USGS Numbered Series |
| Title | Southern (California) sea otter population status and trends at San Nicolas Island, 2020–2023 |
| Series title | Open-File Report |
| Series number | 2023-1071 |
| DOI | 10.3133/ofr20231071 |
| Publication Date | September 12, 2023 |
| Year Published | 2023 |
| Language | English |
| Publisher | U.S. Geological Survey |
| Publisher location | Reston, VA |
| Contributing office(s) | Western Ecological Research Center |
| Description | vii, 37 p. |
| Country | United States |
| State | California |
| Other Geospatial | San Nicolas Island |
| Online Only (Y/N) | Y |