
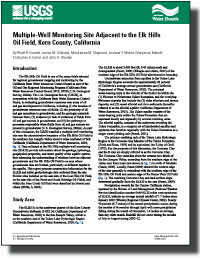
Multiple-Well Monitoring Site Adjacent to the Elk Hills Oil Field, Kern County, California
Links
- Document: Report (7 MB pdf) , HTML , XML
- NGMDB Index Page: National Geologic Map Database Index Page (html)
- Download citation as: RIS | Dublin Core
Introduction
The Elk Hills Oil Field is one of the many fields selected for regional groundwater mapping and monitoring by the California State Water Resources Control Board as part of the Oil and Gas Regional Monitoring Program (California State Water Resources Control Board, 2015, 2022b; U.S. Geological Survey, 2022a). The U.S. Geological Survey (USGS), in cooperation with the California State Water Resources Control Board, is evaluating groundwater resources near areas of oil and gas development in California, including (1) the location of groundwater resources near oil fields; (2) the proximity of oil and gas operations to groundwater, and the geologic materials between them; (3) evidence (or lack of evidence) of fluids from oil and gas sources in groundwater; and (4) the pathways or processes responsible when fluids from oil and gas sources are present in groundwater (U.S. Geological Survey, 2022a). As part of this evaluation, the USGS installed a multiple-well monitoring site near the administrative boundary of the Elk Hills Oil Field in the southern San Joaquin Valley about 6 miles northeast of Taft, California (California Department of Water Resources, 2020; fig. 1). Data collected at the Elk Hills multiple-well monitoring site (ELKH) provide information about the geology, hydrology, geophysical properties, and water quality of the aquifer system, thus enhancing the understanding of relations between adjacent groundwater and the Elk Hills Oil Field in an area where groundwater data are limited, particularly at different depths in the aquifer. This report presents construction information for the ELKH and initial geohydrologic data collected from the site. Similar sites installed on the east side of the Lost Hills Oil Field, on the east side of the North and South Belridge Oil Fields, and within the Poso Creek Oil Field were described by Everett and others (2020a, b, 2023).
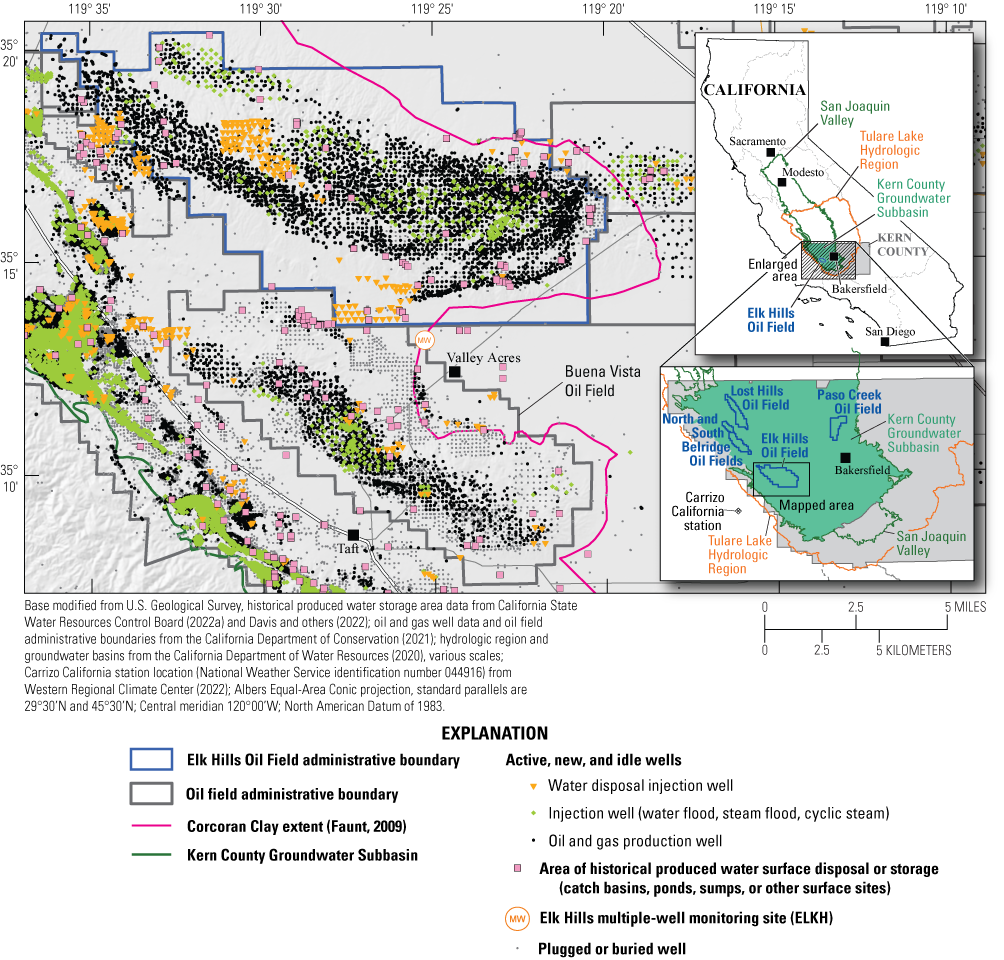
Location of the Elk Hills multiple-well monitoring site (ELKH), selected other wells, and areas of known historical produced water surface disposal or storage in relation to the Elk Hills Oil Field, Kern County, California.
Study Area
The ELKH is in the southwest quarter of the Kern County Groundwater Subbasin (5-022.14; California Department of Water Resources, 2020) in the San Joaquin Valley, which is on the southern end of the Tulare Lake Hydrologic Region (California Department of Water Resources, 2020; fig. 1). The ELKH is about 2,400 feet (ft; 0.45 miles) south and downgradient (Faunt, 2009; Gillespie and others, 2022) of the southern edge of the Elk Hills Oil Field administrative boundary.
Groundwater extraction from aquifers in the Tulare Lake Hydrologic Region accounts for approximately 43 percent of California’s average annual groundwater use (California Department of Water Resources, 2020). The principal water-bearing units in the vicinity of the ELKH lie within the (1) Pliocene to Pleistocene Tulare Formation, and the overlying Holocene deposits that include the (2) older alluvium and terrace deposits, and (3) recent alluvial and river sediments (hereafter referred to as the alluvial aquifer; California Department of Water Resources, 2015). The Tulare aquifer consists of the water-bearing units within the Tulare Formation that are separated locally and regionally by several confining units. The alluvial aquifer, consists of the sediments overlying the Tulare Formation, is a complex set of interbedded aquifers and aquitards that function regionally with the Tulare Formation as a single water-yielding unit (Sneed, 2001).
The primary confining unit of the Tulare Lake Hydrologic Region is the Corcoran Clay Member of the Tulare Formation (Frink and Kues, 1954) and its equivalent, the E clay of Croft (1972). For the purposes of this discussion, the Corcoran Clay and the E clay are simply referred to as the Corcoran Clay. The Corcoran Clay underlies about the western two-thirds of the San Joaquin Valley, extending from the southern edge of the valley near Kern Lake (not shown in fig. 1) to north of Modesto (Faunt, 2009). Locally, Faunt (2009) showed the western edge of the clay generally is coincident with the southern edge of the Elk Hills Oil Field and eastern edge of the Buena Vista Oil Field (fig. 1). The confining Corcoran Clay and land surface slope downward gradually from the ELKH to the east (Faunt, 2009).
Precipitation records for the Carrizo California station, operated by the Bureau of Land Management (National Weather Service identification number 044916) 22 miles west-southwest of ELKH, indicate an average annual rainfall of 7.7 inches since January 2002 (Western Regional Climate Center, 2022). Nearly 90 percent (6.7 inches) of the annual precipitation occurs during the months of November through April with more precipitation falling during the month of December, 1.6 inches on average, than any other month. Rainfall did not occur during the months of July or August during 2002–22.
The ELKH location was selected to provide better information regarding vertical and lateral changes in groundwater gradients and water quality of the alluvial and Tulare aquifer adjacent to the Elk Hills Oil Field. The site is south of the Elk Hills Oil Field and northeast of the Buena Vista Oil Field. The ELKH is downgradient from these intensively developed oil fields (Faunt, 2009; Gillespie and others, 2022). The monitoring site was designed to allow collection of geochemical, geophysical, and hydrologic data to evaluate if adjacent groundwater zones may be affected by (1) naturally existing oil and gas in aquifers in proximity to oil fields or (2) a range of historical and present-day oil- and gas- development activities. Several activities in developed oil fields could affect groundwater, including surface spills, leakage of produced water (water extracted with oil) from disposal ponds, injection of produced water into the subsurface for enhanced recovery and disposal, and potential introduction of preferential pathways, such as leaky or improperly abandoned oil and gas wells or test holes (Davis and others, 2018a; Gillespie and others, 2019a, 2022).
There is an abundance of oil-production and disposal activities near the ELKH. Activities within 2 miles of the ELKH include 248 wells that are plugged or buried; 127 oil or gas-production wells that are active, new, or idle; 29 water-disposal wells (7 plugged, 19 idle, and 3 active); and 14 areas (catch basins, ponds, sumps, or other surface sites) where produced water-storage has occurred (California Department of Conservation, 2021; California State Water Resources Control Board, 2022a). The ELKH is about 0.9 miles from the nearest idle well, 1.0 miles from the nearest water disposal well, 1.2 miles from the nearest active oil well, 2.1 miles from the nearest water flood well, and 3.0 miles from the nearest active steam flood well (injection of steam for enhanced recovery of oil; California Department of Conservation, 2021).
Drilling and Well Installation
The ELKH pilot borehole, with a diameter ranging from 9 7/8 to 8 3/4 inches, was drilled to a depth of 2,526 feet below land surface (ft bls) during November 2021 using direct mud-rotary drilling. Drill cuttings were collected throughout the drilling process and analyzed (along with notes from the on-site geologist) to summarize the lithology (fig. 2) following the procedures described by Everett and others (2013). Continuous mud gas logging of the mud stream was performed during the drilling of the pilot hole. Mud gas logging, also known as hydrocarbon well logging or gas logging, entails gathering qualitative and semi-quantitative data from hydrocarbon gas detectors that record the concentrations of natural gas brought up in the drilling mud (Crain, 2022). Total gas detected in the drilling mud does not represent the actual quantity of oil or gas in the reservoir, but rather represents apparent relative concentrations of gas in the drilling mud with respect to depth; when combined with oil-field gas chromatograph analysis to determine the individual gas components (methane [C1], ethane [C2], propane [C3], butane [C4], and pentane [C5]), mud gas logging can assist in locating zones of oil or gas as they are penetrated (Crain, 2022). In addition to field analysis of C1–C5 gases, 12 samples were collected for laboratory analysis of C1–C5 gas concentrations and carbon and hydrogen isotope compositions of methane and ethane to examine potential hydrocarbon gas sources.
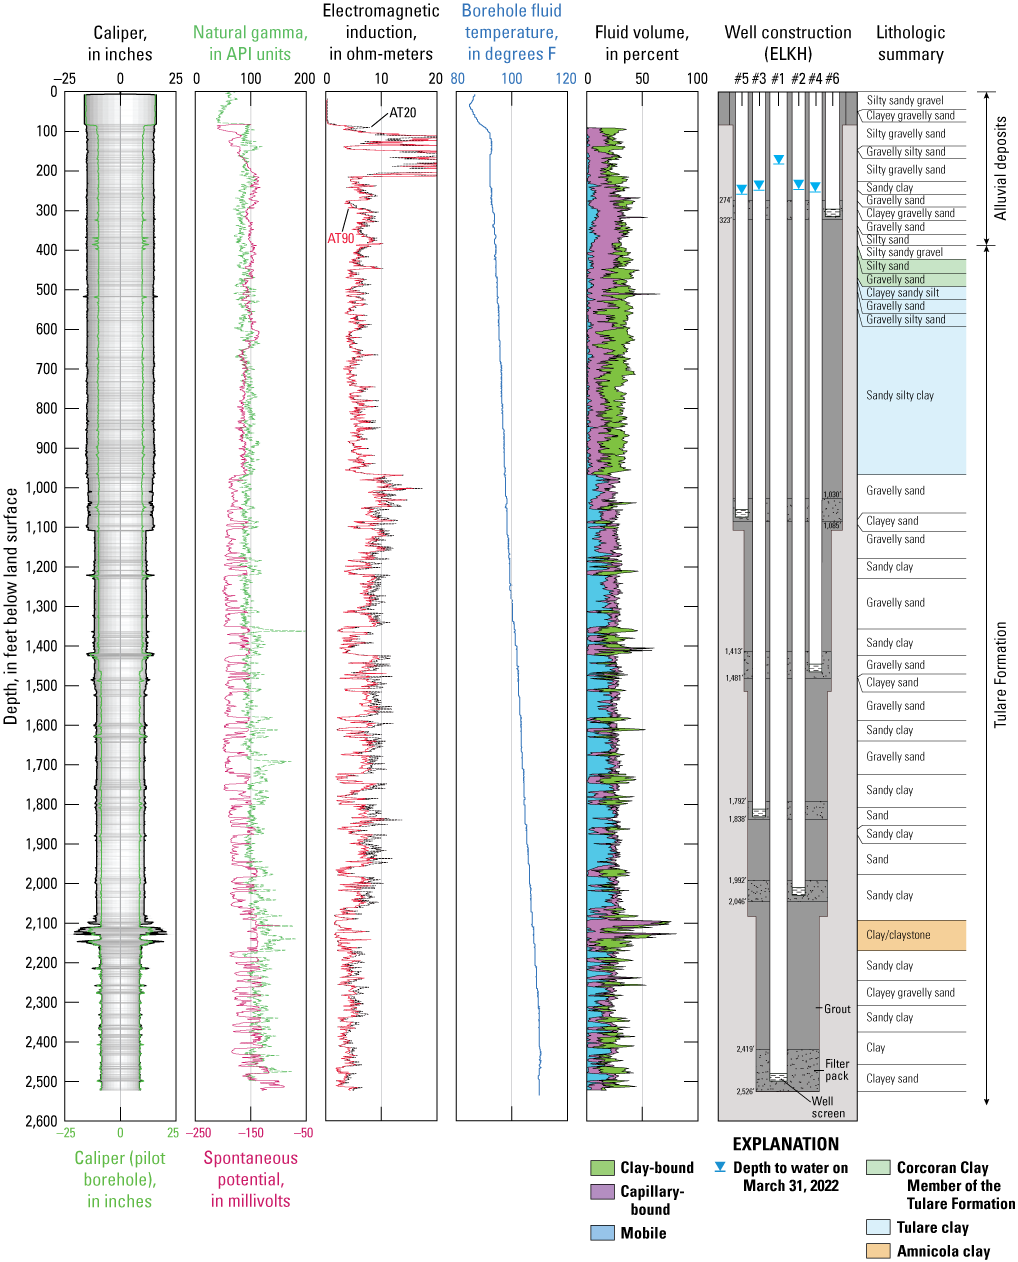
Well construction, summary lithology, and geophysical log data from Elk Hills multiple-well monitoring site (ELKH), Kern County, California. Water-level data from U.S. Geological Survey (2022b), geophysical log data from U.S. Geological Survey (2022c) and U.S. Geological Survey site numbers in table 1. (Abbreviations: API, American Petroleum Institute units; AT20, Array induction two foot resistivity with 20-inch depth of investigation; AT90, Array induction two foot resistivity with 90-inch depth of investigation; F, Fahrenheit).
To assist in the identification of lithologic and stratigraphic units, geophysical logging of the borehole was completed using standard methods (Keys and MacCary, 1971; Shuter and Teasdale, 1989; Keys, 1990; Kenyon and others, 1995). Geophysical logs completed at the site include caliper, natural gamma, normal resistivity (16- and 64-inch normal; not shown in fig. 2), spontaneous potential, electromagnetic induction (expressed and discussed as resistivity), temperature, full wave sonic (sonic porosity), nuclear magnetic resonance porosity, and formation pore pressure (selected logs shown in fig. 2; U.S. Geological Survey, 2022c). Logging was completed in the small-diameter pilot hole because higher-quality logs could be collected compared with logs from larger-diameter holes. Well-screen and filter-pack intervals were selected based on the geophysical and lithologic data. After these intervals were selected, the pilot hole was then reamed to increase the borehole diameter to allow for the construction of the five-well monitoring site. The deepest well (ELKH #1) is constructed with 3-inch-diameter (nominal) schedule 80 polyvinyl chloride (PVC) casing to allow for future geophysical logging, and the five shallow wells are constructed with 2-inch-diameter (nominal) schedule 80 PVC casing (U.S. Geological Survey, 2022c). The wells were installed with screened intervals from 295 to 315 (ELKH #6); 1,055 to 1,075 (ELKH #5); 1,445 to 1,465 (ELKH #4); 1,815 to 1,835 (ELKH #3); 2,020 to 2,040 (ELKH #2); and 2,480 to 2,500 (ELKH #1) ft bls (fig. 2; table 1). A filter pack of #3 sand (granules) was installed around each well screen, and a low-permeability bentonite grout was placed in the depth intervals between the filter packs to isolate and seal each of the wells (fig. 2).
Table 1.
Identification and construction information from the Elk Hills multiple-well monitoring site (ELKH), Kern County, California (U.S. Geological Survey, 2022b, c).[See figure 1 for well locations. Wells ordered from shallowest to deepest. The 15-digit U.S. Geological Survey (USGS) site number is used to uniquely identify the well. The common name is used throughout the report for quick reference. Land-surface datum (LSD) is a datum plane that is approximately at land surface at each well. The elevation of the LSD is described in feet above the North American Vertical Datum of 1988 (NAVD 88). Abbreviations: NWIS, National Water Information System; ft bls, feet below land surface]
| Common well name | USGS site number (hyperlinked to NWIS) |
Elevation of LSD (ft above NAVD 88) |
Well diameter (inside, inches) |
Depth to bottom of well (ft bls) |
Depth to top of perforations (ft bls) |
Depth to bottom of perforations (ft bls) |
|---|---|---|---|---|---|---|
| ELKH #6 | 351303119251406 | 472.27 | 1.94 | 315 | 295 | 315 |
| ELKH #5 | 351303119251405 | 472.27 | 1.94 | 1,075 | 1,055 | 1,075 |
| ELKH #4 | 351303119251404 | 472.27 | 1.94 | 1,465 | 1,445 | 1,465 |
| ELKH #3 | 351303119251403 | 472.27 | 1.94 | 1,835 | 1,815 | 1,835 |
| ELKH #2 | 351303119251402 | 472.27 | 1.94 | 2,040 | 2,020 | 2,040 |
| ELKH #1 | 351303119251401 | 472.27 | 2.90 | 2,500 | 2,480 | 2,500 |
After construction was completed, the wells were developed by airlifting and using a surging technique with compressed air to remove drilling fluid and develop the filter pack surrounding each monitoring well. Specific conductance, pH, water temperature, apparent color, and turbidity were recorded during the process. Well development continued until drilling mud was not evident and field parameters stabilized. The average flow rate for each day and development time was used to estimate the discharge for that day. The estimated total discharge was calculated by adding the daily discharge estimated for each day during the development period (table 2). After well development, turbidities of all wells were equal to or below 2 nephelometric turbidity units (NTU; table 2). The development of ELKH #6 was discontinued when grout was observed in the discharge water. This well is currently inactive.
Table 2.
Well-development and water-level data from the Elk Hills multiple-well monitoring site (ELKH), Kern County, California (U.S. Geological Survey, 2022b).[Wells ordered from shallowest to deepest. Pre- and post-development depth-to-water measurements may not represent true static water levels and are not available on the U.S. Geological Survey (USGS) National Water Information System (NWIS; U.S. Geological Survey, 2022b). Post-development turbidity measurements were collected for reference and are not available in NWIS. Estimated total discharge was calculated by adding daily estimated discharge during the entire development period. Abbreviations: ft bls, feet below land surface; mm/dd/yyyy, month/day/year; gal/min, gallons per minute; gal, gallon; v/v, volume per volume; NTU, nephelometric turbidity units; —, not available]
The USGS site numbers associated with these common names are shown in table 1.
The vertical water-level gradients at the site were calculated (U.S. Environmental Protection Agency, 2023) from multiple discrete water-level measurements collected on March 31, 2022 (fig. 3).
Sediment and Drilling Fluid Analysis
The lithology at the site consists of gravel, sand, silt, and clay (fig. 2) in the alluvial deposits and the underlying Tulare Formation. The lithology at this location is primarily coarser grained to depths of about 390 ft, fine grained from 390 to about 960 ft bls, interbedded from 960 to about 1,990 ft bls, and finer grained from 1,990 to 2,526 ft bls; lithologies were consistent with observations by Page (1983) that the Tulare Formation along the western edge of the southern San Joaquin Valley is fine grained, particularly at depth. The contact between the alluvial deposits and the Tulare Formation is estimated to be at 387 ft bls based on analysis of the geophysical logs. However, Wood and Davis (1959) noted that distinguishing the alluvial deposits from the upper Tulare Formation is challenging in the region just north of the Elk Hills Oil Field, and those challenges are also apparent at ELKH. Croft (1972) noted the presence of E clay (Corcoran Clay equivalent) in a well (American Petroleum Institute [API] 02938056) 2 miles east of ELKH as a 30-foot-thick low resistivity interval in the uppermost part of the Tulare clay (Milliken, 1992) and below a higher resistivity interval that extends to within 200 ft bls. Correlation of the geophysical logs from ELKH with Croft (1972) indicates that the Corcoran Clay may lie within the interval from 387 to 470 ft bls at ELKH (fig. 2). However, Croft’s map of the extent of the clay shows that ELKH is near the western limit of the Corcoran Clay (fig. 1). Croft (1972) noted that, marginally, the Corcoran Clay bifurcates into an upper and a lower stratum that contains thin beds of moderately yellowish-brown silt and sand. The coarser grained component of the drill cuttings collected throughout this interval at ELKH is consistent with the observations from Croft (1972).
The depths to the top and bottom contacts of several other prominent clay layers within the Tulare Formation observed at ELKH are more apparent based on characteristic shifts (low resistivity [electromagnetic induction on fig. 2]) in borehole geophysical logs observed across the area and are identified as the Tulare clay (Milliken, 1992), 470–966 ft bls, and the Amnicola clay (Maher and others, 1975), 2,093–2,170 ft bls (Gillespie and others, 2022). The base of the Tulare Formation, estimated to be at a depth of about 3,310 ft bls based on geophysical logs from a nearby dry oil well (API 0402923850; California Department of Conservation, 2021), was not encountered in the borehole.
Hydrocarbon fluorescence under ultraviolet light can indicate the presence of oil in small amounts. The most reliable test for hydrocarbons in drill cuttings is the cut fluorescence, or wet cut test, which uses an organic solvent to dissolve the oil before observing the fluorescence of the resulting cut (Swanson, 1981). Samples were collected every 10 ft, rinsed lightly with acetone, and inspected under a black light for fluorescence (Wyman and Castano, 1974; Swanson, 1981). Fluorescence was not observed in any of the analyzed samples, indicating that there were no oil shows in the sediments throughout the depth of the completed borehole (2,526 ft bls).
Hydrocarbon gases monitored in the drilling-mud return flow include methane, ethane, propane, n-butane + isobutane, and n-pentane + isopentane. Methane is the only hydrocarbon gas that was detected. Methane concentrations below 11 parts per million (ppm) were detected at multiple depths between 100 and 315 ft bls, within the alluvial deposits. Methane was not detected deeper than 315 ft bls, except for a concentration of 6 ppm occurring at 1,642 ft bls. The maximum methane concentration of 11 ppm occurred at a depth of 240 ft bls.
Hydrology
Collected water-level data included periodic discrete manual measurements and hourly data recorded by downhole pressure transducers. Methods described by Cunningham and Schalk (2011) were used to collect and quality-assure the water-level records. The data were analyzed to identify vertical water-level gradients that indicated direction and variability of potential groundwater flow between aquifer layers and responses to factors, such as recharge and local groundwater withdrawal.
Before installation of the ELKH, data on vertical groundwater flow across the alluvial and Tulare aquifers near the Elk Hills Oil Field were not available. After the pilot borehole was drilled, 24 formation pore pressure measurements were made at various depths throughout the borehole on November 21, 2022, following the methods of Schlumberger (2006) and U.S. Geological Survey (2022c). These pore pressure measurements were converted from pressure to hydraulic head (using an atmospheric pressure of 14.7 pounds per square inch, a conversion of 0.434 pounds per square inch per foot of water, and a fluid density of 1.0 gram per cubic centimeter) and expressed as a depth to water at each depth (fig. 3). Although the formation pore pressure measurements can be subject to some uncertainties (Schlumberger, 2006, 2021), the calculated depth to water from these measurements were similar to the discrete depth to water measured in the wells on March 31, 2022 (table 2; fig. 3). Both sources of water-level data indicated that the vertical component of groundwater flow is upward (from lower to higher depth to water) at depths below the Tulare clay. The vertical water-level gradients at the site were calculated (U.S. Environmental Protection Agency, 2023) from multiple discrete water-level measurements collected on March 31, 2022 (table 2; fig. 3). The water-level gradient is highest, 0.128 foot per foot (ft/ft), between ELKH #1 and ELKH #2. The large gradient between these two wells indicates that the Amnicola clay may restrict vertical groundwater flow. The gradients are similar among ELKH #2, #3, #4, and #5, ranging from 0.011 to 0.016 ft/ft. The low gradients among these four wells indicate that the fine-grained layers between 966 and 2,093 ft bls (fig. 2) do not substantially restrict vertical flow.
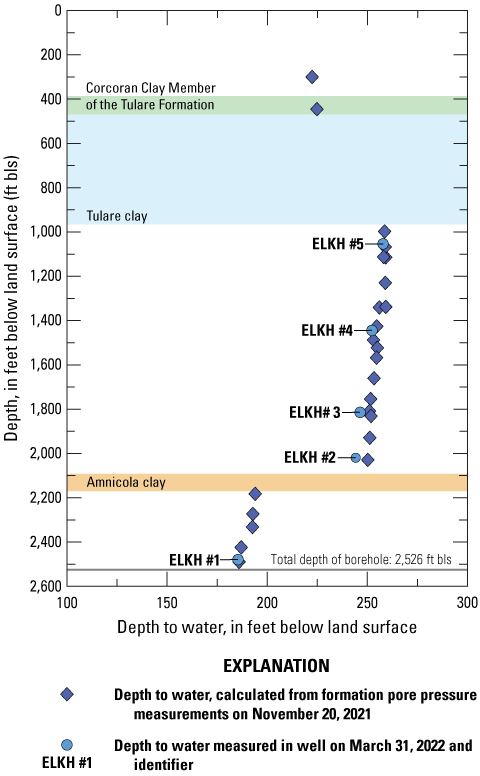
Calculated and measured depth to water at the Elk Hills multiple-well monitoring well site (ELKH), Kern County, California. U.S. Geological Survey site number and well depths are available in table 1. Water-level data from U.S. Geological Survey (2022b), formation pore pressure data from U.S. Geological Survey (2022c).
Water-level changes through time were used to help determine the degree of hydraulic interaction between aquifer layers and assess restrictions to flow that may be caused by many discontinuous clay layers. The change in water level for each well relative to 11:00 a.m. Pacific Daylight Time on March 31, 2022, at the beginning of the period when hourly data were recorded, was calculated through May 2023 (fig. 4). Water levels typically recovered or stayed about the same in the winter in correlation with decreased withdrawal and increased recharge from precipitation. Conversely, water levels declined in the summer due to increased groundwater withdrawal and decreased recharge from the lack of precipitation in the summer months. Water levels were lower in all wells 1 year after hourly monitoring began, indicating an annual decline from March 2022 to March 2023.
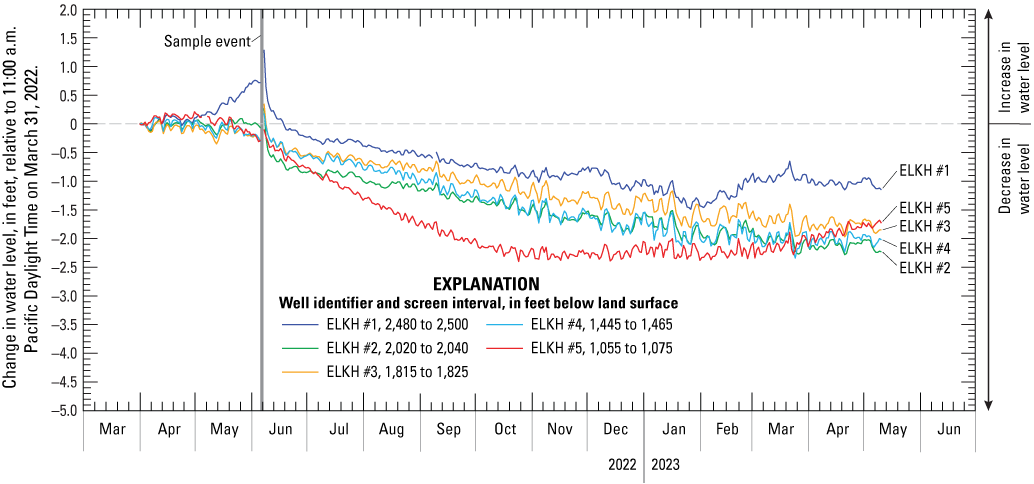
Changes in water levels relative to 11:00 a.m. Pacific Daylight Time on March 31, 2022, observed in wells at the Elk Hills multiple-well monitoring well site (ELKH), Kern County, California. U.S. Geological Survey site numbers and well construction information are available in table 1. Water-level data from U.S. Geological Survey (2022b).
Water levels in all wells fluctuated during short-term intervals (daily to weekly) in response to pumping. Between March 31 and May 20, 2022, water levels in ELKH #1 rose slightly (about 0.8 ft) while water levels in ELKH #2–#5 remained relatively unchanged. Between May 20 and June 3, 2022, water levels in all wells began to decline. Between June 5 and 7, 2022, the instrumentation was removed from the wells while water-quality samples were collected. Between June 3 and November 9, 2022, water levels in all wells slowly declined between 1.5 (ELKH #3) and 2.0 (ELKH #5) ft. Between November 9 and the last week of January, the rate of decline decreased slightly in ELKH #1–#4 while the level in ELKH #5 remained relatively unchanged. During February and March 2023, water levels in ELKH #1 and ELKH #5 rose slightly while the level in ELKH #2–#4 remained relatively unchanged. The similar patterns in short- and long-term changes in water level in all five wells indicate that the aquifers in the Tulare Formation are responding to the same hydrologic stresses, such as groundwater pumping and recharge.
Water Quality
To delineate the chemical characteristics and source of the groundwater, samples were collected from each well in accordance with the protocols established by the USGS National Field Manual (U.S. Geological Survey, variously dated) and analyzed for (1) major-ion chemistry, (2) minor and trace elements, (3) nutrients, (4) radium isotopes, (5) dissolved-organic carbon and organic-carbon characteristics, (6) volatile organic compounds, (7) concentrations and isotopic values of light hydrocarbon gases, (8) the stable isotopes of hydrogen (deuterium) and oxygen (oxygen-18) in water, (9) boron and strontium isotopes, (10) carbon (carbon-13) stable isotopes and carbon-14 activities in dissolved inorganic carbon, (11) noble and atmospheric gases, and (12) groundwater-age tracers tritium and sulfur hexafluoride. The collection and analysis procedures are further described by Dillon and others (2016), Davis and others (2018b), and Wright and others (2019). The five monitoring wells (ELKH #1–#5) were sampled during June 2022. Results of water-quality samples are not discussed in this report, other than the distribution of total dissolved solids (TDS).
Concentrations of TDS in water samples collected from the five deepest ELKH wells during June 2022 range from 4,080 (ELKH #5) to 8,780 (ELKH #1) milligrams per liter (mg/L) residue on evaporation at 180 degrees Celsius (table 3) and increased with depth. Total dissolved solids were calculated in clean sand intervals between 302 and 2,486 ft bls using data from the geophysical logs and the algorithm developed by Bateman and Konen (1977; fig. 5), following procedures outlined by Gillespie and others (2019a, b, 2022). Total dissolved solids measured in groundwater samples collected from the wells confirmed that the calculated estimates from the geophysical logs were reasonable. Total dissolved solids calculations at selected depths shown on figure 5 indicate that TDS values were around 4,000 mg/L near the surface and about 9,000 mg/L at 2,486 ft bls.
Table 3.
Water-quality indicators (field parameters) and total dissolved solids in samples collected from the Elk Hills multiple-well monitoring site (ELKH), Kern County, California (U.S. Geological Survey, 2022b).[Wells ordered from shallowest to deepest. The five-digit U.S. Geological Survey (USGS) parameter code below the constituent name is used to uniquely identify a specific constituent or property. Threshold type: SMCL-US, U.S. Environmental Protection Agency secondary maximum contaminant level; SMCL-CA, California State Water Resources Control Board secondary maximum contaminant level. Abbreviations: mm/dd/yyyy, month/day/year; mg/L, milligrams per liter; °C, degrees Celsius; μS/cm, microsiemens per centimeter at 25 degrees Celsius; CaCO3, calcium carbonate; —, not available; *, value above threshold level]
The USGS site numbers associated with these common names are shown in table 1.
The SMCL-CA for specific conductance has recommended lower and upper threshold values. The upper value is shown in parentheses. SMCL-US from U.S. Environmental Protection Agency (2022). SMCL-CA from California State Water Resources Control Board (2022c).
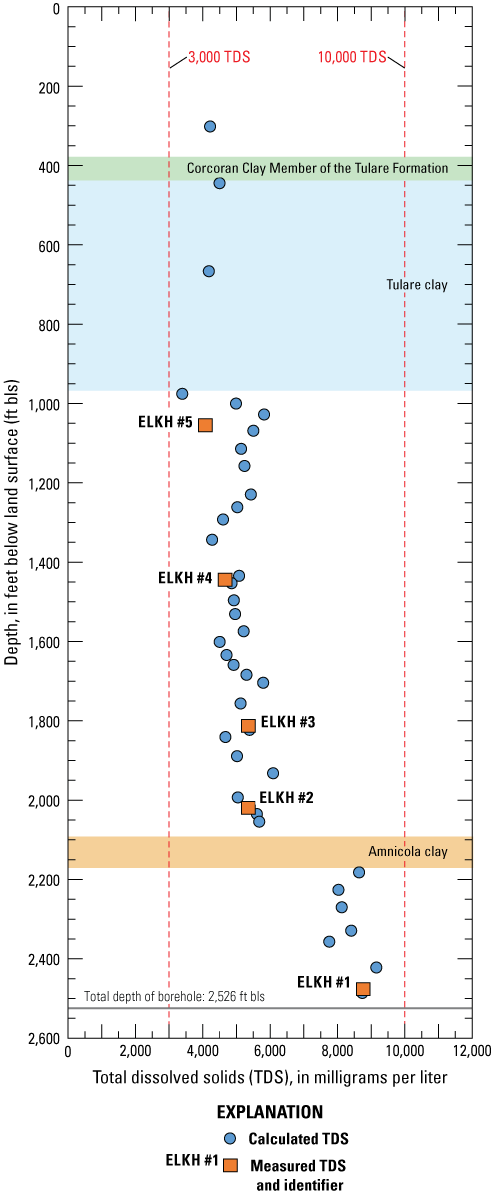
Measured and calculated total dissolved solids (TDS) for selected depths at the Elk Hills multiple-well monitoring site (ELKH), Kern County, California (U.S. Geological Survey, 2022b, c). Calculated values determined from geophysical logs using the equation from Bateman and Konen (1977). U.S. Geological Survey site numbers and well construction information are available in table 1.
Accessing Data
Site information and water-level data presented in this report can be accessed using the USGS National Water Information System (NWIS) at https://waterdata.usgs.gov/nwis/ (U.S. Geological Survey, 2022b). All discrete water-level measurements and the daily minimum depths to water and daily maximum water-surface elevations for all continuously monitored wells presented in this report are available on NWIS. In digital copies of this report, the USGS site numbers (table 1) presented in the tables are hyperlinked directly to the data in NWIS. Any updates applied to data presented in this report after publication will be available in NWIS.
Geophysical logs can be accessed through the USGS GeoLog Locator portal (https://webapps.usgs.gov/GeoLogLocator; U.S. Geological Survey, 2022c), using the USGS site number for the deepest monitoring well ELKH #1 (USGS site number 351303119251401). Sites with available geophysical logs can be searched by the USGS site number (table 1) or can be located using the interactive map. Lithologic samples (shaker and sieve) collected during the drilling of the multiple-completion monitoring wells are archived at the USGS office in San Diego, California. Photographs of the shaker and sieve samples (along with the full descriptions and notes recorded by the site hydrologist) can be accessed through the USGS GeoLog Locator. Requests for access to samples, field notes, or bench notes can be directed to the USGS California Water Science Center.
References Cited
California Department of Conservation, 2021, Online data: California Department of Conservation, Geologic Energy Management Division (CalGEM), accessed May 31, 2021, at https://www.conservation.ca.gov/calgem/Online_Data/Pages/Index.aspx.
California Department of Water Resources, 2015, California’s groundwater update 2013—A compilation of enhanced content for California water plan: California Department of Water Resources, accessed November, 26, 2022, at https://data.cnra.ca.gov/dataset/california-water-plan-groundwater-update-2013.
California Department of Water Resources, 2020, California’s groundwater (bulletin 118): California Department of Water Resources, accessed December 12, 2022, at https://water.ca.gov/Programs/Groundwater-Management/Bulletin-118.
California State Water Resources Control Board, 2015, Model criteria for groundwater monitoring in areas of oil and gas well stimulation: California State Water Resources Control Board, 39 p., accessed September 2, 2019, at https://www.waterboards.ca.gov/water_issues/programs/groundwater/sb4/docs/model_criteria_final_070715.pdf.
California State Water Resources Control Board, 2022a, Water quality in areas of oil and gas production—Produced water ponds: California State Water Resources Control Board, accessed April 23, 2022, at https://www.waterboards.ca.gov/water_issues/programs/groundwater/sb4/oil_field_produced/produced_water_ponds/.
California State Water Resources Control Board, 2022b, Regional groundwater monitoring: California State Water Resource Control Board, accessed March 3, 2022, at https://www.waterboards.ca.gov/water_issues/programs/groundwater/sb4/regional_monitoring.
California State Water Resources Control Board, 2022c, Secondary drinking water standards: California State Water Resource Control Board, accessed December 12, 2022, at https://www.waterboards.ca.gov/drinking_water/certlic/drinkingwater/documents/ddw_secondary_standards.pdf.
Crain, E.R., 2022, Crain’s petrophysical handbook—Mud logging and mud gas logging: Accessible Petrophysics Ltd., accessed May 26, 2022, at https://www.spec2000.net/08-mud.htm.
Croft, M.G., 1972, Subsurface geology of the late Tertiary and Quaternary water-bearing deposits of the southern part of the San Joaquin Valley, California: U.S. Geological Survey Water Supply Paper 1999–H, 29 p., accessed September 26, 2019, at https://doi.org/10.3133/wsp1999H.
Cunningham, W.L., and Schalk, C.W., 2011, Groundwater technical procedures of the U.S. Geological Survey: U.S. Geological Survey Techniques and Methods, book 1, chap. A1, 154 p., accessed March 12, 2015, at https://doi.org/10.3133/tm1A1.
Davis, T.A., Gannon, R.S., Warden, J.G., Rodriguez, O., Gillespie, J.M., Ball, L.B., and Qi, S.L., 2022, Produced water disposal at percolation and evaporation ponds in and near oil fields in the southwestern San Joaquin Valley, California: U.S. Geological Survey data release, accessed September 2, 2022, at https://doi.org/10.5066/P999XIP9.
Davis, T.A., Landon, M.K., and Bennett, G.L., 2018a, Prioritization of oil and gas fields for regional groundwater monitoring based on a preliminary assessment of petroleum resource development and proximity to California’s groundwater resources: U.S. Geological Survey Scientific Investigations Report 2018–5065, 115 p., accessed February 8, 2019, at https://doi.org/10.3133/sir20185065.
Davis, T.A., Teunis, J.A., McCarlson, A.J., Seitz, N.O., and Johnson, J.C., 2018b, Water chemistry data for samples collected at groundwater and surface-water sites near the Lost Hills and Belridge Oil Fields, November 2016–September 2017, Kern County, California (ver. 2.0, December 2021): U.S. Geological Survey data release, accessed March 22, 2019, at https://doi.org/10.5066/F7NS0T5M.
Dillon, D.B., Davis, T.A., Landon, M.K., Land, M.T., Wright, M.T., and Kulongoski, J.T., 2016, Data from exploratory sampling of groundwater in selected oil and gas areas of coastal Los Angeles County and Kern and Kings Counties in southern San Joaquin Valley, 2014–15—California oil, gas, and groundwater project (ver. 1.1, October 2017): U.S. Geological Survey Open-File Report 2016–1181, 24 p., accessed March 22, 2019, at https://doi.org/10.3133/ofr20161181.
Everett, R.R., Gibbs, D.R., Hanson, R.T., Sweetkind, D.S., Brandt, J.T., Falk, S.E., and Harich, C.R., 2013, Geology, water-quality, hydrology, and geomechanics of the Cuyama Valley groundwater basin, California, 2008–12: U.S. Geological Survey Scientific Investigations Report 2013–5108, 62 p., accessed July 19, 2013, at https://doi.org/10.3133/sir20135108.
Everett, R.R., Brown, A.A., Gillespie, J.M., Kjos, A., and Fenton, N.C., 2020a, Multiple-well monitoring site adjacent to the North and South Belridge Oil Fields, Kern County, California: U.S. Geological Survey Open-File Report 2020–1116, 10 p., accessed November 26, 2020, at https://doi.org/10.3133/ofr20201116.
Everett, R.R., Kjos, A., Brown, A.A., Gillespie, J.M., McMahon, P.B., 2020b, Multiple-well monitoring site adjacent to the Lost Hills Oil Field, Kern County, California: U.S. Geological Survey Open-File Report 2019–1114, 8 p, accessed February 21, 2020, at https://doi.org/10.3133/ofr20191114.
Everett, R.R., McMahon, P.B., Stephens, M.J., Gillespie, J.M., Shepherd, M.M., and Fenton, N.C., 2023, Multiple-well monitoring site within the Poso Creek Oil Field, Kern County, California: U.S. Geological Survey Open-File Report 2023–1047, 11 p., accessed July 12, 2023, at https://doi.org/10.3133/ofr20231047.
Faunt, C.C., ed., 2009, Groundwater availability of the Central Valley Aquifer, California: U.S. Geological Survey Professional Paper 1766, 227 p., accessed December 11, 2018, at https://doi.org/10.3133/pp1766.
Frink, J.W., and Kues, H.A., 1954, Corcoran Clay—A Pleistocene lacustrine deposit in San Joaquin Valley, California: American Association of Petroleum Geologists, v. 38, no. 11, p. 2357–2371. [Available at https://doi.org/10.1306/5CEAE0A0-16BB-11D7-8645000102C1865D.]
Gillespie, J.M., Davis, T.A., Ball, L.B., Herrera, P.J., Wolpe, Z., Medrano, V., Bobbitt, M., and Stephens, M.J., 2019a, Geological, geochemical, and geophysical data from the Lost Hills and Belridge Oil Fields: U.S. Geological Survey data release, accessed August 21, 2019, at https://doi.org/10.5066/P90QH6CI.
Gillespie, J.M., Davis, T.A., Stephens, M.J., Ball, L.B., and Landon, M.K., 2019b, Groundwater salinity and the effects of produced water disposal in the Lost Hills-Belridge Oil Fields, Kern County, California: Environmental Geoscience, v. 26, no. 3, p. 73–96, accessed August 21, 2019, at https://doi.org/10.1306/eg.02271918009.
Gillespie, J.M., Stephens, M.J., Chang, W., and Warden, J., 2022, Mapping aquifer salinity gradients and effects of oil field produced water disposal using geophysical logs—Elk Hills, Buena Vista and Coles Levee Oil Fields, San Joaquin Valley, California: PLoS One, v. 17, no. 3, 33 p., accessed November 9, 2022, at https://doi.org/10.1371/journal.pone.0263477.
Keys, W.S., 1990, Borehole geophysics applied to ground-water investigations: U.S. Geological Survey Techniques of Water-Resources Investigations, book 2, chap. E2, 150 p., accessed March 22, 2019, at https://doi.org/10.3133/twri02E2.
Keys, W.S., and MacCary, L.M., 1971, Application of borehole geophysics to water-resources investigations: U.S. Geological Survey Techniques of Water-Resources Investigations, book 2, chap. E1, 126 p., accessed January 29, 2009, at https://doi.org/10.3133/twri02E1.
Maher, J.C., Carter, R.D., Lantz, R.J., 1975, Petroleum geology of Naval Petroleum Reserve No. 1, Elk Hills, Kern County, California: U.S. Geological Survey Professional Paper 912, 109 p., accessed March 3, 2023, at https://doi.org/10.3133/pp912.
Page, R.W., 1983, Geology of the Tulare Formation and other continental deposits, Kettleman City area, San Joaquin Valley, California, with a section on ground-water management considerations and use of texture maps: U.S. Geological Survey Water-Resources Investigations Report 83–4000, 28 p., accessed January 24, 2019, at https://doi.org/10.3133/wri834000.
Schlumberger, 2021, PressureExpress: Sugar Land, Tex., Schlumberger, 4 p., accessed September 2, 2021, at https://www.slb.com/-/media/files/fe/brochure/pressurexpress-br.ashx.
Shuter, E., and Teasdale, W.E., 1989, Application of drilling, coring, and sampling techniques to test holes and wells: U.S. Geological Survey Techniques of Water-Resources Investigations, book 2, chap. F1, 97 p., accessed July 8, 1999, at https://doi.org/10.3133/twri02F1.
Sneed, M., 2001, Hydraulic and mechanical properties affecting ground-water flow and aquifer-system compaction, San Joaquin Valley, California: U.S. Geological Survey Open-File Report 2001–35, 26 p., accessed September 26, 2019, at https://doi.org/10.3133/ofr0135.
Swanson, R.G., 1981, Sample examination manual: Tulsa, Okla., American Association of Petroleum Geologists, v. 1, 54 p., accessed October 24, 2019, at https://doi.org/10.1306/Mth1413.
U.S. Environmental Protection Agency, 2022, Secondary drinking water standards—Guidance for nuisance chemicals: U.S. Environmental Protection Agency, accessed December 12, 2022, at https://www.epa.gov/sdwa/secondary-drinking-water-standards-guidance-nuisance-chemicals.
U.S. Environmental Protection Agency, 2023, EPA on-line tools for site assessment calculation—Vertical gradient calculator: U.S. Environmental Protection Agency. [Available at https://www3.epa.gov/ceampubl/learn2model/part-two/onsite/vgradient.html.]
U.S. Geological Survey, [variously dated], The national field manual for the collection of water-quality data: U.S. Geological Survey Techniques and Methods, book 9, chaps. A1–A9, accessed September 20, 2021, at https://www.usgs.gov/mission-areas/water-resources/science/national-field-manual-collection-water-quality-data-nfm.
U.S. Geological Survey, 2022a, California oil, gas, and groundwater (COGG) program: California Water Science Center, U.S. Geological Survey website, accessed May 20, 2022, at https://webapps.usgs.gov/cogg/.
U.S. Geological Survey, 2022b, USGS water data for the nation—National water information system: U.S. Geological Survey website, accessed December 13, 2022, at https://doi.org/10.5066/F7P55KJN.
U.S. Geological Survey, 2022c, USGS GeoLog Locator: U.S. Geological Survey website, https://doi.org/10.5066/F7X63KT0.
Western Regional Climate Center, 2022, RAWS USA climate archive: Western Regional Climate Center website, accessed November 26, 2022, at https://wrcc.dri.edu/cgi-bin/rawMAIN.pl?caCCAR.
Wood, P.R., and Davis, G.H., 1959, Ground-water conditions in the Avenal-McKittrick area, Kings and Kern Counties, California: U.S. Geological Survey Water-Supply Paper 1457, 141 p., accessed June 14, 2022, at https://doi.org/10.3133/wsp1457.
Wright, M.T., McMahon, P.B., Landon, M.K., and Kulongoski, J.T., 2019, Groundwater quality of a public-supply aquifer in proximity to oil development, Fruitvale Oil Field, Bakersfield, California: Applied Geochemistry, v. 106, p. 82–95, accessed September 26, 2019, at https://doi.org/10.1016/j.apgeochem.2019.05.003.
Wyman, R.E., Castano, J.R., 1974, Show descriptions from core, sidewall and ditch samples, in Society of Petrophysicists and Well-Log Analysts 15th Annual Logging Symposium, June 2–5, 1974: McAllen, Tex., Society of Petrophysicists and Well-Log Analysts, accessed October 24, 2019, at https://onepetro.org/SPWLAALS/proceedings-abstract/SPWLA-1974/All-SPWLA-1974/SPWLA-1974-W/19976.
For more information concerning the research in this report, contact the
Director, California Water Science Center
U.S. Geological Survey
6000 J Street, Placer Hall
Sacramento, California 95819
https://www.usgs.gov/centers/california-water-science-center
Publishing support provided by the U.S. Geological Survey
Science Publishing Network, Sacramento Publishing Service Center
Disclaimers
Any use of trade, firm, or product names is for descriptive purposes only and does not imply endorsement by the U.S. Government.
Although this information product, for the most part, is in the public domain, it also may contain copyrighted materials as noted in the text. Permission to reproduce copyrighted items must be secured from the copyright owner.
Suggested Citation
Everett, R.R., Gillespie J.M., Shepherd, M.M., Morita, A.Y., Bobbitt, M., Kohel, C.A., and Warden, J.G., 2023, Multiple-well monitoring site adjacent to the Elk Hills Oil Field, Kern County, California: U.S. Geological Survey Open-File Report 2023–1073, 11 p., https://doi.org/10.3133/ofr20231073.
ISSN: 2331-1258 (online)
Study Area
| Publication type | Report |
|---|---|
| Publication Subtype | USGS Numbered Series |
| Title | Multiple-well monitoring site adjacent to the Elk Hills Oil Field, Kern County, California |
| Series title | Open-File Report |
| Series number | 2023-1073 |
| DOI | 10.3133/ofr20231073 |
| Publication Date | October 26, 2023 |
| Year Published | 2023 |
| Language | English |
| Publisher | U.S. Geological Survey |
| Publisher location | Reston, VA |
| Contributing office(s) | California Water Science Center |
| Description | 11 p. |
| Country | United States |
| State | California |
| County | Kern County |
| Online Only (Y/N) | Y |