

Applying Intrinsic Potential Models to Evaluate Salmon (Oncorhynchus spp.) Introduction into Main-Stem and Tributary Habitats Upstream from the Skagit River Hydroelectric Project, Northern Washington
Links
- Document: Report , HTML , XML
- Data Release: USGS data release - Upper Skagit River intrinsic potential results
- Download citation as: RIS | Dublin Core
Acknowledgments
This project was informed by input from several biologists and stakeholders involved in the Skagit River Hydroelectric Project relicensing process.
We would like to thank Kevin Andras from Terrainworks for assistance with the NetMap software and its underlying datasets.
Abstract
We assessed habitat suitability for salmonids across selected tributaries upstream from three hydroelectric dams on the upper Skagit River in Whatcom County, northern Washington. We used NetMap, a commercial toolset within the ArcMap geographic information system (GIS), to analyze stream attributes based upon a synthetic stream channel network derived from digital elevation models. The GIS-derived stream attributes—including gradient, bankfull width, valley width index, elevation, and stream flow—allowed us to examine the spatial distribution and relative quality of spawning and rearing habitat for salmonids based on existing intrinsic potential (IP) models. As a first step, we created maps of potential anadromous fish distribution by identifying potential migration barriers within the synthetic stream network. Next, we applied a suite of existing IP models for steelhead, coho, and Chinook salmon (Oncorhynchus mykiss, O. kisutch, and O. tshawytscha, respectively) to estimate low, medium, and high IP habitat for each species. Three different IP models were used for each species, based on species preference curves from populations from coastal Oregon, northern California, Alaska, and western Washington. We found that at least 25 tributaries that were greater than third order and contained habitat with the potential for anadromous fish, totaling about 470 river kilometers in 4,453 synthetic stream reaches averaging about 100 meters (m) in length. The IP of each of these reaches was calculated and placed into low, medium, and high IP categories. For Chinook salmon, the only stream with significantly (in other words, greater than 1 kilometer [km]) high IP reaches was the upper Skagit River upstream from Ross Lake reservoir in Canada, upstream from the third dam in the hydroelectric system. There were differences among the three models evaluated, with the model derived for the lower Skagit River showing more high and medium IP habitat than the other two models that were designed for the Columbia River Basin. For coho salmon, all three models showed similar results favoring medium IP over low and high IP habitat. Of the 3 species examined with existing IP models, steelhead had the most habitat rated as high IP with 19 targeted tributaries showing greater than 1 km of high intrinsic potential habitat.
Introduction
Seattle City Light (hereinafter City Light) is one of the Nation’s largest municipally owned utilities in terms of the number of customers served. City Light owns and operates the Skagit River Hydroelectric Project in Whatcom County, northern Washington, which produces about 20 percent of the power supply for the City of Seattle. The operating license issued by the Federal Energy Regulatory Commission (FERC) for the three dams in the project expires in 2025 and the process is underway to renew the license. A component of this relicensing process is the implementation of an integrated study plan to provide additional information on a suite of topics related to recreation, fisheries, cultural resources, wildlife, and vegetation. Included in the Revised Study Plan submitted to FERC was an interrelated set of studies (FA07–Reservoir Tributary Habitat; Seattle City Light, 2023) to assess habitat, environmental conditions, and species interactions that affect the availability and production potential of habitat for native salmonids (Oncorhynchus spp.) in reservoirs and major tributaries associated with Ross, Diablo, and Gorge dams on the Skagit River.
The Skagit River Hydroelectric Project is in the upper Skagit River watershed (fig. 1) on the main stem of the Skagit River. The three hydroelectric dams and their reservoirs are located between river kilometer (rkm) 151 and 204 and work together through hydrological coordination to generate about 700 megawatts of power. Currently, the three hydroelectric dams block upstream and downstream migration of fish in the Skagit River. The dams and their reservoirs are contained within the Ross Lake National Recreation Area, which is administered by the National Park Service (NPS) as part of North Cascades National Park. The upstream-most 1.5 km section of the upper reservoir (Ross Lake) is in Canada and is contained within the Skagit Valley Provincial Park. Several major tributaries and about 50 km of the main stem of the Skagit River are located upstream from Ross Lake in Canada.
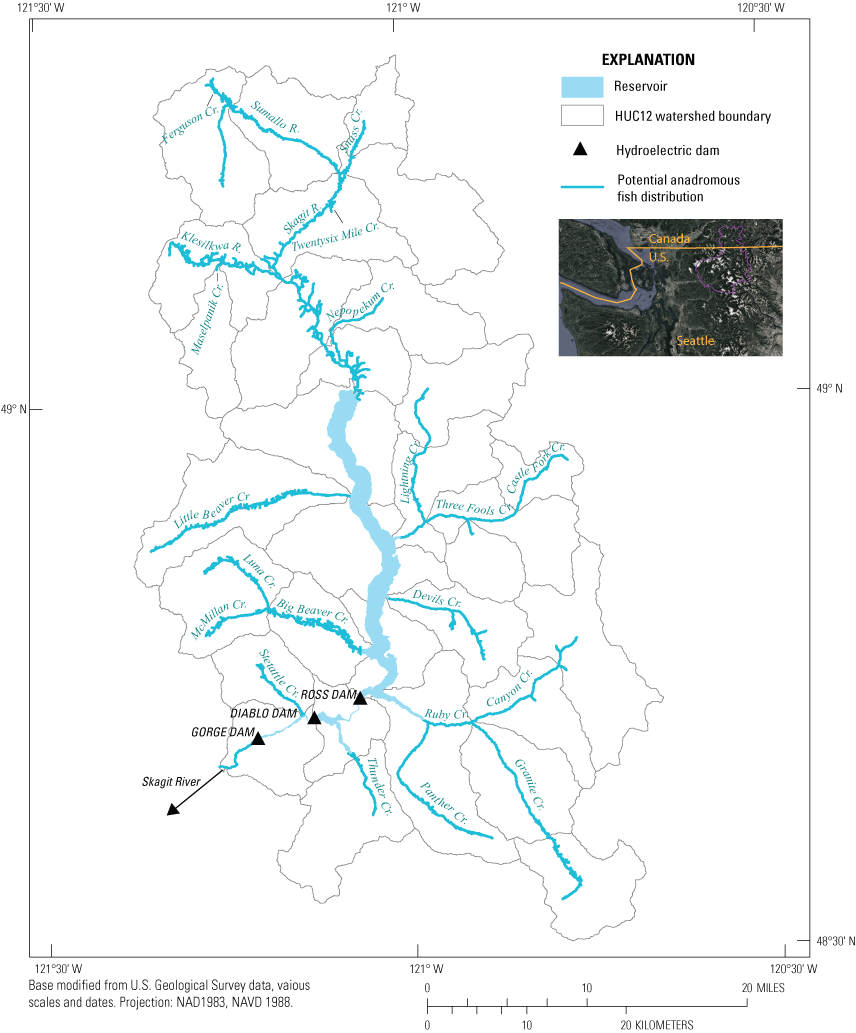
Upper Skagit River watershed showing targeted and non-targeted tributary habitat with potential accessibility for anadromous salmonids (Oncorhynchus spp.) upstream from three currently impassable dams, in Whatcom County, northern Washington. USGS Hydrological Unit Code (HUC) is a classification hierarchy to delimit watershed boundaries in successively smaller hydrologic units. HUC12 indicates boundaries of local sub-watershed scale that represents tributary systems.
Over the past several decades, City Light, NPS, and fisheries biologists from other agencies have gathered data on aquatic resources in the project reservoirs, including bull trout (Salvelinus confluentus) movement, fish species assemblages, sport fishing catches (creel surveys in Ross Lake, for example), water quality, and hydrodynamic modeling of the reservoirs. Although these efforts provide valuable baseline information, a comprehensive analysis of trophic interactions, environmental conditions, and the hydroelectric project operations that affect reservoir and tributary fish populations was identified by City Light to be a part of the Revised Study Plan for the relicensing application process. Such data could provide information necessary to evaluate the status of fish populations upstream from the dams, current effects that project operations have on these fish populations, and specific fishery monitoring and management activities into the future, if necessary, beyond the needs of the relicensing process.
To address this information need, a multi-element study was initiated by the U.S. Geological Survey’s Western Fisheries Research Center in Seattle, Washington. The goal of the ongoing study was to identify and quantify factors that might limit recruitment or production of native adfluvial salmonids, which populate the reservoirs and associated tributaries upstream from the three main-stem dams on the Skagit River (Ross, Diablo, and Gorge dams). From 2018 to 2020, several related projects were underway. These projects focused on seasonal and size-structured food web interactions in the reservoirs, ontogenetic connections of adfluvial salmonids to tributary habitats, presence and geographic extent of native and non-native fishes in targeted reservoir tributaries in the basin, levels of hybridization among native and introduced species, and habitat suitability and bioenergetic growth potential of select tributaries. Food web interactions, distribution, and growth of native salmonids will ultimately be linked to environmental conditions, and these will be evaluated within the context of projected changes in climate or dam operations.
Subsequently, introduction of salmon or steelhead upstream from the dams was posed as a study topic by several parties to the relicensing project (licensing participants, hereinafter LPs). Because of the widespread installation of dams across the range of Pacific salmon, a significant percentage of historical spawning and rearing habitat for anadromous salmonids is inaccessible at locations where dams lack fish passage structures and block migratory fish access to historical spawning and rearing habitats upstream (Ward and Stanford, 1979; Waldman and Quinn, 2022). Where installation of fish passage structures such as fishways or fish ladders is not possible because of engineering or economic constraints, so called trap-and-haul operations have been used to (1) collect migrating adults and move them upstream (Clay and Eng, 2017) or downstream (Piper and others, 2020) past the dam, (2) collect migrating juveniles and move them past the dam (Johnson and others, 2005), or (3) move both adults and juveniles (referred to as two-way trap-and-haul; Lusardi and Moyle, 2017; Kock and others, 2021). Repatriating anadromous fish to formerly disconnected upstream areas could be useful in situations where habitat is limiting population growth in downstream areas while production potential exists upstream. It is also seen as a possible mitigation to future warming water temperatures in the face of climate change, given that colder temperature waters are expected to shift farther upstream under climate change scenarios (Naughton and others, 2018). To date, the efficacy of these approaches has seen mixed results (Lusardi and Moyle, 2017; Kock and others, 2021). Given the recent increase in projects to introduce or reintroduce anadromous salmonids upstream from passable barriers, it was determined that identifying the amount of suitable habitat in streams that could be used by Pacific salmon upstream from Gorge, Diablo, and Ross dams would be useful information to consider as part of the relicensing process.
Purpose and Scope
The purpose of this study was to (1) use watershed attributes estimated from synthetic stream networks derived from digital elevation models (DEMs) in a geographic information system (GIS) to identify the upstream limit of tributary habitat that could be accessed by introduced Pacific salmon and steelhead and (2) to use several existing intrinsic potential (IP) models for three species of anadromous salmonids (Chinook, coho, and steelhead [Oncorhynchus tshawytscha, O. kisutch, and O. mykiss, respectively]) to identify suitable habitat in tributaries and main-stem reaches upstream from the three Skagit River dams. Where IP models do not exist for a given species, use of results from other species could be used heuristically to infer the potential for a species’ performance.
Methodology
We used a synthetic watershed approach (that is, a watershed with stream segments composed within a GIS based on DEM data; Benda and others, 2016) to assess the potential distribution of anadromous salmon in the Skagit River Basin upstream from the dams. NetMap (Terrainworks, 2023) is a commercial software system available as an add-on analysis toolkit for ArcGIS (ESRI, 2023) for use in watershed analyses (Benda and others, 2007). NetMap is an integrated set of numerical algorithms and base parameters that are used to create a synthetic stream network based on DEMs (Benda and others, 2007, 2011). Effectively, NetMap derives stream networks consisting of reaches ranging from 10 to 200 meters (m; average = 102 m ± 12 m; number of reaches [n] = 133,808 reaches to represent the study area of the upper Skagit River Basin). Within each reach, geomorphic and hydrological characteristics are derived based upon the surrounding DEM-derived landscape (such as drainage area and elevation), flow accumulation, and channel delineation processing. Geomorphic and hydrological habitat variables for each reach are estimated throughout the channel network using modeled parameters and empirically based relationships available from published region-specific models related to valley geometry, river network structure and hydrology, climate, and channel elevation profiles (Benda and others, 2011). At the start of the project, an existing NetMap model for the upper Skagit River watershed up to the Canadian border was based on a 10-m DEM. Terrainworks extended the model into the remaining watershed in Canada using a 20-m DEM, which was the highest resolution publicly available DEM. Terrainworks merged the two DEMs together to create a seamless DEM that could be packaged into NetMap as a dataset for further analysis and estimates of fish distribution and IP modeling.
As part of the study plan review, LPs proposed a list of 21 streams with potential salmonid habitat that could potentially be used by introduced anadromous salmonids. On the United States side of the border (table 1), these included Big Beaver Creek, Luna Creek, Little Beaver Creek, Canyon Creek, North Fork Canyon Creek, Granite Creek, Lightning Creek, Three Fools Creek, Castle Fork Creek, Ruby Creek, Cabinet Creek, and East Creek. Subsequent analyses and discussions with LPs added additional target tributaries, including a tributary to Gorge Lake reservoir (Stetattle Creek) and five tributaries to Ross Lake reservoir (Hozomeen Creek, Devils Creek, McMillan Creek, Panther Creek, and Slate Creek). In the Canadian part of the watershed upstream from the Ross Lake reservoir, the Skagit River main stem and several tributaries, including the Klesilkwa River, Sumallo River, Ferguson Creek, Nepopekum Creek, Maselpanik Creek, Snass Creek, Twentysix Mile Creek, and Marmotte Creek, were proposed for assessment (table 2).
Table 1.
Tributary and main-stem reaches upstream from Ross Lake reservoir identified by stakeholders as having accessible fish habitat that could potentially be used by introduced Pacific salmon and steelhead (Oncorhynchus spp.), with estimates of the amount and average percent gradient of the accessible sections, in northern Washington.[km, kilometes; <, less than]
Table 2.
Ross Lake reservoir tributary reaches identified by stakeholders as having accessible fish habitat that could potentially be used by introduced Pacific salmon and steelhead (Oncorhynchus spp.), with estimates of the amount (in kilometers) and average percent gradient of the accessible sections, in northern Washington.[km, kilometer; <, less than]
As a first analysis step, we used the hydrographic representation of the upper Skagit River study area in NetMap to identify the upper extent of potential anadromous salmonid distribution in each tributary upstream from the dams. We did this by applying two criteria related to fish passage: changes to gradient that would limit anadromous fish passage, and the presence of natural waterfalls and other water surface drops that could serve as anadromous fish barriers. Definitions of both criteria were obtained from the anadromous fish passage assessment protocols for the State of Washington (Washington Department of Fish and Wildlife, 2019). The first criterion to assess the extent of potential habitat was a maximum of 20-percent gradient over a 160-m reach, which studies have shown to be impassable for upstream migrating salmonids (Washington Department of Fish and Wildlife, 2019). Although some studies have used lower gradient thresholds (such as, 16 percent over 300 m for Fraser River salmonids; Finn and others, 2021), we used the standard for upstream migration barriers as set by the State of Washington. The second criterion was waterfalls or geomorphic features with vertical drops greater than or equal to 3.7 m. We assessed such drops using the NetMap node-based stream layer, which represents the synthetic stream network at the grain of the DEM that is 10 m for reaches in the United States and 20 m for reaches in Canada. NetMap identifies a node drop value for a reach based on differences in elevation between adjacent nodes. Potential upstream distribution was stopped at nodes that equaled or exceeded 3.7 m. In most cases, because of elevation changes, several nodes would exceed the drop height threshold and be obvious areas of steep gradient and vertical waterfalls or cascades. We cross-referenced known barriers and waterfalls with the node drop values in NetMap as verification that the tool was accurately depicting known barriers. Because of the remote nature of the watershed and few existing on-the-ground surveys of potential barriers, most of the potential barriers stopping upstream anadromous fish distribution were identified only from the NetMap environment. However, there were a few cases where single or small clusters of adjacent nodes that exceeded the height threshold were surrounded by several hundred meters of habitat upstream and downstream from the impacted reach. To be conservative with identifying potential barriers, in these cases we by-passed such “spurious nodes,” which had drops ranging from 3.7 to 8.8 m, and assumed that fish passage was possible. There were only a few such cases in Canyon Creek (one node), Castle Fork Creek (six nodes in three reaches), Devils Creek (eight nodes in four reaches), Granite Creek (three nodes in two reaches), Lightning Creek (two nodes in one reach), McMillan Creek (two nodes in one reach), Nepopekum Creek (eight nodes in five reaches), and Snass Creek (eight nodes in five reaches). Given the above two decision rules, we identified the potential areas of anadromous fish distribution within GIS for use in IP modeling (fig 1).
For the next step, we used several existing species-specific IP models to estimate the geomorphically based habitat suitability for Chinook, coho, and steelhead. The concept of IP was originally developed in the Pacific Northwest for use as a broad-scale assessment tool to estimate the potential for stream reaches to support salmonids based on species habitat preferences related to persistent landscape features that are not easily modified by human disturbances (Burnett and others, 2007; Sheer and others, 2009). Features, such as hydrology, gradient, and channel width, create the template upon which other transient features, like the presence of riffle and pool channel units and large woody debris, interact to create habitat that support salmonid populations. The influence of these landscape features creating the template are determined by the geomorphic context of landforms interacting with other habitat forming processes, such as hydrology and wood and sediment recruitment and retention, to create habitat conditions that are suitable for spawning and rearing of salmon (Benda and others, 2004; Burnett and others, 2007; Bidlack and others, 2014).
As detailed below, there were two approaches to calculate the IP depending on the model and species. The first approach was the original one described by Burnett and others (2007) where IP for each reach is calculated based upon species suitability curves for each of three habitat variables so that for each reach, habitat scores for the species would range from 1 (highest preference) to 0 (not suitable). An IP score based on the geometric mean from the three variables of interest (for example, gradient, valley confinement, and width) is calculated for each reach, ranging from 1 to 0. The second approach was a categorically based one, where low, medium, and high IP values were assigned to each reach according to ranges of values for the 3 variables of interest. For example, reaches with a bankfull width between 3.8 and 25 m, a gradient from 0 to 0.5 percent, and a moderate valley width ratio would receive a relative IP score of “medium.” To compare model-derived IP scores and maps across species, we assigned reaches from numerically derived models as low (score less than or equal to 0.25), medium (greater than 0.25 or less than or equal to 0.75), and high (greater than 0.75) IP. All calculations were made in GIS using the NetMap tool applied to the fish distribution described above.
For each target species of salmonid (Chinook salmon, coho salmon, steelhead), we used three existing models to score the IP of each stream reach in the areas identified as having potential for introduced anadromous salmonids (fig. 1). For Chinook salmon, we used existing models from Connor and others (2015; hereinafter Connor model), Busch and others (2013; hereinafter Busch model), and Cooney and Holzer (2006; hereinafter Cooney and Holzer model) that were developed from populations in the interior Columbia River Basin, the lower Columbia River Basin, and the Skagit River downstream from the Skagit River Hydroelectric Project, respectively. The Connor model used elevation as a factor in place of bankfull width. For coho salmon, existing models by Burnett and others (2007; hereinafter Burnett model), Agrawal and others (2005; hereinafter Agrawal model), and Romey (Terrainworks, 2023; hereinafter Romey model) were based on species preference curves developed from populations from coastal Oregon, northern California, and Alaska, respectively. All three models used the same three physical habitat variables (percent gradient, mean annual flow, and valley width index; table 3), with differences among the models in the shape of the habitat suitability curves that assigned slightly different IP ranking scores to each attribute. For steelhead, we used the Burnett model, the Agrawal model, and the model from the Puget Sound Technical Recovery Team (Hard and others, 2015; hereinafter Puget Sound Technical Recovery Team model) based on populations in coastal Oregon, northern California, and Puget Sound, respectively.
Table 3.
Comparison of intrinsic potential (IP) model parameters used for Pacific salmon and steelhead (Oncorhynchus spp.) IP models.Named models include Connor model (Connor and others, 2015), Cooney and Holzer model (Cooney and Holzer, 2006), Busch model (Busch and others 2013), Agrawal model (Agrawal and others, 2005), Romey model (Terrainworks, 2023), Burnett model (Burnett and others, 2007), and Puget Sound Technical Recovery Team model (Hard and others, 2015).
Results and Interpretations
Potential Fish Distribution Upstream from the Skagit River Hydroelectric Project Dams
Of the 27 proposed targeted streams, 25 of them were included in the final analysis based on potential fish distribution. Two proposed streams, East and Cabinet Creeks, were identified to have several reach nodes exceeding the fish passage thresholds within about 200 m or less from the confluence with their respective tributaries and were not considered for further analysis. Based upon gradient threshold and waterfall drop values for the remaining 25 target streams, we identified 4,453 stream reaches totaling an estimated length of 470 rkm of potential fish habitat for migratory fish species (fig. 1). The average length of reaches was 105 m (standard deviation; SD ± 13.8 m, range 9–227) and the median stream order of these reaches being was 4. These included 2,838 reaches within 25 target streams (tables 1 and 2 plus an additional four streams) totaling 306 km with a median stream order of 5. There were 1,615 reaches totaling 164 km that were found in other accessible tributaries that were often smaller (median stream order was 2) named or unnamed tributaries to the targeted streams (hereinafter referred to as non-targeted streams or non-targeted reaches). The targeted tributary and main-stem Skagit River reaches identified were larger streams, and the other non-targeted reaches were smaller and generally shorter reaches of accessible habitat.
Chinook Salmon Intrinsic Potential Model Results
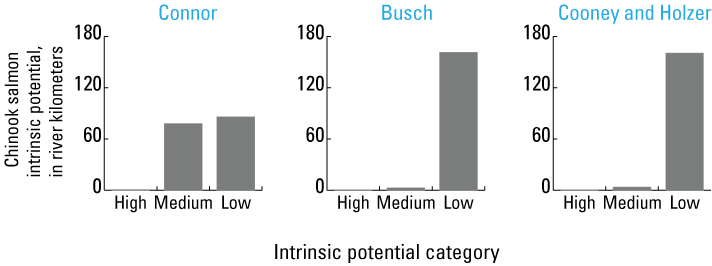
There were similarities and differences among the results for the three Chinook salmon IP models (fig. 2). The Chinook salmon IP model proposed by Connor and others (2015; Connor model), which was parameterized based on other Skagit River Basin populations downstream from the Skagit River Hydroelectric Project, was different from the Busch model (Busch and others, 2013) and the Cooney and Holzer model (Cooney and Holzer, 2006) developed for Chinook salmon populations in the Columbia River Basin. All three models used gradient and stream bankfull width habitat preference curves, whereas the Connor IP model replaced valley width ratio used by the other two models with elevation as the third parameter (table 3). In total, the Connor model rated more reaches as having high IP habitat than the other two models. Summaries of habitat parameter values and the number of reaches scored as low, medium, and high IP sections are provided for main-stem and tributary habitat in the United States (table 4) and Canada (table 5).
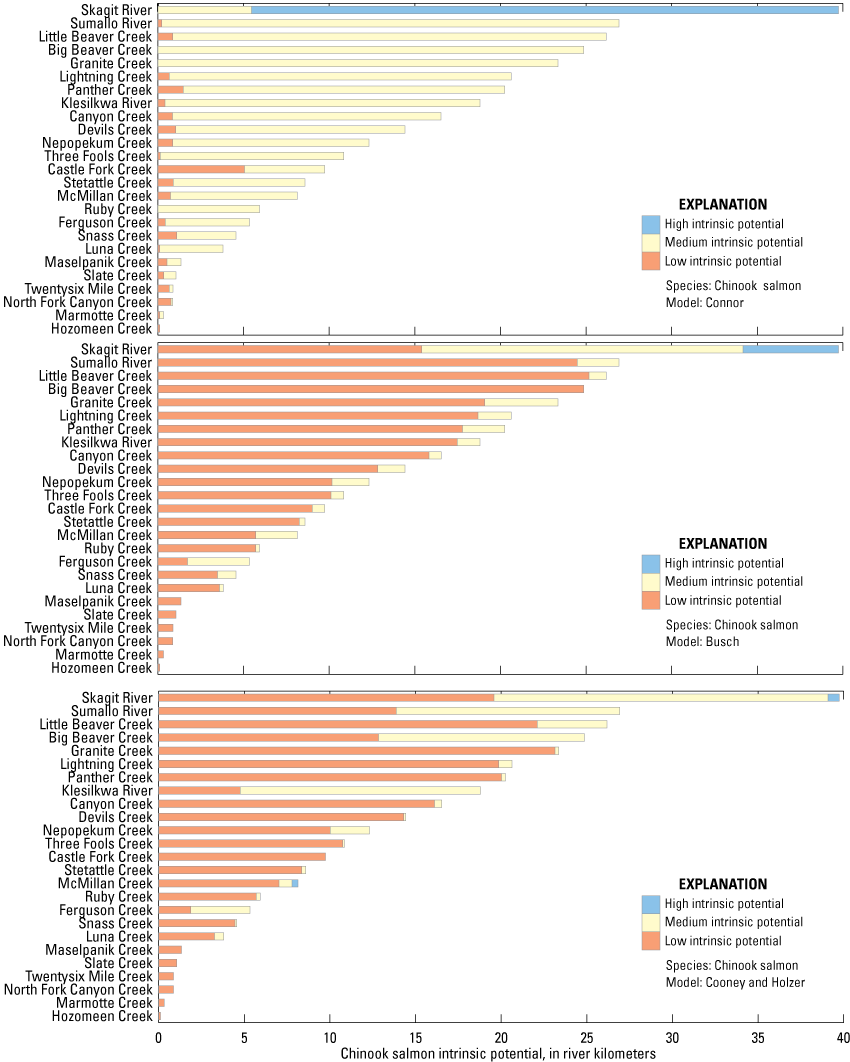
Length of high, medium, and low intrinsic potential habitat for Chinook salmon (Oncorhynchus tshawytscha) based on three different models for target tributaries upstream from the three upper Skagit River dams, in northern Washington.
Table 4.
Reach average values of gradient, valley width index (ratio), bankfull width, and mean annual flow for targeted upper Skagit River streams in the United States by high, medium, or low intrinsic potential (IP) rank for Chinook salmon (Oncorhynchus tshawytscha).[Plus or minus (±) standard deviations are shown in parentheses. CnH, Cooney and Holzer model; NA, no reaches were identified for a given stream, model, and intrinsic potential category; m, meter; m3/s, cubic meter per second]
Table 5.
Reach average values of gradient, valley width index (ratio), bankfull width, and mean annual flow for targeted upper Skagit River streams in Canada by high, medium, or low intrinsic potential (IP) rank for Chinook salmon (Oncorhynchus tshawytscha).[Plus or minus (±) standard deviations are shown in parentheses. CnH, Cooney and Holzer model; NA, no reaches were identified for a given stream, model, and intrinsic potential category; m, meter; m3/s, cubic meter per second]
Chinook Salmon Intrinsic Potential Based on the Connor Model
The Connor model identified 165 low (17.3 km), 2,355 medium (253.6 km), and 314 high (34.3 km) IP reaches across all 25 targeted streams for Chinook salmon (fig. 2), with an additional 852 (86.1 km) low and 763 medium (78.2 km) IP reaches from non-targeted streams (fig. 3). The reaches that scored a high IP (that is, modeled IP scores ≥ 0.75) for Chinook salmon were found in 34.3 km of reaches in the Skagit River main stem upstream from the Ross Lake reservoir in Canada (fig. 4). Most of the other targeted tributaries were dominated by medium IP habitat (scores greater than 0.25 and less than or equal to 0.75; fig. 4). Across all targeted reaches, 5.1 percent was rated as having low (less than 0.25) intrinsic potential habitat. After the main-stem Skagit River, which had about 40 km of main-stem habitat rated as high or medium IP, 11 different targeted tributaries had greater than 10 km of medium-rated IP habitat (fig. 2). Those tributaries with medium IP amounts greater than 10 km were the Sumallo River (26.7 km), Little Beaver Creek (25.3 km), Big Beaver Creek (24.9 km), Granite Creek (23.3 km), Lightning Creek (20.0 km), Panther Creek (18.8 km), Klesilkwa River (18.4 km), Canyon Creek (15.7 km), Devil’s Creek (13.3 km), Nepopekum Creek (11.4 km), and Three Fools Creek (10.7 km). An additional seven tributaries contained at least 1 km of medium IP habitat.
Length of high, medium, and low intrinsic potential habitat for Chinook salmon (Oncorhynchus tshawytscha) based on three different models for non-target tributaries upstream from the three upper Skagit River dams, in northern Washington.
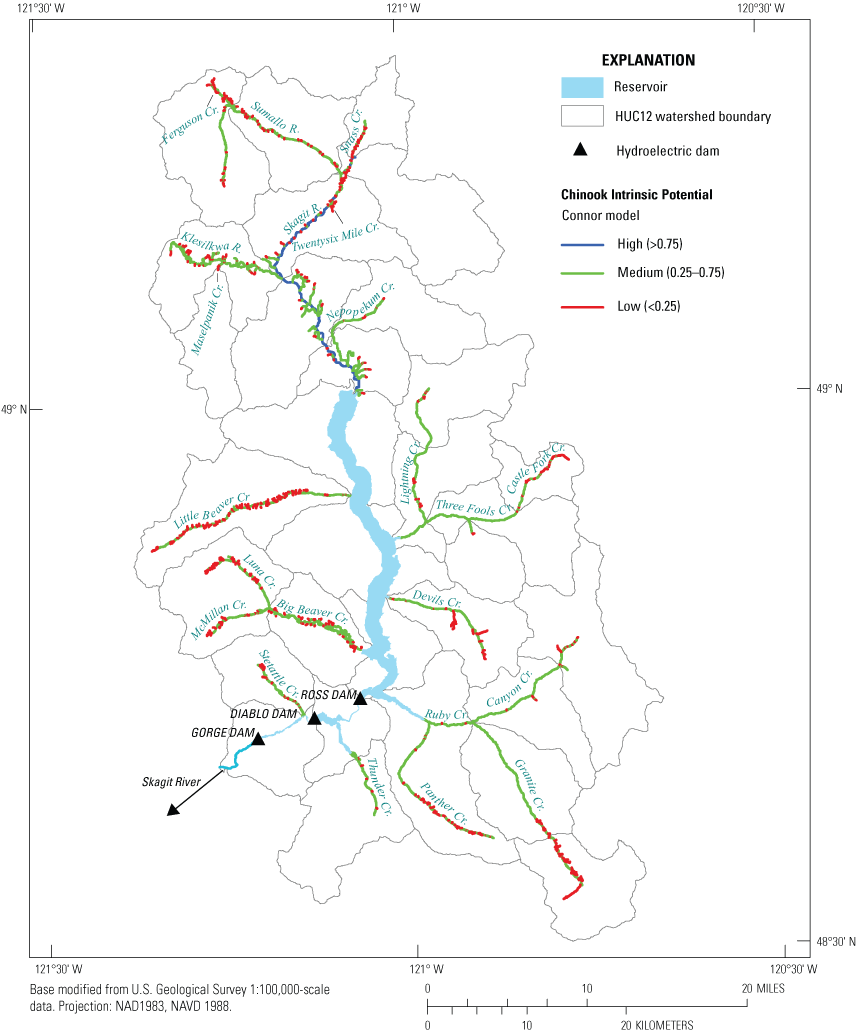
High (greater than [>] 0.75), medium (0.25–0.75), and low (less than [<] 0.25) intrinsic potential scores for Chinook salmon (Oncorhynchus tshawytscha) derived from the Connor intrinsic potential model applied to tributary and main-stem habitat upstream from the Skagit River Hydroelectric Project dams, in northern Washington. USGS Hydrological Unit Code (HUC) is a classification hierarchy to delimit watershed boundaries in successively smaller hydrologic units. HUC12 indicates boundaries of local sub-watershed scale that represents tributary systems.
Across all reaches with low IP habitat, 59.8 percent were scored as having zero IP. In non-targeted tributary reaches, there was no high IP habitat identified, with 78.2 km of medium IP habitat and 86.1 km of low IP habitat identified from non-targeted tributaries (fig. 3).
Chinook Salmon Intrinsic Potential Based on the Busch Model
The Busch model identified 2,360 low (253.6 km), 423 medium (46.0 km), and 51 high (5.6 km) intrinsic potential reaches within the 25 targeted streams for Chinook salmon (fig. 2), with an additional 25 medium (2.8 km) and 1,590 (161.5 km) low intrinsic potential reaches identified from non-targeted reaches (fig. 3). The only high intrinsic potential reaches for Chinook salmon, totaling 5.6 km, were found in the main-stem Skagit River (fig. 5) upstream from the Ross Lake reservoir in Canada. The other 24 targeted streams, except Ferguson Creek (fig. 2), and non-targeted streams (fig. 3) had most of the habitat identified as low intrinsic potential, a total of 253.9 km. Of the 46.0 km of reaches scored with medium intrinsic potential, the Skagit River (18.8 km), Granite Creek (4.3 km), and Ferguson Creek (3.6 km) had greater than 3 km of habitat, with the other 23 reaches ranging from 0 to 2.4 km. There was only 10 km of non-target tributary reaches identified as medium or low non-zero intrinsic potential (fig. 3). Of the low intrinsic potential habitat across all reaches, 90.4 percent scored as having 0 intrinsic potential (with the other 9.6 percent having scores greater than 0 and less than 0.25).
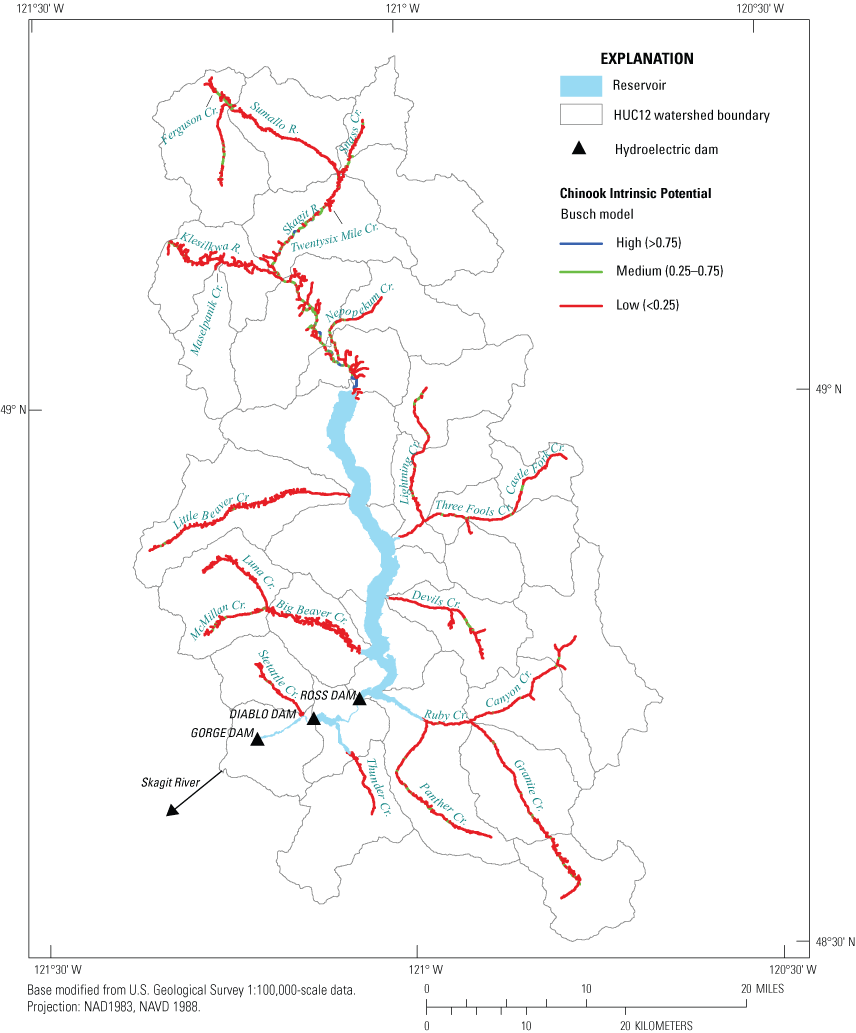
High (greater than [>] 0.75), medium (0.25–0.75), and low (less than [<] 0.25) intrinsic potential scores for Chinook salmon (Oncorhynchus tshawytscha) derived from the Busch intrinsic potential model applied to tributary and main-stem habitat upstream from the Skagit River Hydroelectric Project dams, in northern Washington. USGS Hydrological Unit Code (HUC) is a classification hierarchy to delimit watershed boundaries in successively smaller hydrologic units. HUC12 indicates boundaries of local sub-watershed scale that represents tributary systems.
Chinook Salmon Intrinsic Potential Based on the Cooney and Holzer Model
The Cooney and Holzer model identified 2,164 low (232.0 km), 661 medium (72.2 km), and 9 high (1.0 km) intrinsic potential reaches within the 25 targeted streams for Chinook salmon (fig. 2), with an additional 35 medium (3.7 km) and 1,580 (160.5 km) low intrinsic potential reaches identified from non-targeted reaches (fig. 3). Of the three IP models, this model scored the lowest amount of high intrinsic potential habitat (totaling 1.0 km) for Chinook salmon, with 661 m found in the main-stem Skagit River and 339 m in McMillan Creek (figs. 5 and 6). There were seven targeted streams with greater than 1 km of medium intrinsic potential habitat for Chinook salmon, including the main-stem Skagit River (19.5 km), Klesilkwa River (14.0), Sumallo River (13.0 km), Big Beaver Creek (12.0 km), Little Beaver Creek (4.1 km), Ferguson Creek (3.5 km), and Nepopekum Creek (2.3). Across all 25 streams, 232.0 km of the reaches were rated as having low intrinsic potential (fig. 2). For non-targeted tributaries, there were no high intrinsic potential reaches, 3.7 km of medium intrinsic potential reaches, and 160.5 km of low intrinsic potential reaches (fig. 3). Across all reaches rated as having low intrinsic potential, 59.8 percent had IP scores of zero.
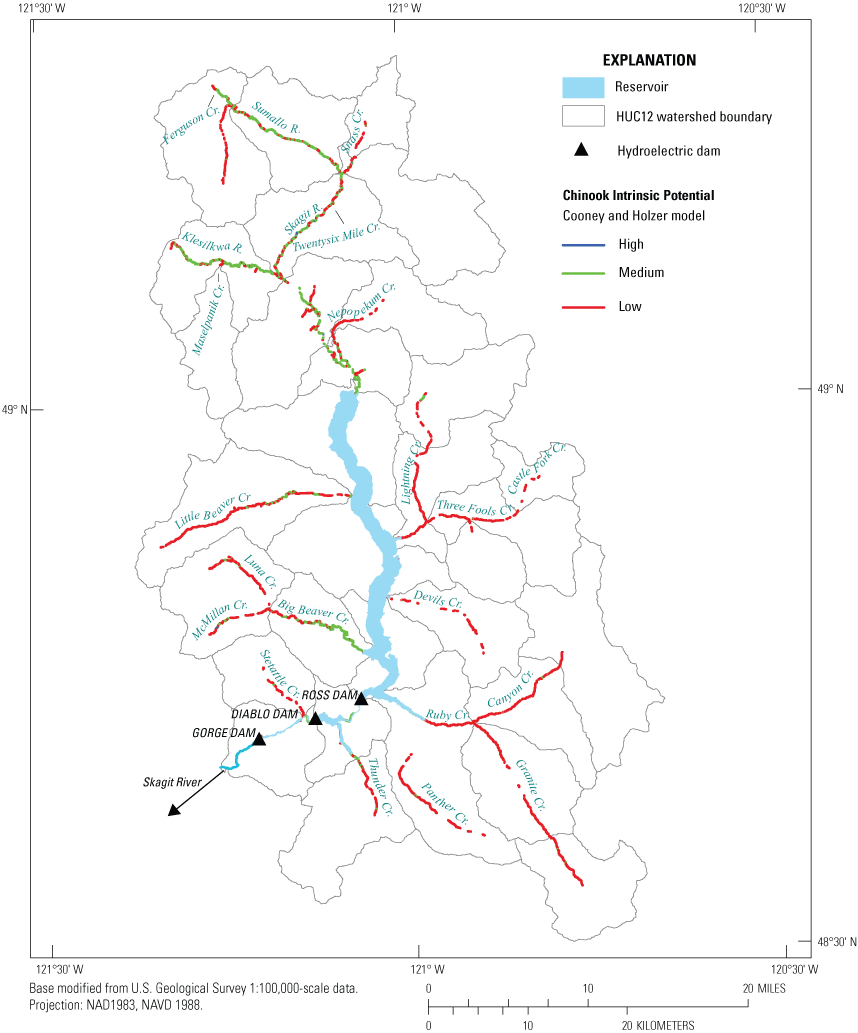
High, medium, and low intrinsic potential scores for Chinook salmon (Oncorhynchus tshawytscha) derived from the Cooney and Holzer intrinsic potential model applied to tributary and main-stem habitat upstream from the Skagit River Hydroelectric Project dams, in northern Washington. USGS Hydrological Unit Code (HUC) is a classification hierarchy to delimit watershed boundaries in successively smaller hydrologic units. HUC12 indicates boundaries of local sub-watershed scale that represents tributary systems.
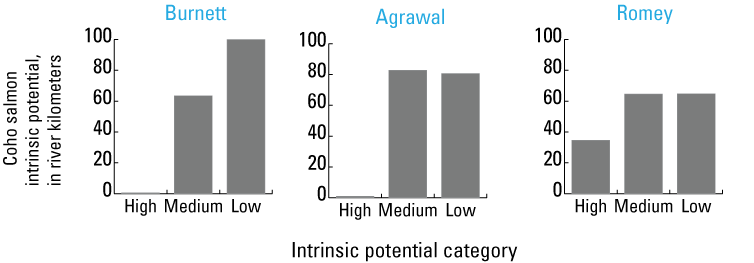
Coho Salmon Intrinsic Potential Model Results
The estimates of IP for coho salmon upstream from the Skagit River Hydroelectric Project dams were similar across the three models. The Burnett model (Burnett and others, 2007), Agrawal model (Agrawal and others, 2005), and Romey model (Terrainworks, 2023) were all based on the same three parameters (gradient, bankfull width, and valley width index), but each model differed in the shape of the habitat preference curves and the IP weights assigned to the curves. All three models showed that most of the habitat upstream was classified as having medium IP habitat for coho salmon. For the 25 target streams, the main difference among the models was the higher amount of low IP reaches identified by the Burnett model and the greater number of streams having high IP by the Romey model. Summaries of habitat parameter values and the number of reaches scored as low, medium, and high IP sections are provided for main-stem and tributary habitat in the United States (table 6) and Canada (table 7).
Table 6.
Reach average values of gradient, valley width index (ratio), bankfull width, and mean annual flow for targeted upper Skagit River streams in the United States by high, medium, or low intrinsic potential (IP) rank for coho salmon (Oncorhynchus kisutch).[Plus or minus (±) standard deviations are shown in parentheses. NA, no reaches were identified for a given stream, model, and intrinsic potential category; m, meter; m3/s, cubic meter per second]
Table 7.
Reach average values of gradient, valley width index (ratio), bankfull width, and mean annual flow for targeted upper Skagit River streams in Canada by high, medium, or low intrinsic potential rank (IP) for coho salmon (Oncorhynchus kisutch).[Plus or minus (±) standard deviations are shown in parentheses. NA, no reaches were identified for a given stream, model, and intrinsic potential category; m, meter; m3/s, cubic meter per second]
Coho Salmon Intrinsic Potential Based on the Burnett Model
The Burnett model identified 551 low (58.4 km), 2,258 medium (244.0 km), and 25 high (2.8 km) IP reaches across all 25 targeted streams (fig. 7), with additional 998 low (100.0 km), 611 medium (63.7 km), and 6 high (0.6 km) IP reaches identified from non-targeted reaches (fig. 8). The only high IP habitat identified for coho salmon by the Burnett model was 2.4 km in the main-stem Skagit River upstream from the Ross Lake reservoir and 339 m in McMillan Creek (fig. 9). Of the 25 target streams, 19 had greater than 1 km of medium IP habitat available, totaling 243.2 km. The other six streams were dominated by (Maselpanik Creek and Slate Creek) or had all (Twentysix Mile, North Fork Canyon, Marmotte, and Hozomeen Creeks) low IP for coho salmon. In the non-targeted reaches, most of the habitat was modeled to have low (100.0) or medium (63.7) IP for coho salmon, with only 634 m of habitat identified from unnamed tributary reaches (fig. 8).
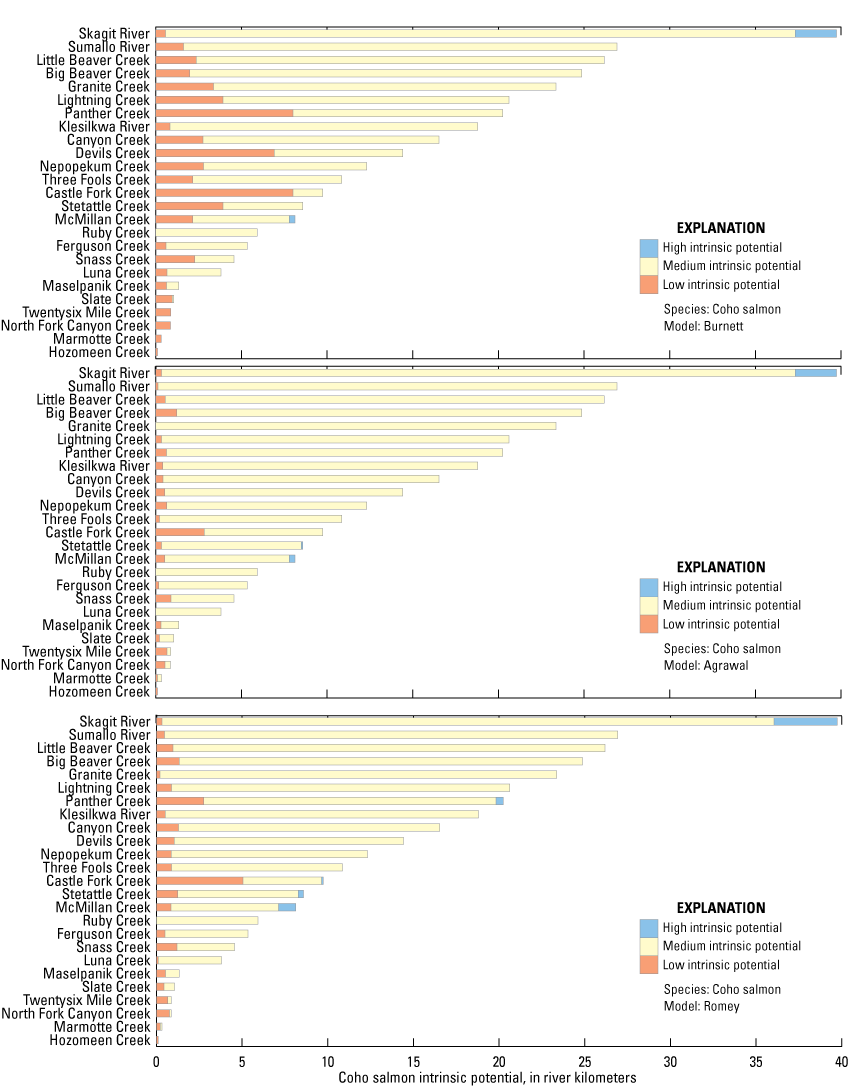
Length in kilometers of high, medium, or low habitat intrinsic potential for coho salmon (Oncorhynchus kisutch) based on three different models for target tributaries upstream from the three upper Skagit River dams, in northern Washington.
Length in kilometers of high, medium, or low habitat intrinsic potential for coho salmon (Oncorhynchus kisutch) based on three different models for non-target tributaries upstream from the three upper Skagit River dams, in northern Washington.
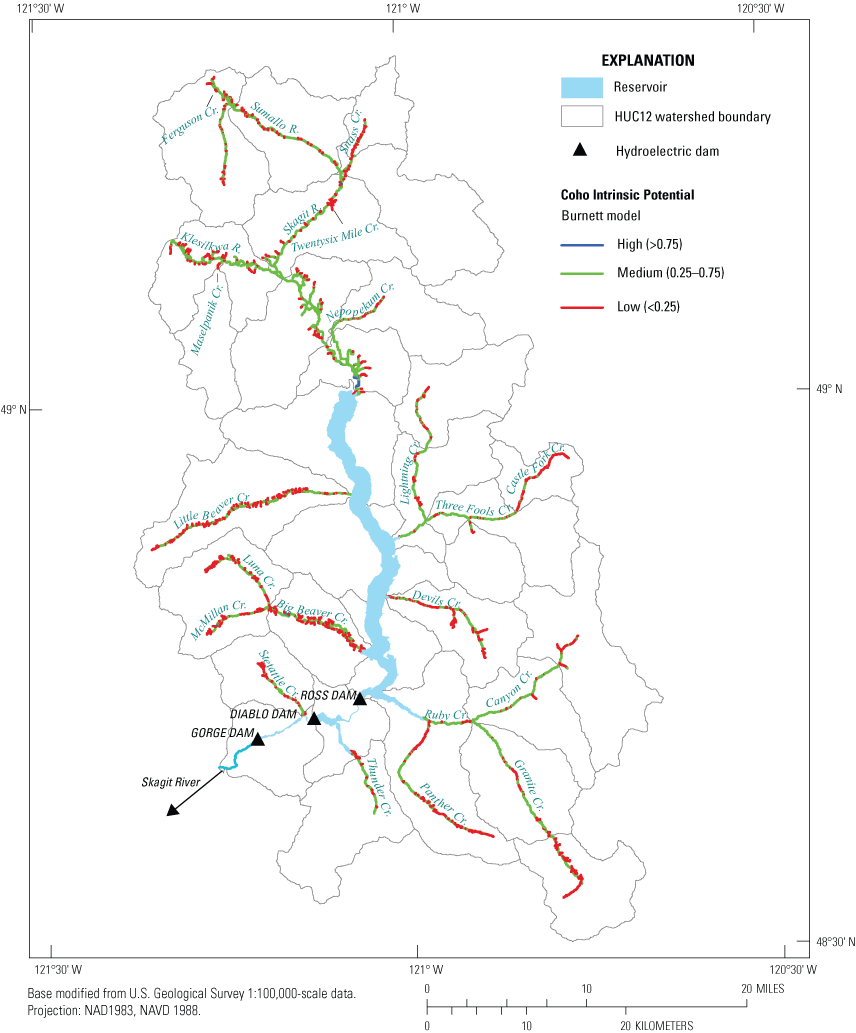
High (greater than [>] 0.75), medium (0.25–0.75), and low (less than [<] 0.25) intrinsic potential scores for coho salmon (Oncorhynchus kisutch) derived from the Burnett intrinsic potential model applied to tributary and main-stem habitat upstream from the Skagit River Hydroelectric Project dams, in northern Washington. USGS Hydrological Unit Code (HUC) is a classification hierarchy to delimit watershed boundaries in successively smaller hydrologic units. HUC12 indicates boundaries of local sub-watershed scale that represents tributary systems.
Coho Salmon Intrinsic Potential Based on the Agrawal Model
Results from the Agrawal model were similar to those found with the Burnett model (fig. 7). The Agrawal model identified 115 low (118.0 km), 2,693 medium (290.5 km), and 26 high (2.4 km) IP reaches within the 25 targeted streams for coho salmon, with an additional 816 low (80.6 km), 790 medium (82.7 km), and 9 high (0.98 km) IP reaches identified from non-targeted reaches. The main difference between the Burnett and Agrawal models was some high intrinsic potential habitat identified in Stetattle Creek (<100 m) by the Agrawal model (fig. 10), which was classified as having medium intrinsic potential by the Burnett model. The amounts of high intrinsic potential habitat found in the main-stem Skagit River (2.4 km) and McMillan Creek (339.4 m) were identical in amount and the identified reaches in the two models. The main difference between the two models was the greater number of reaches classified as having medium intrinsic potential habitat by the Agrawal model (290.5 km), with the difference due to the lesser amount of low intrinsic potential habitat scores for this model compared with the Burnett model. A similar pattern was seen in the non-targeted streams, with more medium intrinsic potential habitat identified by the Agrawal model compared to the Burnett model (82.7 km versus 63.6 km), with the difference due to less total low intrinsic potential habitat (80.6 km versus 100 km; fig. 8).
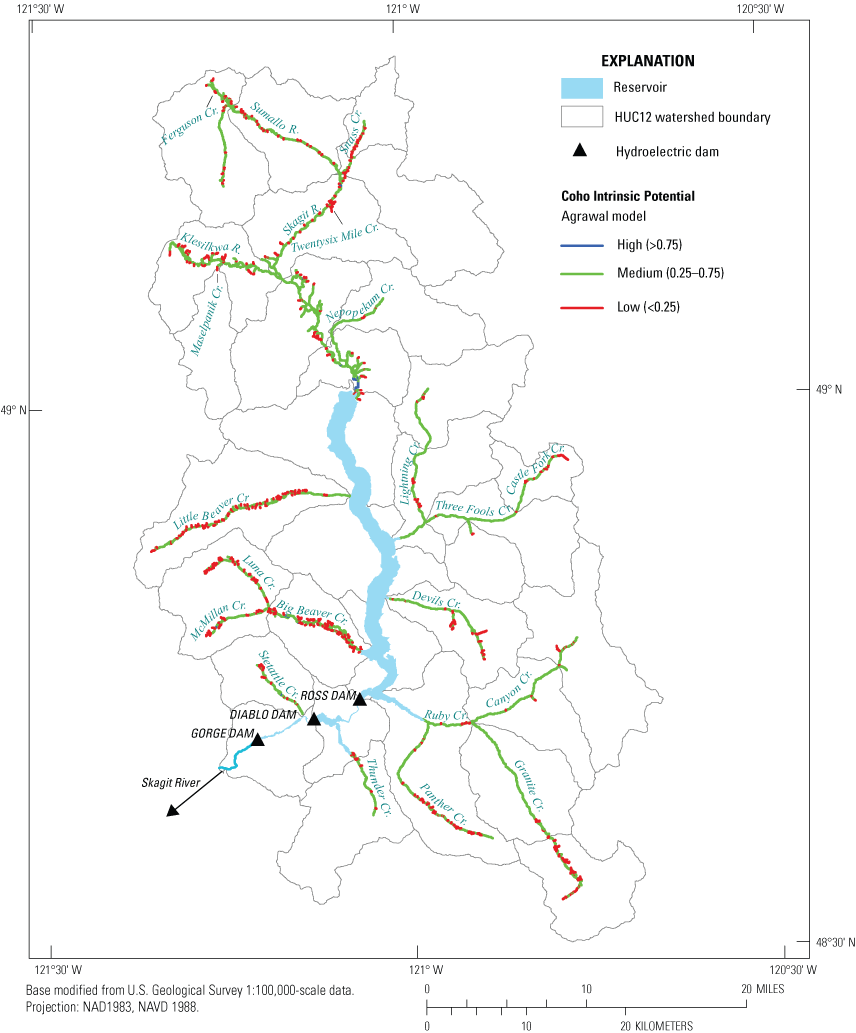
High (greater than [>] 0.75), medium (0.25–0.75), and low (less than [<] 0.25) intrinsic potential scores for coho salmon (Oncorhynchus kisutch) derived from the Agrawal intrinsic potential model applied to tributary and main-stem habitat upstream from the Skagit River Hydroelectric Project dams, in northern Washington. USGS Hydrological Unit Code (HUC) is a classification hierarchy to delimit watershed boundaries in successively smaller hydrologic units. HUC12 indicates boundaries of local sub-watershed scale that represents tributary systems.
Coho Salmon Intrinsic Potential Based on the Romey Model
Of the three coho salmon IP models, a larger amount of high intrinsic potential habitat was identified by the Romey model (fig. 7). This model identified 219 low (22.8 km), 2,564 medium (276.8 km), and 51 high (5.5 km) IP reaches in the 25 targeted streams, and 655 (64.8 km) low, 620 (64.7 km) medium, and 340 (34.7 km) high IP reaches identified from non-targeted reaches. A total of five streams (Skagit River, McMillan Creek, Panther Creek, Stetattle Creek, and Castle Fork Creek) had 5.5 km of high intrinsic potential habitat (fig. 11), with an additional 34.7 km identified in non-targeted tributaries (fig. 8). As seen in the other two intrinsic potential models for coho, most of the total accessible reaches in targeted streams were classified as having medium intrinsic potential (276.8 km).
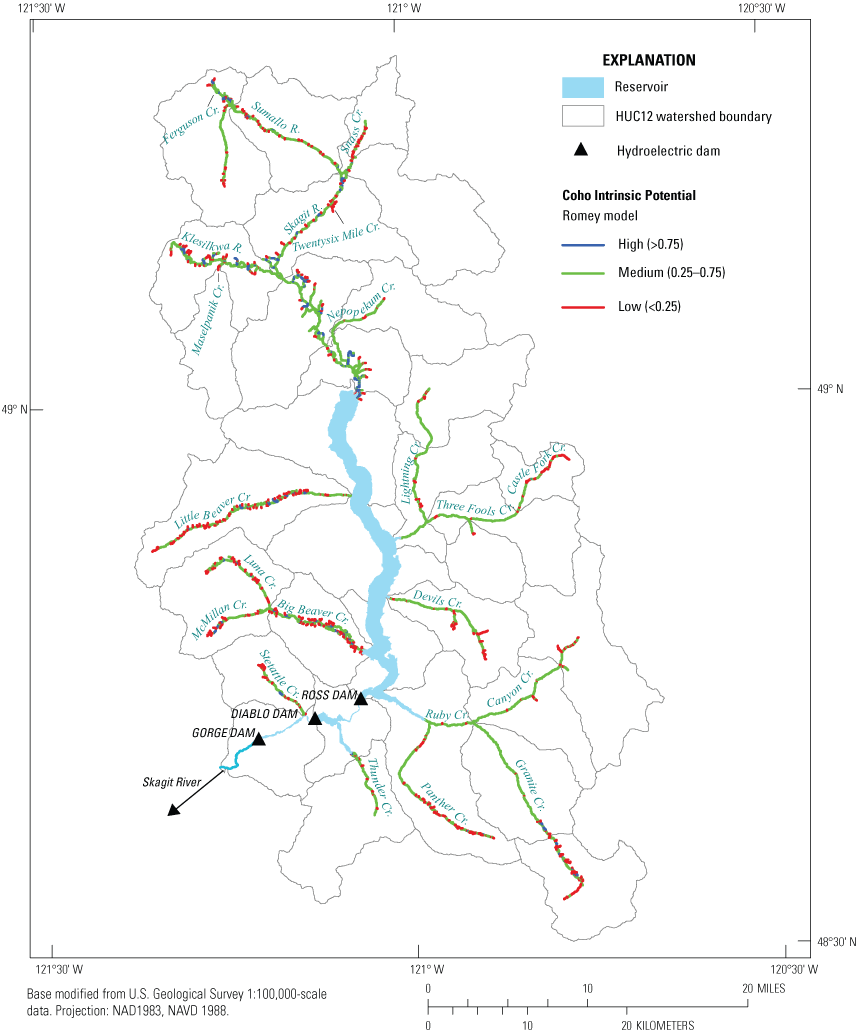
High (greater than [>] 0.75), medium (0.25–0.75), and low (less than [<] 0.25) intrinsic potential scores for coho salmon (Oncorhynchus kisutch) derived from the Romey intrinsic potential model applied to tributary and main-stem habitat upstream from the Skagit River Hydroelectric Project dams, in northern Washington. USGS Hydrological Unit Code (HUC) is a classification hierarchy to delimit watershed boundaries in successively smaller hydrologic units. HUC12 indicates boundaries of local sub-watershed scale that represents tributary systems.
Steelhead Intrinsic Potential Model Results
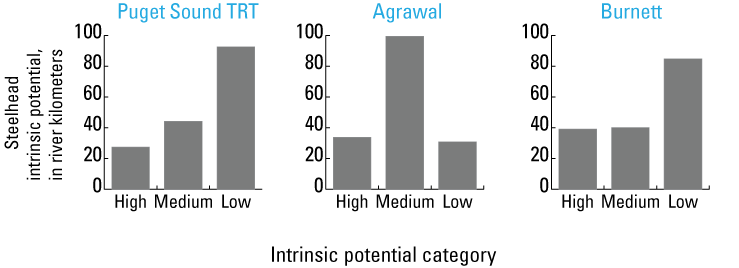
The IP estimates for steelhead upstream from the Skagit River Hydroelectric Project dams were similar across the three models (fig. 12). The Agrawal and Burnett models were calculated using the same three parameters (gradient, bankfull width, and valley width index) but with different weights assigned to the habitat preference curves, whereas the Puget Sound Technical Recovery Team model was based on combinations of gradient and bankfull width assigned as low, medium, and high IP. In general, steelhead showed greater amounts of high IP of the three species examined. The three models differed in the amount of high IP in the Skagit River main stem and the total amount of low IP habitat: the Puget Sound TRT model estimated greater amounts of these habitats than the other two models. Summaries of habitat parameter values and the number of reaches scored as low, medium, and high IP sections are provided for main-stem and tributary habitat in the United States (table 8) and Canada (table 9).
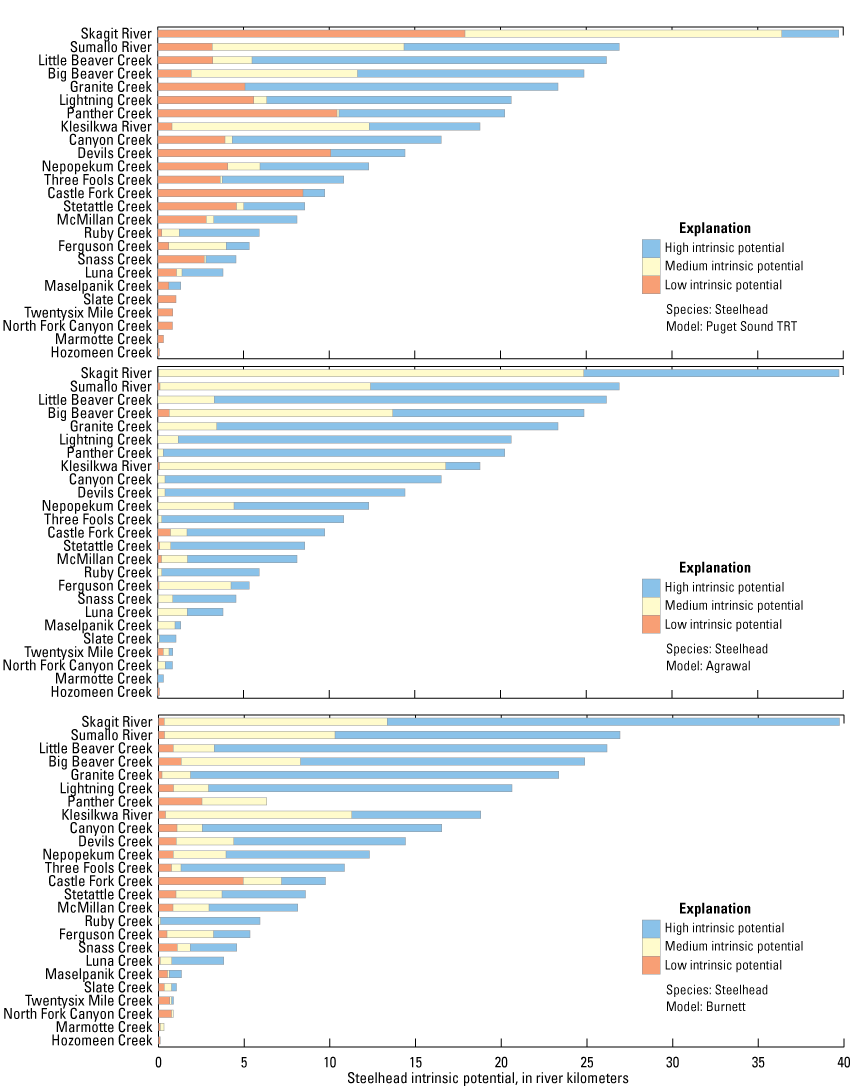
Length in kilometers of high, medium, and low habitat intrinsic potential for steelhead (Oncorhynchus mykiss) based on three different models for target tributaries upstream from the three upper Skagit River dams, in northern Washington.
Table 8.
Reach average values of gradient, valley width index (ratio), bankfull width, and mean annual flow for targeted upper Skagit River streams in the United States by high, medium, or low intrinsic potential (IP) rank for steelhead (Oncorhynchus mykiss).[Plus or minus (±) standard deviations are shown in parentheses. PS_TRT, Puget Sound Technical Recovery Team model; NA, no reaches were identified for a given stream, model, and intrinsic potential category; m, meter; m3/s, cubic meter squared]
Table 9.
Reach average values of gradient, valley width index, bankfull width (ratio), and mean annual flow for targeted upper Skagit River streams in Canada by high, medium, and low intrinsic potential rank (IP) for steelhead (Oncorhynchus mykiss).[Plus or minus (±) standard deviations are shown in parentheses. PS_TRT, Puget Sound Technical Recovery Team model; NA, no reaches were identified for a given stream, model, and intrinsic potential category; m, meter; m3/s, cubic meter per second]
Steelhead Intrinsic Potential Based on the Puget Sound Technical Recovery Team Model
The Puget Sound Technical Recovery Team model identified 880 low (94.4 km), 573 medium (62.1 km), and 1382 high (149.0 km) IP reaches for steelhead across all 25 targeted streams (fig. 12), with additional 919 low (92.6 km), 428 medium (44.2 km), and 268 high (27.5 km) IP reaches identified from non-target reaches (fig. 13). Most of the high IP steelhead habitat was found in tributaries (145.6 km), with fewer high IP steelhead reaches (totaling 3.3.km) found in the main-stem Skagit River (fig. 14). There were 19 targeted tributaries with greater than 1 km of high IP habitat, all targeted streams except Slate Creek, Twentysix Mile Creek, North Fork Canyon Creek, Maselpanik Creek, Marmotte Creek, and Hozomeen Creek (with five of these six having only low IP habitat for steelhead).
Length in kilometers of high, medium, and low habitat intrinsic potential for steelhead (Oncorhynchus mykiss) based on three different models for non-target tributaries upstream from the three upper Skagit River dams, in northern Washington.
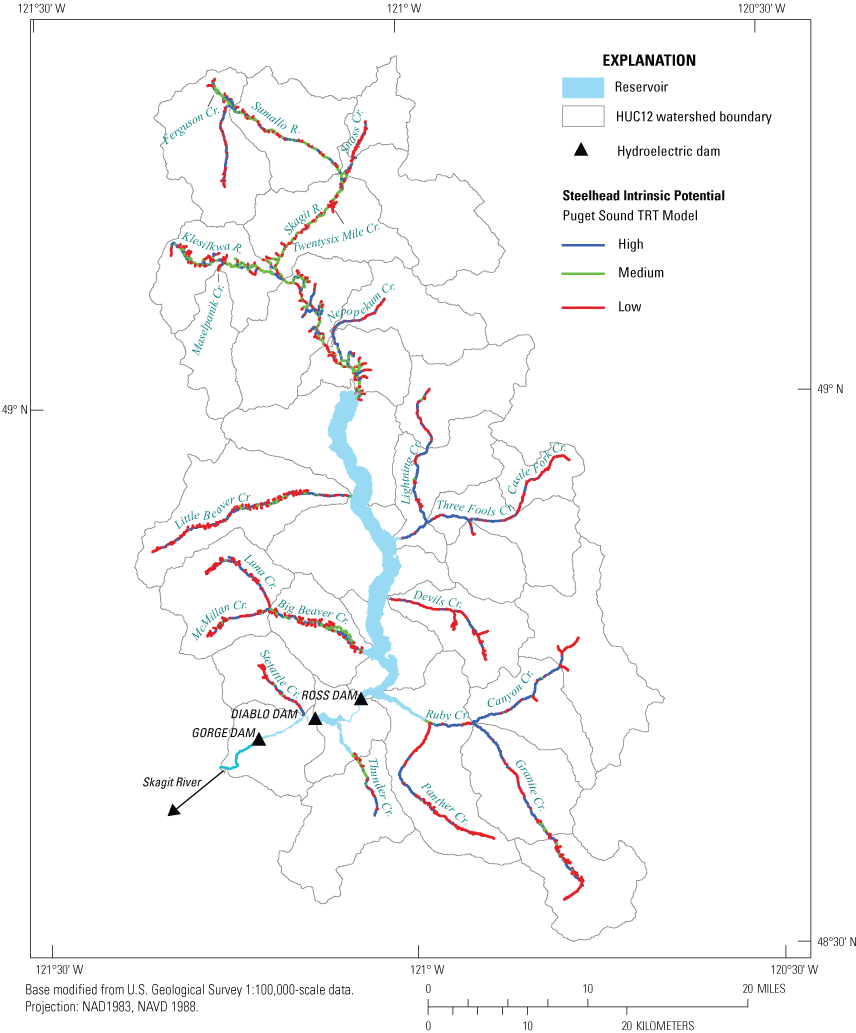
High, medium, and low intrinsic potential scores for steelhead (Oncorhynchus mykiss) derived from the Puget Sound Technical Recovery Team intrinsic potential model applied to tributary and main-stem habitat upstream from the Skagit River Hydroelectric Project dams, in northern Washington. USGS Hydrological Unit Code (HUC) is a classification hierarchy to delimit watershed boundaries in successively smaller hydrologic units. HUC12 indicates boundaries of local sub-watershed scale that represents tributary systems.
Steelhead Intrinsic Potential Based on the Agrawal Model
The Agrawal model identified 28 low (2.5 km), 842 medium (92.3 km), and 1964 high (210.4 km) intrinsic potential reaches for steelhead across all 25 targeted streams (fig. 12), with additional 326 low (30.9 km), 970 medium (99.5 km), and 319 high (33.8 km) IP reaches identified from non-target reaches (fig. 13). As seen in the Puget Sound TRT steelhead model IP results, most of the high IP habitat was found in tributaries (195.5 km) compared with the 14.9 km in the main-stem Skagit River (fig. 15). There were 19 targeted streams that had greater than 1 km of high IP habitat, with 5 of the 6 remaining targeted streams having 329–952 m of high IP habitat. Of the non-targeted streams with names, Thunder Creek (6.8 km) and Cinnamon Creek (1.8 km) had greater than 1 km of high IP habitat, in addition to 22.7 km of high IP habitat found in unnamed streams.
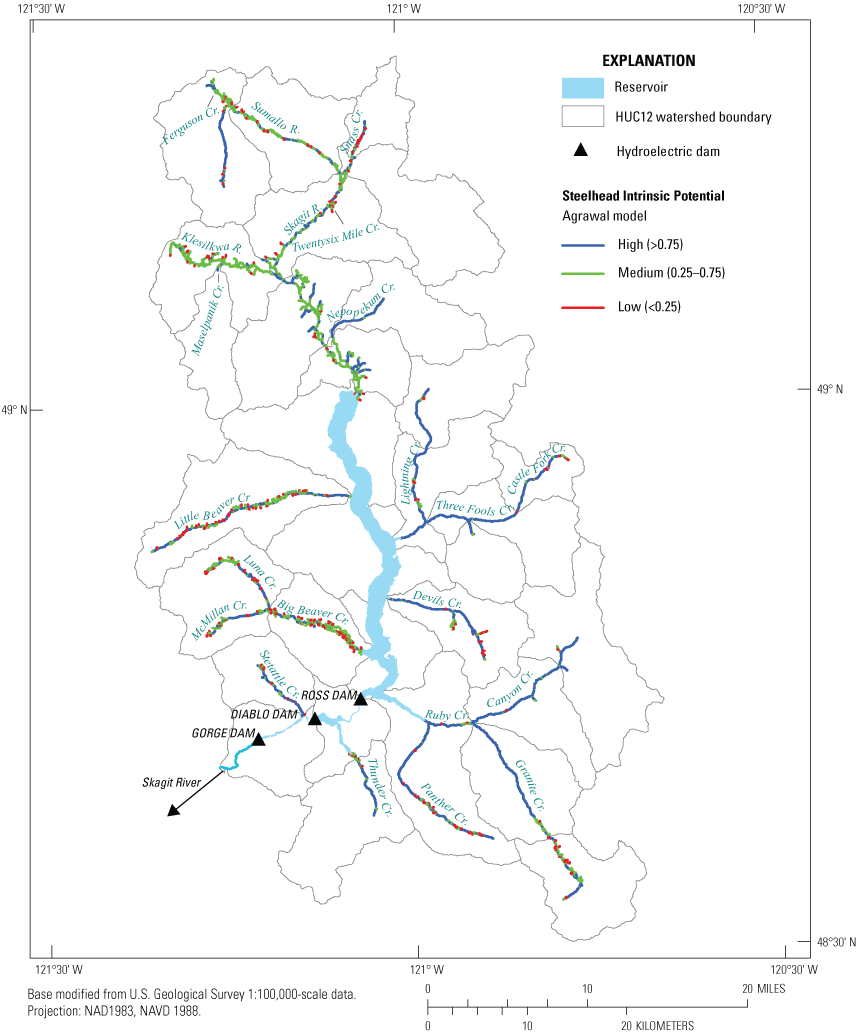
High (greater than [>] 0.75), medium (0.25–0.75), and low (less than [<] 0.25) intrinsic potential scores for steelhead (Oncorhynchus mykiss) derived from the Agrawal intrinsic potential model applied to tributary and main-stem habitat upstream from the Skagit River Hydroelectric Project dams, in northern Washington. USGS Hydrological Unit Code (HUC) is a classification hierarchy to delimit watershed boundaries in successively smaller hydrologic units. HUC12 indicates boundaries of local sub-watershed scale that represents tributary systems.
Steelhead Intrinsic Potential Based on the Burnett Model
The Burnett model identified 205 low (21.3 km), 658 medium (71.4 km), and 1971 high (212.5 km) IP reaches for steelhead across all 25 targeted streams (fig. 12), with an additional 858 low (84.9 km), 387 medium (40.2 km), and 370 high (39.2 km) IP reaches identified from non-target reaches (fig. 13). As seen with the other two steelhead IP models, most of the high IP habitat was found in tributaries (186.1 km) compared with the 26.4 km of high IP habitats in the main-stem Skagit River (fig. 16). There were 19 targeted streams that had greater than 1 km of high IP habitat, with 3 of the 6 having 111–703 m of high IP habitat, in addition to 28.9 km of high IP habitat found in unnamed streams.
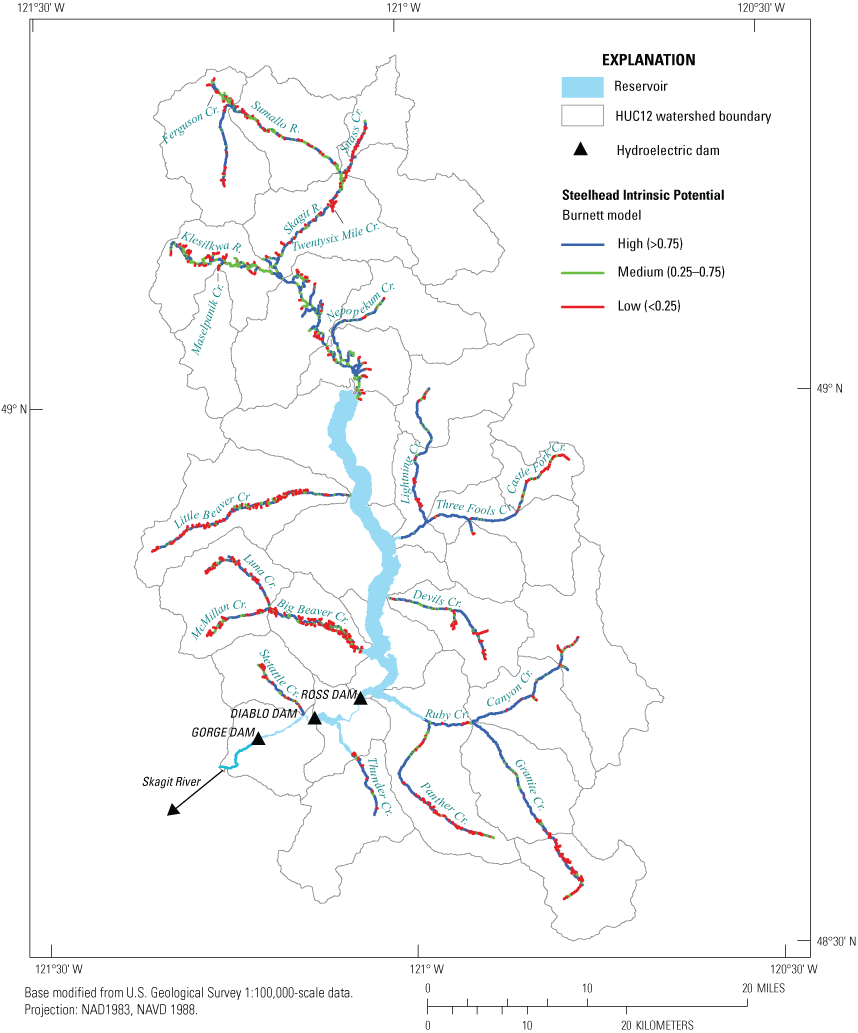
High (greater than [>] 0.75), medium (0.25–0.75), and low (less than [<] 0.25) intrinsic potential scores for steelhead (Oncorhynchus mykiss) derived from the Burnett intrinsic potential model applied to tributary and main-stem habitat upstream from the Skagit River Hydroelectric Project dams, in northern Washington. USGS Hydrological Unit Code (HUC) is a classification hierarchy to delimit watershed boundaries in successively smaller hydrologic units. HUC12 indicates boundaries of local sub-watershed scale that represents tributary systems.
Summary
We used intrinsic potential (IP) models to evaluate the potential habitat for anadromous salmonids upstream from three impassable dams in the upper Skagit River in Whatcom County, northern Washington. This was based on a two-step process within a synthetic geographic information system-based representation of the upper Skagit River Basin derived from 10-meter (m; on United States side of the international border) or 20-m (on the Canadian side) digital elevation models. The first step was estimating the upper extent of potential anadromous fish distribution within select tributaries. We used existing fish passage criteria from the State of Washington (Washington Department of Fish and Wildlife, 2019) based on waterfall height and stream gradient to filter continuous reaches of stream habitat from the confluence of tributary with a reservoir in the upper Skagit River to the first likely upstream barrier, thus defining the likely upstream extent of fish upstream migration. The length estimates derived from the resulting maps were similar to assessments of targeted streams compiled by stakeholders to the Federal Energy Regulatory Commission relicensing process. The second step was to apply existing IP models for target species (coho, Chinook, steelhead [Oncorhynchus kisutch, O. tshawytscha, O. mykiss, respectively]). Intrinsic potential models are general models that were created to estimate habitat potential based on generalized and broad-scale patterns of each species. Our use of three different IP models for each species was an attempt to obtain a consensus view of the amount and quality of habitat available in select tributaries that would be likely for anadromous fish to move into should an introduction program be initiated. With habitat preference curves derived from different populations and regions, the IP models showed similarities and differences in the amount of habitat in each IP category. For coho and steelhead, IP models with habitat suitability curves derived for Skagit River Chinook (Connor and others, 2015) or Puget Sound steelhead behaved differently than the other IP models based on other regions. This is an important point to consider when comparing the differences among the IP models for these species. When applied to the same “end of fish distribution” maps describing potential tributary habitat in the upper Skagit River watershed, the IP models found that the most high IP habitat existed for steelhead, whereas coho and Chinook IP models found that most stream sections were rated as having medium or low IP. These assessments, when coupled with other habitat models to estimate juvenile rearing capacity (for example, Cramer and Ackerman, 2009; Cooper and others 2020; Ramos and Ward, 2022) and bioenergetic growth potential (Weber and others, 2014; Thompson and Beauchamp, 2016) are a useful first step in evaluating the feasibility of potential anadromous salmonid introduction programs.
References Cited
Agrawal, A., Schick, R.S., Bjorkstedt, E.P., Szerlong, R.G., Goslin, M.N., Spence, B.C., Williams, T.H., and Burnett, K.M., 2005, Predicting the potential for historical coho, Chinook, and steelhead habitat in northern California: Santa Cruz, California, National Oceanic and Atmospheric Administration, Technical Memorandum NOAA-TM-NMFS-SWFSC-379, 34 p.
Clay, C.H., and Eng, P., 2017, Design of fishways and other fish facilities (2d ed.): Boca Raton, Florida, CRC Press. [Also available at https://doi.org/10.1201/9781315141046.]
Connor, E., Lowry, E., Smith, D., Ramsden, K., Barkdull, B., Warinner, B., Hartson, R., and Brocksmith, R., 2015, Tributary assessment for potential Chinook salmon rearing habitat and recommendations for prioritizing habitat protection and restoration: Skagit Watershed Council Report, accessed November 22, 2021, at https://www.skagitwatershed.org/wp-content/uploads/Tier-2-Tributary-composite-2015-02-04_final-draft-2.pdf.
Cooney, T.D., and Holzer, D.M., 2006, Appendix C—Interior Columbia basin stream type Chinook salmon and steelhead populations—Habitat intrinsic potential analysis: Interior Columbia Basin Technical Recovery Team (ICTRT), Viability criteria review draft: Seattle, Washington, Northwest Fisheries Science Center, 17 p. [Also available at https://www.salmonrecovery.gov/Files/BiologicalOpinions/2000/XAppendix_C.pdf.]
ESRI, 2023, ArcGIS Pro version 3.1, accessed April 14, 2023, at https://www.esri.com/en-us/arcgis/products/arcgis-pro/overview.
Hard, J.J., Myers, J.M., Connor, E.J., Hayman, R.A., Kope, R.G., Lucchetti, G., Marshall, A.R., Pess, G.R., and Thompson, B.E., 2015, Viability criteria for steelhead within the Puget Sound distinct population segment: National Oceanic and Atmospheric Administration Technical Memorandum NMFS-NWFSC-129, 367 p. [Also available at https://doi.org/10.7289/V5/TM-NWFSC-129.]
Seattle City Light, 2023, Skagit relicensing public documents library: accessed April 14, 2023, at https://www.seattle.gov/light/skagit/Relicensing/default.htm.
Sheer, M.B., Busch, D.S., Gilbert, E., Bayer, J.M., Lanigan, S., Schei, J.L., Burnett, K.M., and Miller, D., 2009, Development and management of fish intrinsic potential data and methodologies—State of the IP 2008 Summary report: Portland, Oregon, Pacific Northwest Aquatic Monitoring Partnership Series 2009–004, 56 p.
Terrainworks, 2023, NetMap tools, accessed April 14, 2023, at https://terrainworks.com/get-netmap-virtual-watersheds-and-tools.
Washington Department of Fish and Wildlife, 2019, Fish passage inventory, assessment, and prioritization manual: Olympia, Washington, Washington Department of Fish and Wildlife, 284 p. [Also available at https://wdfw.wa.gov/publications/02061.]
Datums
Vertical coordinate information is referenced to the North American Vertical Datum of 1983 (NAVD 83).
Horizontal coordinate information is referenced to the North American Datum of 1983 (NAD 83).
For information about the research in this report, contact
Director, Western Fisheries Research Center
U.S. Geological Survey
6505 NE 65th Street
Seattle, Washington 98115-5016
https://www.usgs.gov/centers/wfrc
Manuscript approved on September 20, 2023
Publishing support provided by the U.S. Geological Survey
Science Publishing Network, Tacoma Publishing Service Center
Disclaimers
Any use of trade, firm, or product names is for descriptive purposes only and does not imply endorsement by the U.S. Government.
Although this information product, for the most part, is in the public domain, it also may contain copyrighted materials as noted in the text. Permission to reproduce copyrighted items must be secured from the copyright owner.
Suggested Citation
Duda, J.J., and Hardiman, J.M., 2023, Applying intrinsic potential models to evaluate salmon (Oncorhynchus spp.) introduction into main-stem and tributary habitats upstream from the Skagit River Hydroelectric Project, northern Washington: U.S. Geological Survey Open-File Report 2023-1077, 44 p. https://doi.org/10.3133/ofr20231077.
ISSN: 2331-1258 (online)
Study Area
| Publication type | Report |
|---|---|
| Publication Subtype | USGS Numbered Series |
| Title | Applying intrinsic potential models to evaluate salmon (Oncorhynchus spp.) introduction into main-stem and tributary habitats upstream from the Skagit River Hydroelectric Project, northern Washington |
| Series title | Open-File Report |
| Series number | 2023-1077 |
| DOI | 10.3133/ofr20231077 |
| Publication Date | December 18, 2023 |
| Year Published | 2023 |
| Language | English |
| Publisher | U.S. Geological Survey |
| Publisher location | Reston, VA |
| Contributing office(s) | Western Fisheries Research Center |
| Description | Report: viii, 44 p.; Data Release |
| Country | Canada, United States |
| State | Washington |
| Online Only (Y/N) | Y |