

Physics to Fish: Understanding the Factors that Create and Sustain Native Fish Habitat in the San Francisco Estuary
Links
- Document: Report (40 MB pdf) , HTML , XML
- NGMDB Index Page: National Geologic Map Database Index Page (html)
- Download citation as: RIS | Dublin Core
Acknowledgments
Funding was provided by the Bureau of Reclamation under interagency agreement #R15PG00085. Field sampling for the fish study elements was authorized by California Department of Fish and Wildlife Scientific Collection Permit SC-3602, National Marine Fisheries Service Research Permit #19121, memorandums of understanding for the take of threatened and endangered species issued by the California Department of Fish and Wildlife, and take authority obtained through the Interagency Ecological Program.
The authors recognize and are thankful for the leadership, expertise, and creative inspiration of co-author, Larry Brown, who passed away during the writing of this report. The authors also recognize and appreciate the efforts of Robin Stewart (U.S. Geological Survey) for providing a constructive review of an early draft of this report. The hard work and dedication of many U.S. Geological Survey staff who collected and processed data made this report possible.
Executive Summary
The Bureau of Reclamation (Reclamation) operates the Central Valley Project (CVP), one of the nation’s largest water projects. Reclamation has an ongoing need to improve the scientific basis for adaptive management of the CVP and, by extension, joint operations with California’s State Water Project. The U.S. Geological Survey (USGS) works cooperatively with the Bureau of Reclamation to provide scientific support for the management of Reclamation’s CVP project. Major habitat restoration efforts and a new water-diversion point are planned to benefit delta smelt (Hypomesus transpacificus) and other species of concern while ensuring the reliability of water supply. In addition, various flow actions and management activities have been identified as possible methods to increase populations of delta smelt and salmonid (Oncorhynchus spp.) runs of concern. The overarching goal of this cooperative project was to provide Reclamation with the scientific information needed to evaluate the efficacy of ongoing and future adaptive management actions and to improve the scientific basis for more flexible CVP operations that would achieve water-supply reliability and fish protection. The research and monitoring described in this report comprises the period 2015–19 and focuses on management issues related to native fish species of concern, especially delta smelt. Conserving the delta smelt population while providing a reliable water supply is a primary management and policy issue in California.
Our approach for this cooperative project is based on the “physics to fish” concept, the idea that high-quality habitat is generated and sustained by the interaction between physical processes and the landscape. These interactions create a template for chemical and biological processes that can change across a variety of spatial and temporal scales. Following this concept, this project (hereafter referred to as “the physics to fish project”) included monitoring and studies of water flows, sediments, water quality, and invertebrate and fish dynamics across a range of spatial and temporal scales and in regions relevant to resource managers tasked with managing water supplies and ecosystem health in the San Francisco Estuary. The intent of this approach was to document the habitat conditions, important processes, and interactions among them that create high-quality habitat for native fishes so that the likely effects of future management actions (for example, habitat restoration) can be objectively assessed at the local (site-specific), regional (within subregions of the estuary), and landscape (across the entire estuary and beyond) scales.
Hydrodynamically, the upper estuary (landward of Carquinez Strait) is characterized by a fixed volume of tidally exchanged water (for example, tidal prism) that interacts with the existing channel network and bathymetry to create regions with differing hydrodynamics. Our results indicate that careful study of construction or reoperation of existing infrastructure to perform management actions can help (1) improve the accuracy of hydrodynamic models; (2) further understanding of ecological effects; and (3) enhance abilities to predict ecological outcomes. At the local scale, we developed a new concept called the Lagrangian to Eulerian (LE) ratio that can be used as a tool for understanding the importance of various hydrodynamic processes in specific channels or channel networks and for forecasting transport dynamics. Channels with LE ratios<1 in a channel network or in a dead-end slough are hydrodynamically able to develop an exchange zone between two parcels of water that may have different chemical and physical properties. In a dead-end channel, there is a landward region with long residence time (no-exchange zone) and a seaward region with short residence time (high-exchange zone) that are well mixed with seaward waters. At the transition (exchange zone) between the high and no-exchange regions, a gradient will form in water-quality constituents that differ in concentration between the landward and seaward waters.
Turbidity affects fish habitat and has declined through time in the San Francisco Estuary. Average turbidity across the Sacramento–San Joaquin Delta (hereafter referred to as “the Delta”) is dependent on annual hydrology. In dry years, the region around Cache Slough (known regionally as the “Cache Slough Complex”) in the northern Delta is generally more turbid than Suisun Bay and the lower Sacramento River. When the Yolo By-Pass (known regionally as “Yolo Bypass”), a large flood bypass that runs parallel to the Sacramento River in the northern Delta, is not flooding and river flows are lower, sediment is usually transported into the Cache Slough Complex because flood tides dominate ebb tides, resulting in transport of suspended sediment from seaward areas of the upper estuary into the Cache Slough Complex. These hydrodynamic conditions also favor the formation of turbidity maximums (TMs) in the Cache Slough Complex. The TMs are areas of higher suspended-sediment concentration, providing higher-turbidity habitat favored by some fishes, including delta smelt, and they can also concentrate other constituents, including phytoplankton and organic carbon that can be important in food webs.
Pelagic primary production by phytoplankton is the basis for Delta food webs supporting pelagic fishes such as delta smelt; however, phytoplankton abundance in the Delta has declined during recent decades. We examined how nutrients, hydrodynamics, and other factors affect phytoplankton blooms. Based on our results, we developed three new concepts of phytoplankton bloom formation in the Delta, each associated with a distinct set of hydrologic conditions. First, productivity cascades highlighted how local processes can contribute to phytoplankton blooms observed at the regional scale. Second, we observed phytoplankton blooms in the upper San Francisco Estuary that were associated with transport out of Yolo By-Pass (transport blooms). Third, we also documented a series of phytoplankton blooms that were in the confluence area at the landward edge of Suisun Bay. The conditions leading to creation of confluence phytoplankton blooms are not yet understood, but the confluence region connects the Cache Slough Complex with Suisun Marsh. Therefore, blooms in this area have the potential to spread to large areas of the Delta.
At the landscape scale, the distribution of the invasive clams (Potamocorbula amurensis and Corbicula fluminea, hereafter referred to as “Corbicula”) is driven by salinity. At smaller spatial scales, the distribution of either species is sensitive to multiple factors affecting survival and reproduction, complicating efforts to predict distribution and abundance without considering local-scale conditions across the area of interest. In the Cache Slough Complex, the area landward of the exchange zone in regions with LE ratio<1 were characterized by low abundances of Corbicula probably because recruits from seaward areas are not transported past the exchange zone and because there are no landward tributaries with adult Corbicula to provide an upstream source of recruits. Corbicula biomass was highest near or downstream from the exchange zone consistent with Corbicula grazing on phytoplankton produced in the exchange zone or transported from the no-exchange zone. The severity of Corbicula grazing could be reduced by manipulating the hydrodynamic characteristics of waterways; however, the beneficial and harmful effects on the organisms meant to benefit from increased phytoplankton production, including zooplankton and fish species of concern, should be thoroughly examined before manipulating hydrodynamic characteristics.
The distribution of fishes at the landscape scale is generally driven by the position of the salinity field in the estuary. The physics to fish project compared distributions of fishes at Ryer Island, a tidal wetland in Suisun Bay and a region of variable salinity, with fish distributions at the Cache Slough Complex, a freshwater region. At Ryer Island, there was an absence of freshwater invasive species and an abundance of native species, such as Sacramento splittail (Pogonichthys macrolepidotus), tule perch (Hysterocarpus traskii), and Sacramento pikeminnow (Ptychocheilus grandis). The native species were almost exclusively captured in wetland and nearshore shallow-water habitat regardless of water-quality conditions. In the Cache Slough Complex, our regional scale objective was to elucidate how hydrodynamic-physical habitat interactions drive fish-community structure. Our studies showed that dendritic channel systems were better able to support native species, while intertidal habitats supported those species best able to exploit the transient character of the habitat. Habitats upstream from the exchange zone were especially important in supporting high numbers of native fishes relative to within or downstream from the exchange zone. Many of the native species were associated with tidal marsh in the no-exchange zone. More pelagic-oriented, mobile species, such as Striped Bass (Morone saxatilis), threadfin shad (Dorosoma petenense), and Sacramento pikeminnow, were more affected by water-quality conditions, such as turbidity.
The physics to fish concept developed in this project provides a framework for designing individual projects and for considering the cumulative effects of multiple projects in a region, using the LE ratio as a guiding metric. The physics to fish concept may also provide a suitable framework for coordinating management actions. Tidal wetlands can function in several ways in the hydrodynamic framework. Relatively small tidal wetlands with short channel networks and with LE ratios>1 are not able to maintain a landward no-exchange zone or an exchange zone. This likely means that any contributions to pelagic food webs would be limited to resources derived from wetland vegetation, which can include dissolved and particulate organic matter (detritus) and populations of consumers that can increase in abundance based on those resources. The fate of the contributed production from these channels depends on the characteristics of the receiving waters seaward of the tidal wetland. If these channels join a large system such as Suisun Bay, then any contribution is likely to be rapidly dispersed in the larger volume; however, the channel junction might provide a focal point for consumers, such as fishes, to congregate and feed on material leaving the wetland on ebb tides before it is dispersed in the larger volume. Fishes might also access these resources by entering the wetland.
The physics to fish project has established a foundation and several new concepts for understanding how habitat restoration can benefit native fish populations at the local and regional levels. Many of the ideas regarding habitat restoration and channel modifications outlined in this report could help guide management actions that could improve conditions for native fishes at little or no water cost beyond water already dedicated to other management actions. A complete list of products originating from this work is provided in appendix 1.
Introduction
The Bureau of Reclamation (Reclamation) operates the Central Valley Project (CVP), one of the nation’s largest water conveyance projects. The CVP includes facilities distributed across California from the Cascade Range (not shown) in the north to the southern Central Valley. The CVP facilities are used to manage river flows and water quality in the Sacramento and San Joaquin Rivers, and internal flow distributions in the Sacramento–San Joaquin Delta (hereafter referred to as “the Delta;” fig. 1) of the San Francisco Estuary (fig. 2). The purpose of the CVP is to supply fresh water to the people of California for agricultural, municipal, and industrial uses, as well as for other beneficial uses, such as the environment (wildlife refuges, instream flows; Bureau of Reclamation, 2022). Reclamation has an ongoing need to improve the scientific basis for adaptive management of the CVP. The U.S. Geological Survey (USGS) works cooperatively with the Bureau of Reclamation to provide scientific support for the adaptive management of Reclamation’s CVP project.
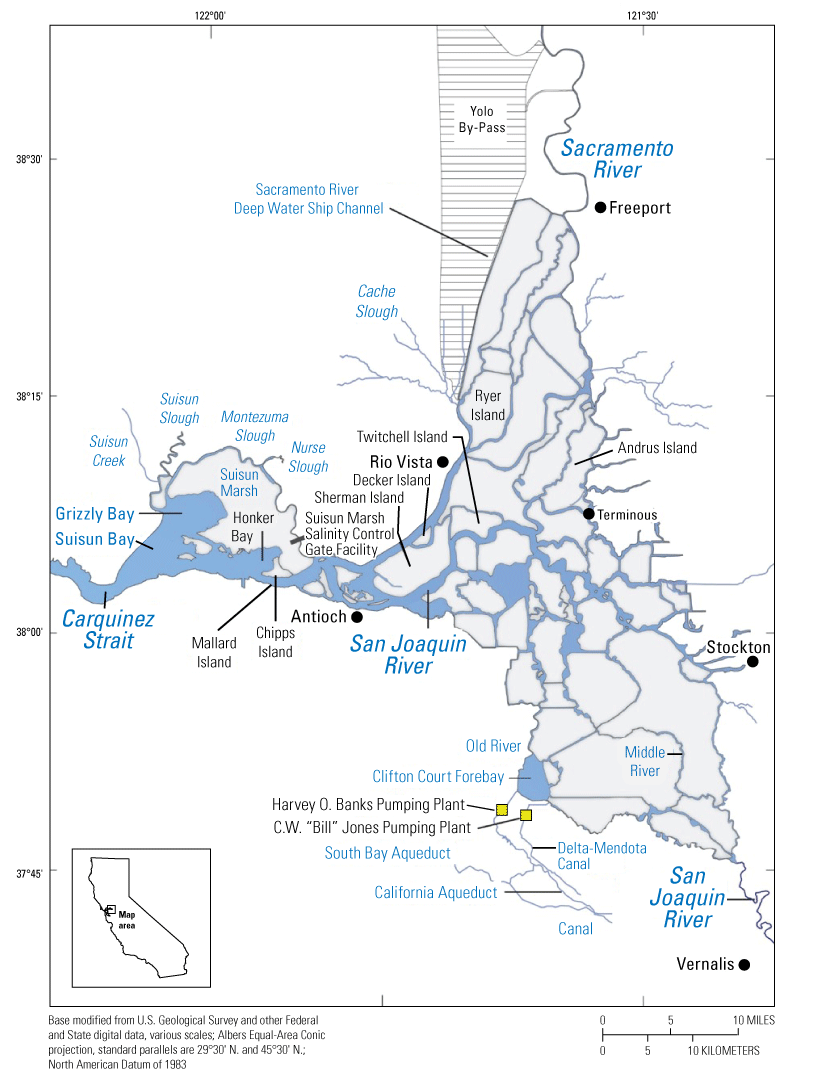
Upper San Francisco Estuary, which consists of the Sacramento–San Joaquin Delta (“the Delta”), California, which is the area landward (east) of the Carquinez Strait, and areas seaward of the Delta, which includes Carquinez Strait.
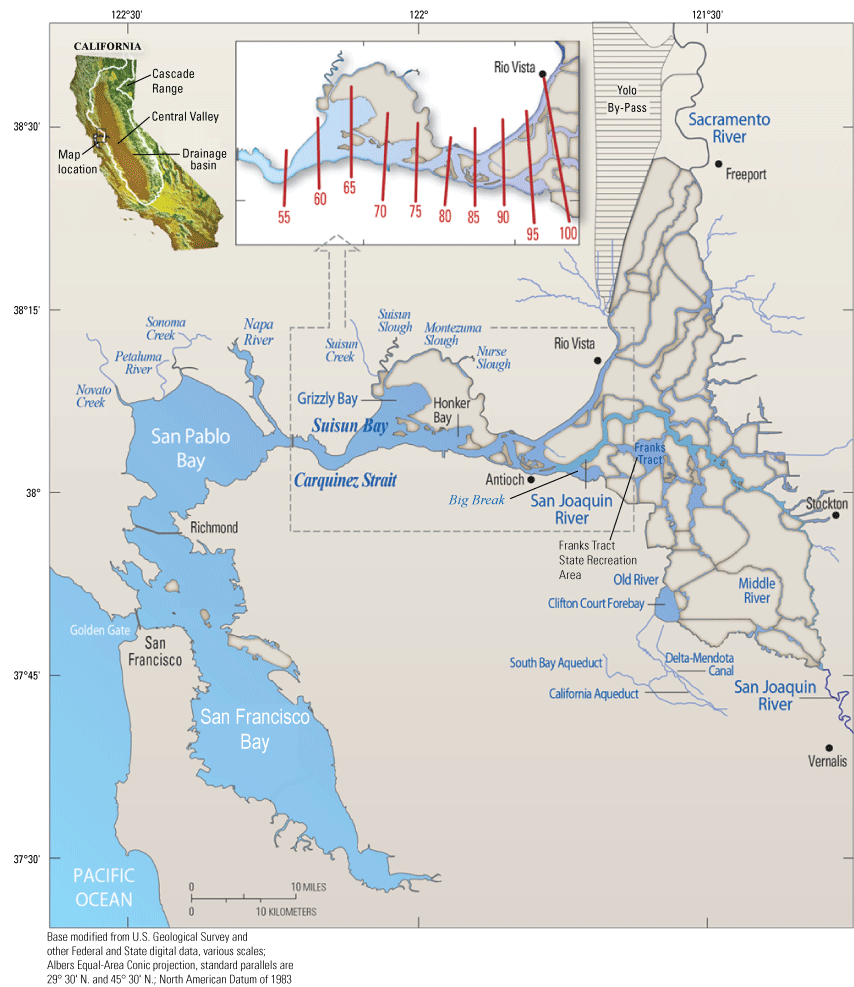
The San Francisco Estuary. The inset shows various positions of X2 (as red lines), which is defined as the distance in kilometers from the Golden Gate to the 2-practical salinity units (PSU) near-bottom isohaline (Jassby and others, 1995). San Francisco Bay includes the area labeled in the figure, San Pablo Bay, Carquinez Strait, and Suisun Bay.
Methods
Approach
Our approach for the physics to fish project is based on the “physics to fish” concept, the idea that fish habitat is generated and sustained by the interaction between physical processes and the landscape which creates the foundation for chemical and biological processes. These processes change across a variety of spatial and temporal scales. This perspective is widely supported in the literature, and these interactions are particularly complex in estuaries because of the dynamic interplay between freshwater inflows, the salt field, and tides (Peterson, 2003; Kimmerer, 2004; Menninger and Palmer, 2006; Interagency Ecological Program-Management, Analysis and Synthesis Team, 2015; Henriques and others, 2017). The interdisciplinary physics to fish project consists of a suite of interlinked study elements exploring these processes and their interactions through monitoring and focused studies.
Our approach for the synthesis report mirrors the study approach of the physics to fish project. Following the “physics to fish” concept, we begin this synthesis with a discussion of physical processes described in terms of hydrodynamics, which describes the movement of water in the San Francisco Estuary, and thus the transport of dissolved and suspended constituents, such as salt and sediment particles (see the “Hydrodynamics” and “Transport” sections). In addition to describing new observations and concepts, the “Hydrodynamics” section provides a brief overview of previously published concepts that are applied throughout the report. Using these concepts, we then describe how hydrodynamics affect the transport of suspended sediment in the San Francisco Estuary (see “Sediment” section). Next, we consider how hydrodynamics affects the transport of nutrients and biomass of phytoplankton. Phytoplankton is a key component of the pelagic (open water) food web (see “Nutrients and Phytoplankton” section; the concentration of chlorophyll, the major photosynthetic pigment in phytoplankton, is used as a surrogate for biomass of phytoplankton in this report). We then explore how grazing by invasive clams affects phytoplankton biomass (see “Clams” section). Finally, we consider how all these physical and biological processes interact to produce conditions favorable or unfavorable for fishes of interest (see “Fish” section). Results are presented in the context of either the calendar year or water year (WY). The WY begins on October 1 of the previous year and ends on September 30. Calendar year can generally be assumed unless WY is specifically identified as the basis of results.
We do not discuss the effects of water operations on hydrodynamics in detail. This topic is complex and involves many areas of the Delta that are peripheral to the studies presented in this report. We discuss such effects, as needed, to provide context for the study elements that were part of the overall physics to fish project.
The intent of this approach was to document the habitat conditions, important processes, and interactions among them that create high-quality habitat for native fishes so that the likely effects of management actions (habitat restoration) can be objectively assessed. The primary species of interest is delta smelt (Hypomesus transpacificus); however, the low population size of delta smelt complicates a direct assessment of their response because of low catches and the inability to obtain collection permits for such directed take. Therefore, we assess likely effects to delta smelt by comparing observed conditions with conditions expected to support delta smelt as determined from other studies, analyses, and syntheses (Interagency Ecological Program-Management, Analysis and Synthesis Team, 2015).
We generally address three geographic scales: (1) landscape, (2) regional, and (3) local. The landscape scale spans the entire San Francisco Estuary from the near-shore ocean to the upstream limits of tidal influence, with some topics (see “Sediment” section) also including consideration of the upstream watersheds. Sometimes we refer to the upper San Francisco Estuary, which consists of the Delta, Suisun Bay, and Suisun Marsh; we define Suisun Marsh as a complex of tidal and managed wetlands near Ryer Island (fig. 1). This area includes most of the delta smelt habitat during most environmental conditions. The regional scale includes subregions of the estuary with generally similar hydrodynamic conditions (fig. 3; see “Hydrodynamics” section for details). Much of the physics to fish project focused on the “Cache Slough Complex” (fig. 4), an area we define to include Cache and Lindsey Sloughs, the Sacramento River Deep Water Ship Channel, the Toe Drain, Liberty Island, Little Holland Tract, and associated connecting channels, including the stairsteps at the northern end of Liberty Island; however, some study components addressed multiple regions to better answer specific questions of interest.
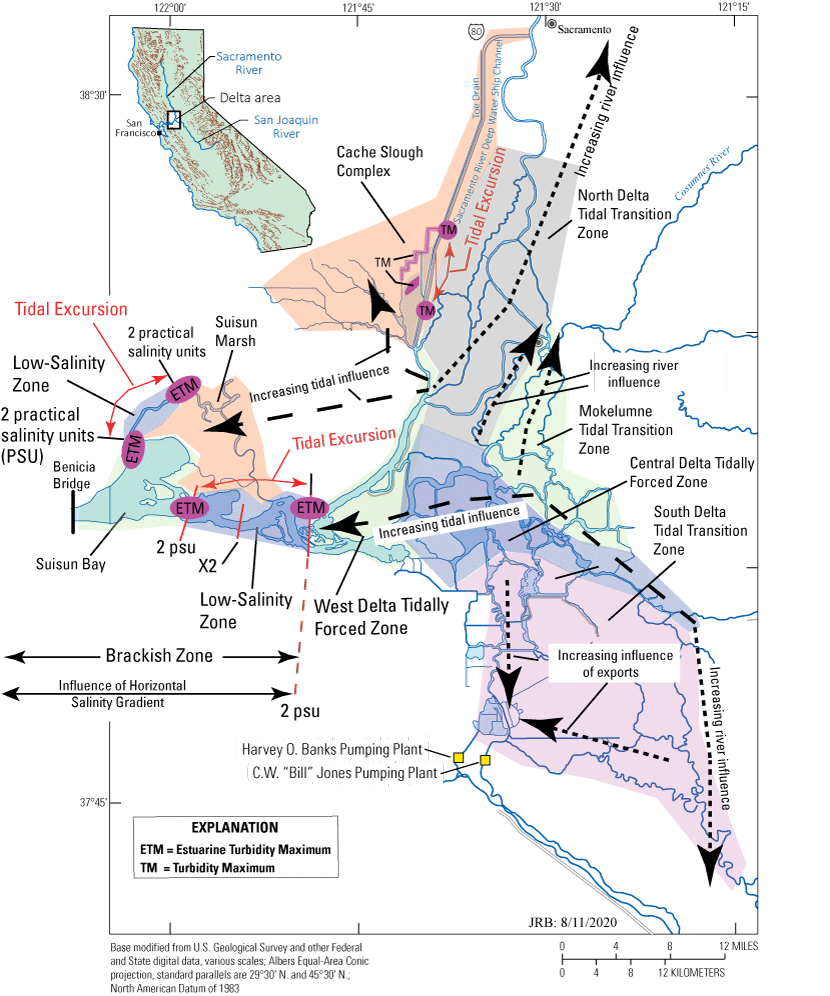
Upper San Francisco Estuary where the shaded regions represent hydrodynamically distinct zones. Dotted arrows show the effects of river flows and exports from the Harvey O. Banks (California Department of Water Resources, 2023) and C.W. “Bill” Jones (Bureau of Reclamation, 2022) Pumping Plants (yellow boxes) based on data collected from the stations shown in figure 6 that can be found at California Department of Water Resources (2022) using the naming conventions used in figure 6 or at U.S. Geological Survey (2022). Dashed arrows indicate increasing effect of the tidal currents. The estuarine turbidity maxima in Suisun Bay and Suisun Marsh are shown at the approximate locations of minimum and maximum tidal excursions computed based on velocity data collected at the locations shown in figure 6.
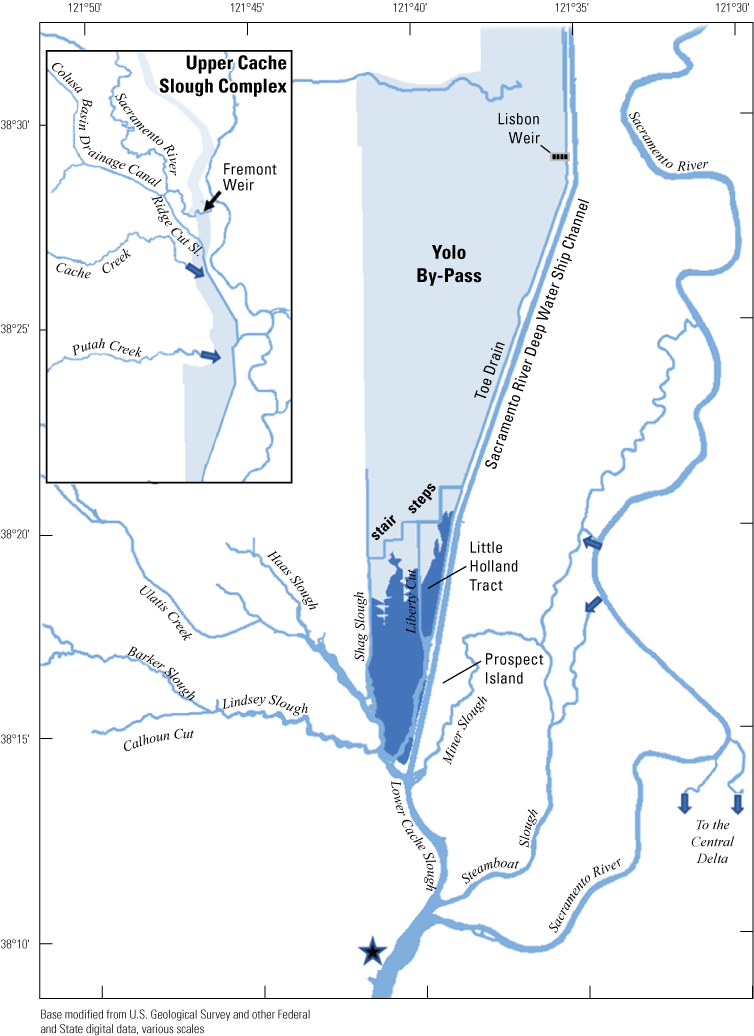
Northern Sacramento–San Joaquin Delta. The Cache Slough Complex includes Cache and Lindsey Sloughs, the Sacramento Deep Water Ship Channel, the Toe Drain, Liberty Island, Little Holland Tract, and associated connecting channels, including the stairsteps at the northern end of Liberty Island. The inset shows the upper part of the Yolo By-Pass (north of Liberty Island) and the connected channels.
The “local scale” is loosely defined as the area in which a process or set of processes produce unique environmental conditions of interest and is thus context specific. This location-specific scale refers to areas of various sizes that represent a “habitat” or area in the regional and local scales. In this study, the Liberty Island Conservation Bank (also known locally as “Wildlands”) and Little Holland Tract are the two main locations studied and are compared to each other. Both are historical tidal wetlands that were diked and drained for agricultural use. Liberty Island Conservation Bank (Orlando and Drexler, 2017) is a restored tidal wetland with dendritic channels that was constructed in 2010 as a conservation bank. The Little Holland Tract flooded in 1982, after a levee breach. These two types of habitats represent common habitat types in the San Francisco Estuary, generally referred to as “restored wetlands” and “flooded islands,” respectively.
We focused on the Cache Slough Complex for several reasons. First, it represents one of the few areas where delta smelt are still captured on a regular basis, suggesting it has habitat features that are beneficial for the species. Second, it contains a variety of sloughs, channels, and flooded islands with varying environmental characteristics that can be used to explore the physics to fish concept (Moyle and others, 2012). Third, the Cache Slough Complex represents a major element of the Arc concept, an idea that first appeared in Moyle and others (2012) and has been further developed in blog posts (Moyle and others, 2016). The motivation of the Arc concept is to link together many of the areas believed to be most capable of maintaining populations of native fishes in the Delta. The Arc concept starts at Yolo By-Pass in the northern Delta, then moves south through the Cache Slough Complex and the Sacramento River, and then into the western portion of the Delta, including Suisun Bay and Suisun Marsh (fig. 5). A considerable amount of habitat restoration is proposed in the Arc concept, with the intent of increasing the area of tidal marsh available to fishes of concern and providing a food subsidy to pelagic fishes, particularly delta smelt. Despite our focus on the Cache Slough Complex component of the Arc concept, our results likely apply throughout the upper San Francisco Estuary because they are based on processes rather than geography.
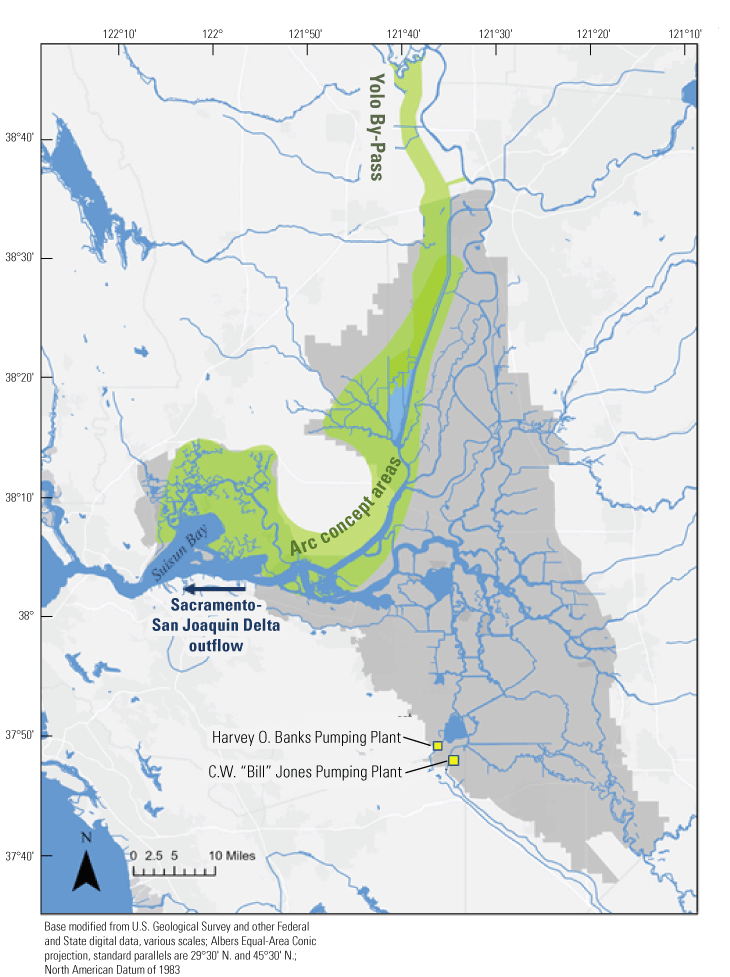
The Arc concept as depicted in Moyle and others (2016). The green shading indicates the areas included in the Arc concept that link together many of the areas from the Yolo By-Pass to Suisun Bay and Suisun Marsh believed to be most capable of maintaining population of native fishes in the Sacramento–San Joaquin Delta. The area of Suisun Marsh is defined in figure 3. The C.W. “Bill” Jones and Harvey O. Banks Pumping Plants are the locations of water exports to the south for the Central Valley Project (CVP; Bureau of Reclamation, 2022) and State Water Project (SWP; California Department of Water Resources, 2023), respectively. Delta outflow represents the net flow out of the Sacramento–San Joaquin Delta to the west and into Suisun Bay. Gray shading represents the Sacramento–San Joaquin Delta.
Monitoring
Many study elements of the physics to fish project were dependent on a network of USGS monitoring stations that provided continuous measurements of key hydrodynamic and water-quality parameters, including water velocity, stage, temperature, specific conductance, and turbidity (fig. 6; table 1). Stage and water-velocity data were used to calculate discharge following USGS guidelines (Levesque and Oberg, 2012). Water-quality data were analyzed and evaluated following rigorous quality-assurance protocols (Wagner and others, 2006). Specific study elements added temporary monitoring stations or added equipment to stations in the core monitoring network to address specific project objectives (tables 1, 2). Details of such modifications are covered in the sections presenting results from the study elements, as needed. Approved or provisional data are made available to the public in near-real time through the California Data Exchange Center (California Department of Water Resources, 2022) and the National Water Information System (NWIS; U.S. Geological Survey, 2022). Flux calculations were made according to calculations described in Fischer and others (1979).
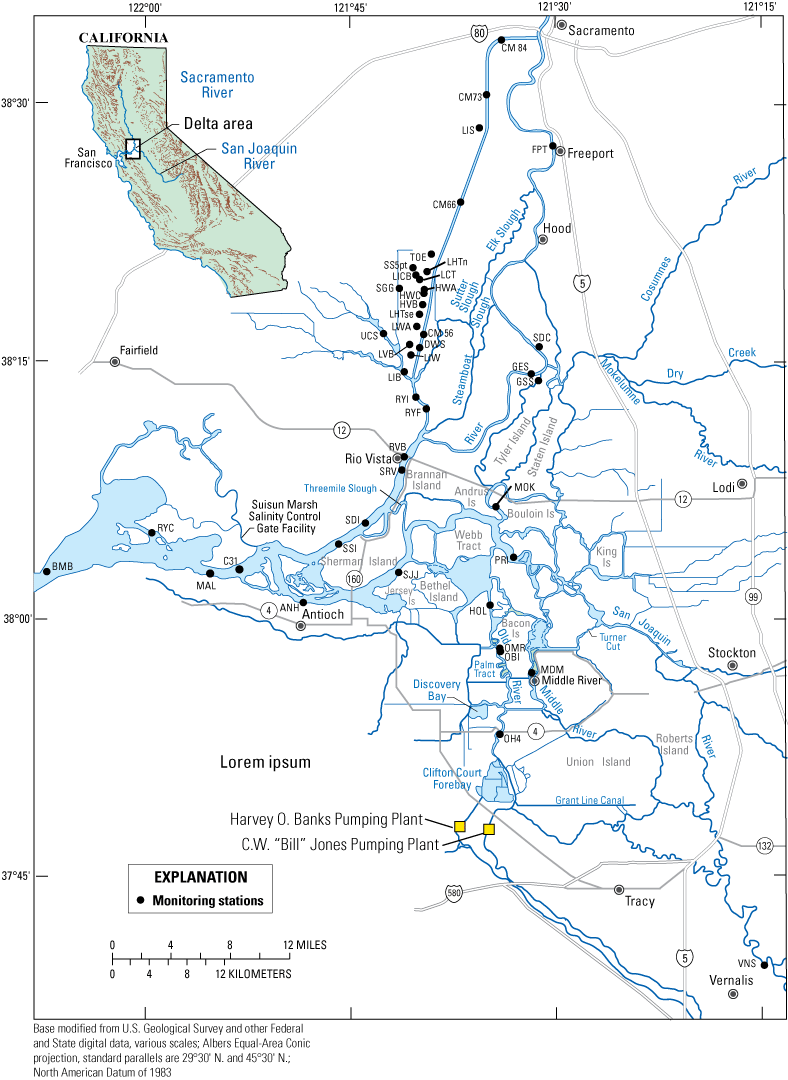
Flow and water-quality station network for the Sacramento–San Joaquin Delta. See table 1 for more detail on each station. See table 2 for a description of the parameters measured and instruments used.
Table 1.
Summary of 2015–19 data collection efforts at monitoring stations in the Sacramento–San Joaquin Delta, California (California Department of Water Resources, 2022; U.S. Geological Survey, 2022).[NAD 83, North American Datum of 1983; XX°XX'XX" or XXX°XX'XX", latitude or longitude coordinates in degrees/minutes/seconds; —, not applicable; USGS, data were collected and processed by the U.S. Geological Survey; DWR, data were collected and processed by the California Department of Water Resources; CM, channel marker]
Core water quality may include continuous water temperature, specific conductance or conductivity, and turbidity.
Expanded water quality may include continuous or discrete pH, dissolved oxygen, chlorophyll fluorescence, particulate organic matter, and stable isotopes of carbon and nitrogen.
Nutrients may include discrete chlorophyll, chlorophyll-a, nitrogen, phosphorus, ammonium, and nitrate.
Sediment may include continuous or discrete suspended sediment concentration and particle-size distributions of surficial bed-sediment samples.
Biology may include discrete fish, shrimp, zooplankton, phytoplankton, dominant aquatic vegetation (emergent or submerged), and nekton.
The station was established by the U.S. Geological Survey Pacific Coastal and Marine Science Center (PCMSC). Information regarding the station can be found in Lacy and others (2016).
Information regarding the station can be found in Larwood and others (2020).
Table 2.
Summary of parameters and instrumentation at fixed-monitoring stations.[ADCP, Acoustic Doppler Current Profiler; WWTP, wastewater treatment plants; mg/L, milligram per liter; %, percentage]
Hydrodynamics
This section provides a detailed synthesis of salient hydrodynamic processes that occur in the San Francisco Estuary and when and where they are important, with examples. The synthesis is based largely on published literature and by recent observations made during the study period of the physics to fish project (development of the Lagrangian to Eularian ratio, or LE ratio). This information provides the foundation from which concepts and knowledge are developed in the subsequent sections.
The large-scale hydrodynamics of the San Francisco Estuary have been a topic of interest for decades, resulting in many reports and scientific articles (Conomos, 1979; Hollibaugh, 1996). The large-scale hydrodynamics of the San Francisco Estuary have been examined through data analysis (Peterson and others, 1975; Walters and others, 1985; Smith and Cheng, 1987; Cheng and others, 1993) and have been successfully modeled by several independent groups (see MacWilliams and others [2016] for a review). Hydrodynamic models have been used to address questions regarding the effects of human flow management (water diversions) and natural annual and seasonal patterns of change in flow patterns and the salinity gradient from fresh water to salt water (Kimmerer and others, 2009, 2013).
Hydrodynamics, the physics of water (hydro) motion (dynamics), affects the transport of pelagic organisms and constituents dissolved or suspended in the water column. These transported constituents can be classified as conservative or nonconservative. Conservative means the constituent does not change chemically, physically, or biologically during transport (salt). Non-conservative means the constituent undergoes a physical, chemical, or biological transformation during transport (incorporation of dissolved nutrients into phytoplankton). Transport processes (addressed near the end of this section) between different masses of water govern the movement and mixing of all constituents and affect all pelagic organisms in this and other estuaries.
Pelagic organisms can either move with these hydrodynamic and transport processes or, if they have sufficient swimming ability and appropriate behavior, may utilize them to maintain position or move where they like. Many organisms have behaviors that allow them to use tidal currents to their benefit (Forward and Tankersley, 2001). For example, zooplankton can utilize vertical migration to maintain their position in the estuary (Kimmerer and others, 1998, 2002, 2014). Fishes, including small larvae, also utilize behaviors to control their position in tidal environments (Bennett and others, 2002; Gibson, 2003; Bennett and Burau, 2015). Juvenile salmon can accelerate their migration where reversing tidal flows exist by moving into high-velocity regions during ebb tides (center channel) and into low-velocity (near bank) regions during floods (McCleave, 1978; Moser and others, 1991; Moore and others, 1995).
The general drivers of transport in an estuary (fig. 7) involve the interaction of the landscape (morphology of the estuary) with several interacting hydrodynamic forcing mechanisms: rivers, including effects of exports (freshwater inflow and outflow), tidal currents, and in the brackish part of the estuary, the horizontal salinity gradient (fig. 7). The important aspects of the landscape include the bathymetry (configuration of the bottom) and planform (shape of riverbanks and shores and bottom contours) in the estuary, resulting in four basic transport mechanisms (fig. 7).
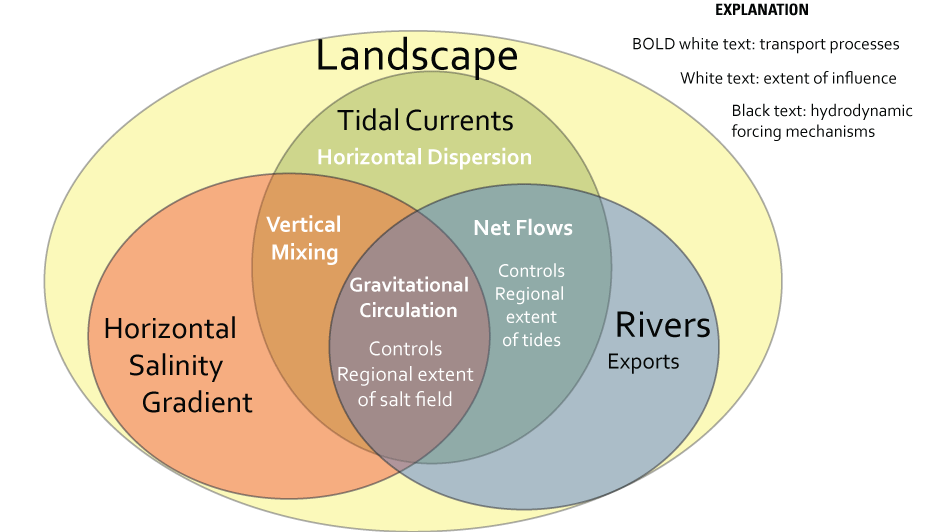
Transport mechanisms in an estuary. The three hydrodynamic forcing mechanisms (tidal currents, horizontal salinity gradient, and rivers and exports), landscape features, and the interactions among them create four fundamental transport processes (horizontal dispersion, net flows, gravitational circulation, and vertical mixing) which in turn govern the spatial (or regional) extent of the tides and the salt field at any given time.
In natural estuaries, the interactions of these hydrodynamic processes with geological, geomorphic, biogeochemical, and biological processes result in a variety of habitat types, including open-water bays, tidal wetlands, riparian habitats, and channel systems. Channel systems can include large channels, dendritic (tree-like) channel networks, and dead-end sloughs. In the San Francisco Estuary, these historical habitats have been mapped and described based on historical records (Whipple and others, 2012; Robinson and others, 2014). Change in land and water use and associated infrastructure, such as levee construction, alteration of channel networks, and dredging, have led to changes in hydrodynamic and other processes, resulting in changes to aquatic habitats (Robinson and others, 2014).
The Delta’s contemporary configuration (fig. 2) was established through levee construction on the larger historical channels to protect tracts of marshland reclaimed for agriculture (Whipple and others, 2012). This process converted the original network of dendritic tidal marsh systems into an interconnected web of conveyance canals. The Delta is now a network of deep, narrow, and steep-sided canals that were engineered for flood control and navigation. These canals were specifically engineered to be narrow to maintain high velocities to reduce sediment deposition and maintain channel capacity for flood control/conveyance and depths suitable for navigation. The narrow design reduces within-channel geomorphic variability and requires high levees in tidal transition zones (fig. 3) to contain flood flows (discharge, water volume per unit time). Finally, the principal land-water interface—the edge or littoral habitat—in the Delta is a steeply sloped bank covered in 15–20 centimeter (cm)-diameter crushed rock (riprap). This habitat provides little geomorphic variability and minimal velocity refugia and is quite turbulent. In fact, data from two-dimensional (2D) acoustic telemetry studies show that juvenile salmon generally avoid the near bank region in the Delta (Reeves and others, 2012, 2015, 2016).
Landscape Scale
At the landscape scale, the San Francisco Estuary is nearly always a tidally dominated system (fig. 8) in and seaward of the tidal zones, except during extremely large flows (fig. 3), and in the tidal transition zones under low-flow conditions. The tides exert the most physical forcing in the Delta by several orders of magnitude, overwhelming the effects of the rivers and exports throughout most of the Delta, except during high winter-spring flood flows. The tides that enter the San Francisco Estuary through the Golden Gate (fig. 2) are mixed tides (two unequal high tides and two unequal low tides per day) exchanging up to roughly 4 million cubic feet per second (ft3/s; about 92 acre-feet per second [acre-ft/s]; Downing-Kunz and others, 2021), twice per day, every day. The peak tidal discharge amounts to the exchange of 2 million acre-feet (acre-ft) of water exchanged through the Golden Gate during a single tide (approximately 6 hours).
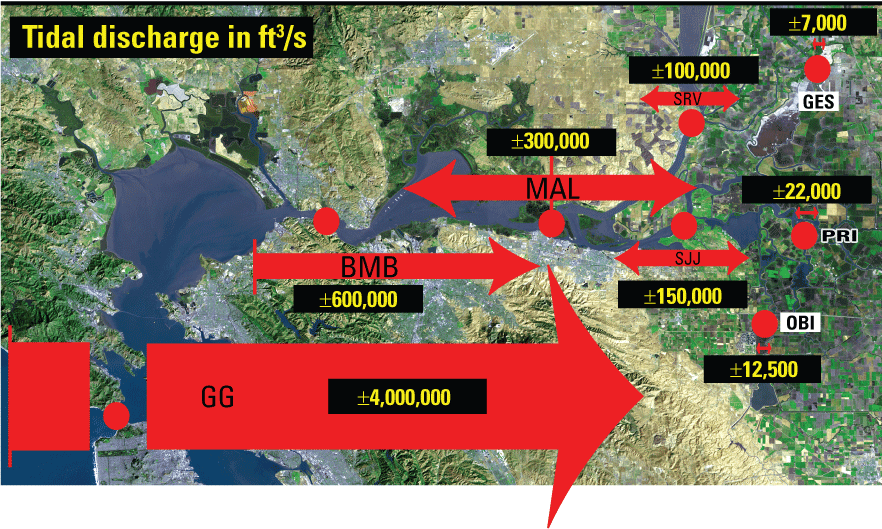
Distribution of tidal discharge in cubic feet per second (ft3/s) in the San Francisco Estuary, California, during low river inflow periods. Streamgages include Carquinez Strait at the Benicia Bridge (BMB; Ganju and Schoellhamer, 2006); Sacramento River below Georgiana Slough (GES; California Department of Water Resources, 2022; U.S. Geological Survey station 11447905); Golden Gate Bridge (GG; Downing-Kunz and others, 2021); Suisun Bay at Mallard Island (MAL; U.S. Geological Survey station 11185185); Old River at Bacon Island (OBI; California Department of Water Resources, 2022; U.S. Geological Survey station 11313405); San Joaquin River a Prisoners Point near Terminous (PRI; California Department of Water Resources, 2022; U.S. Geological Survey station 11313460); San Joaquin River at Jersey Point (SJJ; California Department of Water Resources, 2022; U.S. Geological Survey station 11337190); Sacramento River at Rio Vista (SRV; U.S. Geological Survey station 1145520). All data for U.S. Geological Survey stations are published in U.S. Geological Survey (2022).
After transiting the Golden Gate, the tides move through the northern San Francisco Estuary entering Suisun Bay at the eastern end of Carquinez Strait at the Benicia Bridge (USGS station 11455780, U.S. Geological Survey, 2022; station BMB, table 1, fig. 8), the location of a narrow cross section and large sill. Peak tidal flows at this location are ±600,000 ft3/s. The tidal flow at Chipps Island is ±300,000 ft3/s (MAL; table 1; USGS station 11185185; U.S. Geological Survey, 2022), about 10 percent of the discharge entering the San Francisco Estuary through the Golden Gate (GG; fig. 8; Downing-Kunz and others, 2021). As a point of reference, the tidal flow at Chipps Island is roughly three times the flood-carrying capacity of the Sacramento River channel next to the City of Sacramento (110,000 ft3/s; Russo, 2010).
Because there are two flood tides and two ebb tides each day, the total exchange into and out of the Golden Gate in a single day is approximately 4 million acre-ft (assuming a tide based on a single semi-diurnal lunar tidal constituent, M2, that has a period of 12.42 hours), or roughly equal to the storage of Shasta Lake (not shown), California’s largest reservoir (4,552,000 acre-ft; Water Education Foundation, 2022). The daily inequality associated with the mixed nature of the tides in the San Francisco Estuary is particularly important in controlling temporal variability in vertical mixing in the brackish parts of the estuary. The weak flood-ebb cycle that happens during neap tides decreases vertical mixing, which allows increased gravitational circulation and creates vertical salinity stratification.
Tides move through the San Francisco Estuary as shallow-water waves (Kinmark, 1986). Given that the channels in Suisun Bay and in the Delta are roughly 33 feet (ft) deep, the tides propagate at approximately 33 feet per second (ft/s) throughout most of the system, but greatly slow in the shallow embayments in San Pablo and Suisun Bays (fig. 2) and in several of the shallow flooded islands. The wave speed in a 3-ft water column is approximately 10 ft/s, a third of what it is in the typical Delta channel. The wave speed, relative to the channel length is important in the creation of standing wave behavior (for example, the so-called ¼ wave resonator; Dyer, 1998), which can produce a flood tidal current bias in dead-end channels that can create freshwater turbidity maxima (Feyrer and others, 2017), discussed in subsequent sections of this report.
The tides generally dissipate as they propagate through the San Francisco Estuary because of bottom friction. The tides interact with the shape of the estuary and with river inflows in the tidal transition zones (fig. 3), and the tide wave changes in character from a progressive wave into a standing wave (fig. 9) as it propagates into the dead-end landscape features in the Cache Slough Complex and Suisun Marsh (Aubrey and Speer, 1985; Parker, 1991). This fundamental transformation of the tide wave is important for sediment transport and ecology in all dead-end systems in the San Francisco Estuary.
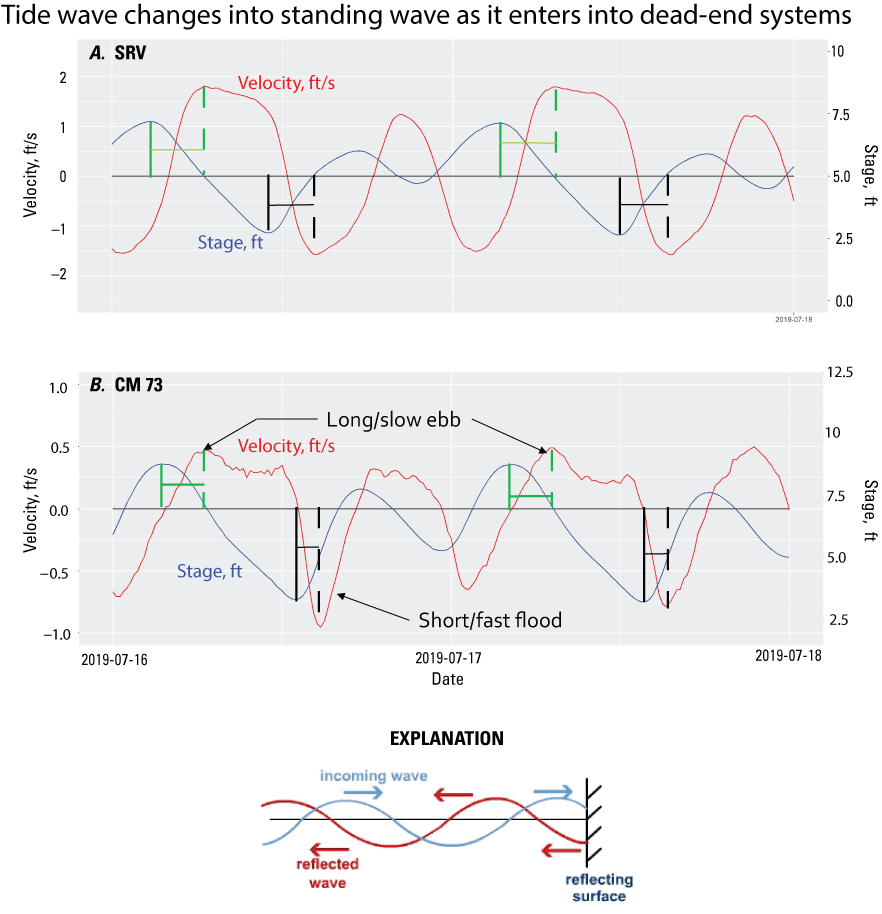
Time-series plots of velocity (red, in feet per second [ft/s]) and stage (blue, in feet [ft]) in the A, Sacramento River at Rio Vista (SRV; California Department of Water Resources, 2022; U.S. Geological Survey station 11455420; U.S. Geological Survey, 2022) and in the B, Sacramento River Deep Water Ship Channel near Freeport (channel marker [CM] 73; U.S. Geological Survey station 383019121350701; U.S. Geological Survey, 2022). Flood tides are negative and ebb tides are positive. The tides at Sacramento River at Rio Vista are mostly progressive in character, where the tides and currents are roughly out of phase—the peak in the ebb velocity is roughly out of phase with sea-level variations as is indicated by the green vertical lines for ebb tides and the black vertical lines for flood tides. In the Sacramento River Deep Water Ship Channel near Freeport, the relation between sea-level variations and the currents are closer to being in phase where the peaks line up. The consequence is that the flood tidal currents are short in duration and are roughly twice the magnitudes of the long-duration ebbs.
This shift in character happens when tide waves resonate in dead-end channels and other dead-end features like Liberty Island. As shown in this project, the interaction between an incoming tide wave with a reflected wave “off the back” of a dead-end channel (fig. 9) or flooded islands such as Liberty Island results in a standing wave. The change from a progressive to a standing wave is accompanied by a change from ebb to flood-dominant tidal currents in the San Francisco Estuary with generally greater depths during ebb tides and shallower depths during flood tides. For the ebb and flood tides to conserve water mass throughout a tidal day (the time required for the two high tides and two low tides in a tidal cycle) in a dead-end channel, the flood-tide velocities must be fast/short (because the water is shallow) relative to slow/long ebb-tide velocities (because the water is deeper). In terms of the tidal prism, the flood and ebb tidal prisms must sum to zero (no net flow) during a tidal day in a dead-end channel, because the net (or tidal average) flow is zero.
Landscape features that figure prominently in controlling transport processes in the Delta include (in order of relative systemwide importance): (1) the sill at the Benicia Bridge (figs. 3, 10); (2) the lower Cache Slough/Sacramento River reach whose channel capacity was greatly increased through 20 years of dredging to accommodate the flood flows from Yolo By-Pass (Kelley, 1989); (3) the Delta Cross Channel; (4) the Suisun Marsh Salinity Control Gate Facility (fig. 6); (5) several large flooded islands [Franks Tract State Recreation Area (hereafter referred to using the locally accepted name “Franks Tract;” fig. 2), Liberty Island (fig. 4), Big Break (fig. 2), Mildred Island]; and (6) the Sacramento River Deep Water Ship Channel.
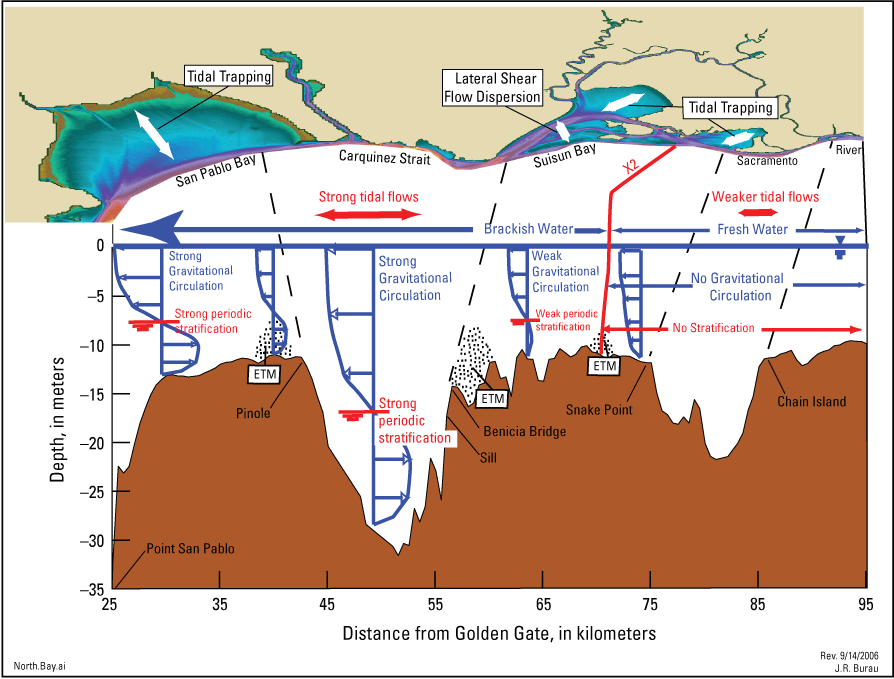
Conceptual model of distinct hydrodynamic regions in the northern San Francisco Estuary, California, based on the hydrodynamic similarity in each region. In general, tidal influence increases with proximity to the Golden Gate and river and export flows increase in the upland parts of the Sacramento–San Joaquin Delta. The internal boundaries between regions coincides with abrupt changes in landscape features or at the transition between brackish and fresh water, the so-called “low-salinity zone.” The estuarine turbidity maximum (ETM) is created by the landward limit of gravitational circulation that takes place at roughly the 2-practical salinity unit (PSU) near-bed isohaline (X2; Jassby and others, 1995), and the ETM moves back and forth with the tides (the tidal excursion), defining the boundaries of the low-salinity zone in Suisun Bay and in Montezuma Slough. A turbidity maximum (TM) is created by flood-dominated tidal currents; TMs exist in freshwater, dead-end systems in the Delta, in the Sacramento River Deep Water Ship Channel, near Liberty Island, and near the stairsteps. We differentiate between ETMs and TMs because they have different causal mechanisms and associated ecology.
The tidal prism is defined as the total volume of water that passes a given cross section during a single flood (or ebb tide; Dyer, 1998). The sill at Benicia Bridge acts as a hydraulic control (Armi and Farmer, 1986; Valle-Levinson and Wilson, 1994) on the tidal prism—the total volume of water that can exchange between the upper estuary and San Francisco Bay with the tides—much the same way a weir in a river controls the amount of water that passes it for a given stage. Thus, the tidal prism in the Delta is partially constrained by the sill at the Benicia Bridge (fig. 10). This observation indicates that any increase in acreage of tidal marsh associated with restoration efforts, or the accidental flooding of an island, will cause a redistribution of the total fixed tidal prism throughout the system but will not appreciably increase tidal exchange between San Francisco Bay and the upper estuary.
The tide wave moves through the upper San Francisco Estuary by taking the path of least resistance—preferentially exchanging water through wider/deeper channels, or potentially into flooded islands or restoration sites, rather than narrow/shallow channels. For example, as shown in figure 11, more than 90 percent of the tidal prism that propagates past Rio Vista in the Sacramento River moves into the Cache Slough Complex through lower Cache Slough rather than propagating into the narrower channels (Sacramento River, Steamboat and Miner Sloughs) that make up the North Delta Tidal Transition Zone. In this case, the tidal prism is estimated by calculating the difference in tidal discharge values at the ebbs (circles in fig. 11) at each location.
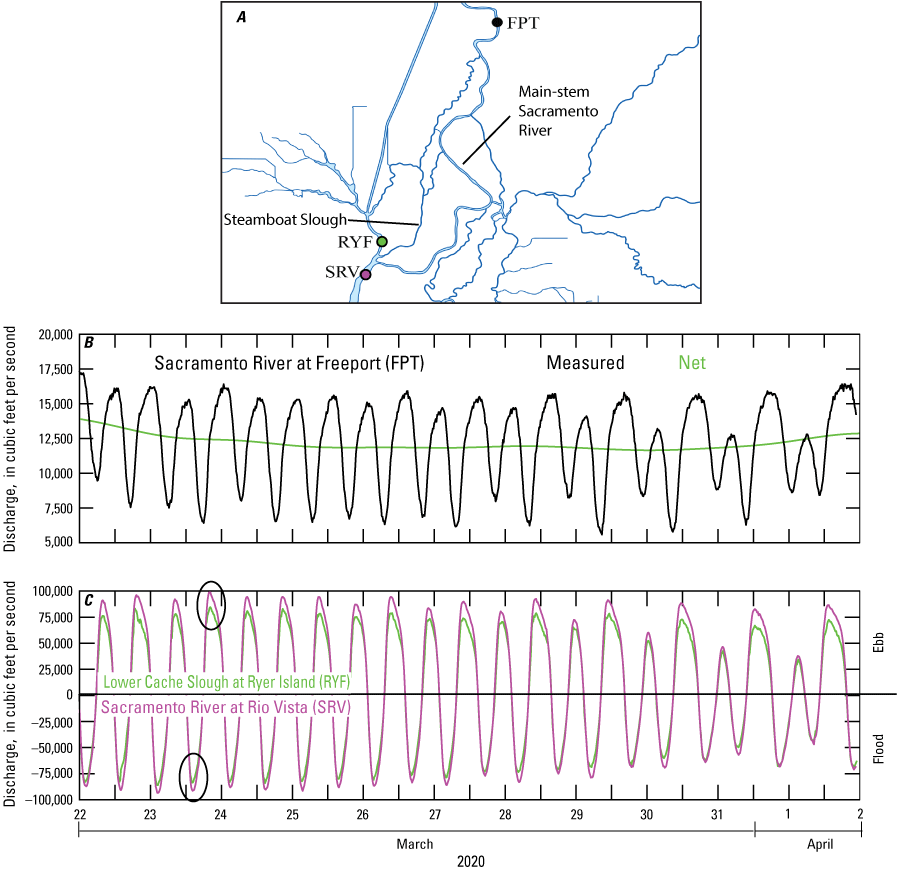
A, North Sacramento–San Joaquin Delta, showing the locations of the stations where discharge time series were measured; B, discharge at Sacramento River at Freeport (FPT; California Department of Water Resources, 2022; U.S. Geological Survey station 11447650; U.S. Geological Survey, 2022), where black lines are the as-measured data and green lines are the tidally averaged or net discharge; and C, discharge at the Sacramento River at Rio Vista (purple line; SRV; California Department of Water Resources, 2022; U.S. Geological Survey station 11455420; U.S. Geological Survey, 2022) and in Cache Slough above Ryer Island Ferry near Rio Vista (green line; RYF; California Department of Water Resources, 2022; U.S. Geological Survey station 11455385; U.S. Geological Survey, 2022). Discharge is negative during flood tides and positive during ebb tides. The difference in tidal discharge between the purple and green curves is small and represents the tidal discharge that flows into the main-stem Sacramento River and Steamboat Slough. Thus, 90 percent of the tidal discharge that passes Rio Vista exchanges with the Cache Slough Complex, leaving approximately 10 percent of the tidal prism exchanging into the north Delta. The Cache Slough Complex includes Cache and Lindsey Sloughs, the Sacramento Deep Water Ship Channel, the Toe Drain, Liberty Island, Little Holland Tract, and associated connecting channels, including the stairsteps at the northern end of Liberty Island. Sacramento River tidally averaged or net discharge of approximately 12,500 cubic feet per second (ft3/s) shown in B is a typical mid-summer rate.
Hydrodynamics Management Implications at the Landscape Scale
Although not a direct outcome of our studies, the role of the sill at Benicia Bridge in limiting the tidal prism has substantial management implications. Flow and habitat management upstream from the sill can only redirect a relatively fixed amount of tidal prism in the system, not increase or decrease it. Furthermore, increasing tidal flows in downstream areas can affect the tidal stages and flows in upstream areas, which can affect tidal marsh restoration outcomes. For example, major efforts to open areas of Suisun Marsh to increased tidal action will decrease tidal prism in the Cache Slough Complex because the proximity of Suisun Marsh to the sill at the Benicia Bridge provides an easier path for tidal wave propagation than traveling the additional 23 miles (mi) to the Cache Slough Complex. The partitioning of the tidal prism among the various restoration efforts, and the changes that these restoration efforts will have on the balance of the Delta, need to be assessed with hydrodynamic models during restoration planning.
Regional Scale
The upper San Francisco Estuary can be divided into distinct hydrodynamic regions (fig. 3) based on similarity of transport processes in each region. Broadly speaking, there are three Tidal Transition Zones (North Delta, Mokelumne, South Delta), two strongly Tidally Forced Zones (West Delta and Central Delta), two dead-end channel systems (Cache Slough Complex and Suisun Marsh), and Suisun Bay. Within these zones, there are two zones that maintain distinct salinity gradients (the brackish and low-salinity zones). Suisun Marsh and Suisun Bay are in the brackish zone during the summer and fall when flows are low. Both regions also maintain low-salinity zones (defined as salinity of 0.5–6.0 practical salinity units [PSU]; Kimmerer and others, 1998) and associated estuarine turbidity maximums (ETMs; discussed later) that move back and forth with the tidal currents twice per day (move a distance known as the tidal excursion as indicated on fig. 3).
The tidal transition zones represent regions where unidirectional river flows meet tidal flows and where the tides can be greatly affected by seasonal variations in river flows, particularly high winter flows associated with winter storms, and high export rates during summer and fall low flows. Outmigrating juvenile salmon can have lower survival rates in tidal transition zones at lower flows but can have much higher survival rates during high river flows, consistent with the higher survival rates in the lower Sacramento River (Perry and others, 2018). These tidal transition zones are bordered by rivers, floodplains, or pumps at their landward margins and by landscape discontinuities at their seaward boundaries in the form of large channel-capacity, and, consequently, tidal discharge differences at channel junctions that form the border between the tidal transition zones and the tidally forced zones. The Cache Slough Complex can function as a tidal transition zone when Sacramento River flow is diverted into the Yolo By-Pass for flood-control purposes. The Yolo By-Pass is a flood bypass west of the Sacramento River that enters the Delta at the northern end of the Cache Slough Complex; however, the Yolo By-Pass does not flood every year, and in years when it does flood, the duration and magnitude of flow can vary greatly from very little flow to 600,000 ft3/s, and the duration of flooding can vary from a few days to months (Sommer and others, 2001).
The tidal currents are much greater seaward of the tidal transition zones than in the tidal transition zones (fig. 11) and are minimally affected by increases in the river flows and exports, given the channels in the tidally forced zones have much larger cross sections than in the tidal transition zones (Fregoso and others, 2017). The exception is the lower Sacramento River during conditions when the Yolo By-Pass is strongly flooding (>80,000 ft3/s, the approximate tidal discharge in lower Cache Slough; USGS station 11455385, U.S. Geological Survey, 2022; station RYF in table 1).
Franks Tract, a large, flooded island, dominates transport processes in the Central Delta Tidal Zone and is weakly, but importantly from a water supply perspective, influenced by river flows from the San Joaquin and Mokelumne Rivers. The hydrodynamics and flow paths through this region are complex and can include a part of the water exported from the Delta by the C.W. "Bill" Jones (CVP; Bureau of Reclamation, 2022) and Harvey O. Banks (SWP; California Department of Water Resources, 2023) Pumping Plants (fig. 1). The West Delta Tidally Forced Zone includes the lower Sacramento River and the confluence of the Sacramento and San Joaquin Rivers (figs. 3, 6) and interfaces with the Central Delta Tidally Forced Zone through Threemile Slough (fig. 6).
The two dead-end channel systems are the Cache Slough Complex and Suisun Marsh. As part of the Arc concept (Moyle and others, 2016), these two systems are connected by the West Delta Tidally Forced Zone (fig. 12). As discussed earlier, during flood flows through Yolo By-Pass, the Cache Slough Complex can function as a tidal transition zone, but during normal circumstances, when not carrying flood flows, the Cache Slough Complex functions as a system of dead-end channels, including the Sacramento River Deep Water Ship Channel. The hydrodynamics in this region are discussed in more detail later in the text.
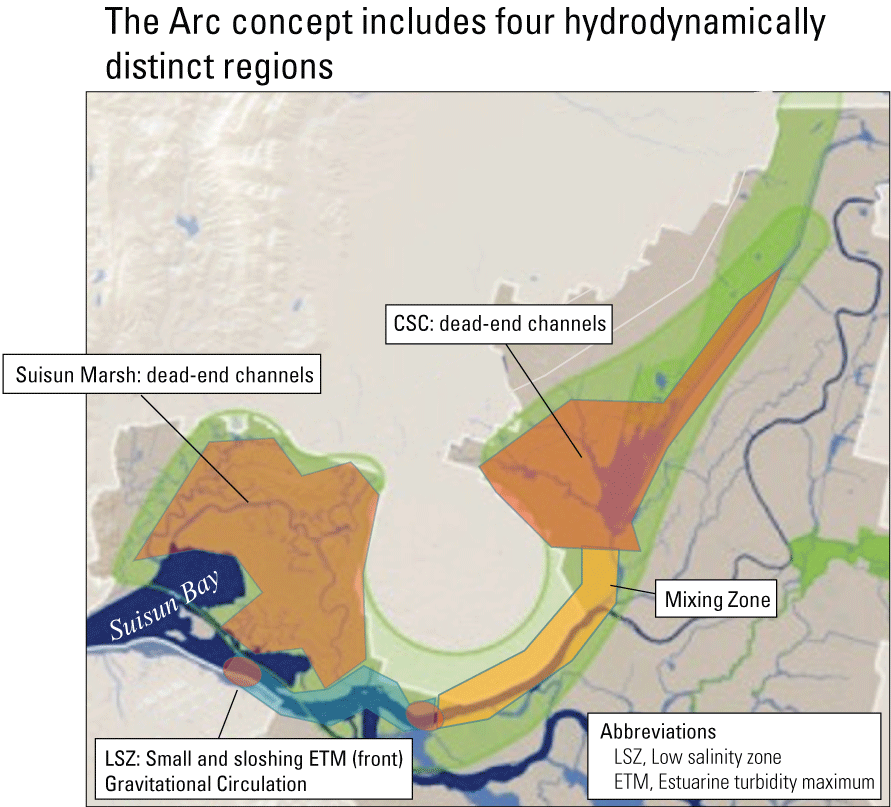
Spatial distribution of hydrodynamically distinct regions within the Arc concept (Moyle and others, 2016), Sacramento–San Joaquin Delta, California. The Cache Slough Complex (CSC) includes Cache and Lindsey Sloughs, the Sacramento Deep Water Ship Channel, the Toe Drain, Liberty Island, Little Holland Tract, and associated connecting channels, including the stairsteps at the northern end of Liberty Island. Suisun Marsh is a complex of tidal and managed wetlands near Ryer Island, and the area is delineated in figure 3.
Suisun Marsh also largely represents a system of dead-end channels but with some important caveats. Montezuma Slough is a relatively deep, wide slough that is used together with the Suisun Marsh Salinity Control Gate Facility to control salinity in Suisun Marsh (fig. 1). The Suisun Marsh Salinity Control Gate Facility operates in synchrony with the tides—opening on ebb tides to let fresh water into the marsh and closing on flood tides to prevent salinity intrusion from Suisun Bay. This process can create a net seaward discharge of approximately 3,000–4,000 ft3/s. Dead-end slough systems then branch off from Montezuma Slough. Also, a large part of the marsh lands in Suisun Marsh are fully or partially isolated from tidal action by levees and gates because they are managed for waterfowl production.
The hydrodynamic region farthest to the west is the brackish zone, which is seaward of the 2-PSU near-bottom isohaline (location where the near-bottom salinity is 2-PSU). The 2-PSU isohaline defines the landward boundary of the brackish and low salinity zones. The 2-PSU isohaline creates a distinct physical and habitat boundary that moves long distances with the tides twice per day (fig. 3). The tidally averaged distance of the 2-PSU bottom isohaline from the Golden Gate is known as X2 (fig. 2; Jassby and others, 1995); however, in a tidal cycle, the actual location of the 2-PSU isohaline moves roughly 13 kilometers (km; 6.5 km on either side of X2) on a typical spring tide (the highest high tides taking place approximately twice per month). Thus, the 2-PSU isohaline moves a large fraction of the length of Suisun Bay’s ship channel (about 20 km, or 12 mi) twice per day every day. This boundary also moves in response to changes in Delta outflow (Schubel and others, 1993; Jassby and others, 1995) and changes in atmospheric pressure and wind. During low-flow conditions, the brackish zone also includes Honker and Grizzly Bays (fig. 2).
The hydrodynamics of the brackish zone are complex because of the horizontal salinity gradient, which creates the two layer-flow exchange known as gravitational circulation (fig. 10; Conomos, 1979; Monismith and others, 1996). Gravitational circulation happens seaward of the 2-PSU isohaline and is caused by intrusion of higher-density, salty water underneath lower density fresh water, mediated by vertical mixing and depth (fig. 10). A near-bottom convergence takes place just seaward of the 2-PSU isohaline where the near-bed currents flow landward and are met at this location with currents that flow seaward (the ETM at X2 shown in fig. 10). Both near-bed flows carry suspended sediment, detrital matter, and organisms that are negatively buoyant (they sink) concentrated by this flow convergence, thus creating an estuarine turbidity maximum (ETM). An ETM is a longitudinal maximum of suspended-sediment concentration (SSC) or other constituents and organisms that forms at the landward limit of the two-layer flow driven by the horizontal salinity gradient. The ETMs in the upper San Francisco Estuary are primarily created by the seaward limit of gravitational circulation in Suisun Bay and in western Suisun Marsh (fig. 10) and changes in gravitational circulation strength because of bathymetric changes (Jay and Musiak, 1994; Schoellhamer, 2001; fig. 10). In the San Francisco Estuary, spatially fixed ETMs associated with shoals gather at Pinole Shoal and at the sill at the Benicia Bridge (figs. 3, 10). The ETMs associated with sills happen because gravitational circulation strength is depth dependent—the deeper the channel, the greater the possibility of gravitational circulation for a given horizontal salinity gradient. The two-layer flow associated with gravitational circulation is stronger seaward of the sill and weaker over the sill, and this leads to an increase in SSC in the San Francisco Estuary at the sills (fig. 10). The ETMs associated with the low-salinity zone that move with the tides, as in the upper San Francisco Estuary (fig. 3), are known to be some of the most productive regions in estuaries (Crump and Baross, 1996; Morgan and others, 1997).
Hydrodynamics Management Implications at the Regional Scale
Management actions with regional-level effects on hydrodynamics are already underway. These include (1) opening and closing the Delta Cross Channel to prevent outmigrating Chinook salmon (Oncorhynchus tshawytscha) from moving from the Sacramento River to the central Delta (U.S. Fish and Wildlife Service, 2008, 2019); (2) North Delta Food Web Action adaptive management projects to supplement the Delta with phytoplankton and zooplankton originating in Yolo By-Pass (California Natural Resources Agency, 2016); (3) Suisun Marsh Salinity Control Gate Facility management to freshen Suisun Marsh during the summer and provide habitat for delta smelt (California Natural Resources Agency, 2016); and (4) the installation of a salinity barrier in the Central Delta Tidally Forced Zone (fig. 3) in 2015 during the most recent drought to prevent intrusion of salt water (Kimmerer and others, 2019). Hydrodynamic models can be used to model the hydrodynamic effects of such actions; however, field observations are essential for model calibration and validation, and companion studies are needed to understand the effects of the altered landscapes on the hydrodynamics and other physical and ecological processes of interest. For example, in 2015, the installation of a barrier to reduce salinity intrusion during the recent drought stimulated a number of studies focused on understanding the effects of this specific management action on various aspects of the ecosystem (Kimmerer and others, 2019). Understanding how tidal wetland restoration affects regional and local hydrodynamics across the Delta has been identified as an issue of concern because of the potential for unexpected cumulative effects (Herbold and others, 2014). As described earlier, such changes might also have implications for migration and rearing of juvenile salmonids throughout the Delta.
Local Scale
Hydrodynamics are generally viewed in either of two frames of reference, Eulerian or Lagrangian (Batchelor, 1973). The Eulerian frame of reference is fixed in space, such as at a fixed geographic location. The Lagrangian frame of reference moves with the flow of water like a packet of water moving downstream in a river. Thus, a person standing on a riverbank, watching the water flow past them, has a Eulerian frame of reference, and a person in a raft that is moving with the current has a Lagrangian frame of reference. In the context of Delta ecology, benthic organisms experience an Eulerian environment, whereas pelagic organisms experience a Lagrangian environment. In a tidal channel, the ratio of the Eularian measurement of the channel to the Lagrangian distance has important implications for several important hydrodynamic properties. The Eularian measurement of the channel is its physical length, while the Lagrangian distance is the distance a neutrally buoyant particle would move between slack waters (the change in tidal direction between flood and ebb tide) on either a flood or ebb tide.
A simple metric, the Lagrangian to Eularian ratio (LE ratio, calculated as the tidal excursion length divided by the channel length), was developed as part of this project (Stumpner and others, 2021; fig. 13) to help us understand and illustrate how tidal exchange happens in channel networks. Though simple, this idea summarizes what is seen in various types of channel networks observed in the Delta (fig. 13). In channels connecting two other channels where LE ratio>1 (fig. 13A), the tidal excursion is longer than the connecting channel length, and water residence time tends to be short. Conversely, in connecting channels where LE ratio<1 (fig. 13B), the tidal excursions at the channel mouths are much less than the channel length, and some part of the channel maintains longer residence times (for example, Montezuma Slough). The second case (LE ratio<1; fig. 13B) allows for establishment of chemical and biological gradients. Long residence times in connecting channels and at the ends of dead-end channels where LE ratio<<1 (fig. 13C) may allow growth and retention of phytoplankton, allow nutrients to be transformed, or allow for depletion of nutrients by phytoplankton growth. If these long residence time areas receive inputs from smaller tributary channels, those inputs can be retained in the channel because of minimal mixing in this no-exchange zone (fig. 14). In contrast, at the mouth of a connecting or dead-end channel, the high-exchange zone has a short residence time because it happens in a tidal excursion of the mouth. The zone between the no-exchange zone with a long residence time (such as in connecting channels and the back-ends of dead-end channels) and the high-exchange zones (such as in a tidal excursion of the channel mouths) is where the water between the two zones mix (fig. 14), driven by the within-channel dispersive mixing (discussed later). In this report, areas of low to moderate exchange (fig. 14) represents the areas of transition between areas with water that can have greatly different characteristics and where gradients in chemical and physical properties take place.
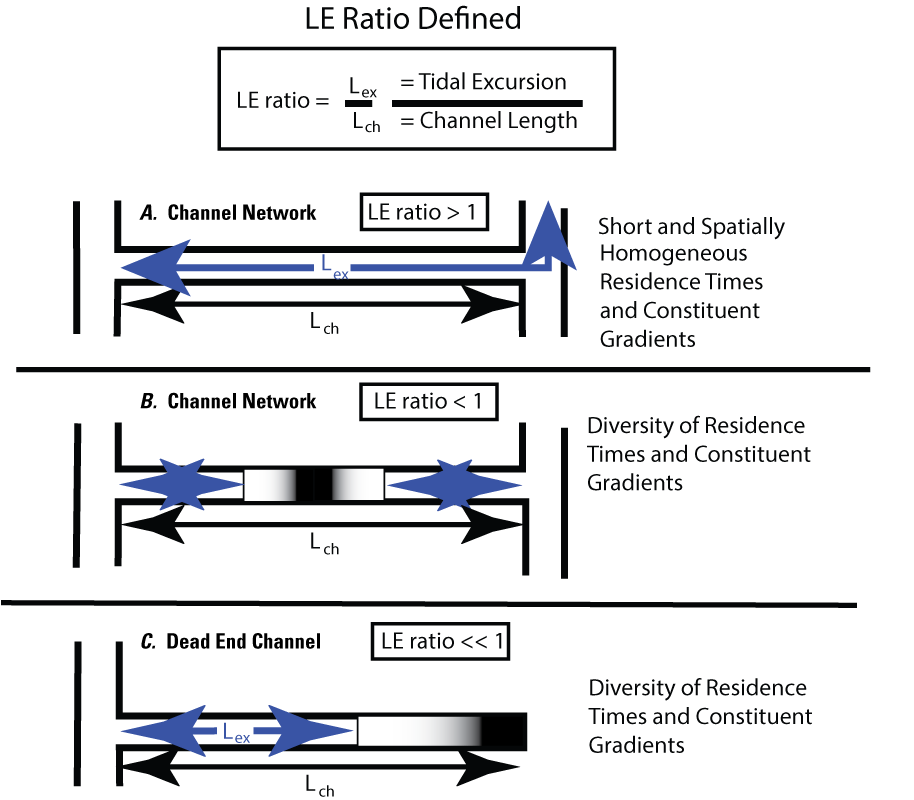
Definition sketch of the Lagrangian to Eulerian (LE) ratio, the ratio of the tidal excursion distance to channel length, for three different channel systems (Stumpner and others, 2021): A, a channel network where the channel length is less than the tidal excursion, LE ratio>1 (typical of the central and south delta); B, a channel network with two openings whose total length is longer than the tidal excursions from both connecting channels, LE ratio<1 (Montezuma Slough is a good example; fig. 1); C, dead-end channel systems, where the tidal excursion is less than the channel length, LE ratio<<1.
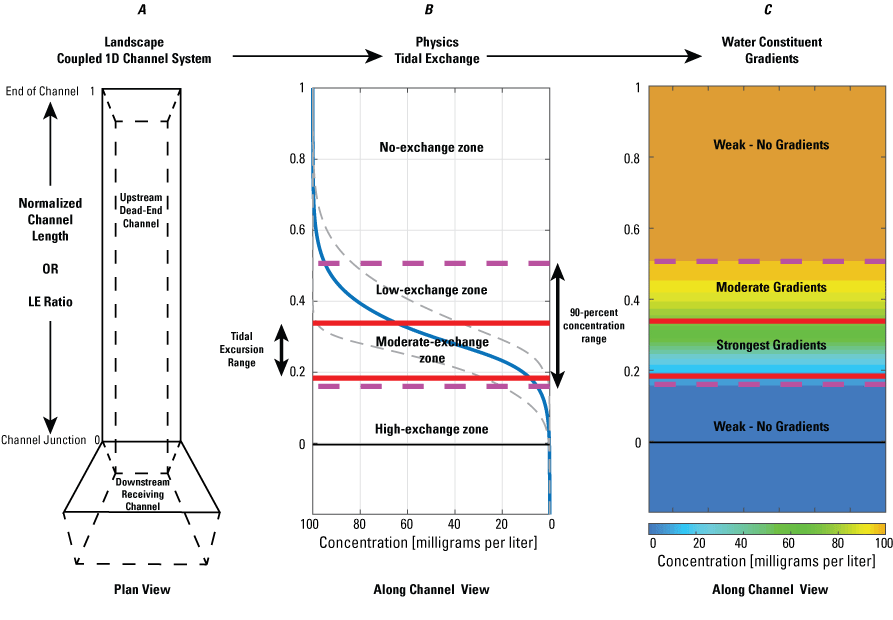
Application of the Lagrangian to Eulerian (LE) ratio applied to a dead-end channel. This example is based on the average concentration and concentration gradient of a generic conservative constituent that will not be used up during a seven-tidal-day numerical simulation of the one-dimensional advection diffusion equation. The left panel shows our simple 1-dimensional (1D) coupled channel system used in the numerical simulations. In the middle and right panels, the solid red lines represent the tidal excursion range from the seven-day tidal period (figure from Stumpner and others, 2021).
The spatial extents of the low- and moderate-exchange zones depend on many factors, including the relative importance of different transport processes and rates of biogeochemical processes that alter constituent concentrations. In the Delta, the channel-network arrangement is characteristic of human-altered channel systems, while the dead-end configuration is characteristic of more natural, dendritic channel systems. Many dead-end sloughs have small inflows (creeks) or outflows (small agricultural or municipal withdrawals) in the no-exchange zone. As long as these exchanges are small relative to the volume of the no-exchange zone, the hydrodynamic processes should be unchanged.
Stumpner and others (2021) calculated the LE ratio for the main channels in the Cache Slough Complex using observed velocity data collected at the channel mouths to calculate length of the tidal excursion from the mouths of dead-end channels (fig. 15). The Cache Slough Complex represents a heterogenous mix of exchange zones in the various channel systems. The entire stairsteps region around the northern end of Liberty Island (fig. 4) acts like a dead-end channel system fed by tidal exchanges from three different channels—the Toe Drain, Liberty Cut and Shag Slough—that maintain long residence times. This region will be discussed in several subsequent sections.
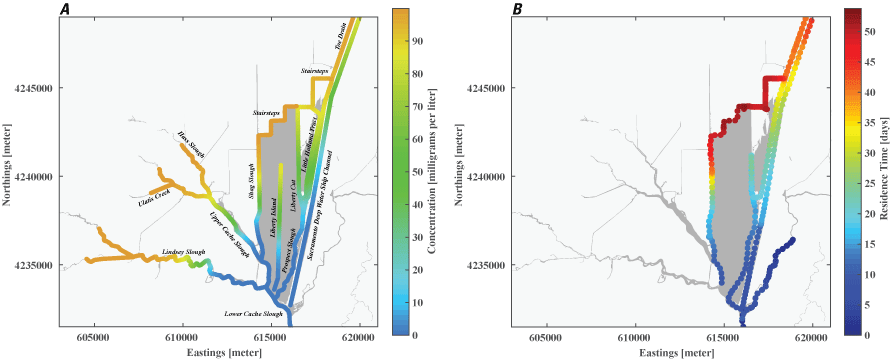
A, spatial map of exchange zones as defined in the Lagrangian to Eulerian ratio conceptual model (left panel). Exchange zones are georeferenced for each channel based on velocities measured in summer and fall of 2018 that were used to drive a one-dimensional (1D) advection–dispersion numerical simulation using a Crank–Nicholson finite difference method (Chapra and Canale, 2011) that predicts concentrations of a generic conservative tracer whose initial conditions were set to 0 milligrams per liter (mg/L) throughout the domain and a fixed concentration during flood tides of 100 mg/L; and B, residence time estimate from isotopic data near the end of flood tide on October 1, 2014, in the Cache Slough Complex (right panel; figure from Stumpner and others, 2021). The Cache Slough Complex includes Cache and Lindsey Sloughs, the Sacramento Deep Water Ship Channel, the Toe Drain, Liberty Island, Little Holland Tract, and associated connecting channels, including the stairsteps at the northern end of Liberty Island (fig. 3).
Hydrodynamics Management Implications at the Local Scale
Although the concept of the LE ratio developed as part of the physics to fish project does not have direct management implications, the LE ratio provides a relatively simple tool for understanding the transport properties of existing or planned channels that can be applied to management questions in relation to existing habitat or planned habitat restoration projects. This idea is developed more fully in later sections.
Transport
Transport, as distinct from hydrodynamic processes, is a fundamentally Lagrangian process that generally refers to the long-term exchange of water and everything in the water. Transport processes evolve from the interactions between the hydrodynamic forcing mechanisms discussed earlier but are strongly mediated by regional and often local geographic features. Examples of transport processes include (1) advection, (2) gravitational circulation, and (3) tidal dispersion; these processes control the movements of the salt field and the fate of other constituents and organisms in the San Francisco Estuary and in estuaries throughout the world.
Advection is the movement of the water and whatever is in the water by the currents at tidal and tidally averaged timescales. Gravitational circulation is an advective process that takes place in the vertical dimension at tidal timescales and is limited to the brackish regions of the estuary (seaward of 2-PSU water, in Suisun Bay and Montezuma Slough) that were described earlier. Net or tidally averaged advection (or flow) in the Delta is primarily driven by river inputs and exports from the Delta; however, other factors can affect net flow. For example, the spring-neap tidal cycle can create net flows into and out of the Delta through changes in tidal stress (Uncles, 1983), creating changes in stage of up to 0.30 meters (m), which is roughly equivalent to an exchange of 50,000 acre-ft of water from Suisun Bay, which can be salty, into and out of the Delta throughout a 14-day period. Spring/neap oscillations in offshore water levels can also create low-frequency advection of water into and out of the Delta (Monismith, 2016). A decrease in atmospheric pressure that typically happens during the onset of the first large storm of the winter can also increase water levels in Suisun Bay and the Delta by 0.30 m or more (Walters and Gartner, 1985). Increases in water levels driven by low atmospheric pressures because of storms are a lesser-known contributor to levee overtopping in the Delta compared to the more well-known combination of high river discharges and higher tides that can take place around the time of the winter solstice.
Tidal dispersive mechanisms can be important anywhere reversing tidal flows exist and are largely independent of advection associated with net flows. Net flows can affect tidal-dispersive mechanisms indirectly by changing the regional effect of the tides, an effect that is mostly limited to the tidal transition zones (fig. 3), except in extremely wet years. In the San Francisco Estuary, dispersion, which always involves exchange from higher-to-lower concentrations, can involve the combination of several mechanisms in the same region if changes in the planform, changes in depth or channel cross sectional area take place within a tidal excursion.
Lateral shear that takes place along changes in bathymetry that are in-line with the currents (along littoral boundaries and shallow-deep interfaces) can create longitudinal mixing of constituents or planktonic organisms gradient in two ways (fig. 16): (1) directly through large-scale eddies created by velocity shear (stress caused by lower velocities at the edge or bottom compared to mid-channel) at the change in depth and at the channel edge and (2) through differential tidal excursions (horizontal straining of constituents and organism concentrations) between mid-channel and edges that are created by the difference between the high velocities in deep channels and slower velocities in the shallows. This difference in velocities is known as lateral-shear flow dispersion, which scales with the magnitude of the tidal currents—the stronger the tidal currents, the greater the dispersive mixing because of lateral shear-flow through stronger horizontal eddies and greater tidal excursion differences that take place at along-channel, shallow-deep interfaces. This process can be important at large scales in Suisun Bay (fig. 17) or at local scales in a single channel (Cheng and others, 1993).
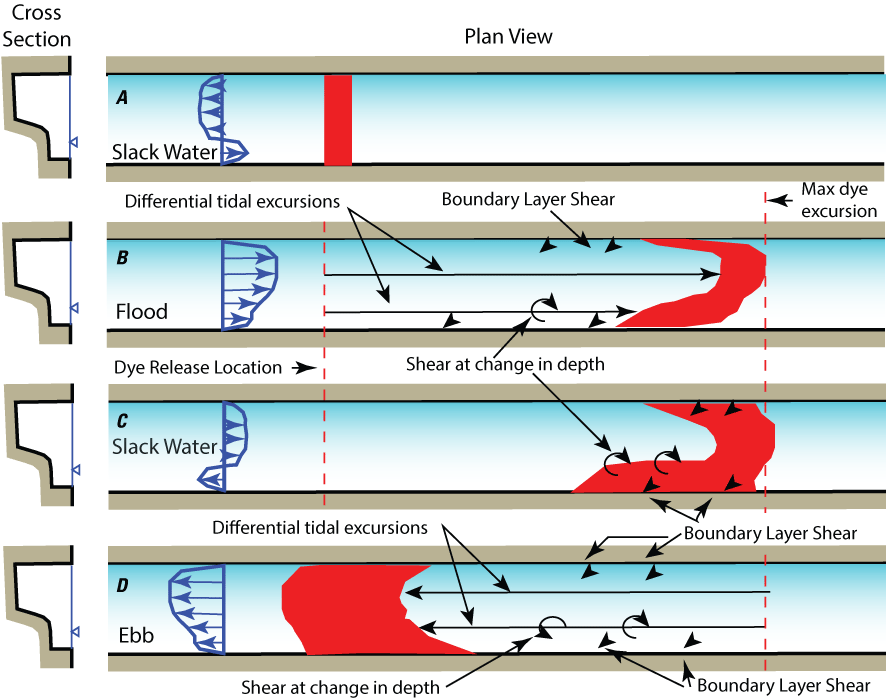
Shear-flow dispersion in a wide, tidally driven channel with uneven cross section. A, Initial patch of dye (in red) placed in the water at slack after ebb tide. In a wide channel, the velocities “turn” first in the shallows (blue velocity profile) because the slower water there has less momentum than the water in the center channel. B, Dye is advected and sheared (circular arrows) near the banks and at the shallow/channel interface because the gradient in velocity in these regions changes the shape of the dye plume as is moves with the flood tide: the dye is mixed by large eddies near the change in depth and near the banks; because the center of the channel moves faster and farther (longer tidal excursions) than in the shallows and near the banks, the dye is greatly distorted (strained), which enhances mixing when the tide turns. C, slack after ebb tide where the dye laterally mixes because of the shear from the bi-directional flow (blue velocity profile) at the shallow/channel interface. D, the ebb tide repeats the process only with the velocities going the opposite direction, though with similar shape—slower in the shallows and near the banks and faster in the center of the channel.
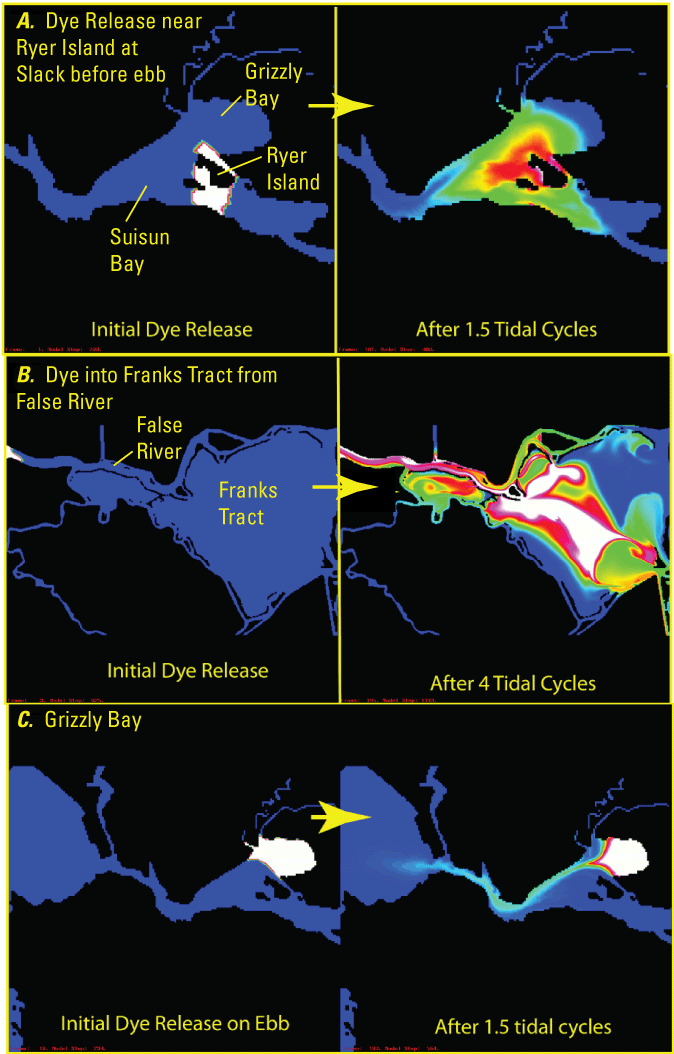
Examples of different tidal dispersion processes based on simulated dye releases using the Untrim Model (Cheng and others, 1993). A, lateral shear in Suisun Bay; B, tidal trapping in Franks Tract State Recreation Area (“Franks Tract”); and C, tidal pumping from Grizzly Bay to San Pablo Bay.
Dispersion can also happen by the processes of tidal trapping and tidal pumping (Fischer and others, 1979). Tidal trapping depends on exchange and dispersion of water from a channel into the ambient water of water bodies that have larger volume, such as a large increase in cross-sectional area or large, open-water region. For example, in Franks Tract, a large shallow region within the Central Delta Tidally Forced Zone (fig. 3), constituents (and organisms) are dispersed into the ambient water during the flood tide where some of the constituent remains after each flood tide (twice per day), resulting in increased concentrations of these constituents, such as salt. Tidal pumping results from the displacement and mixing of water that exits a large shallow region into a channel, which requires a relatively deep channel to minimize lateral shear. For example, water and associated suspended sediment from Grizzly Bay can be tidally pumped onto Suisun Bay during ebb tides though a deep channel along the shore (fig. 17). The strength of these processes depends on the magnitude of the tidal currents and are strongest when tidal currents and tidal excursions are greatest during spring tides.
The final process of dispersion is network dispersion, which was discussed in this section in the context of the LE ratio. When the LE ratio is greater than 1, constituents are transported and mixed between neighboring channels, which can greatly increase dispersive mixing. Whereas, when LE ratio is less than 1, constituents are retained in a channel and do not exchange with nearby channels, effectively eliminating network dispersion. (figs. 13, 14, 16).
Transport Management Implications
A practical outcome of the physics to fish project is that benefits to fishes and their habitat can be gained from physical manipulations to the landscape without the need for additional water. For example, habitat restoration actions that convert open channel into dead-end channels will fundamentally alter local hydrodynamics and resulting habitat zones that could support ecological processes that support fish species of special interest.
The network of flow and water-quality instrumentation in the Delta has made it possible to develop the foundational knowledge of the Delta’s hydrodynamics (Kimmerer, 2004). As elaborated earlier, this baseline knowledge can be used to estimate the effects and effectiveness of future management actions, such as flow pulses or habitat-restoration actions, at multiple spatio-temporal scales. The network provides opportunity for observation and an understanding of physical processes, which can support research and monitoring of chemical and biological responses. Results from previous studies within the CVP have shown the importance of carefully placed monitoring stations for tracking and understanding local-level hydrodynamics. Similar monitoring could be used to assess the success of the types of management strategies and actions discussed in this report and to provide the needed information to adapt them to increase their effectiveness.
The hydrodynamics of the Delta and Suisun Bay are dominated by the tides during most of the year (fig. 8; Conomos, 1979; Walters and others, 1985), and dispersive mechanisms can greatly affect transport in the tidally forced zones (fig. 8) throughout the net (advective) transport because the tidal currents are orders of magnitude greater than net (tidally) averaged currents in these zones. This observation is confirmed by the fact that salinity intrusion into the Delta because of dispersive mechanisms against the net seaward flows occurs every year during low-flow periods. Landward dispersion of salt is the mechanism that requires barriers be installed in the Delta during droughts to protect water quality at the export facilities. The effect of dispersive mechanisms can be counter-intuitive for people that are used to thinking of the unidirectional transport that takes place in rivers and streams. In the case of salinity intrusion, salt can move upstream in the face of downstream advection associated with Delta outflow, as suggested above. As discussed earlier, the complexity of hydrodynamics at regional and local scales can result in regional and temporal changes in transport processes that affect residence time and the relative importance of various physical and biological processes that can affect water quality and biological communities.
Sediment
Sediment serves many functions in the San Francisco Estuary, such as producing turbidity (the measure of relative clarity of a liquid), maintaining or increasing the elevation of tidal wetlands, and providing appropriate substrates for benthic organisms (Schoellhamer and others, 2012). Like hydrodynamics, sediment transport in the San Francisco Estuary is determined by several interacting factors. These include the upstream sediment supply, river flows that transport sediment downstream to the estuary, and estuarine hydrodynamics, which determine when and where sediment either accumulates in the estuary or is transported toward the ocean (Schoellhamer and others, 2012).
In the San Francisco Estuary, turbidity is linked to habitat suitability for species of concern (U.S. Fish and Wildlife Service, 2008, 2019). The primary contributor to turbidity is suspended sediment (Cloern, 1987; Ganju and others, 2007; Schoellhamer and others, 2012). Turbidity is an optical characteristic of water and is a measurement of the amount of light that is scattered by material in the water when a light is shined through the water sample. Turbidity is typically reported as Formazin Nephelometric Units (FNU) or Nephelometric Turbidity Unit (NTU) that are not directly comparable because FNU is based on scattering of infrared light and NTU is based on scattering of white light. Suspended-sediment concentration is the mass of sediment particles per unit volume suspended in the water column, in milligrams per liter (mg/L) measured in a discrete water sample. Because of the strong relation between turbidity and suspended sediment, monitoring approaches rely on continuous measurement of turbidity and computation of suspended-sediment concentration via regression models (Rasmussen and others, 2009; U.S. Geological Survey, 2016). These regression models can vary by location because of differences in the particle sizes of sediments in suspension; in general, for the same concentration, smaller particles produce more turbidity and scatter more light than large particles because of the amount of particles scattering light in the water column, and particle size, shape and color can affect the optical measurement (Sadar, 1998; Sutherland and others, 2000; Anderson, 2005; Schoellhamer and others, 2012). Particle sizes in suspension vary spatially and temporally and are affected by the local size distribution of primary particles. In systems with fine sediment, such as the Delta, particle sizes are affected by aggregation of fine particles into flocs.
Landscape Scale
The large-scale processes of sediment dynamics and historical factors influencing them are relatively well understood in the San Francisco Estuary (Schoellhamer and others, 2013). The two most important factors are sediment supply and transport. Here, we briefly summarize what is known about them to provide the necessary context for the findings of this study element of our physics to fish project.
Sediment Supply
Hydraulic mining in the middle and late 1800s in the Sacramento River drainage resulted in large inputs of sediment filling the channels and raising the stream beds. This increase in sediment supply peaked between 1858 and 1914 and then decreased as hydraulic mining decreased. Previously mobilized sediment was transported downstream, and new sediment from upstream areas of the watersheds was trapped behind newly constructed large dams (Schoellhamer, 2011). Sediment supply from the Sacramento River to the San Francisco Estuary decreased by about 50 percent from 1957 to 2001 as rivers in upstream watersheds adjusted to the cessation of hydraulic mining and to floodplain management (McKee and others, 2013). Step decreases in suspended-sediment concentration took place in 1983 and 1999 along with a general decreasing trend from 1983 to 2010 (Schoellhamer, 2011; Hestir and others, 2013). These step changes have been associated with large flood events that transported large volumes of the remaining sediment out of the system, leaving less to be transported in subsequent years. This represents a shift from transport-regulation to supply regulation for sediment in the San Francisco Estuary (Schoellhamer, 2011). Future large flood events are likely to result in additional step changes in SSC by further reducing the erodible pool of legacy hydraulic mining deposits, and the frequency of these events may be altered because of changes in climate, dam operations, and land use (Hestir and others, 2013; Schoellhamer and others, 2013; Stern and others, 2016).
Sediment Transport
At the landscape scale, the upper San Francisco Estuary is a conduit for sediment from the upstream watersheds to San Francisco Bay and the Pacific Ocean. Data from monitoring stations at the landward (Mallard Island [MAL]; fig. 6; USGS station 11185185; table 1) and seaward (Benicia Bridge [BMB]; fig. 6; USGS station 11455780; table 1) boundaries of Suisun Bay allow the computation of a suspended-sediment budget for Suisun Bay (fig. 18) using existing models (Ganju and Schoellhamer, 2006; McKee and others, 2006). The magnitude and direction of annual suspended-sediment flux at the seaward boundary of Suisun Bay during WYs 2002–18 varied in response to hydrologic conditions in the Central Valley watershed (fig. 18).
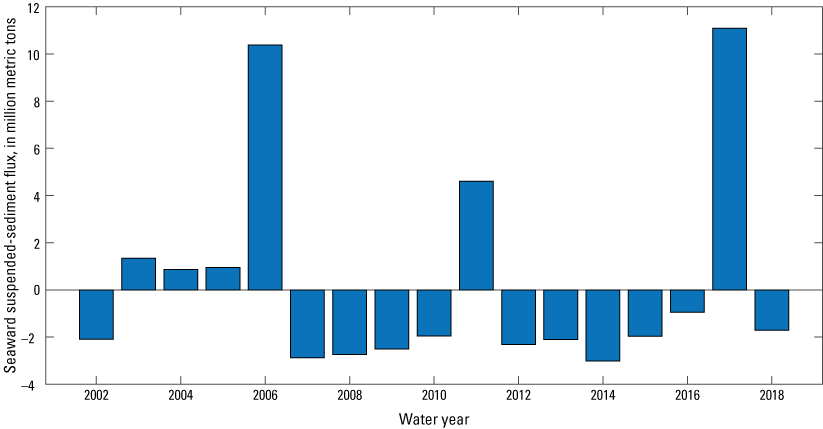
Time series of annual net suspended-sediment flux (million metric tons [Mt]) at seaward boundary of Suisun Bay at Benicia Bridge (BMB; table 1; U.S. Geological Survey station number 11455780; U.S. Geological Survey, 2022), for water years 2002–18. Positive values of flux indicate net seaward transport of suspended sediment at this boundary, and negative values of flux indicate landward transport of suspended sediment at this boundary.
By comparing net suspended-sediment flux at the landward and seaward boundaries of Suisun Bay, we calculated cumulative deposition (accumulation) of sediment for Suisun Bay (fig. 19). Generally, Suisun Bay is erosive (negative deposition) during wet years (water years 2006, 2011, 2017) and depositional (positive deposition) during dry years (fig. 19). The seaward transport of sediment in wet years results in a loss of sediment from Suisun Bay and the Delta to more-seaward regions of the estuary.
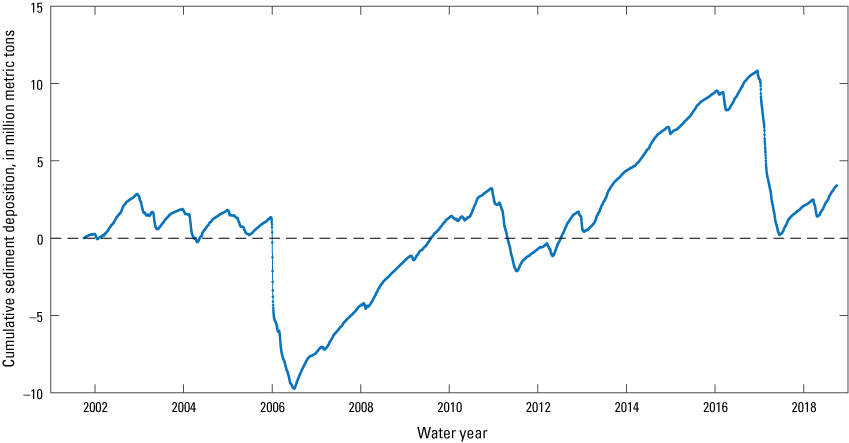
Time series of cumulative sediment deposition (accumulation; million metric tons [Mt]) for Suisun Bay for water years 2002–18 for U.S. Geological Survey (USGS) stations at Benicia Bridge (BMB; table 1; USGS station 11455780; U.S. Geological Survey, 2022) and Mallard Island (MAL; table 1; 11185185; U.S. Geological Survey, 2022). Positive values of deposition indicate net deposition of suspended sediment in Suisun Bay, and negative values indicate erosion.
Average turbidity in the fall (September 1–October 31) can vary widely across the Delta based on hydrology (fig. 20) and regional sediment supply. In the extremely dry calendar year 2015, turbidities were greater in the Cache Slough Complex than in Suisun Bay. This likely happened because during dry years, net-seaward transport out of the Delta is reduced and sediments are trapped in the tidal regions of the Delta and remain in the landward extent of the estuary. These trapped sediments are then resuspended periodically by tidal flows and episodically by wind waves and are transported downstream in the lower Sacramento River with the net flows, but then transported upstream on flood-dominated tidal currents seaward of Rio Vista, causing higher turbidity in the Cache Slough Complex (fig. 20) and higher SSC in the confluence region via gravitational circulation. In dry years, salinity intrusion facilitates gravitational circulation in this region compared to most other years. In the Cache Slough Complex, landward transport of sediment is further facilitated by upstream agricultural diversions that create a consistent landward net flow. In contrast, during the extremely wet calendar year 2017, fall turbidity was greater in Suisun Bay than in the Cache Slough Complex (see BMB and MAL in fig. 20). This happened because the higher net-seaward flows transported sediment-laden waters out of the Delta into Suisun Bay. In the summer and fall of these wet years, wind-wave resuspension (this process is described in detail later) and gravitational circulation in Suisun Bay led to local maximums in turbidity and SSC near Mallard Island (BMB and MAL, fig. 20). As described in the “Hydrodynamics” section, the ETM is a longitudinal maximum in SSC that is not necessarily fixed to any specific location and can move tidally. However, during the low-flow period, turbidity is generally higher near Mallard Island, because CVP and SWP operations to meet salinity standards place X2 and the associated ETM near this location.
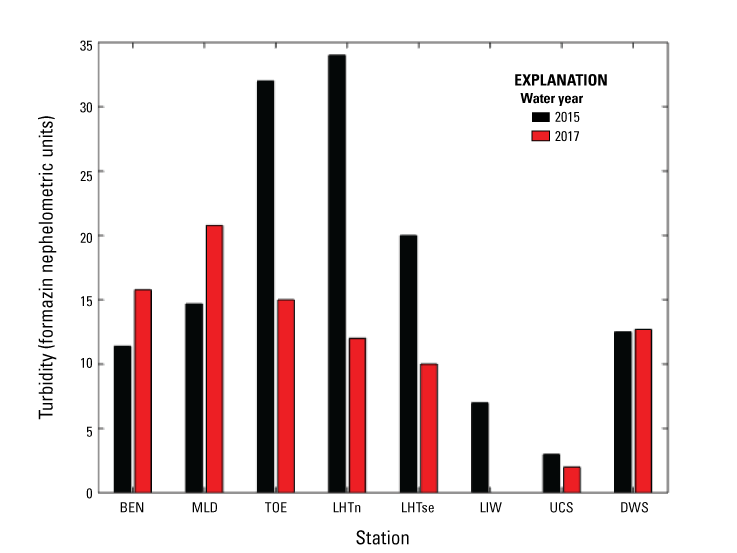
Comparison of average turbidity in Formazin Nephelometric Units (FNU) in the fall (September 1–October 31) for an extremely dry year (calendar year 2015) and an extremely wet year (calendar year 2017) at stations across the Sacramento–San Joaquin Delta. Stations presented from seaward to landward with the following abbreviations and U.S. Geological Survey station numbers (U.S. Geological Survey, 2022): Suisun Bay at Benicia Bridge near Benicia (BMB; U.S. Geological Survey station 11455780); Suisun Bay at Mallard Island (MAL; U.S. Geological Survey station 11185185); Toe Drain at Liberty Island near Courtland (TOE; U.S. Geological Sruvey station 11455140); Little Holland Tract at North Breach near Courtland (LHTn; U.S. Geological Survey station 11455143); Prospect Slough at Toe Drain near Courtland (LHTse; U.S. Geological Survey station 11455167); LIW (381504121404001), location on figure 25; Cache Slough near Hastings Tract near Rio Vista (UCS; U.S. Geological Survey station 11455280); Sacramento River Deep Water Ship Channel near Rio Vista (DWS; U.S. Geological Survey station 11455335). All data from U.S. Geological Survey (2022), and additional station information is available in table 1.
Sediment Management Implications
Simple management actions likely cannot address the reductions in sediment supply to the Delta from the upper watersheds. However, we list some management actions that could potentially increase sediment transport from the upper watersheds to the upper San Francisco Estuary construed from the discussions in the various literature (Gilbert, 1917; Porterfield, 1978; Wright and Schoellhamer, 2004):
-
1. Selective dam removal to increase sediment supply from accumulated sediment in the reservoir and from active erosion in the upper watershed.
-
2. Develop technologies for passing sediment over or through dams.
-
3. Encourage erosion of sediment deposits that are currently in the river floodplain below the dams. Setback levees might be needed to accommodate increased stream meandering.
-
4. In combination with number 3, supplement floodplains with fine sediments from nearby fluvial terraces (former floodplains) for transport to the Delta.
These approaches all have major policy and logistical challenges, and would all require modeling efforts to determine if they are feasible and sustainable. Landscape manipulations in the Delta, such as wetland restoration and modification of channel networks, may provide a more practical approach to make the best ecological use of the current sediment supply.
Regional Scale
Our regional sediment investigations focused on the Central Delta Tidally Forced Zone, the South Delta Tidal Transition Zone, and the Cache Slough Complex. Turbidities in the winter across the Delta are believed to affect probabilities for delta smelt entrainment into the C.W. “Bill” Jones and Harvey O. Banks Pumping Plants at various times because delta smelt entrainments tend to happen more frequently and at higher abundance when turbidity exceeds about 12 NTU (U.S. Fish and Wildlife Service, 2008, 2019; Grimaldo and others, 2009a). As discussed earlier, the Cache Slough Complex is considered to have some of the best remaining habitat for native fishes, including delta smelt. High summer-fall turbidities in the Cache Slough Complex relative to other Delta regions are considered favorable for delta smelt.
Central Delta Tidal Zone and South Delta Tidal Zone
Our data support observations from an earlier study (Wright and Schoellhamer, 2005) showing that the primary sediment supply to the Central Delta Tidally Forced Zone (fig. 21) is typically from the Sacramento River. However, results from this physics to fish project study element found that the primary pathway to the Central Delta Tidally Forced Zone is generally through Georgiana Slough (GSS; California Department of Water Resources, 2022; USGS station 11447903; U.S. Geological Survey, 2022; table 1), and that sediments from the Mokelumne (MOK; table 1) and Consumnes River watersheds are lower (fig. 22; Wright and Schoellhamer, 2005). That is, high turbidities observed at MOK generally are transported from GSS (estimated from sediment concentrations determined from this physics to fish project) rather than coming from the Mokelumne or Consumnes River watershed system as indicated by the size of the import arrows in figure 22. Sediment from the Sacramento River is typically advected into the Central Delta Tidally Forced Zone in one day of a fluvial high-flow event in the river upstream from the Delta that results in elevated SSC at Freeport, Calif. (fig. 1), into the North Delta Tidal Transition Zone. These events usually are associated with winter storms and elevated SSC and turbidity in the Central Delta Tidally Forced Zone. The first high-flow event of the winter season is called the “first flush.” Once suspended sediment enters the Central Delta Tidally Forced Zone, tidal dispersion dominates the transport of suspended sediment. Suspended sediment moves through False River toward Franks Tract (fig. 21) during the flood tide. In addition, exports from the C.W. “Bill” Jones and Harvey O. Banks Pumping Plants (figs. 6, 21) can drive a landward advective sediment flux through False River when exports exceed seaward net flow. Because of the combination of tidal dispersion and landward advection and the shear flow through the channel, the net sediment flux in False River is typically larger than the flux from the San Joaquin River into Old River and contributes to the total net sediment load that deposits inside of Franks Tract.
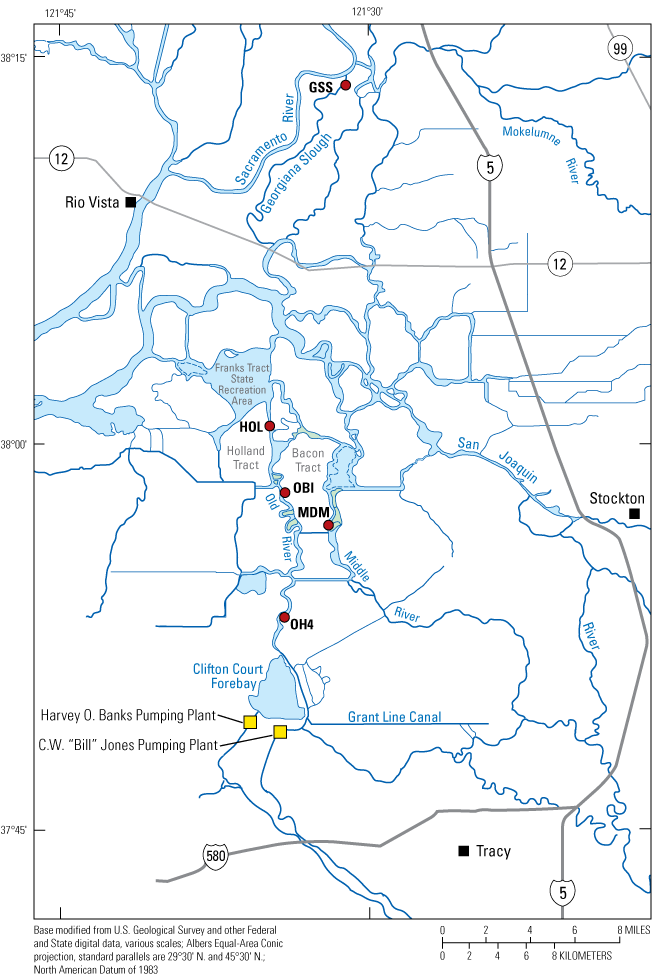
Map indicating flow direction and magnitude in the North and South Tidal Transition Zones and the Central Delta Tidally Forced Zone (fig. 3), Sacramento–San Joaquin Delta, including select monitoring stations (red circles; Georgiana Slough near Sacramento River [GSS; U.S. Geological Survey station 11447903]; Holland Cut near Bethel Island [HOL; U.S. Geological Survey station 11313431]; Old River at Bacon Island [OBI; U.S. Geological Survey station 11313405]; Middle River at Middle River [MDM; U.S. Geological Survey station 11312676]; Old River near Byron [OH4; U.S. Geological Survey station 11313315]); and the locations of the C.W. “Bill” Jones (Central Valley Project, CVP; Bureau of Reclamation, 2022) and Harvey O. Banks (State Water Project, SWP; California Department of Water Resources, 2023) Pumping Plants, shown as black squares. All data from California Department of Water Resources (2022) and U.S. Geological Survey (2022).
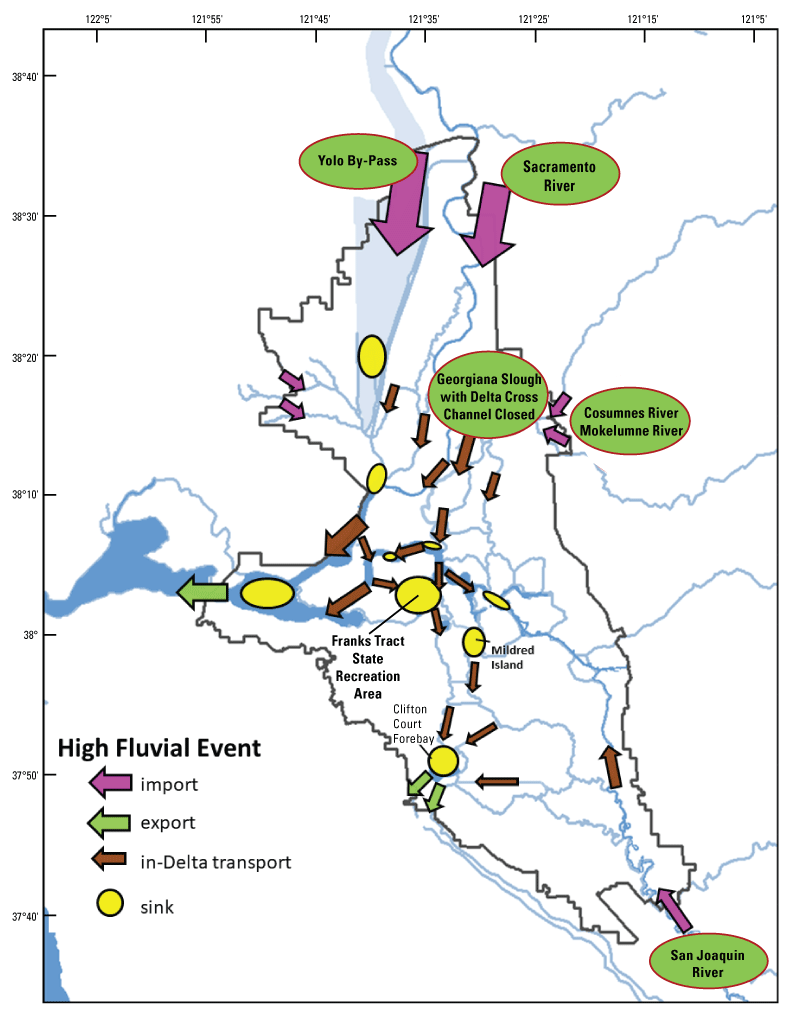
Suspended-sediment transport pathways through the Sacramento–San Joaquin Delta during high-input winter fluvial events (wetter years with Yolo By-Pass flows). Suspended-sediment transport in Delta is shown down Georgiana Slough with the Delta Cross Channel closed. Transport arrows and sediment sinks (yellow ovals) were determined by multiplying suspended-sediment concentration by flow (U.S. Geological Survey, 2022). The size of the arrows and ovals are intended to represent differences in magnitude but are not to scale.
In the South Delta Tidal Transition Zone, natural transport is toward the Central Delta Tidally Forced Zone (fig. 3); however, during low-flow conditions, exports from the C.W. “Bill” Jones (CVP) and Harvey O. Banks (SWP) Pumping Plants (figs. 6, 21) drive a landward advective sediment flux from the Central Delta Tidally Forced Zone to the South Delta Tidal Transition Zone (toward the export facilities) through Old and Middle Rivers. The landward advective sediment transport from the Central Delta Tidally Forced Zone into the South Delta Tidal Transition Zone happens when inflow from the San Joaquin River is less than exports. The exceptions are extremely wet water years, like 2017, when the sediment flux was seaward from the South Delta Tidal Transition Zone to the Central Delta Tidally Forced Zone from late winter through spring (fig. 23). Thus, during fluvial events (storms causing large increases in flow), elevated turbidity in the South Delta Tidal Transition Zone is primarily caused by SSC from Georgiana Slough and transported along the Mokelumne River. The sediment transport rates along this path are primarily dependent on Sacramento River inflow and export pumping from the C.W. “Bill” Jones and Harvey O. Banks Pumping Plants (figs. 5, 6, 21).
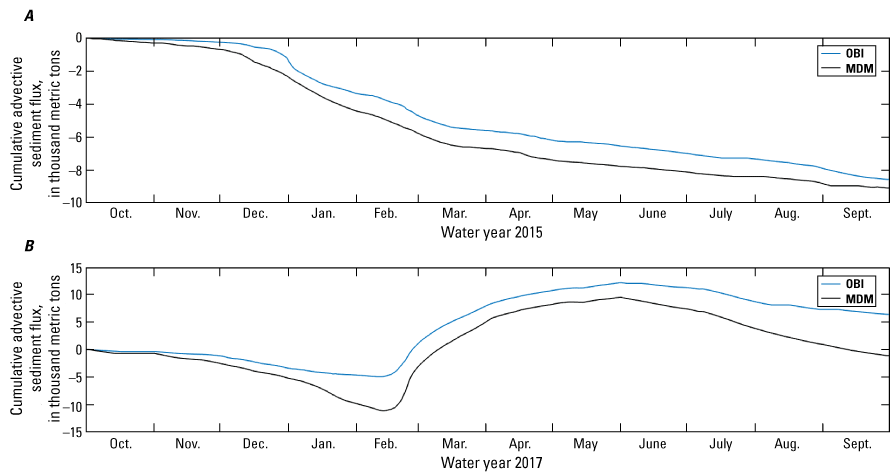
The advective flux of suspended sediment at Old River at Bacon Island (OBI; U.S. Geological Survey station 11313405) and Middle River at Middle River (MDM; U.S. Geological Survey station 11312676) during water years A, 2015 and B, 2017. The sediment fluxes at OBI and MDM were computed from time-series discharge and suspended-sediment concentration data (Morgan-King and Conlen, 2022; U.S. Geological Survey, 2022). The negative slope is in the landward direction and the positive slope is in the seaward direction, which was observed during the 2017 high flows from February to May (U.S. Geological Survey, 2022).
Sediment deposited into Franks Tract can be resuspended during wind events and increase turbidity in the surrounding channels. Transport of this suspended sediment can constitute the largest sediment flux in Old River toward the C.W. “Bill” Jones and Harvey O. Banks Pumping Plants and can increase turbidities to levels (>12 FNU) that likely inhibit movement of delta smelt. The direction of suspended-sediment transport can be managed to limit turbidity in the vicinity of the C.W. “Bill” Jones and Harvey O. Banks Pumping Plants (figs. 5, 6, 21). For example, during the end of the first flush in 2015, the largest increase in turbidity and sediment flux in Old River was because of landward advection that followed a wind event. Combined flow in the Old (OBI; USGS station 11313405, table 1) and Middle (MDM; USGS station 11312676, table 1) Rivers is measured as “OMR” (table 1; California Department of Water Resources, 2022) and represents flow moving toward the C.W. “Bill” Jones and Harvey O. Banks Pumping Plants (OBI, MDM; fig. 6). Exports from the C.W. “Bill” Jones and Harvey O. Banks Pumping Plants were preemptively reduced such that OMR flows were maintained around −5,000 ft3/s to minimize delta smelt observed at the screens of the pump intakes (known as “salvage”; U.S. Fish and Wildlife Service, 2008, 2019220; Grimaldo and others, 2009a, 202178). In the latter part of December 2014, the landward advection was facilitating a slow increase of turbidity that had already exceeded 12 FNU in Holland Cut near Bethel Island (HOL; U.S. Geological Survey station 11313431, table 1; fig. 24B), but high SSC in Franks Tract from wind resuspension resulted in a peak turbidity of 190 FNU at Holland Cut near Bethel Island (HOL; U.S. Geological Survey station 11313431, table 1; fig. 24B) that was advected landward toward the C.W. “Bill” Jones and Harvey O. Banks Pumping Plants (fig. 24), resulting in increased turbidity along the Old River corridor to the South Delta Tidal Transition Zone. This happened because exports were between five to six times the inflows from the San Joaquin River (U.S. Geological Survey, 2022), producing a strong advective landward flux of water and sediment in Old River (fig. 24C). The sediment traveled from the OBI station to OH4 in days as observed by the peak turbidity at OH4 (fig. 24B), which coincided with delta smelt salvage at the C.W. “Bill” Jones and Harvey O. Banks Pumping Plants (U.S. Fish and Wildlife Service, 2019; California Department of Fish and Wildlife, 2022; data located at https//wildlife.ca.gov/Conservation/Delta/Salvage-Monitoring). A potential future management strategy would be to eliminate the landward advective sediment flux by reducing exports during wind events likely to resuspend sediment.
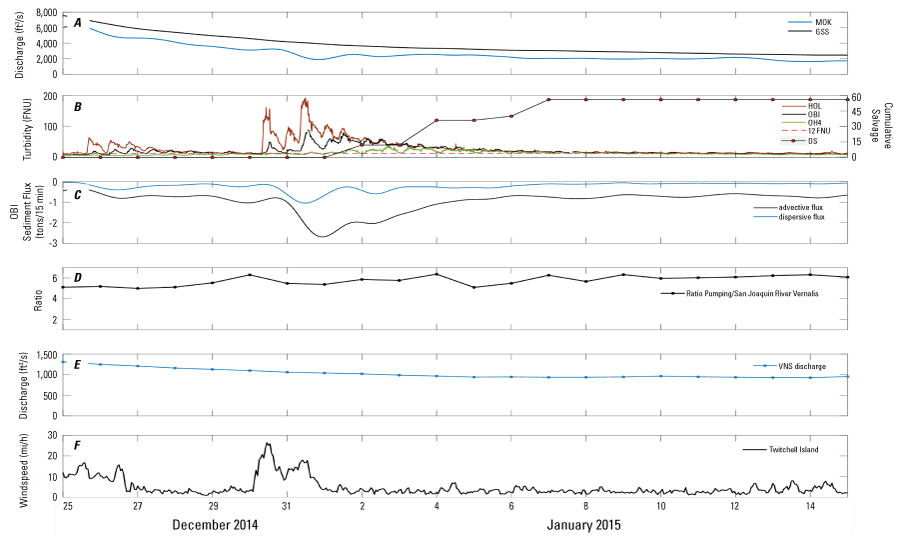
Wind resuspension of sediment in Franks Tract State Recreation Area (“Franks Tract”) following the first flush in 2015 that resulted in landward advective flux of suspended sediment down Old River and increased turbidity (in Formazin Nephelometric Units [FNU]). A, tidally filtered discharge (in cubic feet per second [ft3/s]) at Georgiana Slough near Sacramento River (GSS; California Department of Water Resources, 2022; U.S. Geological Survey station 11447903; U.S. Geological Survey, 2022; table 1) and Mokelumne River at Andrus Island near Terminous (MOK; California Department of Water Resources, 2022; U.S. Geological Survey station 11336930; U.S. Geological Survey, 2022; table 1); B, turbidity at Holland Cut (HOL; California Department of Water Resources, 2022; U.S. Geological Survey station 11313431; U.S. Geological Survey, 2022; table 1) and Old River at Bacon Island (OBI; California Department of Water Resources, 2022; U.S. Geological Survey station 11313405; U.S. Geological Survey, 2022; table 1) in Formazin Nephelometric Units (FNU; California Department of Water Resources, 2020b), overlaid with cumulative delta smelt (DS) salvage, where the salvage unit is number of delta smelt (California Department of Fish and Wildlife, 2020); C, dispersive and advective flux in at OBI, in metric tons per 15 minutes (tons/15 min), table 1; D; ratio of pumping discharge to daily values of inflow from the San Joaquin River near Vernalis, California (VNS; California Department of Water Resources, 2022; U.S. Geological Survey station 11303500; U.S. Geological Survey, 2022; table 1); E, mean daily discharge at VNS, in ft3/s; F, hourly wind speed at Twitchell Island, in miles per hour (mi/h), data from California Department of Water Resources (2020c).
Cache Slough Complex
Hydrodynamic processes in dead-end systems like the Cache Slough Complex generally create higher overall turbidities and can drive local turbidity maximums (Morgan-King and Schoellhamer, 2013), which can be associated with high abundance of some organisms (Feyrer and others, 2015). Delta smelt are associated with high turbidity in field studies (Feyrer and others, 2007, 2017; Moyle and others, 2012; Sommer and Mejia, 2013), and results of a laboratory study indicate an optimum turbidity of 25 to 80 NTU (Hasenbein and others, 2016); however, the average turbidity throughout most of the Delta is typically below this range. The Cache Slough Complex generally sustains a turbidity in this range, and its average turbidity is twice as high as the rest of the Delta (Morgan-King and Schoellhamer, 2013).
The Cache Slough Complex is characterized by a complex channel system (fig. 25) and hydrodynamics (fig. 15) that result in extremely diverse and complex sediment-transport patterns. These sediment dynamics vary greatly depending on the extent of Yolo By-Pass flooding (fig. 26). The Cache Slough Complex experiences the most extreme annual range in hydrologic forcing of any other region of the Delta. Conditions can range from maximum flooding of Yolo By-Pass (600,000 ft3/s at capacity) during wet years to no flooding of the Yolo By-Pass during low-flow years. During flood years, discharge through the Cache Slough Complex can overcome the strong tidal forcing that enters the Cache Slough Complex from lower Cache Slough. A series of west-side tributaries also contribute water and suspended sediment into the Yolo By-Pass, including the Colusa Basin Drainage Canal, Cache Creek, and Putah Creek (fig. 25). Suspended-sediment concentration values in these west side tributaries can be high (>1,000 FNU) compared to other regions of the Delta during winter high-flow events. In dry years, when winter net seaward flows in the Cache Slough Complex are minimal, much of this incoming sediment is retained in the Cache Slough Complex. During the summer, agricultural withdrawals can often cause net flow to be landward (fig. 27), which also results in sediment retention.
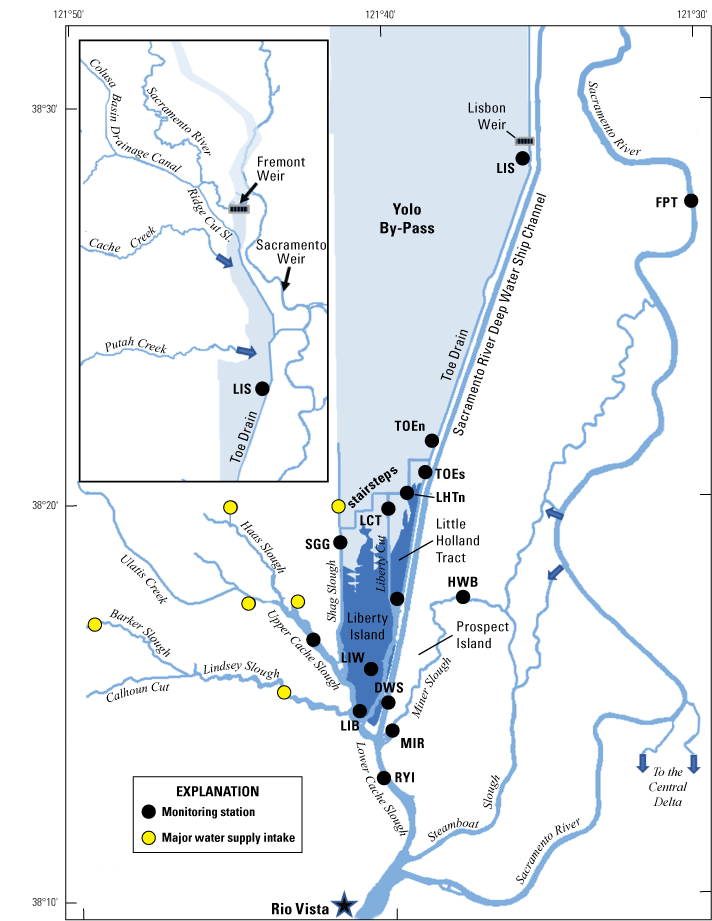
Locations of monitoring stations described in table 1: Sacramento River at Freeport [FPT; California Department of Water Resources, 2022; U.S. Geological Survey (USGS) station 11447650; U.S. Geological Survey, 2022], Toe Drain at Liberty Island near Courtland (TOE; USGS 11455140; U.S. Geological Survey, 2022), Little Holland Tract at North Breach near Courtland (LHTn; USGS station 11455143; U.S. Geological Survey, 2022), Cache Slough at South Liberty Island near Rio Vista (LIB; California Department of Water Resources, 2022; USGS station 11455315; U.S. Geological Survey, 2022), Sacramento River Deep Water Ship Channel near Rio Vista (DWS; California Department of Water Resources, 2022; USGS station 11455335; U.S. Geological Survey, 2022), Cache Slough at Ryer Island (RYI; USGS station 11455350; U.S. Geological Survey, 2022), Liberty Cut at Little Holland Tract near Courtland (LCT; USGS station 11455146; U.S. Geological Survey, 2022); Shag Slough at Liberty Island near Courtland (SGG; USGS station 11455276; U.S. Geological Survey, 2022), Liberty Island near Prospect Island near Rio Vista (LIW; USGS station 381504121404001; U.S. Geological Survey, 2022) and Lisbon Weir (LIS; California Department of Water Resources, 2022; USGS station 382829121351801; U.S. Geological Survey, 2022) in Yolo By-Pass and the Cache Slough Complex.
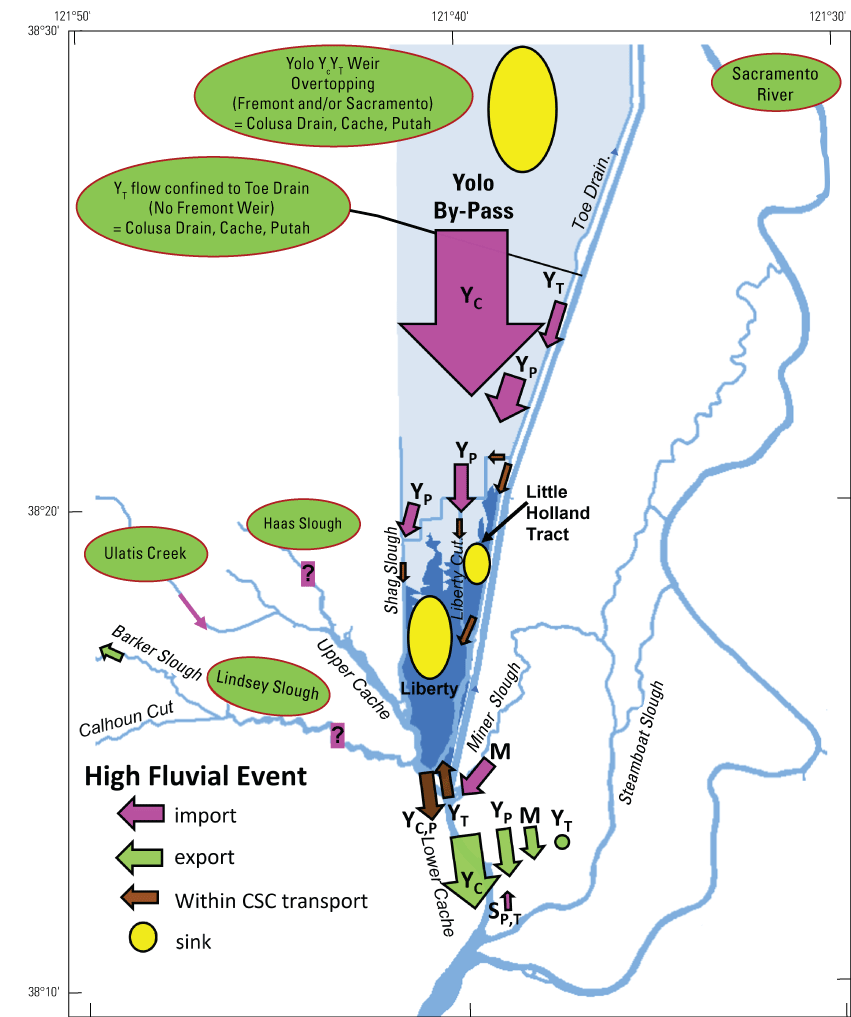
Transport (flux) of suspended sediment through the Cache Slough Complex during different intensities of flooding in Yolo By-Pass. Suspended-sediment flux data were computed by multiplying suspended-sediment concentration by flow U.S. Geological Survey (2022). Abbreviations: YC, Yolo By-Pass completely flooded; YP, Yolo By-Pass partially flooded; YT, slight flooding with water remaining in the Toe Drain; ?, unmeasured sediment loads; SP,T, sediment imported from the Sacramento River and Steamboat Slough only when Yolo By-Pass is partially flooded or when there is only isolated flow in the Toe Drain; M, sediment transported through Miner Slough (U.S. Geological Survey, 2022).
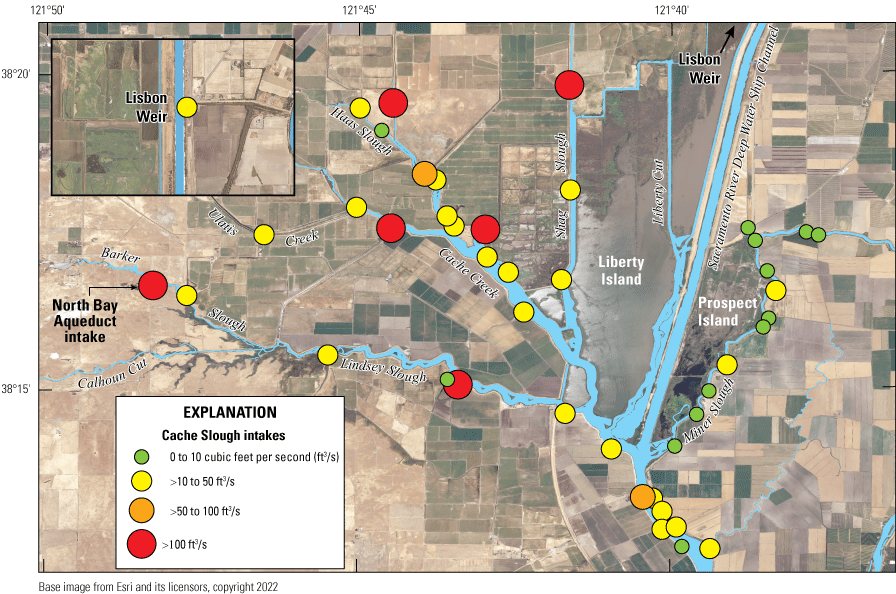
Water withdrawals in the Cache Slough Complex (fig. 3). The Cache Slough Complex includes Cache and Lindsey Sloughs, the Sacramento Deep Water Ship Channel, the Toe Drain, Liberty Island, Little Holland Tract, and associated connecting channels, including the stairsteps at the northern end of Liberty Island. All the withdrawals shown are agricultural withdrawals, except the withdrawal in Barker Slough. The North Bay Aqueduct intake, part of the State Water Project, withdraws water from Barker Slough that provides domestic water supplies to Solano and Napa Counties (not shown). Figure was provided by Alex Rabidoux, Solano County Water Agency.
During wet years, a substantial part of the sediment transported through the Delta comes down the Sacramento River, including sediment that passes through the Yolo By-Pass (fig. 26). During extremely wet years like water year 2017, most of the sediment transported through the Yolo By-Pass is exported from the Cache Slough Complex (scenario Yc, fig. 26). Although much of the sediment passes through the system, there are regions where sediment is deposited, including Little Holland Tract and Liberty Island (fig. 26). In drier winters, less sediment is transported, and Sacramento River sediment is confined to the main-stem Sacramento River channel. In the Cache Slough Complex, sediment from the westside tributaries and Colusa Basin Drainage Canal is confined to the Toe Drain (scenario Yt, fig. 26) during drier water years like 2015. In years when partial flooding of Yolo By-Pass occurs, transport pathways through the Cache Slough Complex vary depending on the extent of flooding because the bypass fills from east to west (scenario Yp, fig. 26).
During the summer, river flows are greatly reduced, and sediment transport is dominated by processes in the Delta, including the Cache Slough Complex (fig. 28). Most of the tidal currents in the channels in the Cache Slough Complex have a flood-dominant tidal current asymmetry during low flow periods, as described in the “Hydrodynamics” section. The large sediment flux into Liberty Island, in combination with the low turbidities there, is indicative of the flood-dominant tidal current asymmetry, which greatly moves suspended sediment through lower Cache Slough into Liberty Island and the Sacramento River Deep Water Ship Channel even though the sediment concentrations are relatively low (fig. 29). The Little Holland Tract can be a source of suspended sediment to neighboring water bodies, but the transport of sediment into and out of Little Holland Tract is complex and is described in detail in the next section. Flood asymmetry drives a negative sediment flux into and in the Cache Slough Complex (fig. 29) from down-estuary locations and elevates the turbidity in the Cache Slough Complex at the landward limit of the flood tide excursion. The negative sediment flux at the Toe Drain at Liberty Island near Courtland (TOE; U.S. Geological Survey station 11455140; table 1) is driven by flood-dominant tidal asymmetry enhanced by agricultural withdrawals from the Toe Drain.
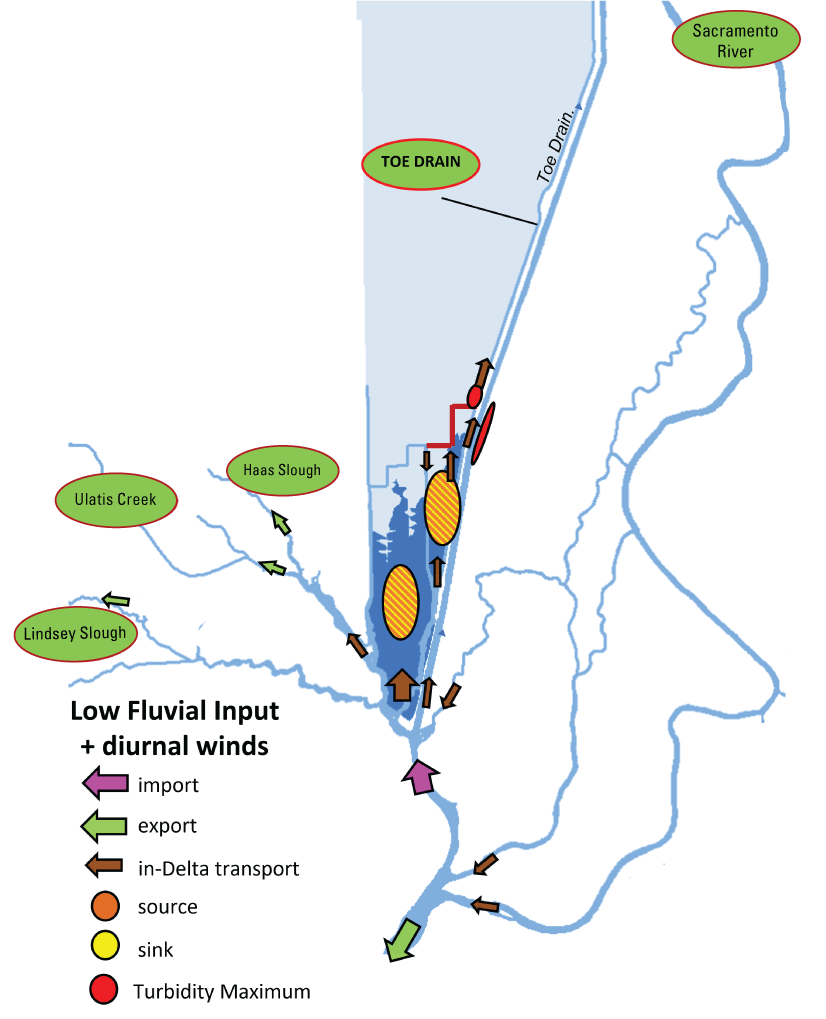
Suspended-sediment transport (flux) through the Cache Slough Complex (fig. 3) during low-inflow conditions, when there is sufficient wind to resuspend fine sediment. The Cache Slough Complex includes Cache and Lindsey Sloughs, the Sacramento Deep Water Ship Channel, the Toe Drain, Liberty Island, Little Holland Tract, and associated connecting channels, including the stairsteps at the northern end of Liberty Island. The arrows represent relative importance of the different pathways rather than specific quantities. Little Holland Tract is a source of sediment, and Liberty Island is a source and a sink (represented by the pattern fill). Suspended-sediment flux data were computed by multiplying suspended-sediment concentration by flow U.S. Geological Survey (2022).
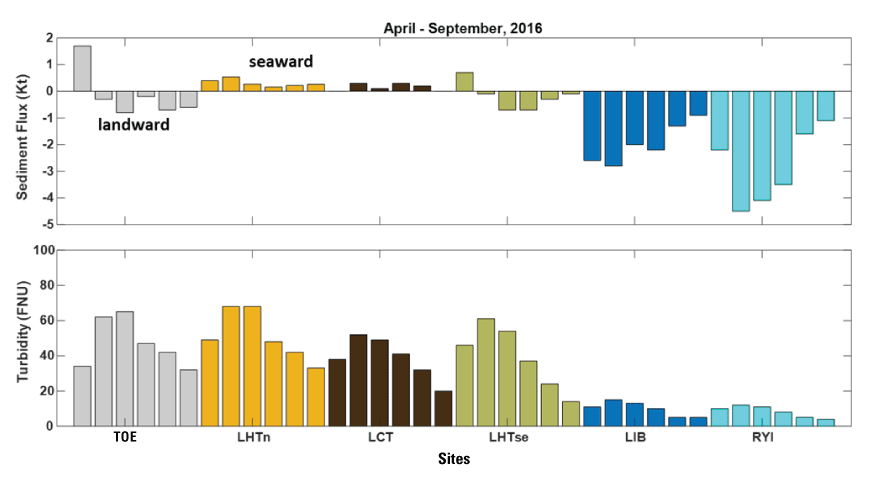
Suspended-sediment flux in thousand metric tons (Kt) and mean turbidity in Formazin Nephelometric Units (FNU) at various locations in the Cache Slough Complex (fig. 3) during low-flow conditions from April to September 2016 (U.S. Geological Survey, 2022). The Cache Slough Complex includes Cache and Lindsey Sloughs, the Sacramento Deep Water Ship Channel, the Toe Drain, Liberty Island, Little Holland Tract, and associated connecting channels, including the stairsteps at the northern end of Liberty Island. The suspended-sediment flux data were computed by multiplying suspended-sediment concentration by flow U.S. Geological Survey (2022). Negative fluxes for Little Holland Tract (Prospect Slough at Toe Drain near Courtland (LHTse; U.S. Geological Survey station 11455167) and Liberty Island (LIB; U.S. Geological Survey station 11455315; signify suspended sediment moving into the water body. For the other stations, negative fluxes signify suspended sediment moving landward in Cache Slough (RYI; U.S. Geological Survey station 11455350), Toe Drain at Liberty Island near Courtland (TOE; U.S. Geological Survey station 11455140, and Liberty Cut (LCT; U.S. Geological Survey station 11455146). Flow data for Little Holland Tract at North Breach near Courtland (LHTn; U.S. Geological Survey station 11455143) were not available, so flux could not be calculated. Additional information about stations is available in table 1. All data from U.S. Geological Survey (2022).
Lehman and others (2010) suggested that Liberty Island exports suspended sediment out of its southern breach during low-flow periods. However, more than 5 years of continuous discharge and suspended-sediment data (U.S. Geological Survey, 2022) indicate that Liberty Island is a sediment sink because the sediment flux associated with the flood-dominant tidal current asymmetry overwhelms any export because of wind-wave resuspension.
Turbidity Maximums in the Cache Slough Complex
There are several turbidity maxima consistently present at locations in the Cache Slough Complex, including the Sacramento River Deep Water Ship Channel, stairsteps, and the Toe Drain at the northeast corner of Little Holland Tract (fig. 28). These are located at the landward limit of the flood tide excursion. The Little Holland Tract is a source of sediment to the surrounding channels, and the turbidity maximum (TM) in the Toe Drain sustains a higher turbidity than the TM in the Sacramento River Deep Water Ship Channel because of input from Little Holland Tract. Sustained diurnal winds (southwest dominant) during the low-flow period (summer and fall) enhance the TM in the northwest region of Little Holland Tract. Between 2015 and 2018, the average TM in the Toe Drain was generally twice as high as the average TM in the Sacramento River Deep Water Ship Channel.
As described earlier, freshwater TMs unique to dead-end standing wave systems like the Cache Slough Complex are driven by a flood tidal current bias that preferentially resuspends bed sediments and transports them landward (see “Hydrodynamics” section). In the case of the Cache Slough Complex, TMs in the region receive their suspended-sediment supply in the form of suspended sediment from Yolo By-Pass, Cache and Miner Sloughs, and from tidal and wind-wave sediment resuspension in the shallow flooded islands (Liberty Island and Little Holland Tract). Ebb tidal excursions in the north-south channels connecting to the stairsteps are much shorter than their channel lengths (LE ratio< 1), which drastically reduces seaward dispersive mixing of suspended sediment out of the stairstep region (Morgan-King and Schoellhamer, 2013), maintaining elevated turbidities in the no-exchange zone (figs. 13, 14).
Sediment Management Implications at the Regional Scale
As discussed in the previous section, there are currently no straightforward management actions that can address the reductions in sediment supply in the upper watersheds. Our increasing understanding of how regional and local hydrodynamic conditions interact with existing sediment supplies to create turbidity increases our ability to anticipate the outcomes of management actions.
Managing turbidity in the central and south Delta has been and continues to be an important part of management actions to reduce entrainment of adult delta smelt (U.S. Fish and Wildlife Service, 2008, 2019). Monitoring carried out during the physics to fish project and prior cooperative projects with Reclamation has provided the consistent monitoring data needed for turbidity management at the regional scale. In addition, our regional-scale study element results have the following important implications for turbidity management:
-
1. Wind events can create turbid conditions similar to those created by high river flows. Therefore, managers can monitor for possible wind events in addition to high-flow events that might cause increased turbidity in the central and south Delta and might increase the probability of delta smelt entrainment into the C.W. “Bill” Jones (CVP) and Harvey O. Banks (SWP) Pumping Plants. A potential future management strategy would be to eliminate the movement of suspended sediment by reducing exports during wind events likely to resuspend sediment.
-
2. Two major hydrodynamic mechanisms control turbidity when Yolo By-Pass is not flooding. The first major mechanism is flood-dominant tidal asymmetry, which transports suspended sediment landward into the Cache Slough Complex from other areas. The second major mechanism is the formation of ETMs or TMs. In the Cache Slough Complex, both processes are important, and suspended sediments transported into the Cache Slough Complex tend to concentrate in several TMs in regions characterized by LE ratios<1 (red ovals figs. 13, 28). Management actions to create or enhance TMs might create additional high-turbidity habitat suitable for native fishes, including delta smelt. The hydrodynamic conditions creating TMs can also concentrate phytoplankton and organic matter that can be important ecologically. These concepts are discussed in the following sections in terms of the LE ratio and exchange zones.
-
3. Studies of the feasibility of supplementing the Delta sediment supply to increase Delta turbidities have been proposed (U.S. Fish and Wildlife Service, 2019) with the intention of increasing turbidities for delta smelt. Our results indicate several factors to consider as part of these assessments, including tidal dispersion, wind resuspension, transport of suspended sediment by tidal currents, and formation of ETMs and TMs. Additions of sediment would have to be carefully planned so that suspended-sediment concentrations reached the desired turbidity levels throughout the desired area. Sediment additions that are coordinated with management actions to create or enhance TMs might be particularly effective.
Local Scale
Our local-scale sediment studies focused on Little Holland Tract because its relatively intact levees facilitated study of whether Little Holland Tract is a source of turbidity to the Cache Slough Complex and might contribute to higher turbidities favored by delta smelt. Wind-wave resuspension of fine sediments can substantially increase suspended sediment to the Delta and Suisun Bay during the summer and fall. Therefore, our studies as part of the physics to fish project focused on the variables that can affect fine sediment resuspension, including sediment-particle size, wind, waves, water depth, and hydrodynamics of Little Holland Tract and connecting water bodies, particularly Liberty Island (see fig. 30 for station locations in Little Holland Tract and Liberty Island; for additional metadata, see Lacy and others [2016]).
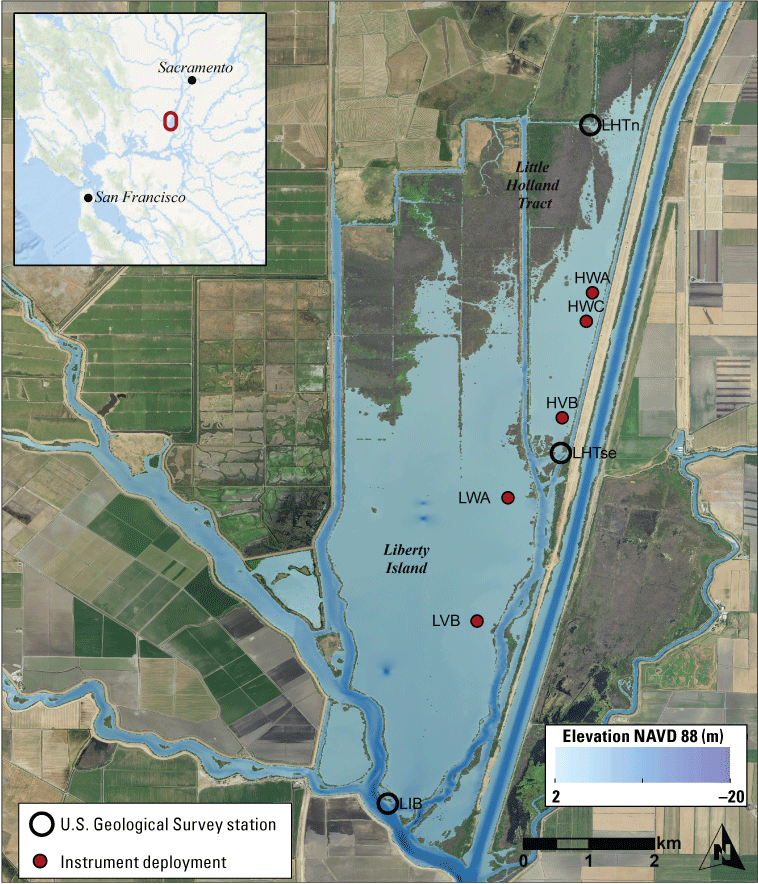
Physics to fish monitoring stations used to understand suspended-sediment dynamics of Little Holland Tract (Little Holland Tract at North Breach near Courtland; LHTn; U.S. Geological Survey station 11455143, Prospect Slough at Toe Drain near Courtland; LHTse; U.S. Geological Survey station 11455167), Liberty Island (Cache Slough at South Liberty Island near Rio Vista; LIB; U.S. Geological Survey station 11455315), and connecting channels in the Sacramento–San Joaquin Delta. Elevation data are presented in meters (m) and are referenced to the North American Vertical Datum of 1988 (NAVD 88). Station information is provided in table 1 for the breach sites, and in Lacy and others (2016) for the stations inside Little Holland Tract and Liberty Island. All data from U.S. Geological Survey (2022).
The basic approach was to deploy sensors to measure hydrodynamics and water-quality parameters (water level, current velocity, turbidity, temperature, and conductivity) at selected stations in Little Holland Tract and Liberty Island (fig. 30) in combination with monitoring stations established at breaches between Little Holland Tract, Liberty Island, and other water bodies (fig. 30; table 1) as part of the overall station network. Data were collected at stations within Little Holland Tract and Liberty Island during the 27-month period from August 2015 to October 2017 (Lacy and others, 2016). We focused on data from two stations in Little Holland Tract: HVB and HWC (table 1; fig. 6); HWA (table 1; fig. 6) and HWC were at similar depths and are exposed to similar hydrographic conditions; because of data availability and station proximity, we treated HWA and HWC as coincident data, and hereafter refer to that combined dataset as “HWC.” Data for wind speed and wind direction were acquired from hourly records at Travis Air Force Base (Iowa State University, 2018), approximately 23 km west of Little Holland Tract. The topography between Travis Air Force Base and Little Holland Tract is mostly flat, so we assumed winds there would reasonably reflect wind conditions at Little Holland Tract. Sediment cores were repeatedly collected at the stations inside Little Holland Tract and Liberty Island to characterize the bed-sediment properties. Cores were obtained by manually pushing a 4.45-cm diameter plastic tube approximately 10 cm into the bed sediment.
Maintaining summer-fall turbidity from resuspended fine sediment requires a consistent supply of erodible sediment containing appropriately sized particles. Surficial sediments from push cores collected in Little Holland Tract and Liberty Island were characterized by a bimodal grain size distribution with peaks in fine sediments (<63 micrometers [µm]) and sand (between 63 µm and 2 millimeters [mm]; fig. 31). The relative magnitudes of these two size fractions varied greatly throughout the five years sampled; however, the persistence of fine sediments indicates that erodible sediments are always available.
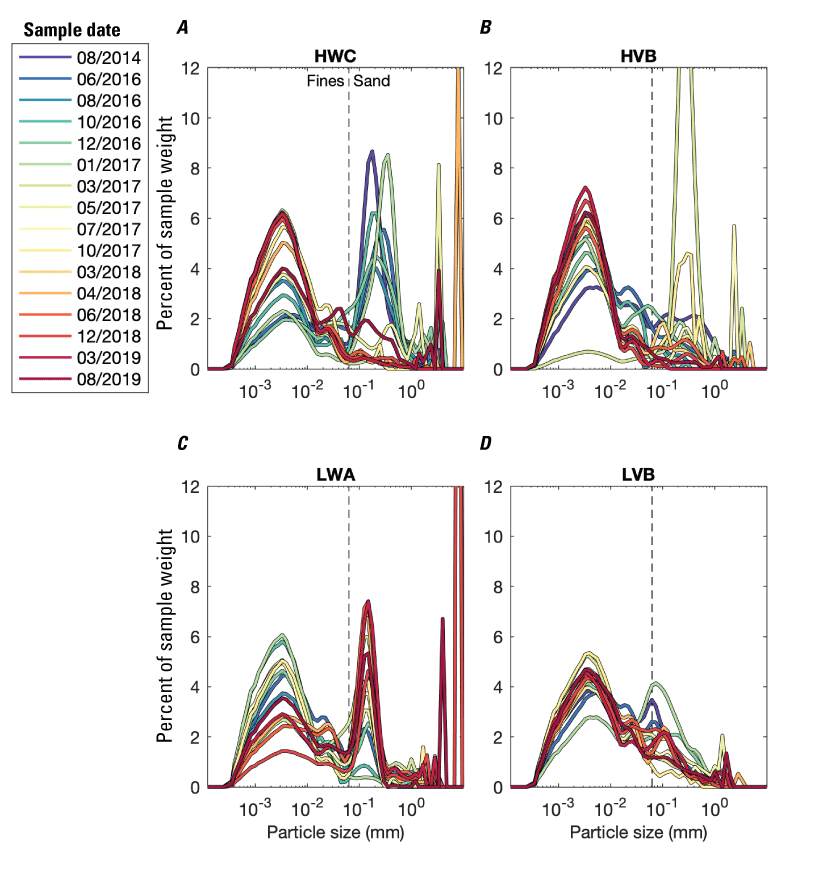
Particle-size distributions in millimeters (mm) of surficial bed-sediment samples collected at four stations (table 1; fig. 6) from August 2014 to August 2019: A, HWC; B, HVB; C, LWA; D, LVB. Data available in Lacy and others (2016).
Local winds showed a seasonal pattern. During the winter, wind direction was variable, with frequent events from the northerly quadrants (fig. 32). Wind was stronger and more consistently from the southwest during the summer period, with fewer northerly events. Sustained high wind speeds corresponded with peaks in tidally averaged wave height. The increase in average wind speed and southwesterly origin in the summer, which aligns with increased wind fetch in Little Holland Tract, corresponded with an overall increase in wave activity, water level, and SSC in Little Holland Tract.
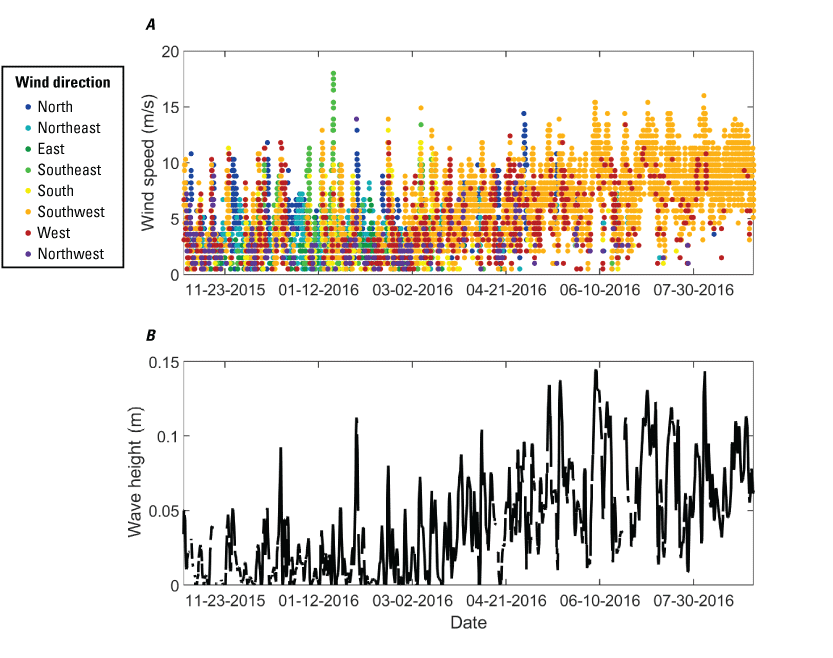
A, wind speed (in meters per second [m/s]) and direction from Travis Air Force Base (Iowa State University, 2018) and B, tidally averaged wave height (in meters [m]) at station HWC (see map fig. 30 and table 1 for station information). Data for HWC are published in Lacy and others (2016).
Suspended-sediment concentrations were usually higher inside Little Holland Tract than Liberty Island likely because of greater water depths in Liberty Island, as bed shear stress due to waves is inversely related to water depth. When averaged throughout multiple tidal cycles, elevated SSC values were correlated with periods of lower water depths and prolonged wind-wave events. Average SSC was greater inside Little Holland Tract than at the breaches, greater at HWC than at HVB, and greater at the LHTse breach than the LHTn breach (see fig. 30 for station locations and table 1 for additional station information). Suspended-sediment concentrations were greater in summer than winter at all stations with data from both periods (table 3). Station HWC is closer to the northern, shallow part of Little Holland Tract and is more affected by wave-driven resuspension than station HVB, where mean water depth is greater. Suspended-sediment concentration in Little Holland Tract varied on the tidal timescale, with higher SSC values at either maximum ebb current (HVB) or at low tide (HWC).
Table 3.
Average suspended-sediment concentrations (SSC) for the combined winter (September 1, 2015, to March 12, 2016) and summer (April 1 to September 1, 2016) periods for stations in the Cache Slough Complex (see figure 30 for station locations and table 1 for additional station information).[Data for HWC, HVB, LWA, and LVB are published in Lacy and others (2016). Data for Little Holland Tract at North Breach near Courtland (LHTn; U.S. Geological Survey station 11455143) and Prospect Slough at Toe Drain near Courtland (LHTse; U.S. Geological Survey station 11455167) are published in U.S. Geological Survey (2022). Abbreviation: SD, standard deviation]
We evaluated the factors potentially driving SSC in Little Holland Tract by comparing regression models incorporating a variety of factors thought to be important in sediment resuspension. The results indicated that a model incorporating depth, tide (a factor indicating flood or ebb direction), and bed shear stress caused by waves (τw) had strong statistical support compared to other models (Lacy and others, 2023). Simply, τw represents the force exerted by waves on the substrate, which can mobilize and resuspend sediment. Increased SSC was inversely correlated with depth and directly related to τw. As single factors, wave shear stress explained the most variance in the data, and depth accounted for almost as much variance. These two factors are largely independent. Waves of a given height and period have greater effect on the bed in shallower water, but that effect is accounted for by using wave shear stress rather than wave height as a factor. We attribute the improvement in predictive capability from the inclusion of depth as a factor to the reduction in water volume available for vertical mixing in low-water depths (MacVean and Lacy, 2014). As a result, for a given mass of eroded sediment, SSC is greater at low tide than high tide.
To better understand the processes generating the seasonal difference in SSC (table 3), we compared “winter” to “summer,” using a mid-March 2016 high-flow event through Yolo By-Pass as our breakpoint between seasons (fig. 33). Most of the water and sediment flux to Little Holland Tract passes through the large breach at the southern end (LHTse in fig. 30). The direction and magnitude of tidally averaged water discharge and suspended-sediment flux (SSF) at LHTse fluctuated with freshwater inflow and wind events (fig. 33). Tidally averaged water discharge through LHTse and LHTn does not sum to zero throughout diurnal or longer timescales (fig. 33), indicating that flow through the numerous small levee breaches is a detectable part of the water balance and may be important to the sediment balance as well. Nevertheless, the mechanisms of seasonal and event-scale SSF through these two breaches can be used to identify conditions conducive to sediment export and import.
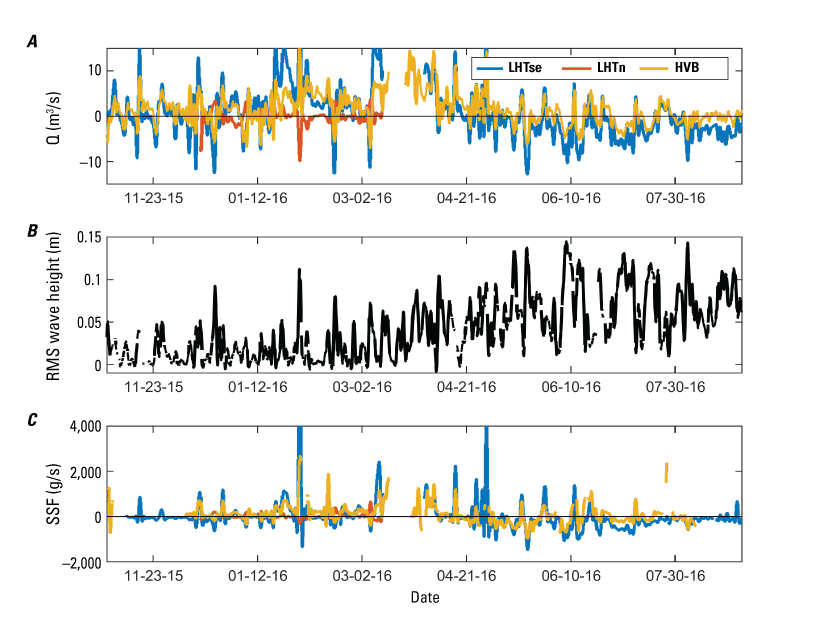
A, tidally averaged discharge (Q), in cubic meters per second (m3/s) at stations LHTse (Prospect Slough at Toe Drain near Courtland; U.S. Geological Survey station 11455167), HVB, and LHTn (Little Holland Tract at North Breach near Courtland; U.S. Geological Survey station 11455143) and in Little Holland Tract; B, root-mean-square (RMS) wave height at HWC, in meters (m); and C, suspended-sediment flux (SSF) in grams per second (g/s) at stations in Little Holland Tract. Suspended-sediment flux data were computed by multiplying suspended-sediment concentration by flow U.S. Geological Survey (2022). Positive values in parts A and C indicate ebb-directed flux out of Little Holland Tract. Data for U.S. Geological Survey stations LHTse (11455167) and LHTn (11455143) are available in U.S. Geological Survey (2022); data from HWC are in Lacy and others (2016). For station locations see figure 30, table 1, and Lacy and others (2016). Winter is defined as values to the left of the mid-March break in values with summer values to the right of the break.
In winter, cumulative suspended-sediment flux (SSF) was positive (export) at the LHTse and LHTn breaches (fig. 34A–B; approximately 1,500 metric tons [t] and 165 t, respectively). Cumulative SSF was primarily advective at the LHTse breach during the winter period, driven by net seaward water discharge (fig. 33). The positive advective SSF was somewhat offset by a negative dispersive component (650 t). At the LHTn breach, cumulative advective and dispersive SSF were positive by the end of the winter period, although there were periods of negative SSF (import) for both components. Unlike at LHTse, cumulative dispersive SSF at LHTn was nearly double advection (165 t total, 66 t advective, and 104 t dispersive).
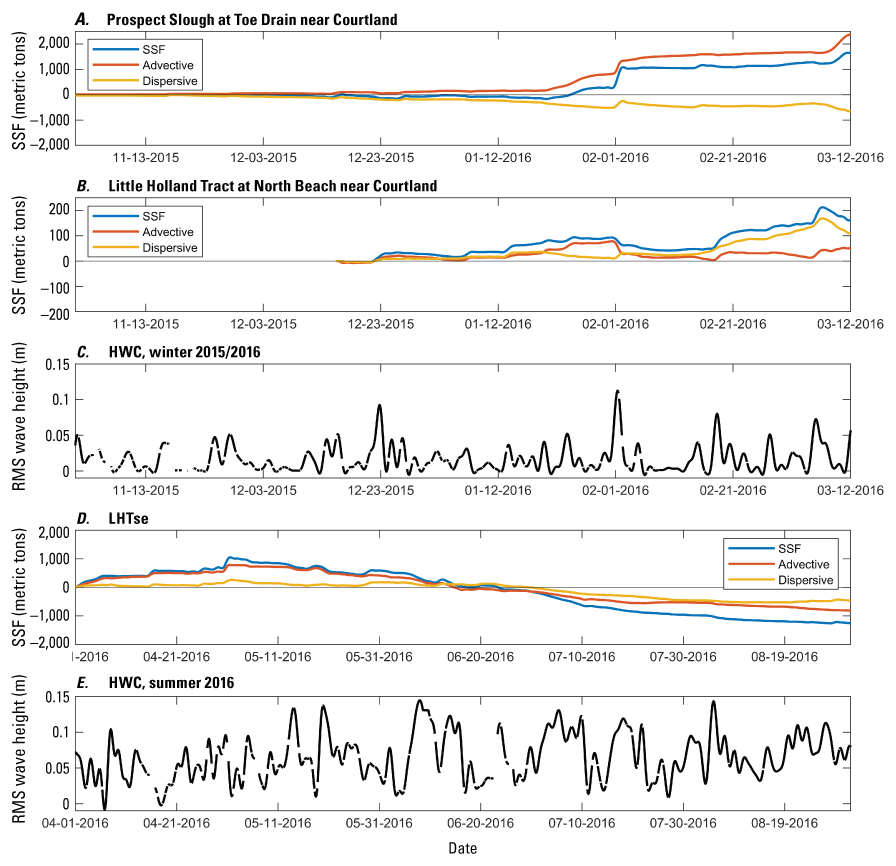
Cumulative suspended-sediment flux (SSF), including total, advective and dispersive components for A, for Prospect Slough at Toe Drain near Courtland (LHTse; U.S. Geological Survey station 11455167) in winter 2015/2016; B, Little Holland Tract at North Breach near Courtland (LHTn; U.S. Geological Survey station 11455143) in winter 2015/2016; and D, station LHTse in summer 2016 (U.S. Geological Survey, 2022). Suspended-sediment flux data were computed by multiplying suspended-sediment concentration by flow U.S. Geological Survey (2022). Root-mean-square (RMS) wave height at station HWC in C, winter 2015/2016; and E, summer 2016, calculated from data published in Lacy and others (2016). The SSF results were not available for LHTn for summer. Station information is available in table 1.
In summer, cumulative SSF at the southeast breach (LHTse) was negative (import; −1,220 t; fig. 34D). Advective and dispersive components of SSF were negative and dominated by advective SSF similar to winter SSF. The negative cumulative SSF is consistent with the landward sediment-transport pattern that has been observed throughout the Cache Slough Complex in dry conditions and is described in the “Regional Scale” subsection of the “Sediment” section (Morgan-King and Schoellhamer, 2013). The change in slope in cumulative SSF at the beginning of May 2016 indicated a shift from positive to negative SSF and coincided with the onset of greater wave heights, indicating that increased wave activity in summer reduces rather than increases sediment export (fig. 34D–E). The SSF data were not available at LHTn breach during the summer period.
In winter, the cumulative SSF was dominated by short pulses (February 1; fig. 34A–C). The winter pulses coincided with northerly winds and positive tidally averaged discharge (figs. 34, 35) and resulted from the combination of wave-driven resuspension and downwind flow. The infrequent northerly winds of summer also produce peaks in SSF export from the LHTse breach (fig. 35). However, the predominantly southerly winds in summer push water and suspended sediment into Little Holland Tract while wave heights and SSC increase, producing negative SSF and increasing the tidally averaged water level. When the wind speed decreases, turbid water recedes through the LHTse breach, resulting in positive SSF, but because the water export is later than the maximum wave-driven SSC, the net SSF during these summer wind events is frequently negative (import to Little Holland Tract; fig. 35). Greater wave activity in summer increases turbidity in Little Holland Tract, but the lack of downwind breaches minimizes flux of SSC out of Little Holland Tract.
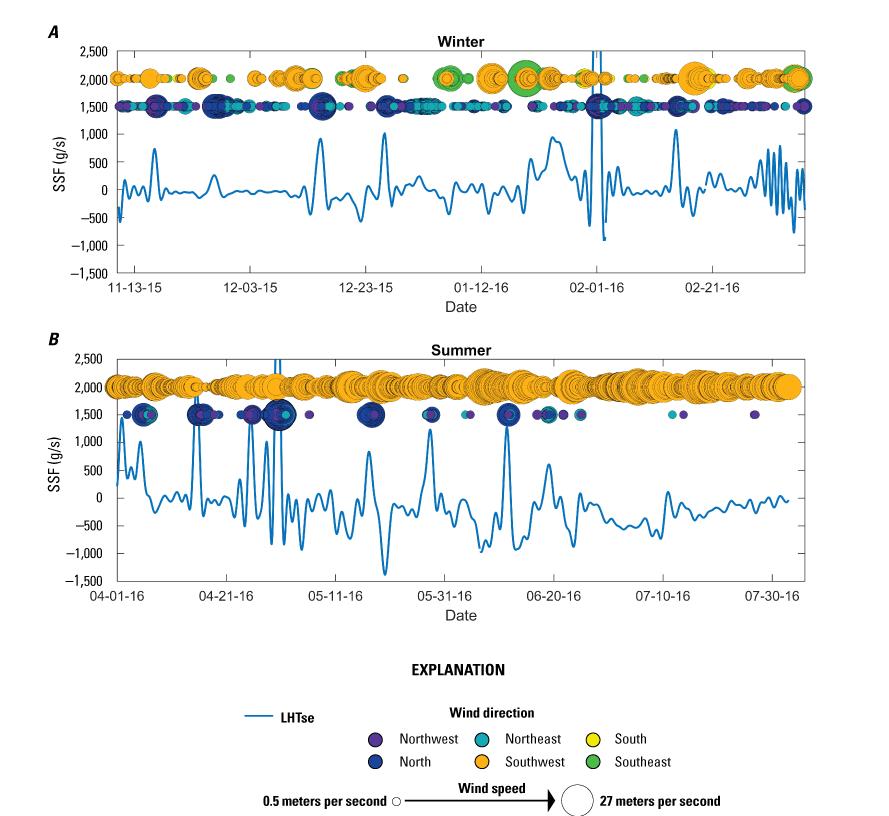
Tidally averaged suspended-sediment flux (SSF) in grams per second (g/s) at the southeast breach (Little Holland Tract at North Breach near Courtland [LHTse]; U.S. Geological Survey station 11455143) of Little Holland Tract and wind statistics for the A, winter and B, summer periods. Suspended-sediment flux data were computed by multiplying suspended-sediment concentration by flow (U.S. Geological Survey, 2022). Wind is symbolized as points scaled to wind speed and colored by wind direction: northwest (NW; purple), north (N; blue), northeast (NE; blue-green), southwest (SW; orange), south (S; yellow), or southeast (SE; green). Northerly winds (cool colors) coincided with SSF export. Positive suspended-sediment flux is ebb directed; negative suspended-sediment flux is flood-directed. Data for station LHTse are in U.S. Geological Survey (2022); wind data are published by Iowa State University (2018).
Sediment Management Implications at the Local Scale
Our local-level studies of sediment processes in Little Holland Tract show that SSC, turbidity, and suspended-sediment flux depend on interactions of wind, water depth, tidal currents, regional-scale hydrodynamics, sediment supply, and basin orientation on a seasonal and annual basis. In summer and fall, Little Holland Tract was more turbid (SSC was higher) than surrounding waters in the summer and fall. Despite the greater turbidity, Little Holland Tract did not consistently export SSC through the largest breach at the southern end, but export from Little Holland Tract increased turbidity in the Toe Drain and the stairsteps, as described in the “Regional Scale” subsection of the “Sediment” section. At the site level, there may be ways to engineer Little Holland Tract to export SSC to surrounding waters more readily. For example, large breaches at the northern end of basins could be positioned to be downwind in summer. Accounting for water volume within specific geographic regions when planning activities to engineer channels could be helpful because larger tracts on the scale of Liberty Island have more potential to affect surrounding waters than smaller tracts like Little Holland Tract.
Wind waves create turbidity in flooded islands in part because of their ability to accumulate fine sediments that remain available for resuspension. The presence of submerged aquatic vegetation (SAV), which is widespread in Delta shallows (Hestir and others, 2016), can interfere with wind-wave processes because the canopy of the vegetation reduces water velocities, allowing sediment particles to settle in the bed of SAV. Sediment in the SAV beds is no longer available for resuspension because the SAV reduces current velocity and wave energy (Madsen and others, 2001). As a result, vegetation increases sediment retention through particle settling and trapping and reduces wave-driven sediment resuspension. Thus, SAV removal might increase the potential for sediment resuspension in some situations; however, increased export of sediment from a region to increase turbidity in nearby areas and improve habitat for native species of concern reduces the pool of sediment available to be resuspended. Therefore, managers would likely need to contrast the benefit of increasing sediment export to surrounding waters against maintaining a sufficient pool of erodible sediments so that such increases are sustainable over an appropriate period. In situations where the existing fine sediment pool is not adequate or is too compacted to support summer resuspension and export, the addition of sediment might be considered.
If locations with the physical characteristics necessary to support wind-wave resuspension and subsequent export can be identified, or if sites can be engineered to have those characteristics, then tidal wetland or sediment-specific projects could be designed to increase turbidity in a local area to enhance habitat conditions for species of concern. If multiple sites can be identified in a region, then the cumulative effects of multiple projects could be considered on the regional level.
Finally, the results from our studies discussed in this report have shown the importance of carefully placed monitoring stations for tracking and understanding local-level sediment dynamics. Similar monitoring will be needed to assess the success of the types of management strategies and actions discussed here and to provide the information to adapt management strategies to increase their effectiveness.
Nutrients and Phytoplankton
The dynamics of nutrients, phytoplankton, and most other water-quality parameters in the Delta are regulated by the physical processes discussed earlier and by chemical and biological processes. As a result, many constituents, such as chlorophyll (a surrogate for phytoplankton biomass), nitrogen, phosphorous, dissolved oxygen (DO), and dissolved organic matter (DOM) are non-conservative, meaning they can be produced or consumed (phytoplankton growth), change chemical form (conversion of ammonium to nitrate via nitrification), and be exchanged with or lost to environmental reservoirs such as biota, sediments, or the atmosphere. Physical, chemical, and biological processes interact in different ways and to different extents across spatial and temporal scales, leading to complex patterns of variation through space and time (Dugdale and others, 2007; Durand, 2015; Dahm and others, 2016; Kraus and others, 2017a).
All organisms need nutrients like nitrogen and phosphorous for growth, but when present in excess in aquatic ecosystems, nutrients can greatly degrade water and habitat quality. Although much of the San Francisco Estuary is considered nutrient-enriched, classic eutrophication symptoms, such as nuisance phytoplankton blooms and hypoxia, are not widely observed but do happen in parts of the system (Cloern, 2001; Cloern and Jassby, 2010; Kimmerer and Thompson, 2014; Cloern and others, 2020). For example, harmful cyanobacteria blooms, particularly Microcystis aeruginosa, are becoming common in the central and south Delta (Lehman and others, 2005, 2017). Moreover, in parts of the Delta, nutrients are reported in concentrations limiting to phytoplankton growth (Downing and others, 2016; Stumpner and others, 2020a). Pelagic primary production by phytoplankton supports pelagic fishes such as delta smelt, but phytoplankton abundance has been declining during recent decades in the Delta (Jassby, 2008; Dahm and others, 2016), and the San Francisco Estuary has now been considered food-limited because of low phytoplankton production (Jassby, 2008; Brown and others, 2016).
Because of the complex relations among nutrients and the quality of aquatic ecosystems, high nutrient loading from anthropogenic sources is a concern to resource managers and policymakers in the Delta and elsewhere (Cloern and others, 2020). For example, elevated nutrients have been linked to (1) the growth of harmful phytoplankton, particularly toxin-producing cyanobacteria, such as Microcystis aeruginosa (Lehman and others, 2005, 2017); (2) the spread of invasive aquatic vegetation, which traps sediment, and provides habitat for introduced predator fish species (Boyer and Sutula, 2015; Dahm and others, 2016; Ta and others, 2017); and (3) changes in phytoplankton abundance and species composition that have negative effects on the pelagic food web (Lehman, 2000; Jassby and others, 2002; Kimmerer, 2005; Sommer and others, 2007).
According to some authors, wastewater-derived ammonium-N inhibits phytoplankton productivity that leads to lower abundances and a shift in community composition (Dugdale and others, 2007; Glibert, 2010; Parker and others, 2012). Results from these laboratory studies indicate that ammonium can adversely affect production of diatoms—a high-quality food source for the base of Delta pelagic aquatic food webs; however, the importance of this inhibition in the Delta has been debated (Senn and Novick, 2014; Novick and others, 2015; Cooke and others, 2018), and evidence to indicate that these effects are sufficiently large to affect patterns of productivity at the regional and landscape scales are not available (Kraus and others, 2017b; Stumpner and others, 2020b). The transport, transformation, and mixing of wastewater-derived ammonium and nitrate are discussed in subsequent paragraphs.
The amount and form of nutrients present in Delta waters at a particular time and location is related to their source and the biological processing that happens during transit (fig. 36; Downing and others, 2016; Kraus and others, 2017c). On an annual basis, the greatest loading of nutrients to the Delta is from landscape runoff during winter storms, which carries atmospherically deposited material as well as agricultural and urban runoff into local rivers (Schlegel and Domagalski, 2015). During most of the year, however, the amounts and forms of nutrients in the Delta are primarily determined by the balance between river flows, which can vary from year to year, and wastewater discharge, which is relatively constant (Dahm and others, 2016).
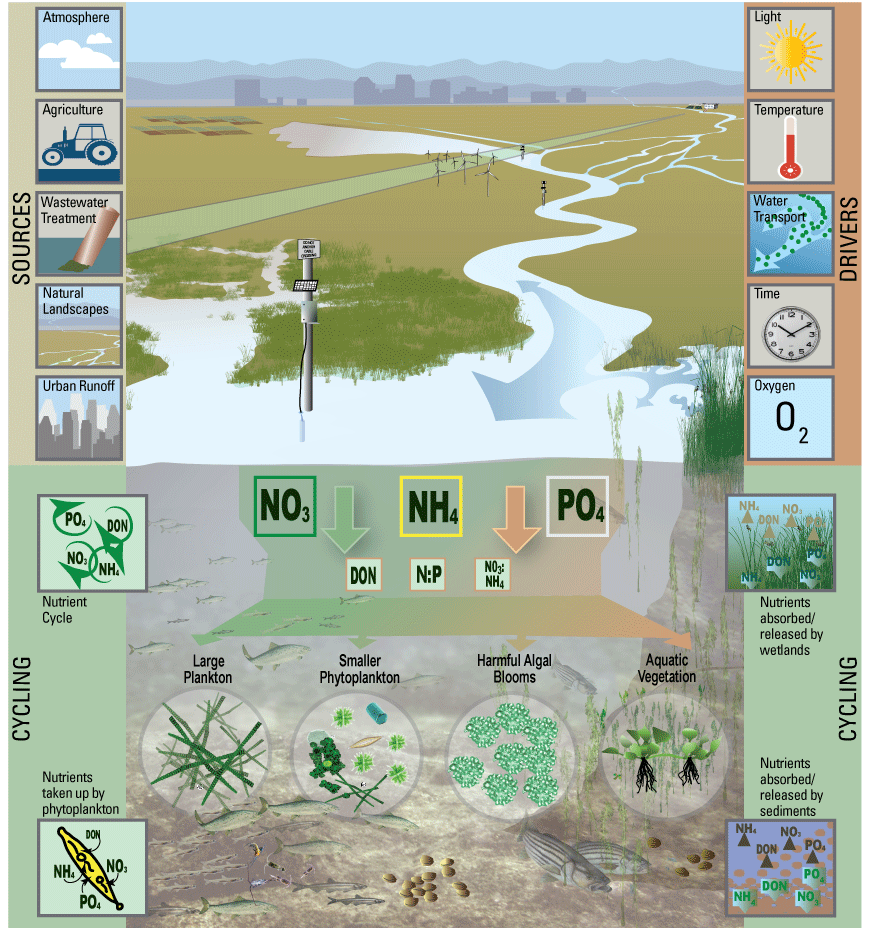
Key factors that determine nutrient concentrations, forms and ratios and shape phytoplankton abundance and community composition. Sources of nutrients include natural landscapes, wastewater treatment plants, agricultural inputs, urban runoff, and atmospheric deposition (Dugdale and others, 2007; Glibert, 2010; Parker and others, 2012; Domagalski and Saleh, 2015; Schlegel and Domagalski, 2015). Key drivers of nutrient cycling that act on a parcel of water making its way through the Delta’s aquatic environments include hydrodynamics, temperature, light, dissolved oxygen, and water-residence time (Lopez and others, 2006; Lucas and Thompson, 2012; Downing and others, 2016). During transport, nutrients can be transformed (nitrification, mineralization, denitrification) and can be taken up and released by biota (phytoplankton, aquatic vegetation, microbes) and can be exchange with the benthos (Parker and others, 2012; Cornwell and others, 2014; Kraus and others, 2017a; Stumpner and others, 2020b). Abbreviations: NO3, nitrate; NH4, ammonium; PO4, phosphate; DON, dissolved organic nitrogen.
During transport through the Delta, substantial amounts of wastewater-derived nutrients are lost or transformed through processes that are currently poorly understood (Novick and others, 2015). A variety of processes may be involved (fig. 36). For example, ammonium (NH4) is rapidly transformed to nitrate (NO3) during transit (Kraus and others, 2017b). Numerous other processes may be involved such as the loss of nitrate to the atmosphere through denitrification, uptake by phytoplankton, and uptake by wetland plant (Novick and others, 2015).
The extent of alteration to nutrients during passage through the Delta is directly related to the hydrodynamic and transport processes described earlier (see “Hydrodynamics” section) because the landscape-scale hydrodynamics determine the amount of time during which reactions can happen, the transport route and thus the landscapes the water interacts with, and various related physical factors such as water temperature, light, and the solubility of oxygen. At the landscape scale, the distribution of nutrients across the Delta is controlled by physical transport (advection and dispersion) interacting with a host of transformation and loss processes.
Phytoplankton abundance, species composition, and growth are also affected by many of the same transport-related factors that affect nutrient concentrations (fig. 36). Phytoplankton need light to grow, and their growth is regulated by physical processes such as transport, mixing, dilution, turbulence, and inter-related physical attributes such as residence time, temperature, depth, and fetch (Lopez and others, 2006). These same processes and habitat attributes affect phytoplankton loss rates to grazing by clams and zooplankton (Lucas and Thompson, 2012). Furthermore, at the landscape scale, these same processes move populations of phytoplankton into areas more or less favorable to production, affecting the rates of nutrient uptake and transformation, system-wide productivity, and concomitant availability of phytoplankton to zooplankton.
Regional-scale processes that affect nutrient and phytoplankton concentrations are also largely controlled by hydrodynamic and transport processes that determine residence time, which determines the cumulative magnitude of the processes taking place in that area. For example, interaction with wetlands can result in net loss of nutrients to various nutrient sinks, such as sediments, phytoplankton, or vascular plants, with total loss determined by the cumulative time the water resides in the wetland (Cornwell and others, 2014; Downing and others, 2016).
At the local scale, hydrodynamic and transport processes determine the interactions between water-column processes, landscape features, and bathymetry. For example, local hydrodynamic processes affect vertical mixing, which determines whether phytoplankton can remain suspended in the surface layer where light is sufficient to support photosynthesis (photic zone) and phytoplankton growth.
Landscape Scale
At the landscape scale, the Sacramento and San Joaquin Rivers deliver the largest loads of nutrients to the Delta. Agricultural sources from the rivers are dominant in the winter, and municipal wastewater discharges are dominant during lower-flow periods (Kratzer and others, 2011). Annually, municipal-wastewater discharges account for approximately 25 percent of the annual total nitrogen (N) and 20 percent of the total phosphorous loads to the Delta (Domagalski and Saleh, 2015; Saleh and Domagalski, 2015). Prior to 2020, the Sacramento Regional Wastewater Treatment Plant (WWTP; fig. 37) accounted for approximately 90 percent of the annual ammonia-N loading to the northern Delta (Jassby, 2008). Although smaller in total discharge volume, the Central San WWTP near Martinez, Calif. (fig. 37), contributes substantial amounts of nutrients directly to Suisun Bay, with N discharged primarily as ammonium (Senn and Novick, 2014).
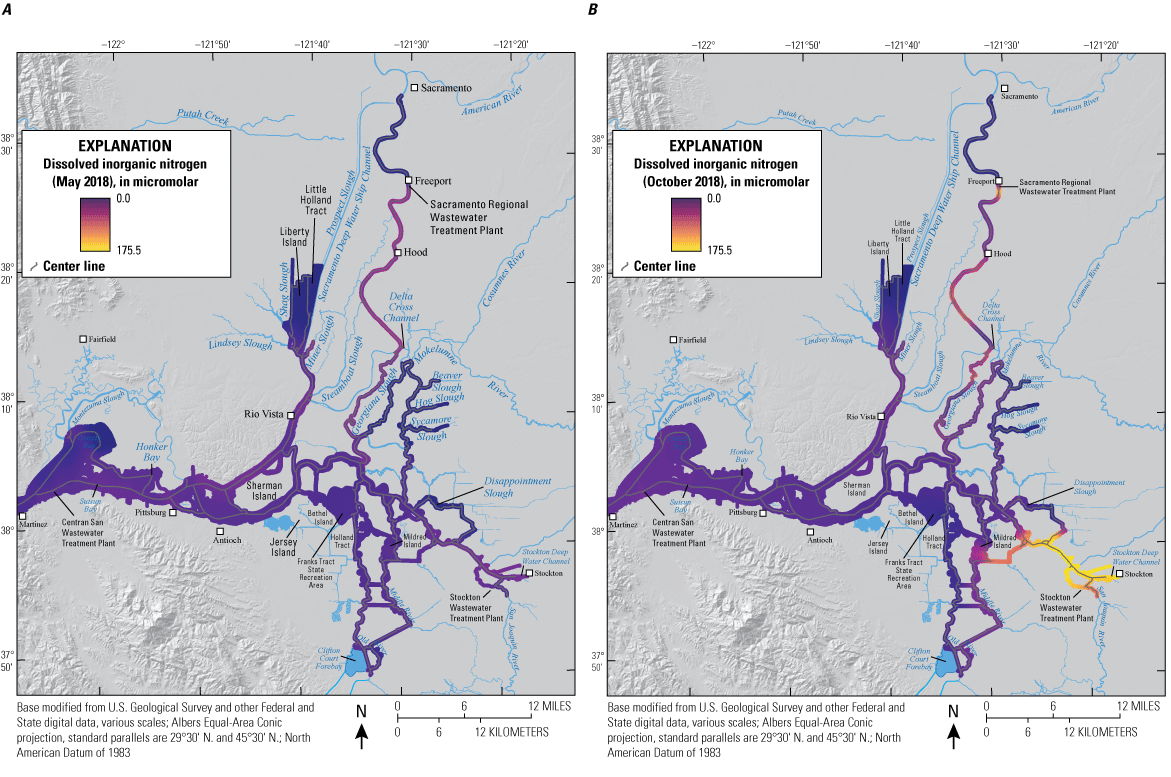
Examples of dissolved inorganic nitrogen sources and variability (as micromolar, µM) observed during A, May 2018 and B, low-flow conditions in October 2018; higher dissolved inorganic nitrogen concentrations are observed during low-flow conditions (Bergamaschi and others, 2020).
Differences in sources and seasonal inflows result in distinctly different nutrient concentrations (mass of nutrient per unit volume of water) entering the Delta during high- and low-flow periods. These differences are accentuated during transport through the Delta and estuary because of seasonal and interannual differences in transport times, temperature, solar radiation, and turbidity, resulting in very different nutrient distributions between high- and low-flow periods. During higher winter flows, opportunities for biological interactions are limited by the short transport times, lower temperatures, high turbidities, and concomitantly low light levels, resulting in more homogeneous nutrient concentrations. In contrast, there are greater opportunities for nutrient transformation during lower summer flows when there are longer transport times, higher temperatures, lower turbidities, and higher light levels, resulting in more heterogeneous distributions and sharp gradients in nutrient concentrations. During low-flow periods, our data show persistent gradients in nutrients that radiate from the main point sources in the Sacramento River near Freeport (Sacramento Regional WWTP), the San Joaquin River near Stockton (Stockton WWTP), and Suisun Bay near Martinez (Central San WWTP), with slow transport carrying nutrients generally seaward as well as to other regions of the Delta (fig. 37).
These distinct high-flow and low-flow processes inhibit a strong relation between concentration (C) and discharge (Q) (C:Q) in major Delta channels (fig. 38), precluding use of the common approach of modeling nutrient loads throughout the year using discharge alone (Pellerin and others, 2009). As a result, continuous high-frequency measurements of flow and concentration are needed for load estimation, particularly at shorter timescales (Pellerin and others, 2014).
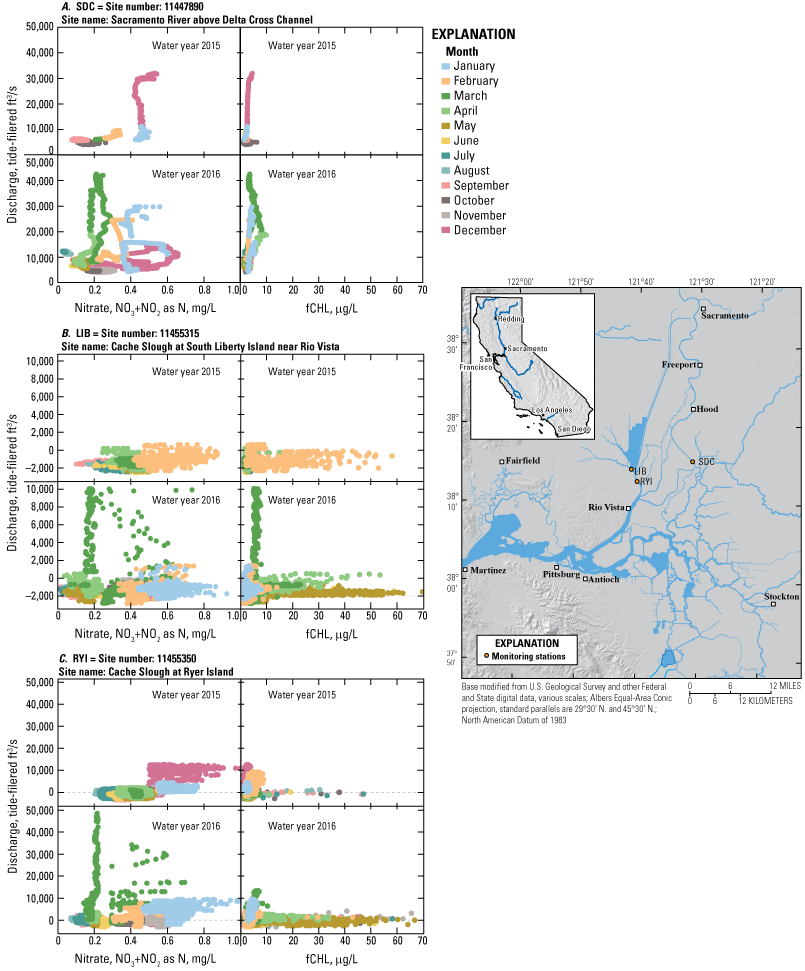
Concentration-discharge (C:Q) relations for nitrate and chlorophyll fluorescence on the A, Sacramento River above Delta Cross Channel (SDC; California Department of Water Resources, 2022; U.S. Geological Survey station 11447890); B, Cache Slough at South Liberty Island near Rio Vista (LIB; California Department of Water Resources, 2022; U.S. Geological Survey station 11455315); and C, Cache Slough at Ryer Island (RYI; California Department of Water Resources, 2022; U.S. Geological Survey station 11455350). Data are plotted by water year (WY) and colored by month. Concentrations of nitrate are provided in milligrams of N per liter (mg-N/L), and concentrations of chlorophyll fluorescence (fCHL) are provided in micrograms per liter (µg/L). Discharges are reported as the net, tidally filtered values in cubic feet per second (ft3/s). Additional station information is provided in table 1, and station locations are mapped in figure 6. All data are from U.S. Geological Survey (2022).
During low flows, transport times are sufficiently long, and environmental conditions (temperature, light) are favorable for nutrient uptake by phytoplankton and wetlands and for losses because of denitrification and other microbial processes, resulting in reduced total nutrient concentrations (Novick and others, 2015). Conversely, nitrate concentrations can increase as water is transported across the Delta, the result of internal transformation of ammonium-N into nitrate-N by water-column and sediment microbes, increasing the concentration of nitrate-N in Delta waters as it moves seaward (Dahm and others, 2016; Kraus and others, 2017c). The distribution of nutrients in the Delta varies with water year and is largely driven by variations in inflow of the Sacramento and San Joaquin Rivers and exports from the C.W. “Bill” Jones and Harvey O. Banks Pumping Plants. For example, during water year 2018, dissolved inorganic nitrogen concentrations were consistently lower during higher-flow conditions (May) relative to low-flow conditions (October; fig. 37).
Management Implications
Source control provides the greatest opportunity for managing nutrients in the Delta. The greatest concerns about elevated nutrient concentrations are during low flows in summer and fall, when harmful algal blooms may develop or decaying phytoplankton biomass may lead to low dissolved oxygen, which corresponds to the time when wastewater discharge dominates loading to the Delta. Modifications to treatment plants can reduce loading at a relatively high cost, as demonstrated by the Sacramento Regional Wastewater Treatment Plant upgrade implemented in 2021. That upgrade reduced effluent nitrogen loading to the Sacramento River by approximately 60 percent compared to those prior to the upgrade. However, the ecological effects of this change remain unknown.
Beyond source control, the potential for mitigating adverse landscape-scale effects of excess nutrients associated with low flows seems limited, with increasing net transport through the Delta the most viable option; however, this strategy would likely require a large volume of water. New or existing control structures could be used to change routing of nutrient-rich waters to regions with internal processes most able to mitigate effects or to ensure that nutrients do not accumulate to levels higher than the assimilative capacity of the regional and local habitats.
Some level of nutrient input to the Delta is needed to support aquatic food webs; however, we do not yet have sufficient understanding to predict the outcomes of increasing or decreasing nutrient loading to the system. In the current nutrient loading regime, high nutrient demand coupled with longer residence times can potentially limit phytoplankton growth in some areas such as dead-end sloughs, shallow wetlands, and areas with dense aquatic vegetation.
Locating future large-scale tidal wetland restorations that could exchange with water bodies of equal or greater volume may be an option to better manage nutrients and phytoplankton (Cloern, 2007). The principles of adaptive management could improve responsiveness when applying these kinds of large-scale changes. In some regions, longer residence times may allow sufficient time for beneficial phytoplankton biomass to accumulate and increase food supply to the pelagic food web, but in other regions, longer residence times may lead to the formation of harmful algal blooms if sufficient nutrient loads and high temperatures persist in a particular reach.
Regional Scale
The interactions among hydrodynamic processes, nutrient supplies, and phytoplankton productivity are most apparent at the regional level. Transport timescales across many regions of the Delta are on the order of 1 to 2 weeks, which is long enough to allow phytoplankton production to take place in a specific region based on population growth rates of the phytoplankton taxa thought to be necessary to support Delta food webs (days; Lopez and others, 2006; Lucas and Thompson, 2012). Also, regional processes include consideration of important attributes such as wetland density, connectivity, tidal-exchange volumes, variations in water depth, and the relation between channel length and exchange volume, which combine to determine water-residence time (also called water age), defined here as the average amount of time between when a parcel of water enters a region and when it is mixed or transported out of the region. Water-residence time is an extension of the concepts of transport discussed earlier in the “Hydrodynamics” section (figs. 13, 14).
Ambient Conditions
Residence time is a primary control on many biological processes in the Delta (Monsen and others, 2002; Cloern, 2007). Differences in residence time exist because some areas experience extensive exchange with nearby transport channels and thus have low effective residence time, while other areas are more detached, causing them to experience longer residence times (Downing and others, 2016), as discussed in the context of the LE ratio (Stumpner and others, 2021) in the “Hydrodynamics” section (figs. 13, 14). Increased residence times can produce strong gradients in a variety of water-quality parameters (fig. 39). However, the interactions among processes can be complex. For example, increased residence time may allow sediment particles to settle out of the water column (reducing turbidity), increasing the depth of the photic zone and allowing for increased production of phytoplankton (Lopez and others, 2006). However, increased residence time can also lead to increased grazing of phytoplankton and suspended particulate material by clams and zooplankton (Lucas and Thompson, 2012).
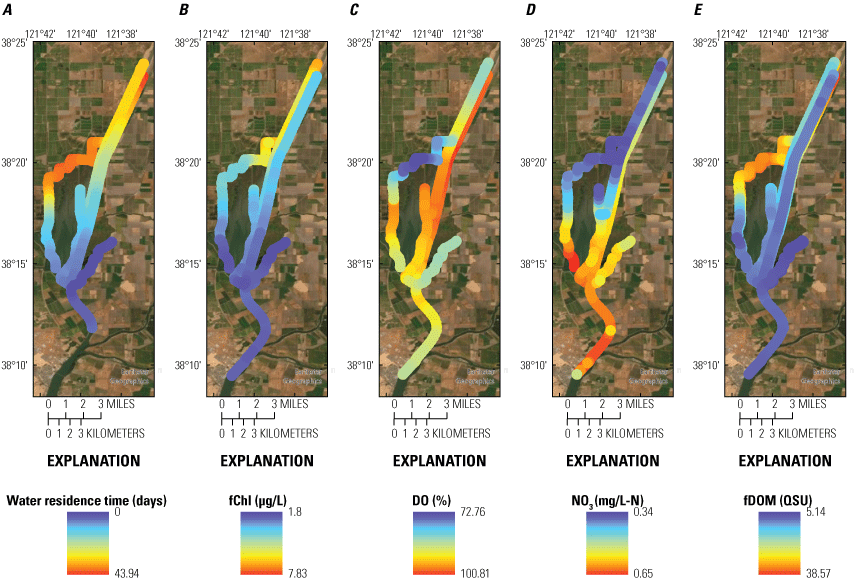
Gradients of A, water residence time (T, in days); B, chlorophyll fluorescence (fCHL in micrograms per liter [µg/L]); C, dissolved oxygen (DO) percent saturation (%), D, nitrate (NO3, in milligrams of nitrogen per liter [mg-N/L]); and E, fluorescent dissolved organic matter (fDOM, in quinine sulfate units [QSU]); for the Sacramento–San Joaquin Delta. Figure previously published by Downing and others (2016).
At longer residence times during normal low-flow periods, the biological processes that consume nutrients can reduce concentrations (fig. 39; Downing and others, 2016), at times to the point of limiting phytoplankton growth (Stumpner and others, 2020a). This situation commonly happens in the stairsteps of the Cache Slough Complex as well as the Sacramento River Deep Water Ship Channel, where residence times can extend to months (Downing and others, 2016). Stumpner and others (2020b) reported that residence time was the dominant environmental control on phytoplankton abundance and community composition in the Cache Slough Complex, including Shag Slough, Liberty Cut, and the open waters of Liberty Island because of the large number of dead-end sloughs and wetlands in this region with extensive areas of no or limited exchange with other channels (fig. 14).
Several biogeochemical processes converge in the vicinity of the “moderate-exchange zones” discussed in the “Hydrodynamics” section (figs. 14, 39; Downing and others, 2016; Stumpner and others, 2020b), with physical-mixing processes directly contributing to creation of particularly good habitat conditions in moderate-exchange zone regardless of where a zone was observed. These moderate-exchange zones supply the nutrients found in well-mixed channels to the nutrient-depleted zones with higher residence times and transport production back into the main channel. The moderate-exchange zones are characterized by strong gradients in nutrient concentration, elevated phytoplankton abundance, and evidence of increased nutrient utilization suggestive of a more productive system. As noted previously, these zones were commonly found in the dendritic historical Delta but have been largely eliminated by channelization. Additional studies would likely improve understanding about the convergence of physical dynamics and biogeochemical processes that combine to make these habitats particularly productive.
Phytoplankton Blooms
There is considerable interest in the physical and biogeochemical processes that lead to bloom formation and propagation in the Delta because of the current reliance of Delta pelagic aquatic food webs on phytoplankton productivity and the observed decadal declines in the frequency and intensity of phytoplankton blooms (a bloom corresponds to chlorophyll concentration>10 micrograms per liter (µg/L); Jassby, 2008; Glibert and others, 2014). Three distinct types of blooms were studied: (1) “productivity cascades,” where actively growing blooms are progressively expanded and transported by physical-mixing processes; (2) “transport blooms,” where the blooms form upstream and are transported through advection to the San Francisco Estuary; and (3) “confluence blooms,” which form in the area around the confluence of the Sacramento and San Joaquin Rivers and are tidally transported into the West Delta Tidally Forced Zone.
Productivity Cascades
Zones of higher residence times and their associated gradients are not static in space or time. Rather, they change continuously as flow and tidal conditions change (Stumpner and others, 2021). For example, spring-neap variation in the tides changes the location of the exchange zones and the extent of mixing. During neap tides, mixing is at a minimum because tides are relatively weak, and the LE ratio is at its minimum for a given channel. During spring tides, the LE ratio is at its maximum for a given channel, which favors exchange with connecting channels in a region. As a result, in dead-end channels throughout the Delta, zones with higher residence times are progressively connected to neighboring zones with lower residence times during the transition from neap to spring tides, which takes place approximately bi-weekly. All processes discussed in the “Hydrodynamics” section that led to changes in water height and tidal prism will have analogous effects, but the timescales of the effects are different.
One consequence of this progressive connection of longer residence time zones to neighboring ones with shorter residence times can be a “cascade” in phytoplankton productivity, where more abundant phytoplankton found in longer residence time zones forms a “seed population” that is transported to and mixed with larger zones that have somewhat lower residence times but higher nutrient concentrations. If the seed population has a sufficiently large initial growth rate, once it has access to the additional nutrients, it may quickly increase in biomass. Thus, stepwise increases in connectivity can allow phytoplankton blooms to expand progressively by permitting growth to accelerate in a compatible residence-time-zone, and then mixing it with neighboring zones before it depletes available nutrients or is cropped by zooplankton or clam grazing. This process may effectively increase productivity in a region, either by simple accumulation of biomass through multiple spring-neap cycles, or by eventual accumulation of sufficient biomass to create a self-sustaining bloom at the regional scale. Such a cascade could be driven, for example, by the neap-to-spring transition in tides or the seasonal changes in water height noted in the “Hydrodynamics” section.
Productivity cascades formed in the Cache Slough Complex associated with the multiple large diatom blooms that happened across the northern Delta in WY 2016. During these blooms, there were periods of highly elevated chlorophyll concentrations (>80 μg/L) observed in the lower Sacramento River near Rio Vista periodically (SDI; USGS station 11455508; table 1), beginning in April and with intermittent blooms extending through September. There was a distinct temporal progression for most of these bloom events, with elevated biomass appearing first in the Cache Slough Complex at Liberty Island (LIB; USGS station 11455315; see table 1 for additional station information), then sequentially appearing in lower Cache Slough (RYF; USGS station 11455385; table 1) and the lower Sacramento River (SRV and SDI; USGS stations 11455420 and 11455478, respectively; table 1, fig. 40). In some cases, our station at the confluence of the Sacramento and San Joaquin Rivers (C31; USGS station 11455508; table 1) also recorded the occurrence and transport of these bloom. These blooms were actively productive as demonstrated by elevated chlorophyll concentrations with high DO values (fig. 40), as well as declining nutrients and high pH values, consistent with high rates of photosynthesis. The progression of these blooms from the Cache Slough Complex into the lower Sacramento River is consistent with the bloom starting in the Cache Slough Complex—where chlorophyll concentrations were elevated throughout the spring and summer—and then periodically transported downstream.
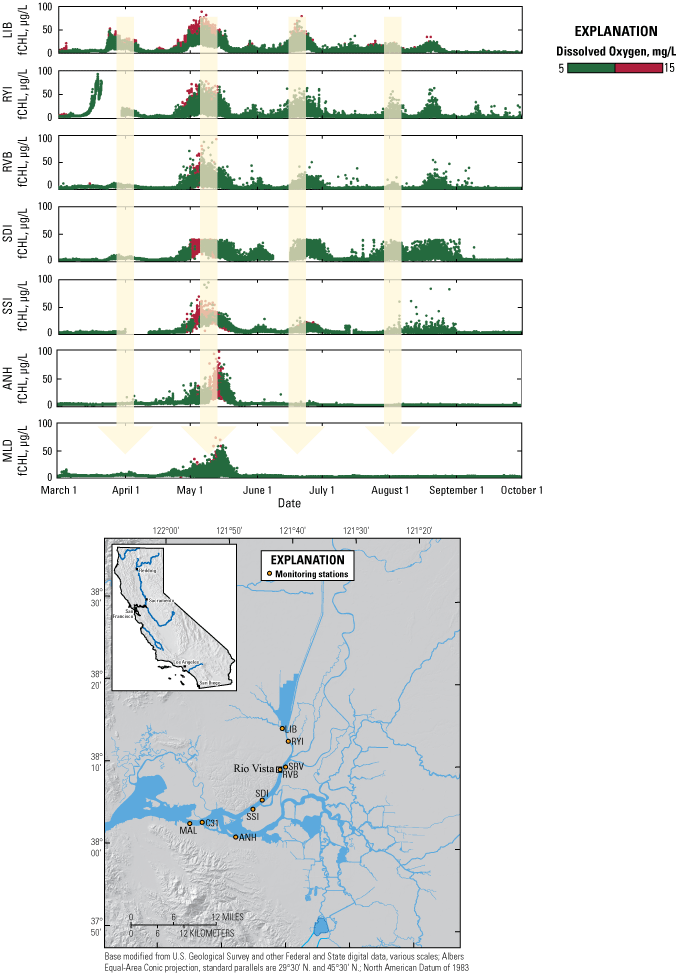
Example of productivity cascades as observed by chlorophyll fluorescence (fCHL) and dissolved-oxygen concentrations (in milligrams per liter, mg/L) in water year 2016 from upstream to downstream stations operated by the U.S. Geological Survey (USGS; U.S. Geological Survey, 2022; table 1) and California Department of Water Resources (2022; table 1): Cache Slough at South Liberty Island near Rio Vista (LIB; USGS station 11455315); Cache Slough at Ryer Island (RYI; USGS station 11455350); Sacramento River at Rio Vista Bridge (RVB); Sacramento River at Decker Island (SDI; U.S. Geological Survey station 11455478); SSI; ANH; and MAL. Time series of chlorophyll fluorescence are presented in micrograms per liter (µg/L), with red data indicating concurrent dissolved-oxygen concentrations indicative of active phytoplankton blooms. Chlorophyll symbol color changes from green to red when corresponding dissolved-oxygen concentrations exceed 10 mg/L.
The productivity cascade concept was part of the rationale for the North Delta Flow Action, a component of the Delta Smelt Resiliency Plan (California Natural Resources Agency, 2016). Water was released into the Yolo By-Pass Toe Drain to help “push” higher residence time water present in the Toe Drain and Cache Slough Complex into greater interaction with the mixing zones, with the intent to initiate a bloom that would expand to the downstream system. However, data from fixed station observations (USGS stations Cache Slough at South Liberty Island near Rio Vista [LIB; USGS station 11455315], Cache Slough at Ryer Island [RYI, USGS station 11455350], Sacramento River at Decker Island near Rio Vista [SDI; USGS station 11455478]—see table 1; U.S. Geological Survey, 2022), and systematic mapping surveys of phytoplankton and related constituents for 2016, 2017, and 2018, indicate that the elevated flows created in the Toe Drain were not associated with a progressive bloom event that propagated down to the lower Sacramento River (Stumpner and others, 2020b; O’Donnell and others, 2021a, b). In WY 2018, the Cache Slough Complex and lower Sacramento River were intensively surveyed during the North Delta Flow Action, demonstrating that the augmented flows down the Toe Drain resulted primarily in lateral transport through the stairsteps across the Cache Slough Complex rather than the expected “push” of long-residence-time water down Prospect Slough to Cache Slough (fig. 41). Lateral transport was indicated by movement of the high-specific-conductance agricultural water moving down the western channels rather than down the Toe Drain to Prospect Slough. Lateral transport likely happened because the Toe Drain releases were insufficient to overcome the flood tides moving up Cache Slough, and the resulting hydrodynamic forces “pushed” the water into the northern reaches of Cache Slough instead. Substantially larger release volumes, differing release rates, or reconfiguration of the channel system could possibly achieve the desired effect because the physical dynamics would be largely different.
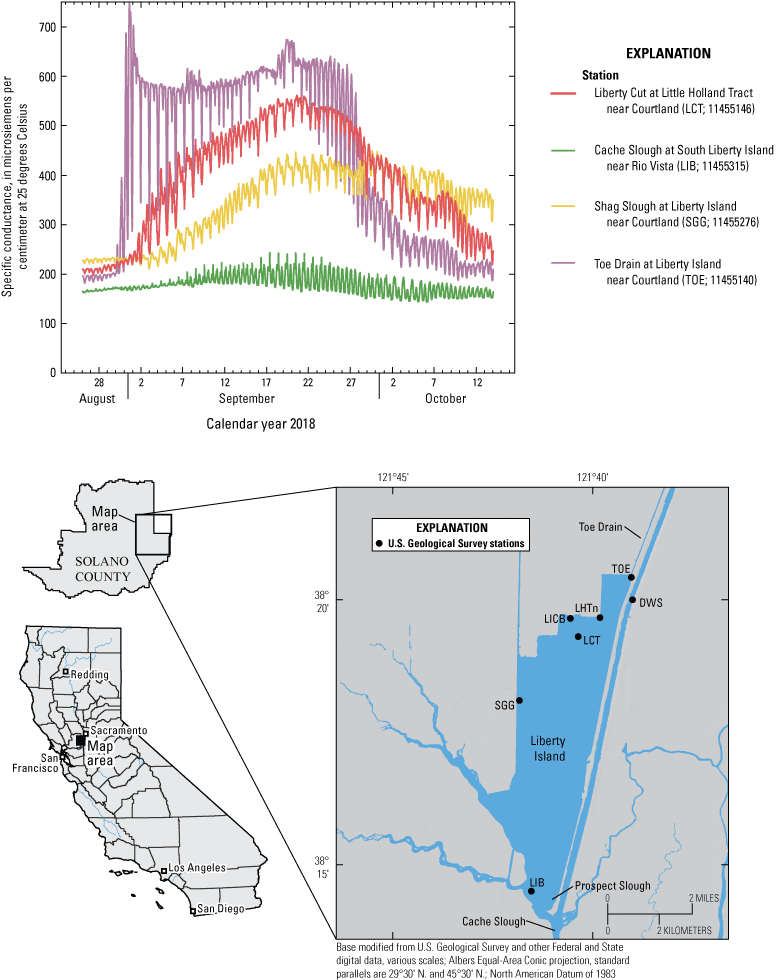
Specific conductance time-series data collected at four continuous monitoring stations (table 1; U.S. Geological Survey, 2022) in the Cache Slough Complex (fig. 3): Toe Drain at Liberty Island near Courtland [TOE; U.S. Geological Survey station 11455140], Liberty Cut at Little Holland tract near Courtland [LCT; U.S. Geological Survey station 11455146], Cache Slough at South Liberty Island near Rio Vista [LIB; U.S. Geological Survey station 11455315], Shag Slough at Liberty Island near Courtland [SGG; U.S. Geological Survey station 11455276]) during the 2018 North Delta Flow Action (California Natural Resources Agency, 2016). The elevated specific conductivity measurement is indicative of agricultural-return water used to increase flows in the Toe Drain and entering the Cache Slough Complex.
Transport Blooms
In WY 2017, a distinctly different process resulted in a much larger transport of phytoplankton biomass into the estuary than was associated even with the pronounced blooms of WY 2016. We term this type of bloom a “Transport Bloom” because it originated upstream and was transported into the lower system, where it elevated measured chlorophyll concentrations to bloom-like conditions (fig. 42) even as other indicators of bloom activity, such as increased dissolved oxygen and nutrient depletion, were not affected.
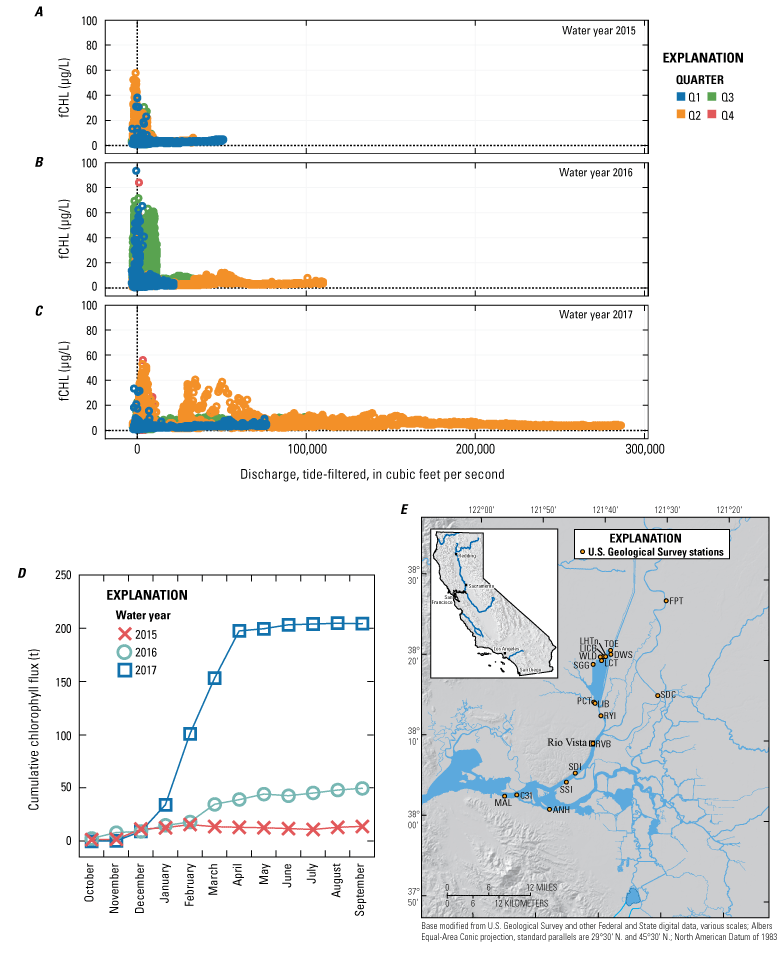
Example of transport blooms observed in the Sacramento–San Joaquin Delta. A, chlorophyll fluorescence (fCHL), in micrograms per liter (µg/L), versus tide-filtered discharge (Q), in cubic feet per second (ft3/s), for water year (WY) 2015; B, fCHL (µg/L) versus tide-filtered Q (ft3/s) for WY 2016; and C, fCHL versus tide-filtered Q (ft3/s) for WY 2017; D, cumulative chlorophyll flux, in metric tons (t), through time for WYs 2015–17; E, map showing locations of monitoring stations used to measure the transport and cumulative flux of chlorophyll (detailed information about stations in table 1). All data from California Department of Water Resources (2022) or U.S. Geological Survey (2022).
The WY 2017 event started in March, corresponding to the protracted recessional phase of a Yolo By-Pass flooding event. Our mapping surveys showed that shallow waters in the western part of the Yolo By-Pass floodplain had chlorophyll concentrations greater than 30 μg/L and were almost devoid of nutrients. This water was conveyed down the western margin of Yolo By-Pass, entering the Cache Slough Complex at Shag Slough, and extending past Rio Vista (figs. 3, 4, 43). Overall, there was a pronounced gradient in chlorophyll and nitrate present in Yolo By-Pass and in the Cache Slough Complex, with the western areas in Yolo By-Pass and Shag Slough showing highly elevated chlorophyll and depleted nitrate, while eastern Yolo By-Pass and Prospect Slough had low chlorophyll and higher nitrate. Previous studies of Yolo By-Pass have also shown substantial differences between the western and eastern edges of the floodplain and perennial Toe Drain (Sommer and others, 2004; Frantzich and others, 2018).
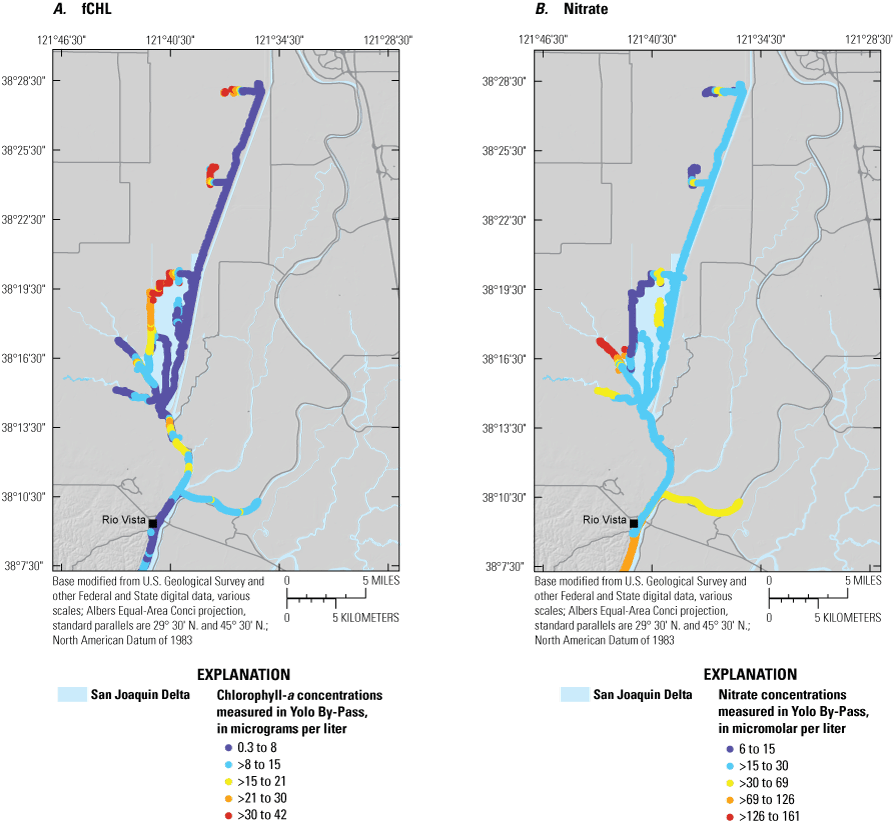
A, Chlorophyll concentrations (fCHL), in micrograms per liter (µg/L), and B, nitrate concentrations, in micromolar (µM), observed during the March 2017 Yolo By-Pass flooding event (O’Donnell and others, 2021a).
We calculated the mass flux of phytoplankton transported to the estuary from Yolo By-Pass in WY 2017 and found that the mass of phytoplankton transported to the estuary in WY 2017 was more than three times greater than in WY 2016, despite the shorter duration and lower observed concentrations characterizing the WY 2017 event (fig. 42). Our results support previous studies (Frantzich and others, 2018; Jeffres and others, 2019) and demonstrate that recession of Yolo By-Pass flooding can transport enormous amounts of labile organic material to the estuary simply because it represents such a large volume of water. Additional studies could provide information needed to understand the processes generating these blooms to determine if such blooms can be enhanced by management actions, and to understand their impacts on productivity.
Blooms Originating in the Confluence of the Sacramento and San Joaquin Rivers
In most years, bloom events have been documented that are not consistent with the processes described earlier. Instead of forming in upstream areas with longer residence times, these blooms form in the confluence region. The progress of the blooms carries them landward, sometimes past Rio Vista, with chlorophyll concentrations above 40 μg/L providing evidence of active-bloom conditions that are coincident with drawdown of nutrients and highly elevated DO and pH values (fig. 42). One such bloom was closely monitored in July 2017 (fig. 44). The phasing of fCHL, nitrate, and water velocity at the confluence station indicates that the bloom was centered nearby. A consistent depletion of nitrate was observed during the course of the bloom, and associated mapping data from July 17, 2017 (fig. 45), showed that the spatial extent of the bloom was entirely in the main-stem reach of the Sacramento River between Decker and Chipps Islands, with no apparent connection to an upstream, lateral, or downstream source. Others have also reported large blooms in this location (Glibert and others, 2014).
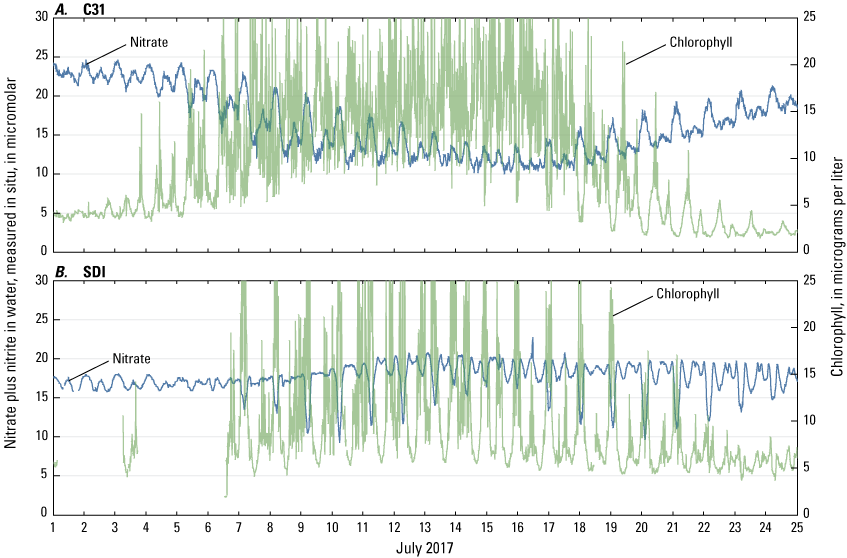
Chlorophyll fluorescence (fCHL; green lines) and nitrate (NO3; blue lines) measured by U.S. Geological Survey (USGS) continuous-monitoring stations at A, the confluence (Suisun Bay at Van Sickle Island near Pittsburg [C31]; U.S. Geological Survey station 11455508, table 1), and B, Decker Island (Sacramento River at Decker Island near Rio Vista [SDI]; U.S. Geological Survey station 11455478, table 1) during July 2017 (U.S. Geological Survey, 2022). Locations of USGS monitoring stations in the Sacramento–San Joaquin Delta are shown in figure 6. Data collection began at station SDI on a flood tide. Note that the confluence bloom extent is relatively confined, with no obvious source area.
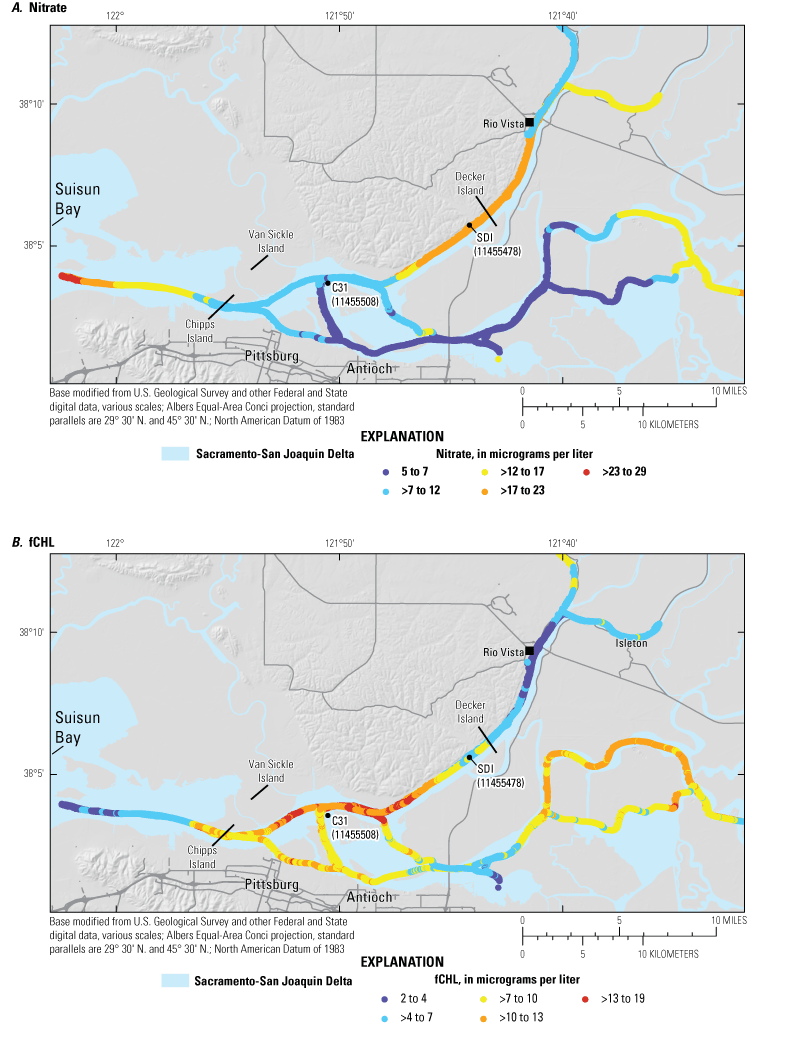
A, Nitrate concentrations, in micomolar (µM) and B, chlorophyll fluorescene (fCHL, µg/L) measured in the confluence (Suisun Bay at Van Sickle Island near Pittsburg [C31]; U.S. Geological Survey station 11455508, table 1) and near Decker Island (Sacramento River at Decker Island near Rio Vista [SDI]; U.S. Geological Survey station 11455478, table 1; U.S. Geological Survey, 2022) during a high-resolution mapping survey on July 17, 2017 (O’Donnell and others, 2021b). The time series is during a bloom occurrence in the period represented in figure 44.
Blooms are unexpected in the confluence region because it is characterized by deep tidal channels, fast tidal currents, and a well-mixed water column. Conventional understanding of bloom formation in open waters is based on long residence time and a stratified water column. Because these blooms do not conform to conventional understanding of bloom formation, we suggest that they are an important phenomenon deserving of further study.
Management Implications
This increased understanding of how hydrodynamics and channel geometry interact to influence residence time and phytoplankton production can be used by resource managers and engineers to design wetlands and channel networks that maximize beneficial phytoplankton production in regions of the Delta. Simple modifications to existing channel and levee configurations could be constructed to effectively push longer-residence time water into progressively higher-mixing zones. Examples of simple modifications include repairing levee breaches in flooded islands like Little Holland Tract, installing passive flap gates on appropriate breaches or distributary channels to direct flows, or lowering levees such that isolated areas are only connected to channels during spring tides; all these interventions could improve productivity in off-channel areas and export productivity to larger channels. Also, some channels could be rerouted, or levees could be constructed to effectively mimic the residence time variability and mixing that characterized large scale dendritic systems found in the historical Delta. These actions could establish a diversity of residence times and thus a multitude of the high-gradient zones such as the ones that are productive in the current Delta. Flow augmentations may also help improve beneficial phytoplankton production in Delta regions. Regardless of which management action is chosen, careful adaptive management with a substantial monitoring effort, like the monitoring completed as part of our studies, would likely improve outcomes.
Local Scale
Local and site-based studies were centered on stations in the Cache Slough Complex, including Little Holland Tract at North Breach near Courtland (LHTn; U.S. Geological Survey station 11455143; table 1), Liberty Island at Liberty Cut near Courtland (LICB; U.S. Geological Survey station 382006121401601; table 1), and various connecting channels such as the stairsteps (figs. 30, 46; U.S. Geological Survey, 2022). These studies were completed during periods when Yolo By-Pass was not flooded to focus on transport processes between individual sites and the surrounding channels. Studies were completed (1) during a late summer low flow period (August 2017) when water flowed landward (south to north) because of agricultural water withdrawals to the north and (2) during an early spring high-flow period (April 2018) when the dominant flow path was seaward (north to south) because of high flows coming down the Toe Drain. The main objective of these studies was to determine the extent to which Little Holland Tract and Liberty Island Conservation Bank acted as a sink for nutrients and a source of phytoplankton and organic material to food webs in the surrounding channels.
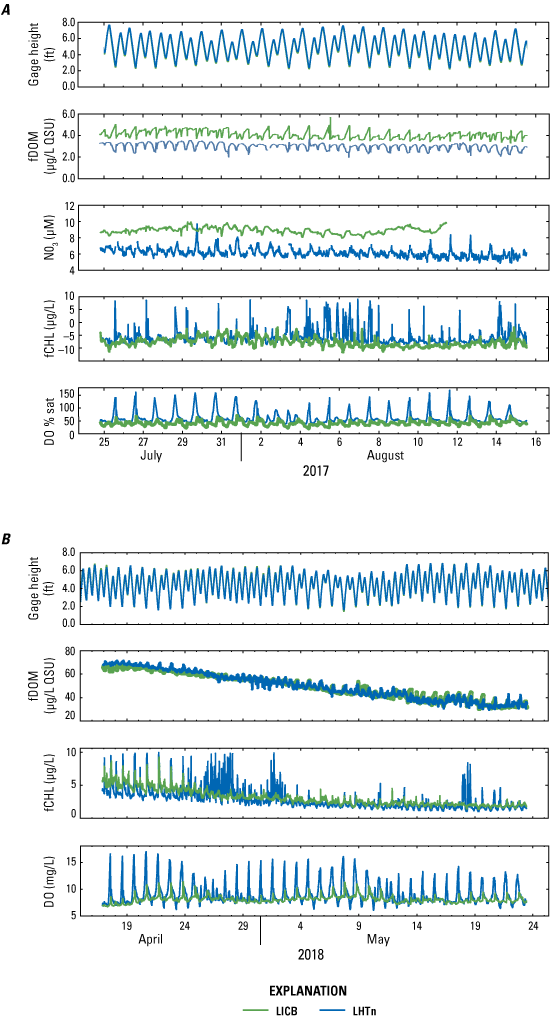
Comparison of Liberty Island Conservation Bank and Little Holland Tract north water-quality time series measured during low-flow conditions measured in A, summer 2017 and B, high-flow conditions measured in summer 2018. Time series includes from top to bottom; gage height in feet (ft), fluorescence of dissolved organic matter (fDOM) in micrograms per liter as quinine sulfate equivalents (µg/L QSU), nitrate (NO3) in micromolar (µM), chlorophyll (fCHL) in micromolar (µM), and dissolved oxygen (DO) in percent saturation (% sat) for Liberty Island at Liberty Cut near Courtland (station LICB; U.S. Geological Survey station 382006121401601; table 1) and Little Holland Tract at North Breach near Courtland (LHTn; U.S. Geological Survey station 11455143; U.S. Geological Survey, 2022).
The hydrodynamics of Little Holland Tract and Liberty Island Conservation Bank are different. The open-water Little Holland Tract is characterized by a nearly complete tidal exchange between high and low tide (see the “Sediment” section), resulting in within-site residence times near zero and little residence time variability across the site (station LHTn, table 1). In contrast, the deeper, dendritic channel systems characterizing Liberty Island Conservation Bank (site LICB, table 1) result in a marked variation in residence times. The hydrodynamics and the positions of each site in the channel network create different nutrient regimes for Little Holland Tract and Liberty Island Conservation Bank (fig. 46). During higher-flow periods, Little Holland Tract interacts with nutrient-rich waters flowing south from Yolo By-Pass that comprise agricultural discharge, runoff from natural landscapes, and effluent from the Woodland and Davis WWTPs (fig. 43). During the low-flow periods that characterize most of the year, flow in the Toe Drain is reversed, entraining relatively nutrient-rich waters from the Sacramento River through Miner Slough via Sutter Slough (not shown) and then north in the Toe Drain past the southern mouth of Little Holland Tract. In contrast, Liberty Island Conservation Bank receives water from the stairsteps that has a large seasonal variation in nutrient concentrations. During the winter high-flow periods, relatively high concentrations of nitrate (6–15 micromolar, µM) are common in the stairsteps; however, during low-flow periods, the LE ratio<1 results in long residence time in the stairsteps that allows phytoplankton production and other natural processes to deplete ammonium to below detection and deplete nitrate concentrations to concentrations that limit phytoplankton growth (Eppley and others, 1969).
During the 2017 low-flow conditions, the concentrations of nutrients passing through Little Holland Tract were substantially reduced despite the largely open-water character and short residence time. This was observed on numerous occasions as a steep decline in nitrate concentrations moving from south to north in the Toe Drain in the section next to Little Holland Tract (Downing and others, 2016; Bergamaschi and others, 2020), with water exchange taking place through breaches in the levee. Similarly, comparisons of nitrate concentration leaving Little Holland Tract through the northern breach indicates loss of nitrate in Little Holland Tract. The net loss of nitrate can be attributed to biotic uptake by phytoplankton, benthic algae, submerged and emergent aquatic vegetation, and pelagic and benthic microbes.
The extent of production and export of phytoplankton biomass (as measured by chlorophyll concentration) varied across seasons in the Little Holland Tract (station LHTn, table 1) and Liberty Island Conservation Bank (station LICB, table 1). In spring of 2018, both sites (stations LHTn and LICB, table 1) showed net export of chlorophyll; however, the concentrations exiting stations LHTn and LICB were relatively low (<3 µg/L; U.S. Geological Survey, 2022). It was unclear if the chlorophyll exiting Little Holland Tract was produced internally because elevated water heights in the Toe Drain resulted in Toe Drain flow moving over and through the Little Holland Tract levee and exiting toward the stairsteps. Thus, some or all the measured chlorophyll exiting Little Holland Tract could have come from the Toe Drain.
Export of chlorophyll from Liberty Island Conservation Bank (station LICB, table 1) was not observed during the low-flow summer study period. We observed chlorophyll concentrations (fCHL) >10 µg/L exiting Little Holland Tract (station LHTn, table 1) compared to concentrations of <5 µg/L exiting the breach of Liberty Island Conservation Bank (fig. 46). Higher DO and pH in water exiting Little Holland Tract during this period (fig. 4) supports the conclusion that Little Holland Tract had high primary production with phytoplankton exported to the stairsteps (fig. 4). At the time this export took place, nutrient concentrations in the stairsteps were below detection limits (U.S. Geological Survey, 2022), indicating that wetlands may be able to export phytoplankton biomass during times we would expect production to be limited by inorganic nutrient supply. The implication is that the wetlands are supporting phytoplankton production by regenerating nutrients stored internally—within bottom sediments or decomposing biota. This observation demonstrates how large-scale wetland restoration might contribute to Delta pelagic productivity.
We also observed a strong net export of detrital dissolved-organic material (DOM) from Little Holland Tract and Liberty Island Conservation Bank to the surrounding channels (U.S. Geological Survey, 2022), showing that irrespective of phytoplankton export, these wetlands produce organic material that potentially fuels pelagic food webs. Elevated DOM is a persistent characteristic of the stairsteps. This material is derived from decomposing plant material and is tidally pumped into connecting channels (Bergamaschi and others, 2012; Downing and others, 2016). Dissolved and particulate organic carbon have not been considered a main source of secondary production (supporting production of zooplankton) in upper San Francisco Estuary pelagic food webs (Jassby and Cloern, 2000; Sobczak and others, 2002); however, detritus-based food webs are known to be important in San Francisco Estuary tidal wetlands (Howe and Simenstad, 2011) and floodplains, including Yolo By-Pass (Jeffres and others, 2019). Further, a recent study has shown that zooplankton survival is enhanced by consumption of wetland detrital material (Harfmann and others, 2019).
Our observations reinforce the idea that individual tidal wetlands can serve as sources of material to surrounding channel environments and that such material likely accumulated in the stairsteps channel during the course of this study element of the physics to fish project, resulting in elevated chlorophyll and DOM concentrations. However, the potential benefit of wetland export to pelagic systems is entirely dependent on the position of the wetland in the regional flow network, as described earlier. Water exported from the northern breach of Little Holland Tract and Liberty Island Conservation Bank is typically not transported very far; thus, there is limited delivery of phytoplankton and detrital material into downstream pelagic environments. Wetlands hydrodynamically detached from the larger system cannot be expected to support Delta pelagic environments. A full understanding of how individual wetland channels contribute to ecosystem processes involves viewing contributions in the context of regional hydrodynamic processes.
Nutrients and Phytoplankton Management Implications
The markedly different water quality and phytoplankton dynamics between two nearby sites observed during the physics to fish project demonstrate how detailed site-scale understanding can improve the design and implementation of management actions aimed at improving food web productivity. Individual sites, such as restored tidal wetlands, can be designed to optimize onsite benefits for local populations. To understand the cumulative benefits of multiple sites to regional populations requires an understanding of connectivity between locations that is only possible in regional- and landscape-level understandings of hydrodynamic and biogeochemical processes.
Clams
The San Francisco Estuary has commonly been called one of the most invaded estuaries in the world (Cohen and Carlton, 1998). Two prominent invaders are the freshwater golden clam (Corbicula fluminea; hereafter, Corbicula) and the overbite clam (Potamocorbula amurensis; hereafter, Potamocorbula). Corbicula invaded the San Francisco Estuary in the 1940s, before systematic monitoring of the estuary began; however, based on studies from other regions where invasions have been studied, grazing by Corbicula likely had a considerable effect on the San Francisco Estuary food web (Brown and others, 2016). Corbicula can also “pedal feed,” meaning it can consume organic matter in the substrate and thereby maintain large populations even when phytoplankton are not abundant. Corbicula is a freshwater species, so its negative effects in the San Francisco Estuary are limited to the freshwater Delta. The invasion of Potamocorbula was monitored as it was happening (Carlton and others, 1990; Nichols and others, 1990), and high densities of this clam have been associated with low concentrations of chlorophyll because of grazing (Alpine and Cloern, 1992). Potamocorbula can also graze directly on the early life stages of zooplankton (Greene and others, 2011; Kimmerer and Lougee, 2015), meaning it is a competitor and predator of zooplankton. Therefore, these invasive clams substantially affect food webs supporting pelagic fishes (Kimmerer and Thompson, 2014; Brown and others, 2016), and further study would likely increase our understanding of the factors controlling clam distribution and abundance.
Landscape Scale
The distributions of Potamocorbula and Corbicula are largely controlled by salinity. Potamocorbula extends from San Pablo Bay into Suisun Bay, Suisun Marsh, and the West Delta Tidally Forced Zone (fig. 3). In the West Delta Tidally Forced Zone, Potamocorbula is primarily found near the confluence of the Sacramento and San Joaquin Rivers (fig. 47). Corbicula is widely distributed in the rivers and streams of the Central Valley and extend downstream into the Delta. Potamocorbula and Corbicula are found together in low-salinity habitats, and the locations of these habitats are somewhat variable depending on the water year (fig. 47). Both clams can close their shells and survive periods of weeks to months at unfavorable salinities; thus, the population response to changes in the salinity field can be relatively slow.
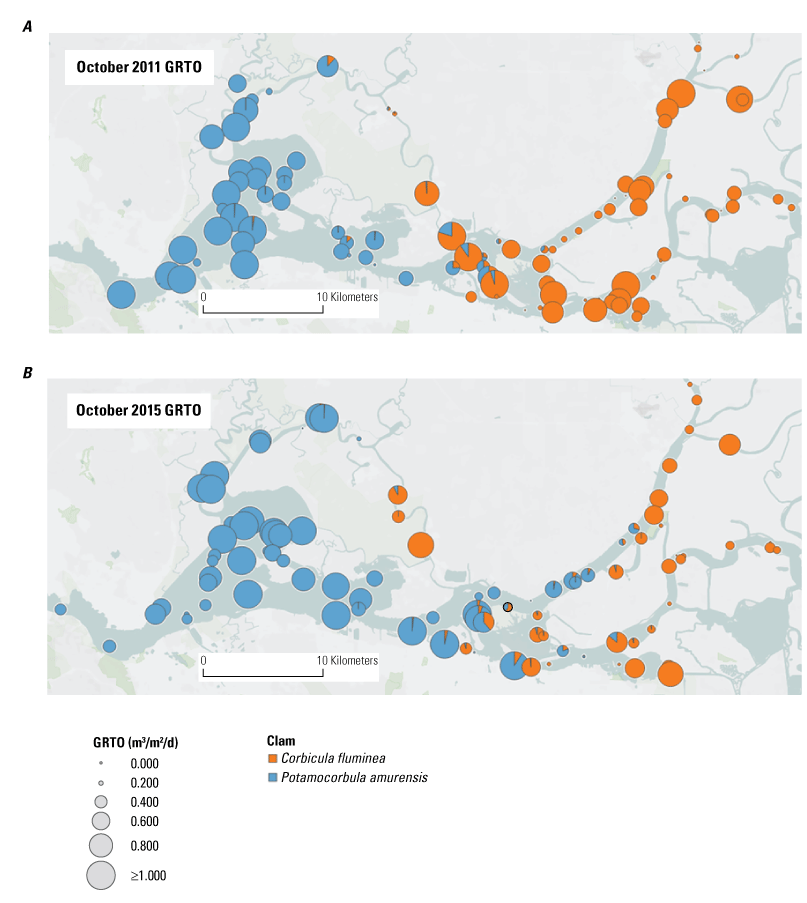
Distributions of Potamocorbula amurensis (blue circles) and Corbicula fluminea (orange circles), A, October 2011, a wet year; and B, October 2015, a dry year. Grazing rate turnover (GRTO) is the volume of water (in cubic meters) filtered by clams per square meter per day (m3/m2/d).
The reproductive successes of Potamocorbula and Corbicula are related to food abundance. Corbicula is food limited in the Delta (Foe and Knight, 1985). Potamocorbula also is food limited and can delay reproduction until food conditions are favorable (Nicolini and Penry, 2000; Parchaso and Thompson, 2002). When food conditions are favorable for juvenile survival, the adults will release their larvae (veligers); advection (downstream flow) and dispersive transport processes will spread those larvae throughout a wide area. Potamocorbula larvae are planktonic for several weeks and are transported by water currents in the water column. Corbicula larvae are not planktonic and move as bedload, like sediment particles. Corbicula larvae may also enter the Delta from upstream sources (fig. 48). If larvae find suitable substrate, their survival depends on availability of food. Lack of food; erosion, resuspension, and transport; and predation are presumed to be reasons why numerous small clams of both species are observed during spring but disappear by the time a subsequent sample is collected. Thus, landscape-scale factors like salinity and flow regimes determine the general distribution of both species, but regional and local conditions determine whether larval clams can survive and grow into adults at any location (fig. 48). Regional and local effects on abundance are addressed later in the text.
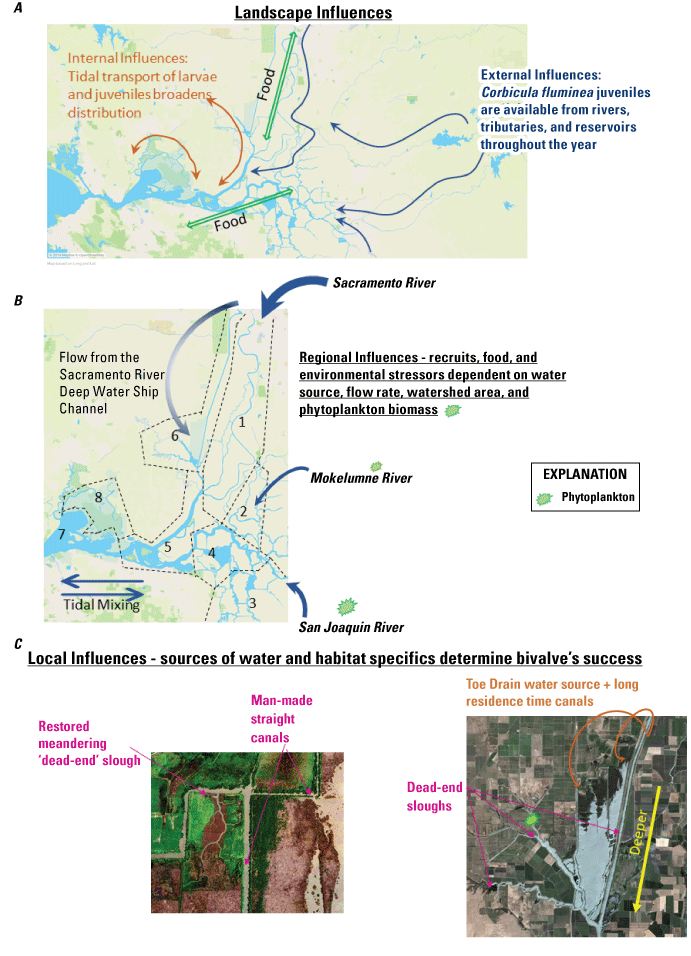
A, Landscape, B, regional, and C, local effects on abundance of Corbicula fluminea in the San Francisco Estuary. The dashed lines define the hydrodynamically distinct zones shown in figure 3. Figure 48B zones are as shown in figure 3: 1—North Delta Tidal Transition Zone; 2—Mokelumne Tidal Transition Zone; 3—South Delta Tidal Transition Zone; 4—Central Delta Tidally Forced Zone; 5—West Delta Tidally Forced Zone; 6 - Cache Slough Complex; 7—Suisun Bay; 8—Suisun Marsh. Widths of blue arrows associated with river names indicate the relative outflow of the rivers. The Sacramento River flood arrow (Flooding SR) includes flows from streams and sloughs flowing through the Cache Slough Complex, which results in large variations in outflow with minimum outflow near zero from some sources; this outflow variability is shown as an arrow with a varying shade of blue.
Management Implications
Management actions at the landscape scale that change the location of the salinity gradient might affect the transition from Corbicula to Potamocorbula populations. In a dry year, Potamocorbula might move upstream and increase the grazing rate in that new zone, but if the new habitat is mostly in deep water there would be little change in the grazing effect. Similarly, Corbicula might move downstream in wet years as they have in the past, but they are usually present for no more than three years and usually decline each year (Nichols, 1985) unless the high freshwater flows continue.
Regional Scale
Regional effects are dependent on the source, flow rate, water quality, and phytoplankton biomass of each freshwater source flowing into the estuary. Varying flow rate of the freshwater sources is represented by size of arrows in figure 48B. The Sacramento River flood arrow (Flooding SR, fig. 48B) includes flows from streams and sloughs flowing through the Cache Slough Complex which results in large variations in outflow with minimum outflow near zero from some sources; this outflow variability is shown as an arrow with a varying shade of blue (fig. 48B). The regional focus of the bivalve study element was on the Cache Slough Complex, the subregions of which are shown as a close-up of Cache Slough (fig. 49A), a close-up of Little Holland Tract (fig. 49B), and a close-up of the Sacramento River Deep Water Ship Channel (fig. 49C). We also used data collected from numerous stations across the Delta and Suisun Bay in collaboration with the benthic study of the Interagency Ecological Program (IEP) Environmental Monitoring Program (fig. 50), which allowed us to examine clam distribution and biomass at the regional scales (shown as separate colors in fig. 50) within the landscape.
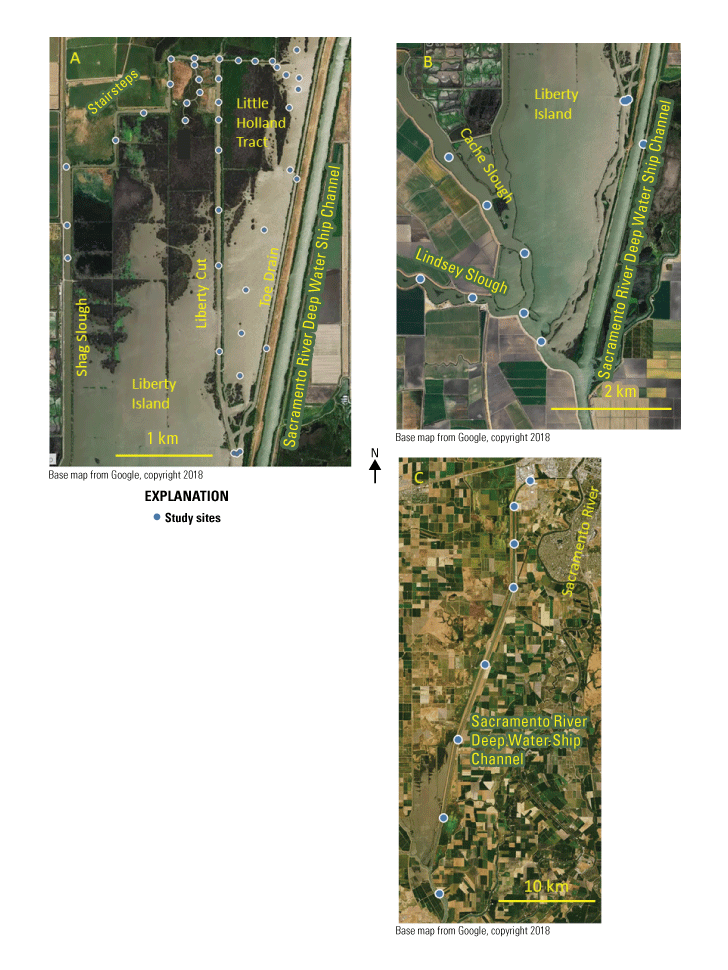
Locations of benthos study sampling sites of the Cache Slough Complex (fig. 3), including subregions A, Cache Slough, B, Little Holland Tract, and C, Sacramento River Deep Water Ship Channel (Zierdt Smith and others, 2021). The Cache Slough Complex includes Cache and Lindsey Sloughs, the Sacramento Deep Water Ship Channel, the Toe Drain, Liberty Island, Little Holland Tract, and associated connecting channels, including the stairsteps at the northern end of Liberty Island.
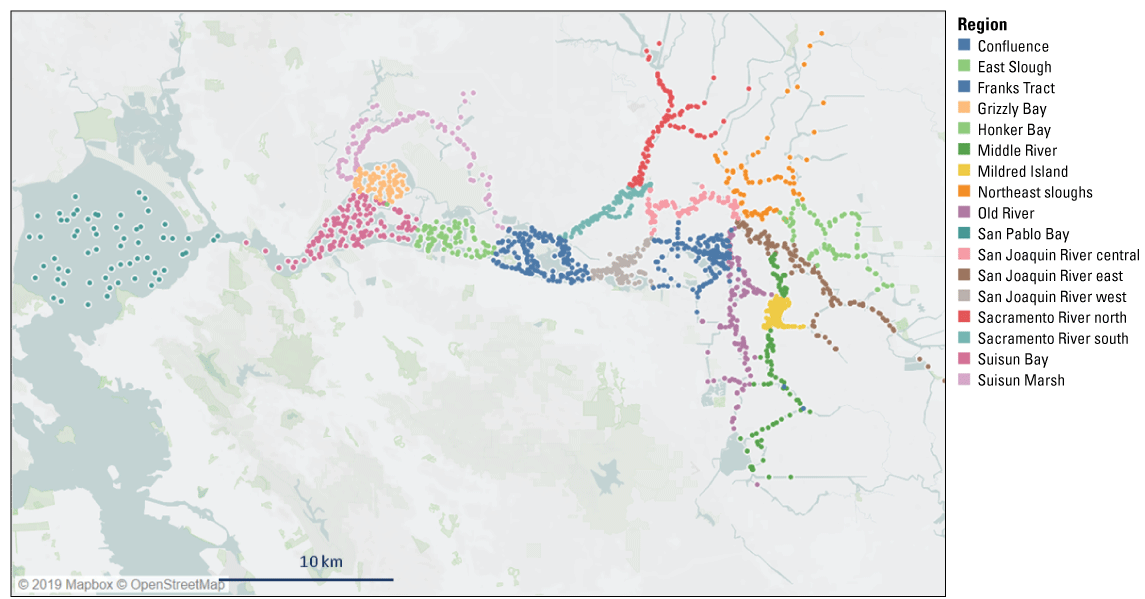
All sites sampled by Interagency Ecological Program (IEP) Environmental Monitoring Program (implemented by the California Department of Water Resources) with sites grouped by color for regions used in the analyses of data (Zierdt Smith and others, 2021).
The success of Corbicula in a region is dependent on environmental conditions such as hydrodynamics and regional scale factors such as the presence of emergent and rooted submerged aquatic plants and aerial exposure. Juveniles settling on seasonally flooded habitats dry out as the water recedes, and those settling in intertidal areas may be stressed by high temperatures and aerial exposure. Several regions have persistent populations of large Corbicula, indicating favorable conditions do exist for the clams (fig. 51).
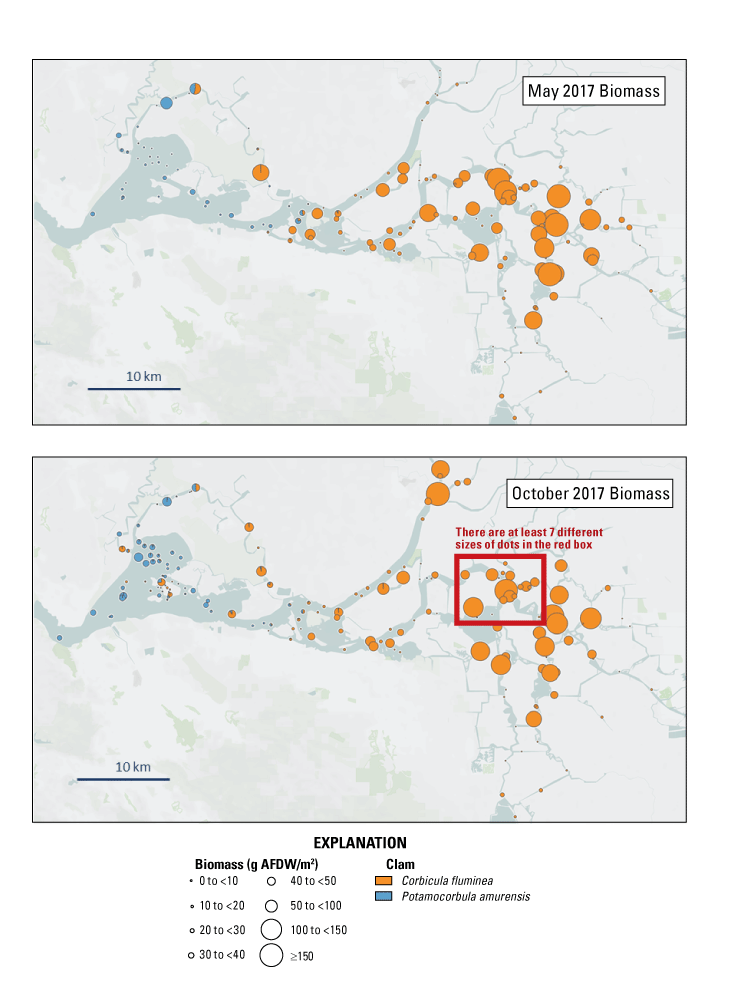
Distribution of the biomass (in grams ash-free dry weight per square meter [g AFDW/m2]) of Potamocorbula amurensis (blue) and Corbicula fluminea (orange) in A, May and B, October 2017, with greater biomass concentrations around flooded islands (Shrader and others, 2020).
Locations favoring persistent large populations in a region have been reported to be where transport of food produced in one area, such as flooded islands, is transported to nearby channels (figs. 51, 52). These channels often support large populations of Corbicula that exploit this transported food (Lucas and others, 2002; Lopez and others, 2006). Several regions are also characterized by local habitats with few clams, including smaller sloughs in Suisun Marsh that can be subject to high water temperatures, elevated salinity, and episodic low-oxygen concentrations.
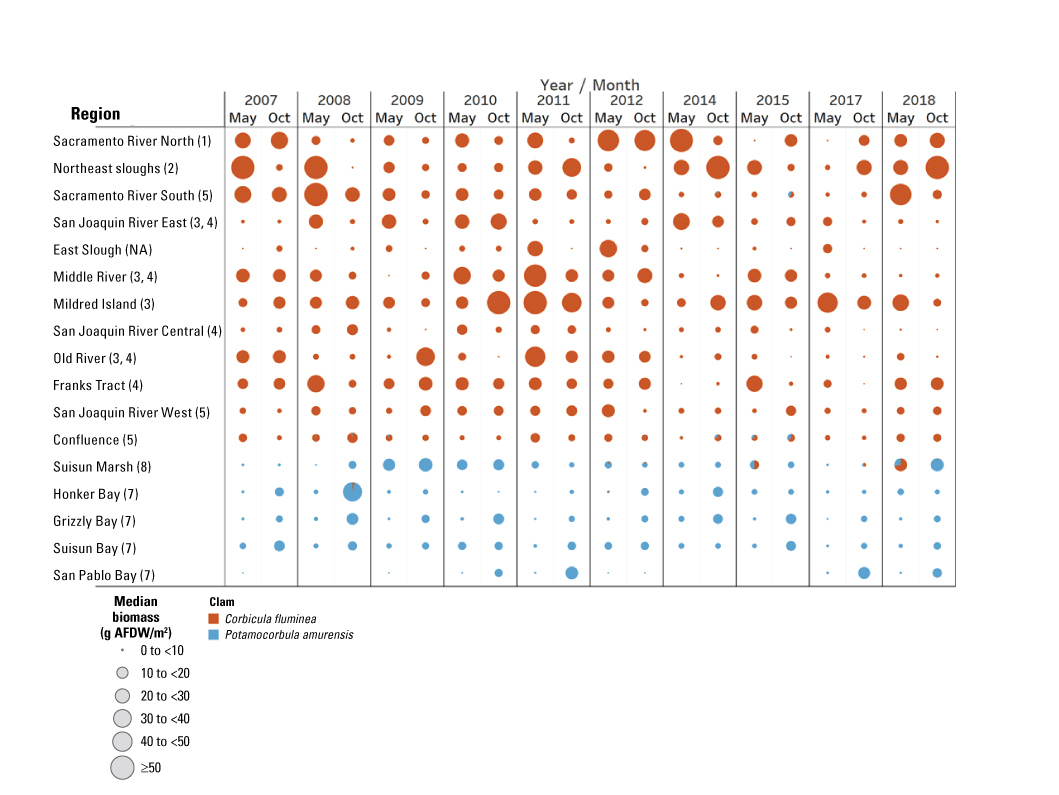
Distribution of the biomass (in grams ash-free dry weight per square meter [g AFDW/m2]) of Potamocorbula amurensis (blue) and Corbicula fluminea (orange) by year (2007–18) and month (May and October [Oct]) for the regions defined in figure 50 (Zierdt Smith and others, 2021). Numbers in parentheses in “Regions” column represent region numbers assigned in the map from figure 48B.
Management Implications
Invasive clams can graze substantial amounts of plankton from the water column and thus disrupt regional productivity and transport of food supplies for higher trophic levels. Evaluating the distribution of clams during varying environmental conditions when designing management actions could help enhance and restore habitat at the regional scale. Also, combining clam monitoring with such management actions could help to track and understand their outcomes. Effective regional-scale management actions to control invasive clams in the estuary would likely be challenging because of their wide distribution and great adaptability. Changes in the salinity field could affect the regional dominances of Corbicula and Potamocorbula, but whether this would consistently reduce grazing rates is unclear because they are both effective grazers.
Local/Site-Specific Scale
Local effects (fig. 48C) are dominated by geographic and bathymetric details of the local habitat. Examples of local effects within the Cache Slough Complex are shown in figure 48C, including man-made canals that are meandering and straight, or dead-end sloughs, all with potentially varying inputs of food. Man-made canals that receive water from an agricultural drain (brown arrows) have few Corbicula juveniles likely either because of poor juvenile survival or lack of juvenile import. Dead-end canals or sloughs have long residence times and may, dependent on other environmental conditions, produce elevated concentrations of phytoplankton, which is an advantage for clams. However, the lack of a freshwater source means that Corbicula juveniles and larvae are either produced by local adults or arrive by tidal transport.
Special studies of Corbicula grazing were focused on the Cache Slough Complex with sites distributed among the areas shown in figure 49. The response variable of interest is the grazing rate of the clam population in the local area. Grazing rate is calculated based on the biomass of Corbicula in the sampled area, laboratory-determined grazing rates, and water temperature (Lucas and Thompson, 2012). Translating grazing rate into interpretable numbers can be challenging. Lucas and Thompson (2012) summarized the basic processes that determine the effects of clam grazing rates on phytoplankton biomass and primary production (fig. 53). Phytoplankton growth is controlled by depth (light), transport rate through the area of interest (hydrodynamics), and grazing by bivalves, which also is affected by depth. This approach includes the assumption that sufficient nutrients exist for phytoplankton growth; however, data on phytoplankton production collected as part of the studies presented in this report show that this is not always the case (see “Nutrients and Phytoplankton”). The inability to link the highly dynamic nature of nutrient availability to phytoplankton production is a data gap with regard to estimating phytoplankton production in the presence of grazers. Production of phytoplankton in excess of clam consumption is dependent on hydrodynamics and water-quality conditions, including turbidity and forms and concentrations of nutrients (Lucas and Thompson, 2012). Clam biomass can be considered an indicator of phytoplankton production to the extent that a large biomass of clams indicates a location with sufficient food to support clam survival and growth.
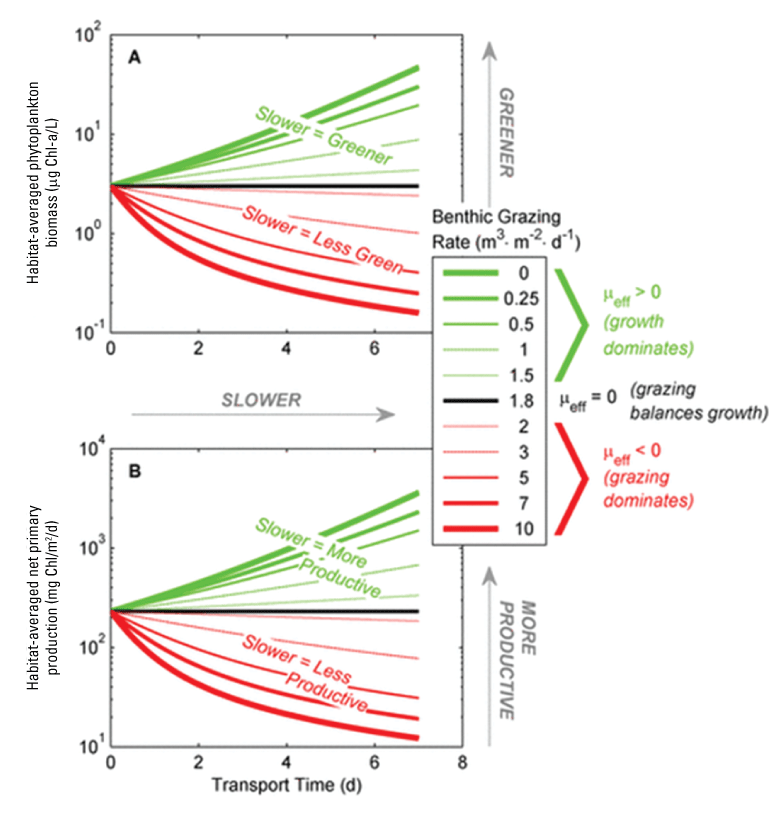
Relations among transport time, in days (d), and effective grazing rate (µeff), in cubic meters per square meter per day (m3/m2/d), for A, habitat-averaged phytoplankton biomass, in micrograms of chlorophylla per liter (µg Chl-a/L); and B, habitat-averaged net primary productivity, in milligrams of carbon per square meter per day (mg Chl/m2/d); modified from Lucas and Thompson (2012).
We were specifically interested in examining Liberty Island Conservation Bank, which has a shallow, dendritic dead-end slough system, as part of this study. Dead-end sloughs happen throughout the modern Delta, but few are sampled by the IEP Environmental Monitoring Program because they represent a relatively small percentage of the total area (Whipple and others, 2012). For example, small sloughs in Suisun Marsh and in the wetlands in Honker Bay are not routinely sampled. Four dead-end sloughs in the Cache Slough Complex, including Cache Slough, Lindsey Slough, Sacramento River Deep Water Ship Channel, and Liberty Island Conservation Bank were sampled in this study. Cache Slough Corbicula biomass was relatively consistent between years (fig. 54A). Lindsey Slough, which is next to and shares a mouth with Cache Slough, had lower Corbicula biomass, the biomass varied between years, and the biomass was less consistent in the years than in Cache Slough. Cache and Lindsey Sloughs were similar in that Corbicula biomass increased toward the entrance of the sloughs, particularly in 2017 (Shrader and others, 2020). This longitudinal gradient in biomass could indicate an increase in food or a higher number of recruits in the lower reaches of those sloughs during the wet year. Cache Slough had a consistent presence of Corbicula and a stable median biomass, but nearby Lindsey Slough had an intermittent presence of Corbicula and a highly variable biomass (fig. 54A).
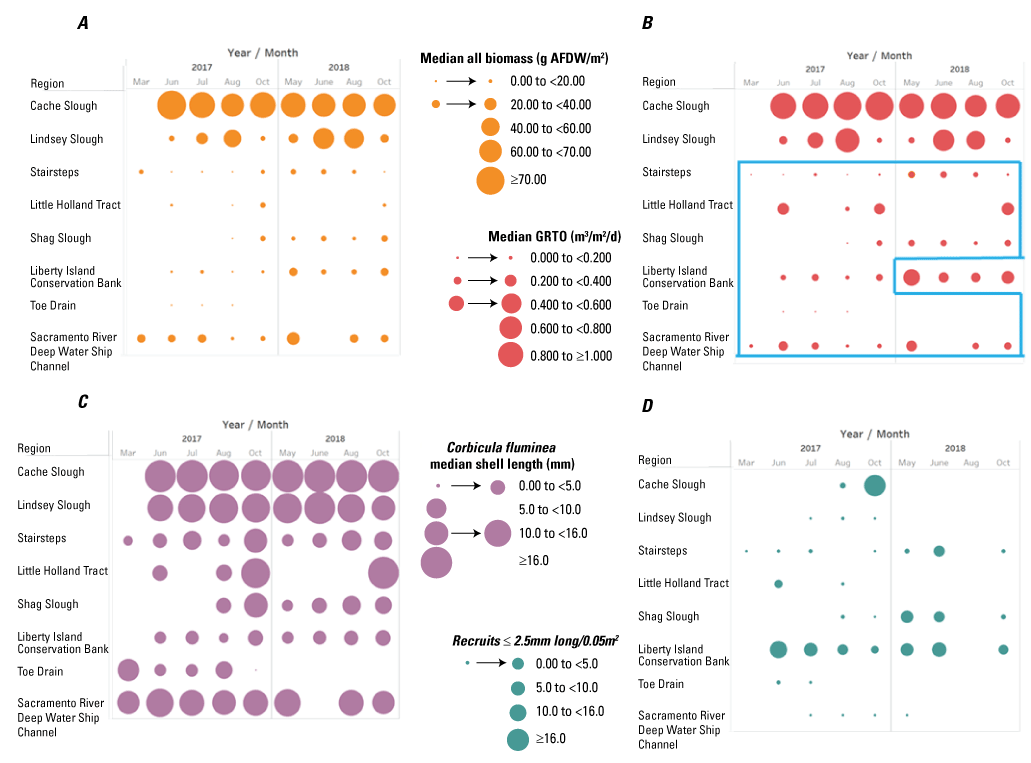
Distribution of A, biomass, in grams of ash-free dry weight per square meter (g AFDW/m2), B, grazing rate turnover (GRTO), the volume of water (in cubic meters) filtered by clams per square meter per day (m3/m2/d), C, shell length, in millimeters (mm), and D, daily abundance of recruits found during 2017–18 in the North Delta sampling program, recruits per 0.05 square meter (recruits/0.05 m2). The blue box in part B shows the most phytoplankton-friendly times and locations during this study when (1) Corbicula fluminea biomass was less than 5.5 g AFDW/m2, (2) GRTO was less than 0.2 m3/m2/d, and (3) daily abundances were less than 60 recruits/0.05 m2; Shrader and others, 2020).
The Liberty Island Conservation Bank (station LICB, table 1) and the Sacramento River Deep Water Ship Channel (station DWS, table 1) sites had the next highest median biomass values for Corbicula, but these values were much lower than values for Cache and Lindsey Sloughs (fig. 54A). The remaining slough locations were all man made, relatively straight sloughs (Shag Slough, stairsteps, and the Toe Drain) that consistently had low ash-free-dry weight (AFDW) biomass values (<1 gram AFDW per square meter, g AFDW/m2). Observed spatially isolated peaks in biomass in Shag Slough, the stairsteps, and the Sacramento River Deep Water Ship Channel are most likely related to breaks in the levee and the presence of agriculture drainage.
In the special studies areas, grazing rate turnover (GRTO), or the amount of time it takes for bivalves to filter the entire water column (in m3/m2/d), differed among sites as expected given the range in biomass values in these areas (Shrader and others, 2020). There was little grazing in the flooded island (Little Holland Tract) or in the two man-made canals (Shag Slough and the stairsteps) in either year (fig. 54B). The GRTO in Cache Slough was close to 1.0 m3/m2/d (the value that indicates complete water column filtration in a day with clams filtering at their maximum rate; fig. 54B), steady across months and years, and more seasonal in Lindsey Slough than in Cache Slough as expected from the pattern in biomass. The highest GRTO in Lindsey Slough took place in summer with relatively little grazing happening in spring or fall of either year. The GRTO in the large, deep dead-end slough, Sacramento River Deep Water Ship Channel was low in 2017 and 2018 (≤0.1 m3/m2/d) likely because of a combination of low clam biomass and great depth, which limited the proportion of the water column that could be filtered in a day. In Liberty Island Conservation Bank (station LICB in table 1), a dendritic system, GRTO was ≤0.05 m3/m2/d in 2017 and 0.1–0.3 m3/m2/d in 2018. Depending on turbidity and transport time, the 2018 GRTO values may have been sufficient to reduce phytoplankton growth in Liberty Island Conservation Bank (fig. 54B).
To establish new populations and maintain present populations of Corbicula, recruitment must be successful, and the juveniles must have favorable conditions for growth and survival. Juveniles settle onto suitable substrate, and their survival depends on availability of benthic food, pelagic food, environmental stress, and predation. In 2017 and 2018, the high median shell length indicates large adult Corbicula were common in Cache Slough, Lindsey Slough, and the Sacramento River Deep Water Ship Channel (fig. 54C). The smaller median shell lengths of Corbicula populations in the other locations indicates there were fewer large adults present.
At any location in a channel, the sources of Corbicula recruits can include adults occupying upstream freshwater sources and adults located downstream in tidal areas, when hydrodynamics are favorable to transport recruits landward. When recruits come from upstream and downstream, concentrations of Corbicula juveniles can form in the upper and lower ends of channels and sloughs. The Sacramento River Deep Water Ship Channel had some of its highest abundance of recruits at stations at both ends of the channel (Shrader and others, 2020). Because the presence of recruits indicates transport but not necessarily survival, recruits are frequently found where biomass of adults is low. As explained earlier, one of the limits on recruitment is exposure of animals at low tide and the resulting temperature-induced stress. This pattern was observed in the northern end of Little Holland Tract, where recruits were numerous and short lived, adults were rare, and the total biomass was low. Recruit abundance and total Corbicula biomass were higher at the deeper, southern end of Little Holland Tract (Shrader and others, 2020).
Dead-end sloughs with LE ratios<1 can challenge Corbicula recruitment because the upstream region has little to no exchange with the tidal region (figs. 13, 14), so juvenile Corbicula cannot be tidally moved upstream. This results in some areas, like Cache Slough, having high biomass well upstream from the mouth of the slough with recruits limited to the lower parts of the slough near its mouth. This pattern was observed in 2017 and 2018 (Shrader and others, 2020). Cache and Lindsey Sloughs did not have recruits in 2018 and had low recruits in 2017, except for October 2017 in Cache Slough (fig. 54D). This information demonstrates that recruitment into these sloughs is intermittent and dependent on upstream transport of juveniles from other areas. We hypothesize that the large biomass of Corbicula in Cache Slough may be related to the phytoplankton bloom in 2016 and the drought in prior years (Flow Alteration-Management, Analysis and Synthesis Team, 2022). The extreme dry years of 2014–15 and dominance of tidal flows during those years could have encouraged upstream transport of recruits into Cache Slough. Once recruits reached Cache Slough, the plentiful food in 2016 may have allowed rapid growth of Corbicula. The present population is dominated by a single year class of large, slow-growing individuals that is evidently maintaining itself (fig. 54C). Corbicula can live up to 7 years but more typically live 3 to 5 years (Crespo and others, 2015), so this population could begin to decline in 2022 and beyond if it has not already begun to decline.
Liberty Island Conservation Bank had a relatively small but persistent population of Corbicula and a relatively consistent source of recruits. Similar numbers of recruits were observed in 2017 and 2018. This was unexpected because we initially thought Liberty Island Conservation Bank was a dead-end system that would respond similarly to Cache Slough; however, Liberty Island Conservation Bank was subsequently discovered to have a southern exit. The effect of the southern exit on Corbicula recruitment has not been explored in detail but may have provided a southern source of recruits or may have prevented the formation of the exchange zone expected in a dead-end slough (figs. 13, 14), which may have allowed transport of recruits from the stairsteps and Shag Slough into Liberty Island Conservation Bank (station LICB, table 1). Finally, the dendritic form of the Liberty Island Conservation Bank channels provided a greater variety of habitats for the recruits than was found in straight, engineered sloughs, such as stairsteps and Shag Slough, which may have encouraged high recruitment and survival independent of water year type in Liberty Island Conservation Bank (fig. 54D).
Management Implications
Local-scale actions to control Corbicula are likely to be the most successful and feasible because the dynamics are simpler, and changes can more easily be affected than at regional or landscape scales. Some possibilities include:
-
1. Restore or enhance seasonally flooded habitat that dries out between the seasons of interest, such as Yolo By-Pass. This could enhance plankton productivity while preventing clam grazing because clams cannot survive extended dry periods. Any associated perennial channels would need deep water with high velocity to limit the loss of phytoplankton to clams that are likely to settle into that environment.
-
2. The idea of designing channel systems to produce productivity cascades (see “Nutrients and Phytoplankton”) could be evaluated in terms of the suitability of such habitats for clam populations so tradeoffs can be considered. Clams will likely invade designed-channel systems; however, if those designed-channel systems can produce phytoplankton in excess of what clams consume, they will provide a net benefit to the pelagic ecosystem.
Fishes
As noted previously, the San Francisco Estuary has been highly invaded by plants and animals, including fishes (Cohen and Carlton, 1998). The many changes in the physical and biotic environment have generally favored invasive species over native fishes, especially in fresh water. Invasions of submerged aquatic vegetation have favored invasive centrarchids like Bluegill (Lepomis macrochirus) and Largemouth Bass (Micropterus salmoides; Brown and Michniuk, 2007; Conrad and others, 2016) that can compete with or eat native fishes. These changes have been characterized as a “regime shift,” indicating that a return to pristine conditions is highly unlikely. Moyle and others (2012) suggested that reconciliation ecology (Rosenzweig, 2003) provides a workable approach to native fish protection and restoration in the San Francisco Estuary. The basic approach of reconciliation ecology is an acceptance that the ecosystem has been irreversibly altered and that large-scale restoration to historical conditions is unlikely. Therefore, restoration focused at scales most appropriate for restoring the ecological resources and processes of primary interest would likely yield favorable outcomes. This approach was the genesis of the Arc concept, introduced earlier in this report, and a key motivation for the studies we undertook.
Our general approach was to study existing systems and generate characterizations that could be used as templates to provide a foundation for predicting likely ecological outcomes of future physical habitat restoration actions. A focus of this approach was to better understand how stationary physical habitat features (channels, shoals, wetlands) interact with hydrodynamics and dynamic water-quality conditions (temperature, salinity, conductivity, turbidity) across varying spatio-temporal scales to drive ecological responses, especially fish species distribution and abundance. Because of the strong effect of landscape-scale features, particularly salinity, individual study components were carried out in Suisun Bay (variable salinity habitat) and the north Delta (freshwater habitat) to attempt to identify regional and local scale drivers and determine how they might vary across the landscape representative of the Arc concept. Thus, our general approach was to examine fish-habitat relations in two key areas: one in central Suisun Bay (Ryer Island; fig. 55) and one in the Cache Slough Complex to determine how site-specific and regional differences can be affected by landscape-level factors, such as the salinity field.
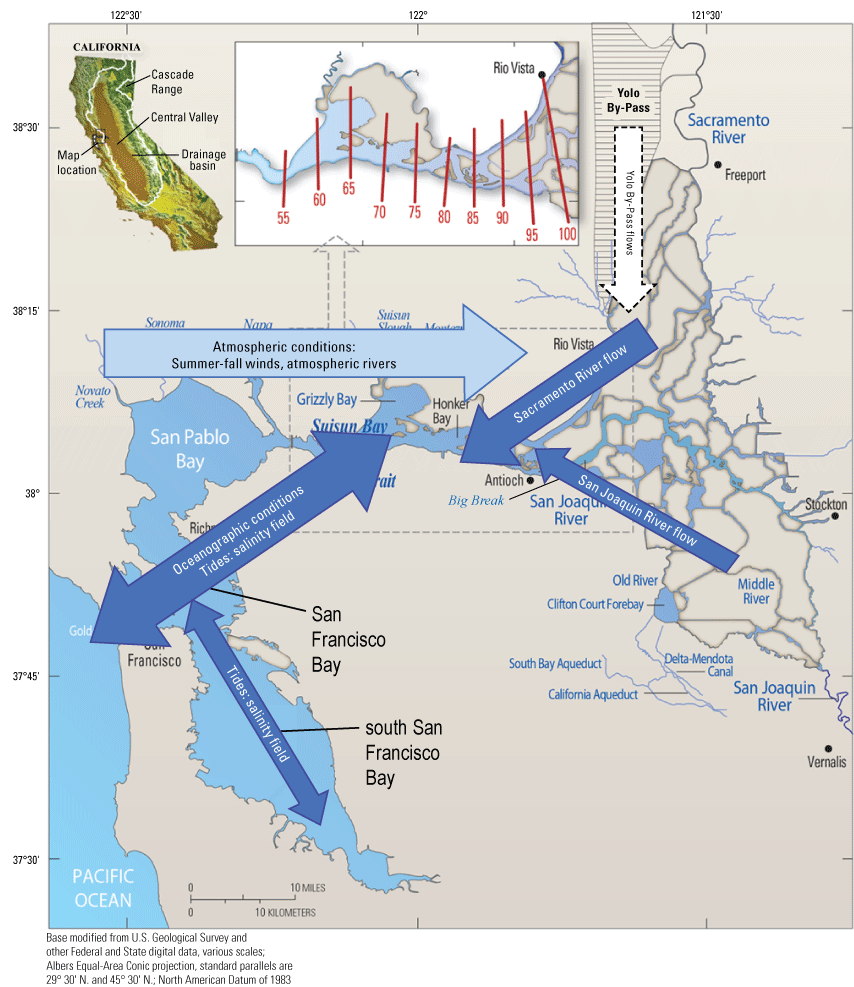
San Francisco Estuary showing selected physical drivers of environmental conditions important to fishes. The inset shows various positions of X2 (as red lines), which is defined as the distance in kilometers from the Golden Gate to the 2-practical salinity units (PSU) near-bottom isohaline (Jassby and others, 1995).
Ryer Island is one of the last remaining natural wetlands in the estuary and is flanked on all sides by shallow shoals, which are flanked by deep open-water channels. The position of Ryer Island in central Suisun Bay means it experiences a variable salinity regime caused by annual and seasonal variations in Delta outflow. Ryer Island’s relatively unaltered state and isolated location relative to other tidal wetlands by expanses of open water make it a unique natural laboratory to study the functional ecology of estuarine habitat and the efficacy of restoring tidal wetlands and shallow-water habitat. These physical habitat and environmental features of Ryer Island led us to focus here on the relative importance of stationary physical habitat (channels, shoals, or wetlands) versus dynamic water-quality features (temperature, salinity, turbidity, and chlorophyll) on fish abundance and distribution.
As described in more detail in previous sections, the Cache Slough Complex represents a variety of freshwater-channel and flooded-island habitats. The Cache Slough Complex has little or no natural historical wetlands but does have restored wetlands, particularly Liberty Island Conservation Bank. The Cache Slough Complex included a variety of open and terminal channels with a high degree of variability in LE ratio. These physical habitat and environmental features led us to focus on examining the interactions of hydrodynamics and physical habitat as drivers of fish abundance and distribution.
Landscape Scale
At the largest scale, fish species composition in the San Francisco Estuary is driven by salinity, which is the result of the interaction of rivers, the ocean, and other factors (fig. 55). The species observed in our studies at the Cache Slough Complex and Suisun Bay were consistent with how the fish assemblage is known to change from freshwater-adapted species in the tributary rivers and freshwater Delta to saltwater-adapted species in the bay (Feyrer and others, 2015). Species differ in their adaption to salinity, with some species limited to fresh or salt water and others well adapted to intermediate salinities (brackish water). Freshwater-fish assemblages in the San Francisco Estuary are more sensitive to climatic factors that affect freshwater outflow (precipitation) and inundation of floodplains, such as Yolo By-Pass and the more saltwater-tolerant species of the Bay that are more responsive to oceanographic factors, such as the Pacific Decadal Oscillation and the North Pacific Gyre Oscillation (Cloern and others, 2007, 2010; Feyrer and others, 2015). As explained earlier, the basic tidal forcing of salinity can be altered by bathymetry, which can create areas of gravitational circulation and ETMs (see “Hydrodynamics”) that can be important drivers of physical habitat for some pelagic fishes, including delta smelt (Feyrer and others, 2007).
The fish species we observed at Ryer Island and at the Cache Slough Complex (Feyrer and others, 2021; table 4) were consistent with salinity being a primary landscape-level driver of the distribution of native and non-native fish species. Species that tolerate brackish and marine conditions dominated the fishes at Ryer Island, while freshwater species dominated the fishes at the Cache Slough Complex (table 4). Additionally, the occurrence and abundance of native fishes was much higher at Ryer Island than at the Cache Slough Complex. We found relatively high occurrence and abundance of native species at Ryer Island, including Sacramento splittail (Pogonichthys macrolepidotus), tule perch (Hysterocarpus traskii), and Sacramento pikeminnow (Ptychocheilus grandis; table 4). Ryer Island had 16 native species and 11 non-native species, while the Cache Slough Complex had 11 native species and 17 non-native species (table 4). Native fishes comprised 46 percent of the total catch at Ryer Island but only 31 percent of the catch at the Cache Slough Complex (table 4).
Table 4.
Total number (and percentage) of fish taxa captured by gillnetting and otter trawling at Ryer Island and at various locations in the Cache Slough Complex (fig. 3), including Liberty Island Conservation Bank, Little Holland Tract, and the stairsteps (Farruggia and others, 2019; Steinke and others, 2019a).[Species are listed in descending order of total abundance at Ryer Island. Abbreviation: <, less than]
The large number of native species at Ryer Island is likely primarily due to its setting in the salinity regime. Ryer Island native species include many species that are associated with brackish water habitats. Many freshwater invasive species, such as ictalurids (Ictaluridae; catfishes), primarily White Catfish (Ameiurus catus), and centrarchids (Centrarchidae; sunfishes), including Black Crappie (Pomoxis nigromaculatus), Redear Sunfish (Lepomis microlophus), Largemouth Bass, and Bluegill, were absent from catches at Ryer Island. The lack of Largemouth Bass and other centrarchids at Ryer Island supports previous studies that indicated the proliferation of centrarchids was associated with the decline of native fishes in the freshwater Delta (Brown and Michniuk, 2007; Conrad and others, 2016). The absence of these invasive species is most likely because of periodic high salinities that prevent recruitment.
Fish Management Implications at the Landscape Scale
There is limited human control of the salinity field at a landscape scale because the primary driver is freshwater flow from the watershed in response to climate (Kimmerer, 2004). The limited opportunities for landscape-level management actions that change the position of the salinity field are already being considered in the upper San Francisco Estuary, primarily in attempt to benefit delta smelt (U.S. Fish and Wildlife Service, 2008, 2019); however, the effects on other fishes have only been considered in a regional context. The results of this study element support the idea that a flow action of sufficient magnitude could affect the geographic ranges of some species based on their salinity preferences. The effect of such an action, however, would likely be ephemeral and coincident with the timing of the action and would be most influential on mobile pelagic fishes that are most responsive to water-quality conditions, such as Striped Bass, American shad (Alosa sapidissima), delta smelt, and longfin smelt (Spirinchus thaleichthys). For native fishes that relate to specific habitat features such as wetlands (Sacramento splittail, tule perch, and Sacramento pikeminnow), appropriate habitat could be restored at positions along the salinity gradient that favor the species of interest. We explore this later in the text with regional-scale examples.
Regional Scale
At a regional scale, we sought to clarify how stationary physical or geomorphic (wetlands, shoals, and channels) and dynamic (salinity, temperature, turbidity, and chlorophyll concentration) habitat features interact to drive distributions of individual fish species. We carried out investigations at Ryer Island and the Cache Slough Complex to explore this concept in distinct regions of the salinity field positioned along the Arc concept (Farruggia and others, 2019; Steinke and others, 2019a, b, c; Feyrer and others, 2021). At Ryer Island and the Cache Slough Complex, otter trawls and gill nets were used to capture the juvenile and adult life stages of all fish species present in the study area. Otter trawls had a mouth width of either 2.4 or 4.8 m and were 5.3 m in length, with 35-mm stretch mesh in the main body and 6-mm stretch mesh in the cod end. Otter trawls were towed at approximately 3.5 kilometers per hour (km/h) for 5–10 minutes. Monofilament gill nets were 1.8 m in height, 45.7 m in length, and had five equal-length panels of 38-, 51-, 64-, 76-, and 89-mm mesh. Deployments of individual gill nets targeted a period of 60 minutes. At Ryer Island, we also sampled white sturgeon (Acipenser transmontanus) by set lines (a series of baited hooks attached to an anchored rope). At Ryer Island, our study design compared wetland, shoal, and channel habitats, while at the Cache Slough Complex, our study design compared two tidal wetland types: (1) a shallow open water habitat (Little Holland Tract) and (2) a shallow dendritic channel network (Liberty Island Conservation Bank). Overall, fishes were sampled approximately monthly from June 2016 through December 2017. Multiple samples were taken in each habitat type, and water-quality variables were also measured. The data were used to characterize fish-habitat relations for common species using Bayesian models (Patton and others, 2020; Feyrer and others, 2021).
Ryer Island has no or relatively low numbers of the freshwater natives Sacramento Sucker (Catostomus occidentalis) and hitch (Lavinia exilicauda) when compared to the Cache Slough Complex. This may be related to the need for fishes to disperse across large areas of open waters to reach Ryer Island. Preliminary studies of life histories from tagging studies performed in the Cache Slough Complex suggest that Sacramento pikeminnows found in the Delta were spawned in locations ranging from the Delta to the upper Sacramento River and its tributaries (Valentine and others, 2020).
In contrast to Ryer Island, the Cache Slough Complex has numerous locations where the LE ratio is less than one (fig. 15), meaning that there is the opportunity for exchange zones to develop (figs. 13, 14) and provide conditions to create pelagic “hot spots” of primary production (Steinke and others, 2019b; fig. 56). The various slough systems also have different locations regarding access to tidal wetland habitat, which seems to greatly affect the presence and feeding of native fish species (Young and others, 2015, 2018, 2020a; Hammock and others, 2019).
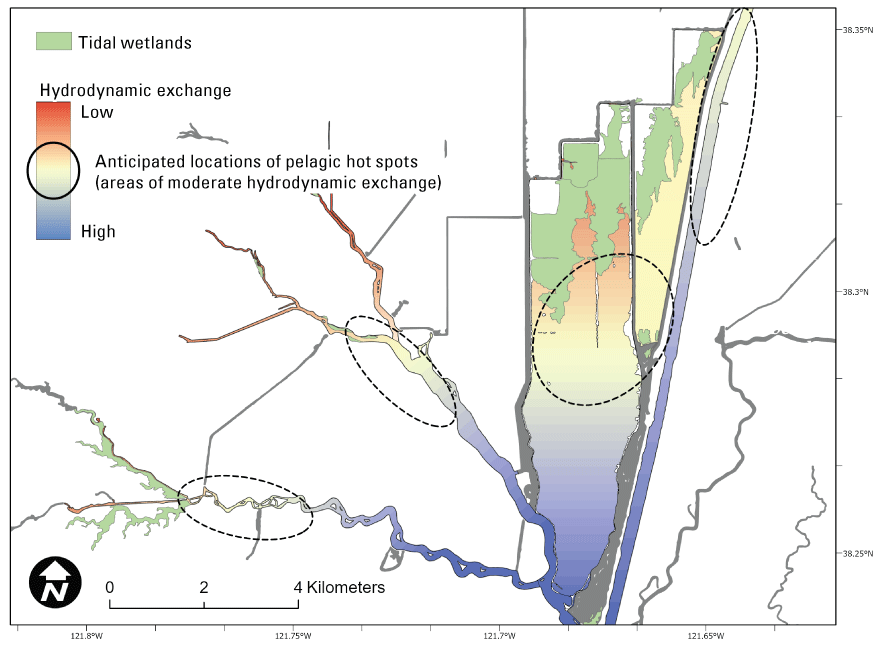
Anticipated locations of pelagic hot spots (areas of moderate hydrodynamic exchange) based on the Lagrangian to Eulerian (LE) ratio (figs. 13, 14). Colors represent hydrodynamic exchange with downstream habitats ranging from high (blue) to no (red) exchange. Figure encompasses habitats included in Steinke and others (2019a, b, c); Young and others (2020b). Base layer source data obtained from California State Geoportal (CSG; California Department of Technology, 2022).
Fish Management Implications at the Regional Scale
Based on the results of this study element, the intentional placement of restoration sites at selected positions along the salinity gradient appears to be a viable strategy for influencing the species using such habitat. Strategically located resoration sites would be consistent with what has been observed across Suisun Marsh (Matern and others, 2002) and among flooded islands along the estuarine gradient of the Delta (Young and others, 2018). Additionally, most of the species we observed at Ryer Island and the Cache Slough Complex, especially native species of special management interest, were associated with tidal wetland habitat (Feyrer and others, 2021). Few species showed associations with water-quality conditions driven by seasonal (temperature) or a combination of broad- and fine-scale ecosystem processes (salinity and turbidity). Thus, the results of this study element demonstrate that implementation of habitat restoration projects may be an effective conservation tool to support fishes.
Local/Site-Specific Scale
As part of this study element, three separate studies of local-scale drivers of fish populations were completed, including one in Ryer Island and two in the Cache Slough Complex. At Ryer Island, habitat use of fishes in and around this unique natural wetland was examined as described earlier (Feyrer and others, 2021; fig. 57). In the first Cache Slough Complex study, fish assemblage composition and density were compared between two unique restored habitat configurations, Little Holland Tract and Liberty Island Conservation Bank (Farruggia and others, 2019). These neighboring, hydrodynamically connected but geomorphically distinct habitats provided a suitable process for evaluating the importance of physical habitat configuration. The second Cache Slough Complex study focused on how hydrology and hydrodynamics interact to drive ecological properties of terminal channels (Young and others, 2020b).
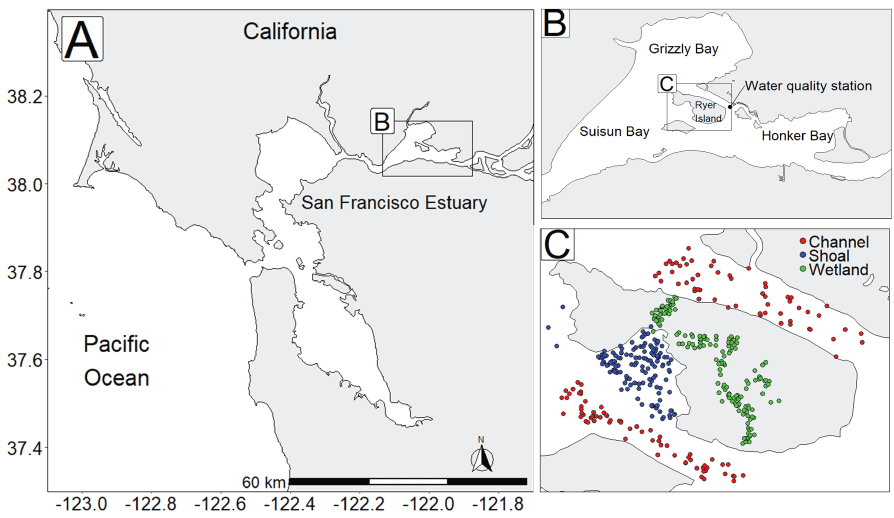
Study region showing the location of A, San Francisco Estuary, B, Ryer Island, and C, sites of each individual fish sample. Sites were sampled across channel (red), marsh (green), and shoal (blue) physical habitat ecotypes and are shown in panel C with a small amount of jitter imposed on the coordinates to minimize superimposition and improve visualization (Steinke and others, 2019a). The water-quality station shown in panel B is station “RYC” (table 1; California Department of Water Resources, 2022). Adapted from Feyrer and others (2021).
Ryer Island
A total of 2,969 individual fishes representing 26 species were collected (table 5); 15 species (58 percent) and 1,363 individuals (46 percent) were native. A total of 111 white sturgeon were captured by set line (Steinke and others, 2019c). The most abundant non-native species was Striped Bass, which was almost 10 times more abundant than the next most abundant non-native species, threadfin shad.
Table 5.
Total number of fish taxa captured from Ryer Island by sampling gear and habitat type listed in descending order of total abundance (Feyrer and others, 2021).[Rows with an asterisk (*) show data for native fishes]
Captured fish species were distributed differently among habitat types (fig. 58). The native species: Sacramento splittail, tule perch, Sacramento pikeminnow, and prickly sculpin (Cottus asper) were all most common in the marsh habitat. The other native species, jacksmelt (Atherinopsis californiensis) and starry flounder (Platichthys stellatus), were more common outside of the marsh habitat, which is consistent with the more marine life histories of these species. The introduced Striped Bass was a habitat generalist. Yellowfin goby (Acanthogobius flavimanus) and shimofuri goby (Tridentiger bifasciatus) were distributed primarily in the marsh and were relatively rare in the shoal and channel. These differences in habitat use were statistically important in explaining the distribution and abundance for all species (Feyrer and others, 2021). Seasonal variation in salinity, water temperature, and turbidity were also important for some species (Feyrer and others, 2021).
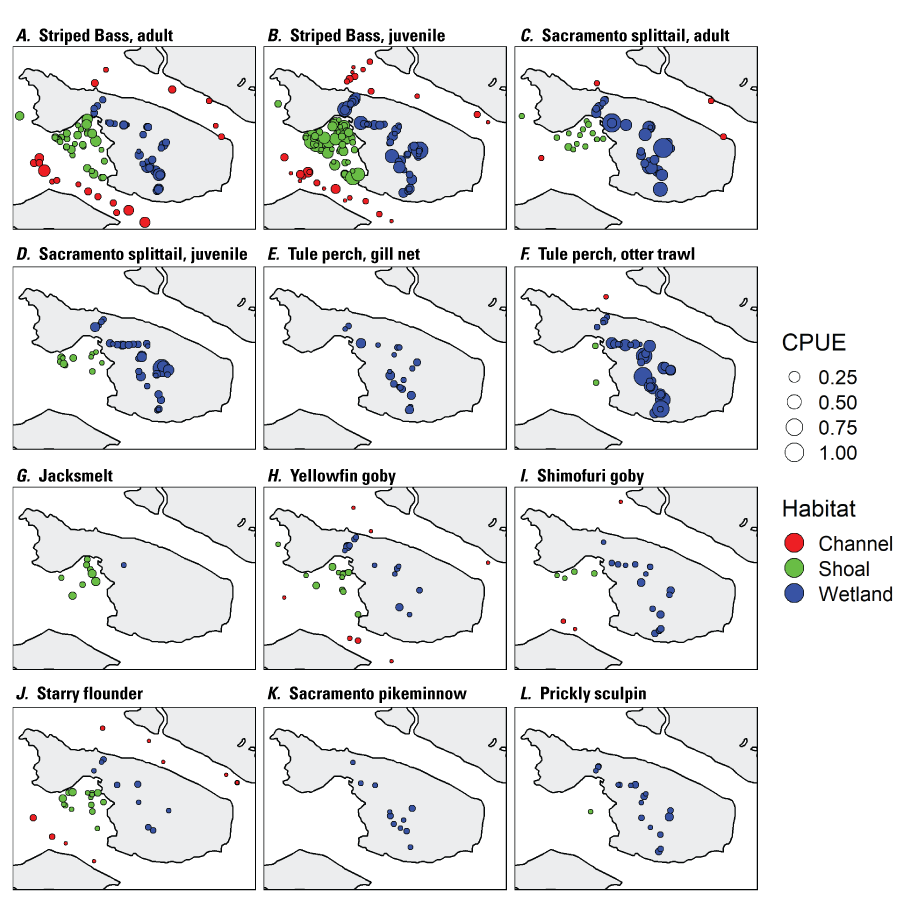
Fish occurrence and abundance (based on catch per unit effort [CPUE]) observed across channel (red), marsh (green), and shoal (blue) physical habitat ecotypes (Feyrer and others, 2021) for A, Striped Bass (Morone saxatilis), adult; B, Striped Bass, juvenile; C, Sacramento splittail (Pogonichthys macrolepidotus), adult; D, Sacramento splittail, juvenile; E, tule perch (Hysterocarpus traskii), gill net; F, tule perch, otter trawl; G, jacksmelt (Atherinopsis californiensis); H, yellowfin goby (Acanthogobius flavimanus); I, shimofuri goby (Tridentiger bifasciatus); J, starry flounder (Platichthys stellatus); K, Sacramento pikeminnow (Ptychocheilus grandis); and L, prickly sculpin (Cottus asper). Only positive observations are shown; all possible opportunities for observations (all individual samples) are shown in figure 57C (Steinke and others, 2019a). Figure adapted from Feyrer and others (2021).
Of the 111 white sturgeon captured, 54 were captured in the deep, open-water channel, 56 were captured in the shallow open water shoal, and 1 was captured in the shallow wetland. This difference in habitat use was statistically important in the Bayesian models (Patton and others, 2020). Research completed in Suisun Marsh, a complex of tidal and managed wetlands near Ryer Island, showed that white sturgeon were present in the largest channel of Suisun Marsh (Moyle and others, 1986; Matern and others, 2002) but not in large numbers. Variability in white sturgeon presence and absence in wetland habitats across the San Francisco Estuary is likely because of finer-scale differences in specific aspects of habitat such as size and configuration of channels, prey availability, and substrate type.
An associated study of the habitat generalist Striped Bass at Ryer Island highlighted differences in diet among habitats (Steinke and others, 2019d). Because of their relatively large size and gape, Striped Bass can consume a wide variety of prey (Manooch, 1973; Nobriga and Feyrer, 2008), indicating a high potential for opportunistic feeding and trophic adaptability. However, variations in seasonal and location-specific diet composition have been observed (Feyrer and others, 2003; Jordan and others, 2003). Diet analysis of predatory fishes can be used to identify the feeding habits, prey selection, and resource partitioning of a species that happens in a region (Walter and others, 2003; Rudershausen and others, 2005).
Striped Bass were collected by gill net, otter trawl, and angling during March 26–April 5, and July 7–18, 2018 (Steinke and others, 2019d). Stomach contents were collected by gastric lavage (“stomach pump”; Seaburg, 1957; Hartleb and Moring, 1995), a non-lethal method. Diet items were then identified, counted, and weighed.
Overall, 268 Striped Bass were collected from the study area during spring and summer sampling efforts. Of those, 234 individual fishes had diet items in their stomachs, and 34 had empty stomachs. Mean standard lengths (± standard error) were compared among habitat types and seasons using a two-way analysis of variance (ANOVA) and a level of significance (α) of 0.05; Helsel and others, 2020). In spring, Striped Bass captured in shoal habitats (202±73 mm) were significantly shorter than Striped Bass captured in channel (277±68 mm) and marsh (278±87 mm) habitats (F2,115=11.01, p<0.001). In summer, Striped Bass captured in marsh habitats (271±83 mm) were significantly longer than Striped Bass captured from shoal habitats (208±41 mm), but mean standard lengths of Striped Bass captured from channel habitats (260±50 mm) were not significantly different from mean standard lengths of Striped Bass captured in marsh and shoal habitats (F2,113=7.16, p=0.001).
Seasonally, fishes captured during the summer had gut fullness values (food weight/body weight×100) that were significantly higher (ANOVA; F1,257=22.66, p<0.0001) than fishes collected during the spring, indicating that either fishes increased foraging behavior or prey were more available during the summer season (fig. 59). A permutational multivariate analysis of variance (PERMANOVA; α=0.05) was used to statistically compare sample sites between seasons and among habitat types (Helsel and others, 2020). In the spring, sample diets were statistically different between marsh and channel, but sample diets from shoals were not significantly different from sample diets from marsh or channel habitats (F2=2.2, p=0.035). In summer, diets were statistically different among all habitat types (F2=12.4, p=0.001). The differences were largely because of varying importance of various types of invertebrates (fig. 60). The distributions of the four most important prey groups in Striped Bass stomachs were plotted using heat maps for the spring (fig. 61) and summer (fig. 62) seasons. During the spring, the occurrence of both amphipod groups in Striped Bass diets was greatest in the interior of the marsh and the western shoal of Ryer Island (fig. 61). The distributions of the fishes and Sphaeromatid isopod diet groups were focused in the marsh, with sporadic incidents of occurrence from the shoal and channel strata. During the summer, amphipod groups were replaced by decapods (shrimp) and Idoteid isopods (fig. 62). High occurrences of decapods and Idoteid isopods were observed in diets from the shoal and channel while being virtually nonexistent in the marsh. As in spring, occurrence of the fishes and Sphaeromatid isopod groups in diets were focused primarily in the marsh and were rare in channel or shoal habitats. Although there were size differences in fishes captured, the differences in diet observed seem more likely because of habitat. The smaller shoal fishes often had diets similar to the larger fishes in marsh or channel habitat rather than having diets distinctly different from channel and marsh habitats.
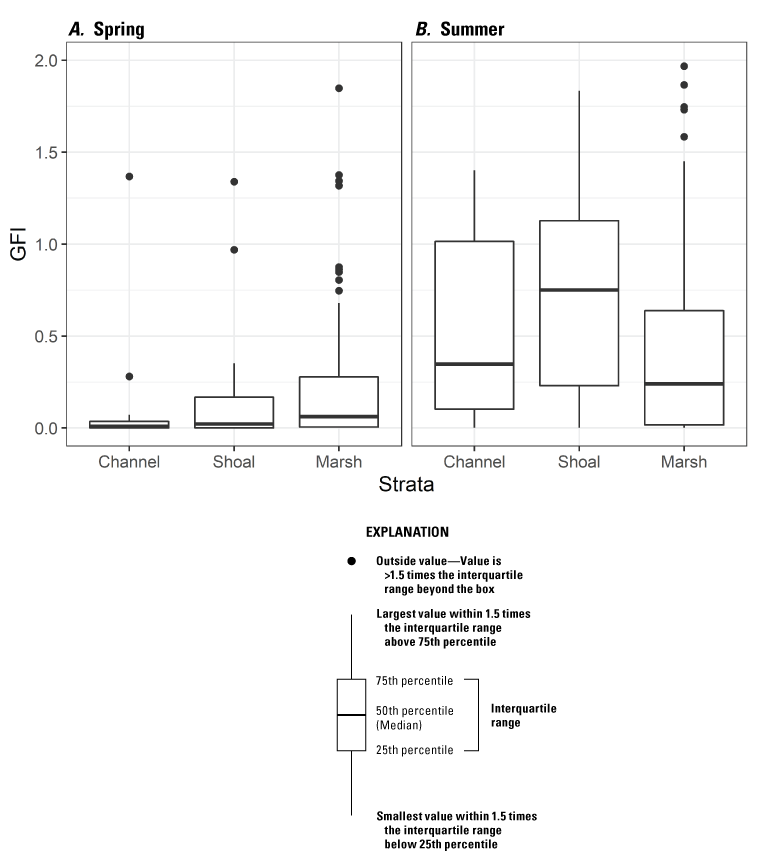
Gut fullness index (GFI) of Striped Bass (Morone saxatilis) collected during A, spring, and B, summer. Boxes range from the 25th to the 75th percentiles, with lines indicating the medians, whiskers representing 10th and 90th percentiles, and points representing data outside of the percentiles. The data are from Steinke and others (2019d), and the figure is adapted from Young and others (2022).
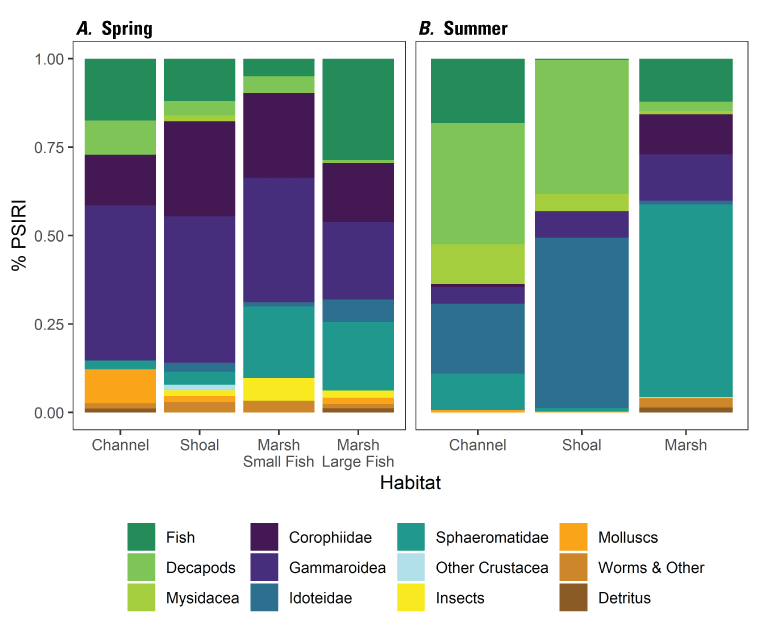
Percentages of major diet item groups of Striped Bass (Morone saxatilis) expressed as percent prey-specific index of relative importance (% PSIRI) by habitat strata (channel, shoal, marsh) and season; A, spring and B, summer. Percentages of major diet item groups of Striped Bass collected from marsh habitats in spring were further separated into sample populations of large (greater than 250 millimeters standard length) and small (less than 250 millimeters standard length) fish. The data are from Steinke and others (2019d), and the figure is adapted from Young and others (2022).
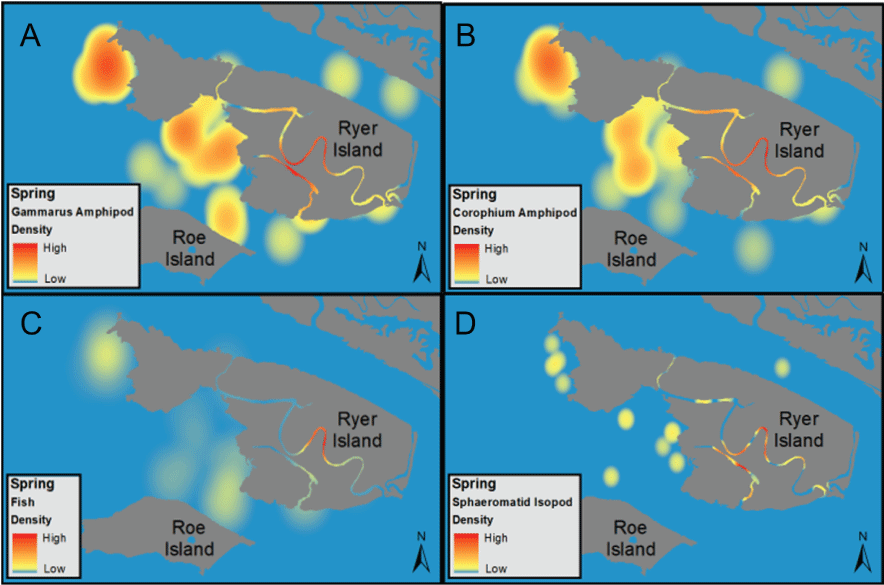
Spatial distributions of occurrences of the four most important prey groups found in diets of Striped Bass (Morone saxatilis) during the spring: A, Gammarus amphipods; B, Corophium amphipods; C, fishes; and D, Sphaeromatid isopods. Areas in red correspond with high density, while areas in blue correspond with low density; density gradients for each prey group are based on data shown in figure 60 from Steinke and others (2019d). Base layer source data obtained from California State Geoportal (CSG; California Department of Technology, 2022). The data are from Steinke and others (2019d), and the figure is adapted from Young and others (2022).
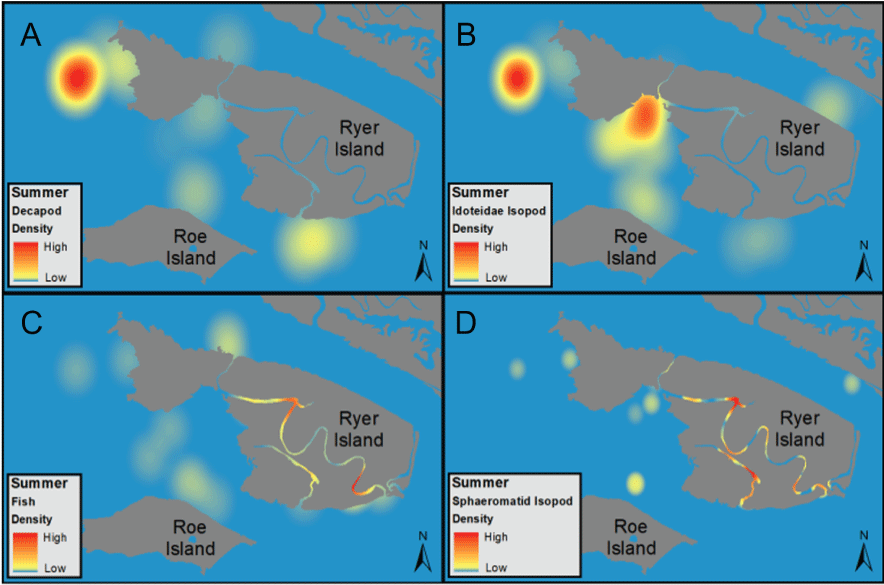
Spatial distribution in the occurrence of the four most important prey groups found in diets of Striped Bass (Morone saxatilis) during the summer: A, decapods; B, Idoteid isopods; C, fishes; and D, Sphaeromatid isopods. Areas in red correspond with high density, while areas in blue correspond with low density; density gradients for each prey group are based on data shown in figure 61. The data are from Steinke and others (2019d), and the figure is adapted from Young and others (2022). Base layer source data obtained from California State Geoportal (CSG; California Department of Technology, 2022).
We used patterns illustrated in figures 60–62 to infer general conclusions about fish diets: (1) fish diets change through time within a year because prey items vary in abundance and (2) various habitats (marshes versus channels) will favor production of some prey items over others. Thus, the relative importance of each habitat type as feeding areas for fishes and other organisms is dynamic and will vary in through time and space. A mosaic of habitat types could provide more reliable food resources for fishes as prey abundance changes through time.
Cache Slough Complex I: Little Holland Tract and Liberty Island Conservation Bank
Fish
Habitat type, heterogeneity, and complexity affect biotic assemblages in tidal wetlands (Odum and others, 1984; Moyle and others, 2010). Specific geomorphic factors such as channel-network order or subtidal-bank slope can greatly affect the richness and density of fish assemblages and relative food availability for fishes (McIvor and Odum, 1988; Visintainer and others, 2006; Allen and others, 2007). Thus, we expected that different fish assemblages could be found in neighboring habitat patches in a region because of the region’s unique geomorphic features. As described in previous sections, Little Holland Tract, Liberty Island Conservation Bank, and the connecting channels in the local area differ in many aspects of hydrodynamics, geomorphic characteristics, and water-quality conditions. This diversity of habitat provides a unique opportunity to make site-level comparisons in a local area with minimal effects of regional variation.
In our first Cache Slough Complex study, we analyzed data collected from Little Holland Tract, Liberty Island Conservation Bank, and unrestored connecting channels (UNR) to understand how fish abundance and community composition varied in response to the geomorphic differences found among sites. We sampled fishes in Little Holland Tract, Liberty Island Conservation Bank, and UNR from January 2017 to May 2018 using gill nets and otter trawls during the following seasons (1) winter (December–February), (2) spring (March–May), (3) summer (June–August), and (4) fall (September–November). In total, we collected 89 otter trawl and 194 gill-net samples (fig. 63).
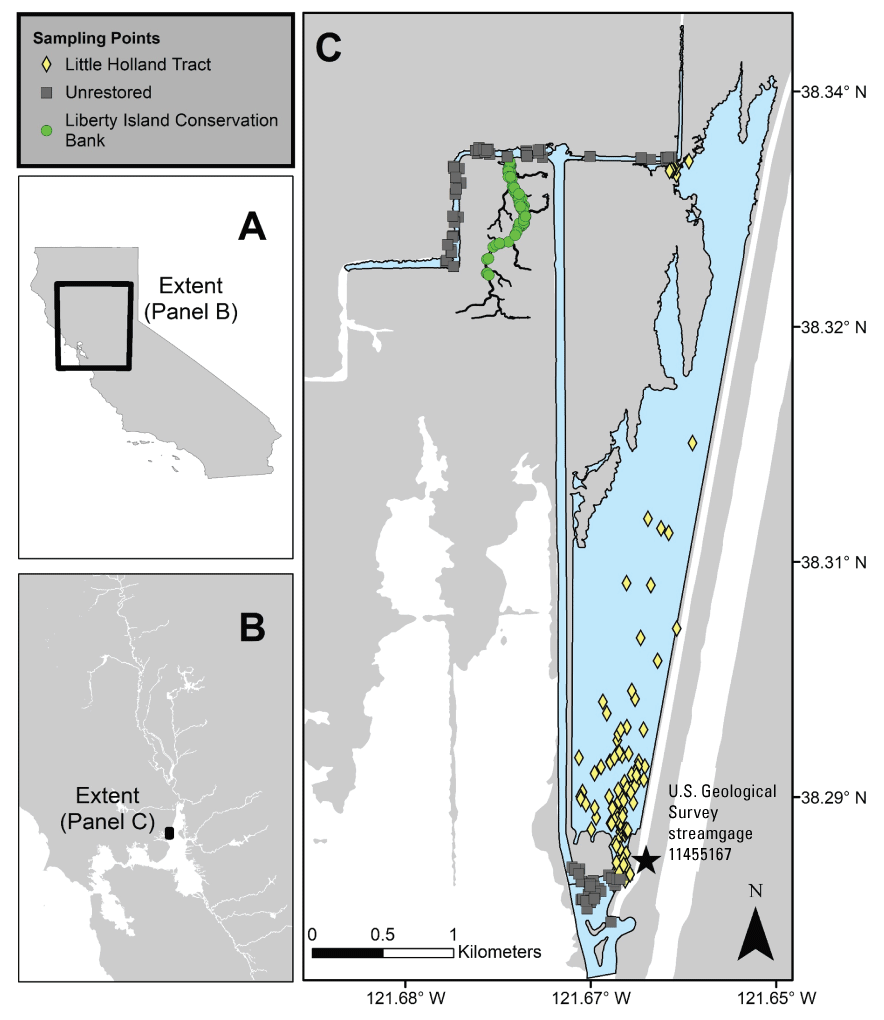
Cache Slough Complex (fig. 3) fish-sampling locations (Farruggia and others, 2019). The Cache Slough Complex includes Cache and Lindsey Sloughs, the Sacramento Deep Water Ship Channel, the Toe Drain, Liberty Island, Little Holland Tract, and associated connecting channels, including the stairsteps at the northern end of Liberty Island. Map panels show increasing level of resolution of study area: A, location in California; B, location in the Sacramento–San Joaquin Delta; and C, individual sampling sites and U.S. Geological Survey station 11455167 (U.S. Geological Survey, 2022; station LHTse in table 1). Base layer source data obtained from California State Geoportal (CSG; California Department of Technology, 2022).
We collected a total of 2,437 fish: 1,731 in gill nets and 706 in otter trawls. We observed 28 species, 10 of which were native (table 6). Water-quality parameters measured with a YSI EXO2 multiparameter sonde at each net deployment showed similar water temperature (degrees Celsius [°C]), turbidity (FNU), chlorophyll-a fluorescence (µg/L), dissolved-oxygen concentration (mg/L), and pH among the three sample areas. Specific conductance (microsiemens per centimeter at 25 degrees Celsius [µS/cm at 25 °C]) and fluorescent dissolved-organic matter (DOM) were highest in Liberty Island Conservation Bank, lowest in Little Holland Tract, and intermediate in UNR. Values outside of the physiological tolerances of the fishes were not recorded at any point during the study (Moyle, 2002).
Table 6.
Fish catch (and percentage catch) by gear type and by site (Farruggia and others, 2019).[Rows with an asterisk (*) show data for native fishes. Abbreviations: —, no data; <, less than]
Qualitative assessments of the data indicated that fish assemblages differed with sampling gear and season (Farruggia and others, 2019). Fish assemblages in Little Holland Tract and Liberty Island Conservation Bank were different for gill nets and otter trawls. Fish assemblages in Liberty Island Conservation Bank were also different from those in unrestored channels (UNR) for gill-net samples. Differences in gill-net samples were mainly caused by different abundances of White Catfish, Sacramento splittail, Striped Bass, Sacramento pikeminnow, and Sacramento Sucker. Differences in otter trawl samples were mainly caused by threadfin shad, Black Crappie, American shad, Chinook salmon (fall run), and White Catfish.
In general, abundance of fishes was related to depth and distance of the sample site to the nearest breach giving access to a connecting channel (UNR; fig. 64). Region was not included in the best-fitting model for otter trawls, thus there are no predicted differences across habitats for otter trawls (single black lines; fig. 64A). Overall catches were higher at high elevation and low stage (shallow), probably because the trawl sampled a larger proportion of the water column. Otter trawl catches were also higher at intermediate distances from the breach. For gill nets (fig. 64B), Little Holland Tract showed higher counts of fishes at intermediate distances from breach and higher counts of fishes at low elevation and high stage (deep water). For gill nets set in Liberty Island Conservation Bank, counts of fishes associated with elevation and stage were static but were higher with increased distance from breach.
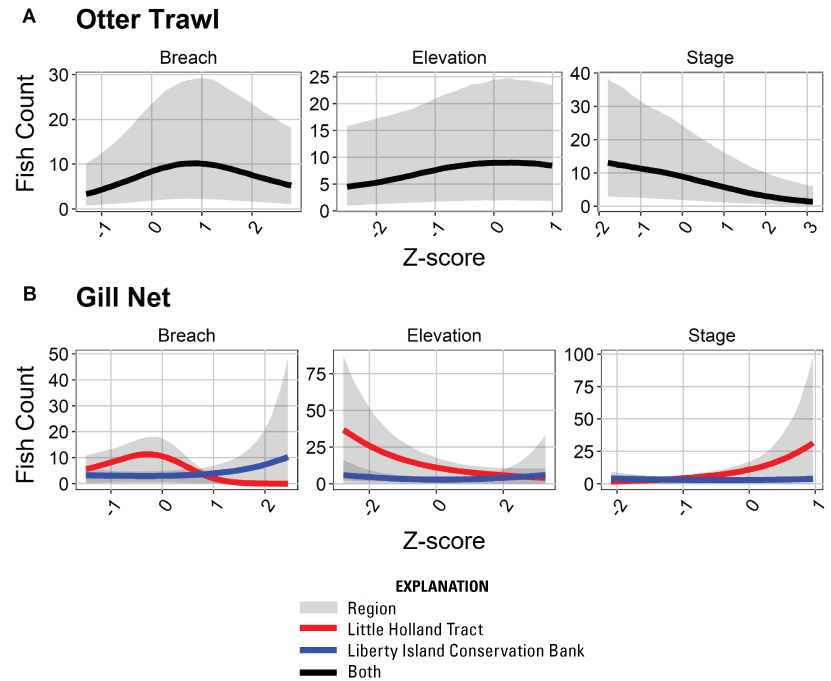
Marginal effects plots showing relations between fish counts and Z-scores for each parameter included in the best-fitting models (Farruggia and others, 2019); parameters included elevation (in feet relative to the North American Vertical Datum of 1988 [NAVD 88]), stage (in feet), and distance from breach (in kilometers). Each parameter was separated by gear type: A, otter trawl; and B, gill net. Region was not included in the best-fitting model for otter trawls (A), thus there are no predicted differences across habitats for otter trawls (single black line). Data were obtained from Farruggia and others (2019).
We used the catch data to map predicted catch per unit effort (CPUE; fishes per 5-minute otter trawl or fishes per 1-hour gill-net set) of fishes given stage, elevation, and distance from breach. Predicted CPUEs varied between the restored wetlands. For Little Holland Tract gill nets, the highest predicted CPUEs were near breaches, with low values near the center of the tract (fig. 65). For otter trawls, predicted CPUEs were relatively evenly distributed across Little Holland Tract. For gill nets in Liberty Island Conservation Bank, predicted CPUEs were lower than at the Little Holland Tract southern breach but were consistent across Liberty Island Conservation Bank (fig. 65). Similarly, predicted CPUEs in Liberty Island Conservation Bank based on otter trawls were relatively low at the confluence of UNR but relatively even through the rest of the site.
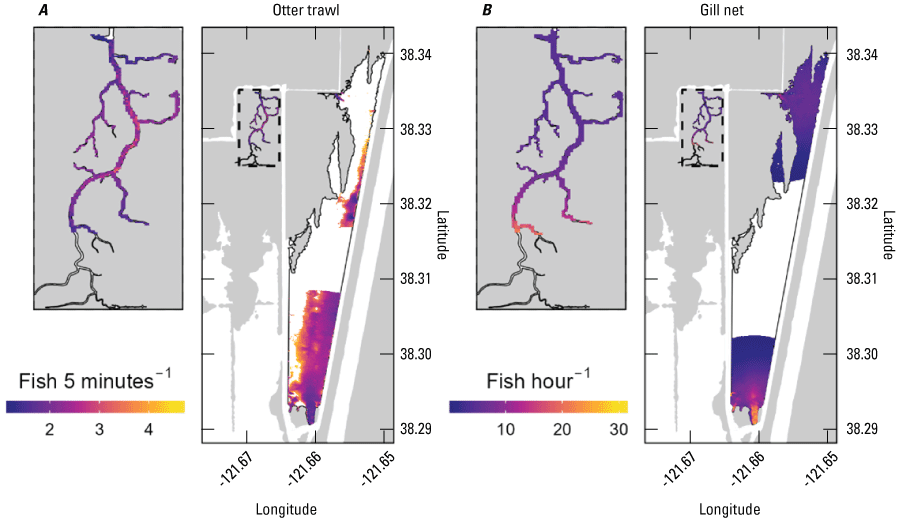
Maps of predicted fish catch per unit effort (CPUE) within Little Holland Track and Liberty Island Conservation Bank (outlined in black), and a separate enlarged panel for Liberty Island Conservation Bank (see inset). Predicted CPUEs were generated based on an ensemble of all models with model weights greater than 5 percent and set for mean tide for each sampling gear in each wetland for summer 2017 (Farruggia and others, 2019). Blank areas within the study region represent areas which were inaccessible to sampling, and predictions of fish CPUE values are based on out-of-sample prediction and so were excluded. Part (A) represents otter trawl predicted CPUEs and part (B) represents gill-net predicted CPUEs.
The results of this study indicate that the different geomorphologies of Little Holland Tract (shallow flooded island) and Liberty Island Conservation Bank (dendritic channel system) are having measurable effects on species composition of the fish community and the distribution of fishes in the different wetlands. The relatively high percentages of native fishes captured in Liberty Island Conservation Bank compared to Little Holland Tract (table 6) support the idea that restored tidal wetlands that resemble historical wetlands by having dendritic-channel systems are better able to support native fishes. The exception was Sacramento splittail, a species adapted for seasonal floodplains that comprised a high percentage of the catch in Little Holland Tract. The high tidal exchange of Little Holland Tract with the unrestored channel (UNR) and high similarity of the fish communities indicate that fishes, especially Sacramento splittail, are moving into Little Holland Tract from UNR rather than Liberty Island Conservation Bank and maintaining a unique resident fish community. Sacramento splittail are adapted for spawning and feeding in seasonal floodplains and may be better able to use the transient habitat of Little Holland Tract compared to other native fishes. The Little Holland Tract fish community, as sampled by the otter trawl, was dominated by American shad (table 6), a highly mobile pelagic species. These results were consistent with the relatively high catches in the middle of the island (fig. 65).
To better understand fish movement across habitat types, we developed methods for assessing fish movement in and out of tidal wetlands. This study element used Adaptive Resolution Imaging Sonar (ARIS) sonars to observe the timing of fishes moving through levee breaches and channel mouths in response to tide and time of day at Liberty Island Conservation Bank and Little Holland Tract (fig. 66). Data for preliminary analysis were selected from a 2018 dataset collected continuously for 25 days from April 14 to May 9, 2018. We analyzed a tidal cycle (for about 1 day) at the beginning and end of a spring-neap cycle. The data indicated some differences in fish movement patterns between Little Holland Tract and Liberty Island Conservation Bank. Although results are mixed, the general pattern indicates that fishes move into Little Holland Tract during the flood tide (fig. 67), which is consistent with otter-trawl and gill-net results. The direction of movement in Liberty Island Conservation Bank was less consistent, and fishes moved into or away from the entrance at any time in the tidal cycle (fig. 68). This information indicates that the largely intertidal nature of Little Holland Tract forces fish movements in and out across tidal phases, while the subtidal channels in Liberty Island Conservation Bank allow for volitional movement regardless of tidal phase.
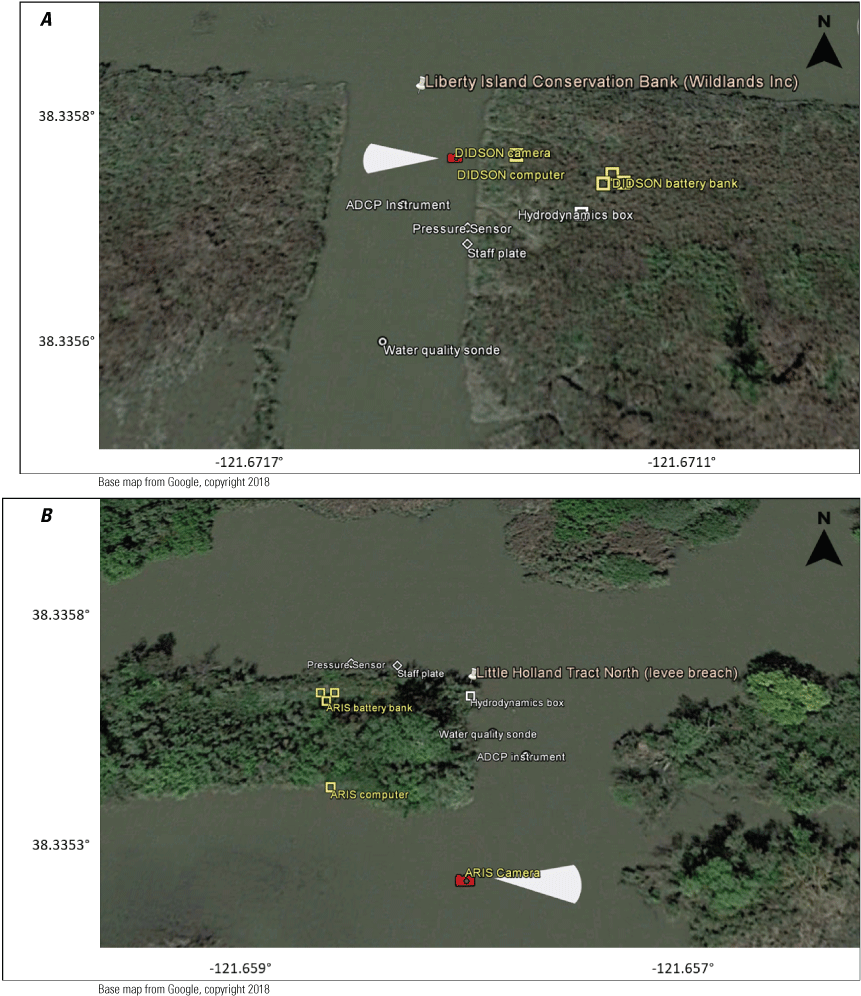
Deployments of acoustic cameras, fixed acoustic Doppler current profilers (ADCPs), and other instruments at A, Liberty Island Conservation Bank tidal wetland entrance (U.S. Geological Survey station 382006121401601, U.S. Geological Survey, 2022; station LICB in table 1) and B, Little Holland Tract tidal wetland entrance (U.S. Geological Survey station 11455143, U.S. Geological Survey, 2022; station LHTn in table 1; Ayers, 2020). A dual-frequency Identification Sonar (DIDSON) acoustic camera was used at A, Liberty Island Conservation Bank, and an Adaptive Resolution Imaging Sonar (ARIS) acoustic camera was used at B, Little Holland Tract.
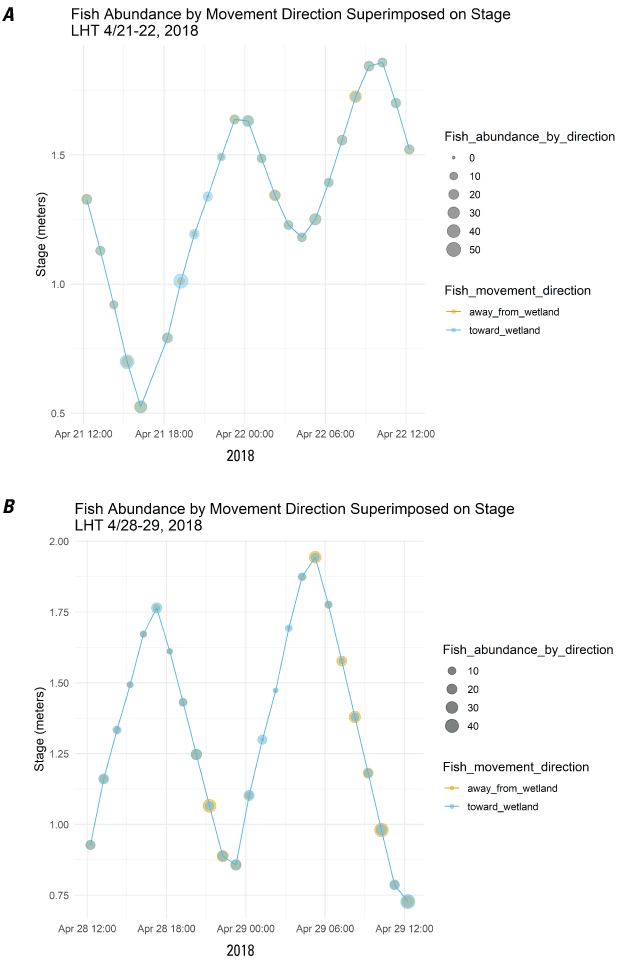
Fish abundance and movement direction (Ayers, 2020) superimposed on stage record at Little Holland Tract (U.S. Geological Survey station 11455143, U.S. Geological Survey, 2022; station LHTn in table 1) for A, April 21–22, 2018, and B, April 28–29, 2018.
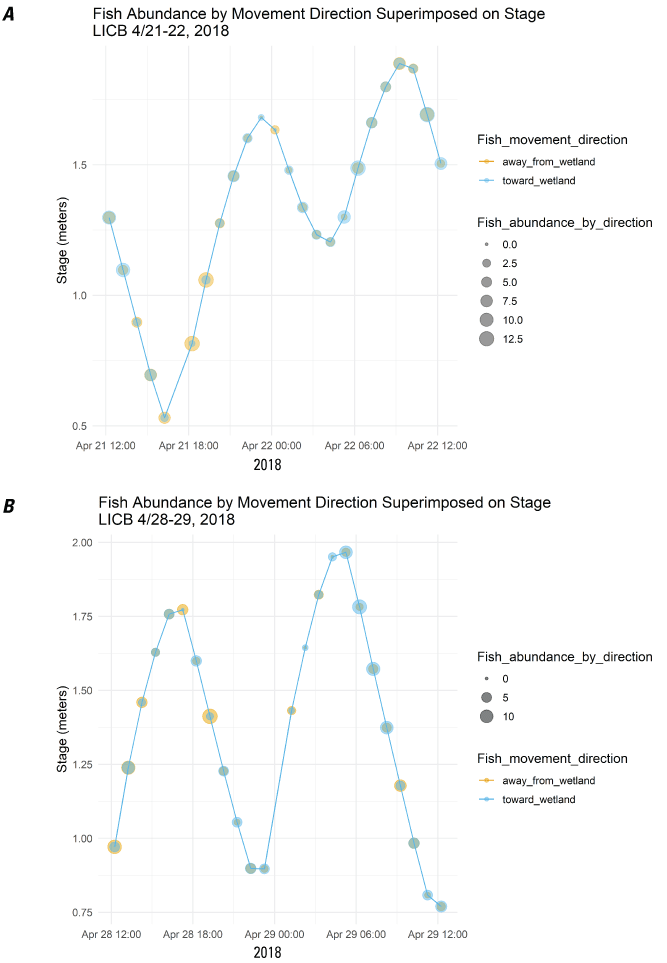
Fish abundance and movement direction (Ayers, 2020) superimposed on stage record at Liberty Island Conservation Bank (U.S. Geological Survey station 382006121401601; U.S. Geological Survey, 2022; station LICB in table 1) for A, April 21–22, 2018, and B, April 28–29, 2018.
Zooplankton
Methods of augmenting food supply, particularly zooplankton, for fishes has been a topic of interest in the upper San Francisco Estuary (Herbold and others, 2014). There is an ongoing debate about whether tidal marshes serve as a source of zooplankton to nearby habitats with much larger volume than the wetland channels (Herbold and others, 2014). A key question in addressing this debate is determining the extent to which zooplankton act as neutral particles transported in and out with the tide, or whether zooplankton show behavior that allows for habitat choice. If zooplankton are transported as neutral particles, they do not have sufficient time in the wetland to reproduce and reach high densities that might provide a subsidy to the large neighboring habitat because most of the zooplankton are advected out of the wetland on the ebb tide and then diluted in the higher volume habitat. However, if zooplankton behavior allows for habitat choice, then simple analysis of water movements will be insufficient to characterize zooplankton subsidies across habitats. We explored these dynamics by examining net zooplankton fluxes between Little Holland Tract and Liberty Island Conservation Bank and the surrounding channels.
Sampling happened hourly for a complete 25-hour tidal cycle across two sampling events (spring and neap tides) in August 2017. Zooplankton samples were collected at two sites (fig. 69) using a 0.5 m x 2 m, 102-micrometer (μm) mesh net towed subsurface for one minute. Mean zooplankton densities were not significantly different between Little Holland Tract and Liberty Island Conservation Bank (Kruskal-Wallis test; α=0.05, p=0.16); however, zooplankton densities were significantly higher at night than during the day (p<0.0001), which was largely driven by an increase in juvenile and adult calanoid copepods (Pseudodiaptomus forbesi, Sinocalanus doerri, other calanoids, and calanoid copepodites) at night. Zooplankton densities did not differ across the spring/neap cycle. The neap-tide data showed a small influx of zooplankton on the flood tide and a large outflux of zooplankton during the ebb tide (fig. 70), resulting in an overall outflux (fig. 71). During the spring tide, the same influx during flood tide was noted; however, the outflux on the ebb tide was greatly attenuated, presumably because ebb tide happened during the day (fig. 70). The result was an overall influx of zooplankton into Little Holland Tract and Liberty Island Conservation Bank (fig. 71). This interaction of tide with time of day has only briefly been considered in previous discussions of zooplankton flux in the San Francisco Estuary (Kimmerer and others, 2018). These results (figs. 70 and 71) indicate that interactions between tide and time of day could affect taxa-specific movements across habitat boundaries.
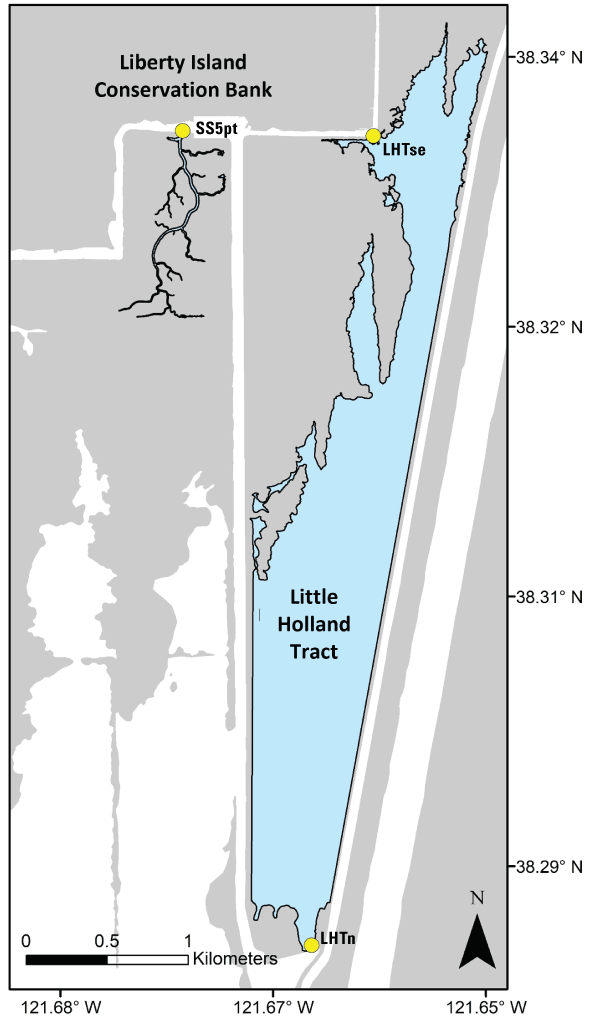
Locations of U.S. Geological Survey (USGS) streamgages (yellow dots; U.S. Geological Survey, 2022) at Liberty Island Conservation Bank (SS5pt; Liberty Island at Upper Stair Step near Five Points, California; USGS station 382010121402301) and Little Holland Tract (LHTse; Prospect Slough at Toe Drain near Courtland; USGS station number 11455167; LHTn; Little Holland Tract at North Breach near Courtland; USGS station number 11455143) used to estimate flows. Base layer source data obtained from California State Geoportal (CSG, California Department of Technology, 2022).
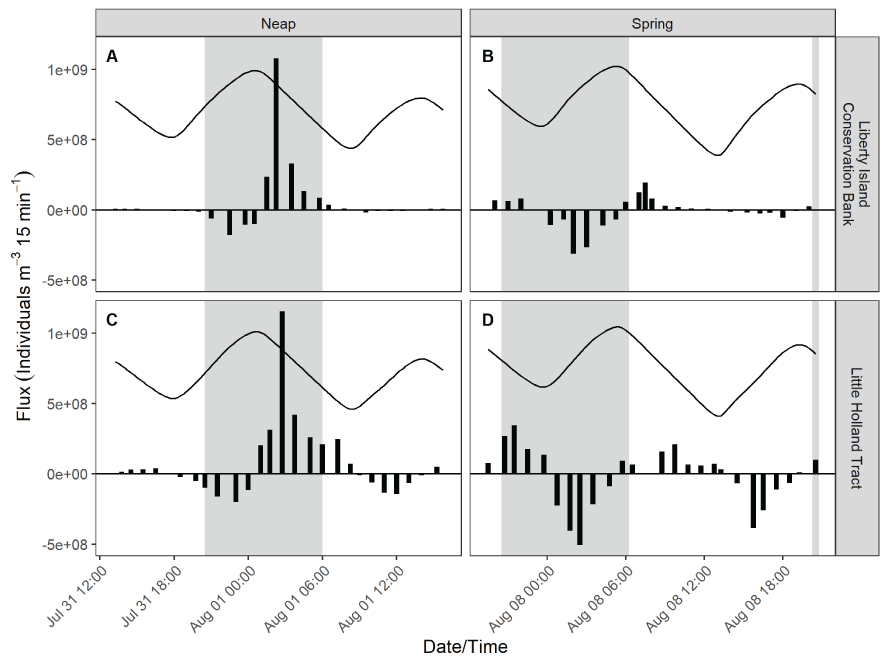
Flux of zooplankton (Enos and others, 2020) plotted as the number of individuals per cubic meter per 15-minutes (individuals m−3 15 min−1) during the sampling periods for neap and spring tides at Liberty Island Conservation Bank (A and B) and Little Holland Tract (C and D). Shaded areas denote night, and unshaded areas denote day. The black line shows stage at each sampling point and is not to scale. Positive values are movement of zooplankton out of the habitats, negative values are movement of zooplankton into the habitats.
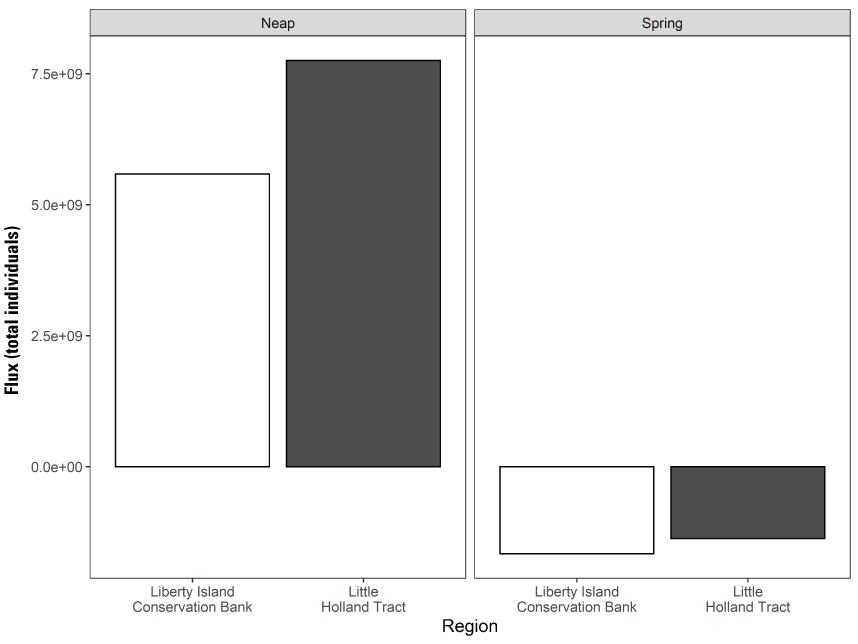
The total flux of zooplankton (Enos and others, 2020) during the neap- and spring-sampling periods for Liberty Island Conservation Bank and Little Holland Tract identified in figure 70. Positive values are movement of zooplankton out of the habitats, and negative values are movement of zooplankton into the habitats.
Cache Slough Complex II: Hydrodynamic-Physical Habitat Interactions
In this second part of our Cache Slough Complex studies, we examined ecological processes in relation to the LE ratio concept (figs. 13, 14). The tidal excursion between the upstream nontidal area and downstream tidal areas can affect transport of many chemical and biological constituents (salinity, sediment, nutrient, basal productivity) that affect fish abundance and distribution. We also explored how fish community structure in terminal channels of the Cache Slough Complex is shaped by interacting effects of the physical habitat template, hydrodynamics, and fish species’ natural history. We examined differences in fish distribution (as represented by the metric of total fish counts) and diversity (richness and community analyses) among habitat types (landward, within, and seaward of the tidal excursion) created by hydrodynamics in three separate terminal channels in the Cache Slough Complex; Lindsey Slough, Cache Slough, and an Aggregate Region composed of flooded agricultural tracts and distributary channels (figs. 57, 72). The Aggregate Region includes Liberty Island, Little Holland Tract, and most of the distributary channels to the north (fig. 72).
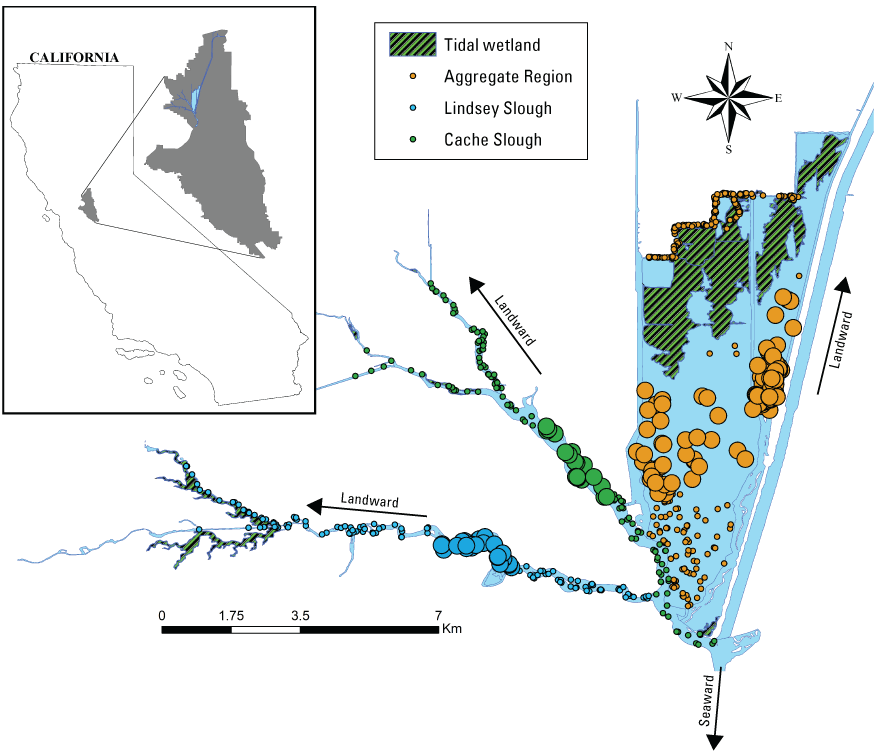
Gill-net sampling locations in the Cache Slough Complex relative to the position of the tidal excursion range in Cache Slough, Lindsey Slough, and the Aggregate Region (a region composed of flooded agricultural tracts and distributary channels that includes Liberty Island, Little Holland Tract, and most of the distributary channels to the north). The Cache Slough Complex includes Cache and Lindsey Sloughs, the Sacramento Deep Water Ship Channel, the Toe Drain, Liberty Island, Little Holland Tract, and associated connecting channels, including the stairsteps at the northern end of Liberty Island. Large symbols indicate samples taken in the tidal excursion range; small symbols indicate samples taken landward or seaward of the tidal excursion range. The data are from Steinke and others (2019d), and the figure is adapted from Huntsman and others (2023). Base layer source data obtained from California State Geoportal (CSG; California Department of Technology, 2022).
We collected fishes by deploying gill nets (each net was deployed for approximately 60 minutes) on 84 separate occasions, beginning on February 2, 2017, and ending on December 13, 2018. We deployed anywhere from 2 to 20 nets on a single sampling occasion, where sampling points in each terminal channel were randomly chosen. We targeted a minimum of 50 samples in a terminal channel during any sampling season, including spring (March–May), summer (June–August), and winter (December–February) of 2017 and 2018, with fall (September–November) also sampled in 2018. We recorded water temperature (°C), specific conductance (μS), turbidity (NTU), pH, dissolved-oxygen concentration (mg/L), chlorophyll-a concentration (μg/L), and dissolved organic matter concentration (quinine sulfate units, QSU) with a YSI EXO2 sonde. Lastly, we measured depth at three points along the gill-net transect and recorded tidal phase (high, low, ebb, flood).
We collected a total of 671 gill-net samples and captured 26 identified fish species, with Striped Bass, White Catfish, and Redear Sunfish being the most abundant species (table 7). Striped Bass were most abundant in Cache Slough, White Catfish were more abundant in the Aggregate Region, and Redear Sunfish were most abundant in Lindsey Slough. Striped Bass were most abundant in and below the exchange zone, and White Catfish were most abundant above the exchange zone. Water-quality and physical habitat variables were highly variable in the Cache Slough Complex among sloughs and relative to the exchange zone.
Table 7.
Fish catch from gill-net sampling by number (and percentage) and region.[Rows with an asterisk (*) indicate results for native fishes. See figure 73 for regions. Abbreviation: <, less than]
Because of insufficient sample sizes for several combinations of slough and habitat (exchange zones), we extrapolated species richness from species accumulation curves using a first order jackknife method to extrapolate species richness (Palmer, 1990). The highest extrapolated species richness was found above the tidal excursion in Cache and Lindsey Sloughs and within the tidal excursion for the Liberty Island region (fig. 73). For total counts, mixed effects linear models (Brooks and others, 2017) indicated there was a statistically significant interaction between slough and position relative to the tidal excursion (χ2=18.12, p=0.001). Tukey’s pairwise comparisons (emmeans package in program R; Lenth, 2019) indicated total counts were higher above the tidal excursion compared to within or below the tidal excursion in the Aggregate Region (p<0.05, fig. 74). Pairwise comparisons indicated that there were no statistically significant differences in counts relative to the tidal excursions in Cache or Lindsey Sloughs (p<0.05, fig. 74).
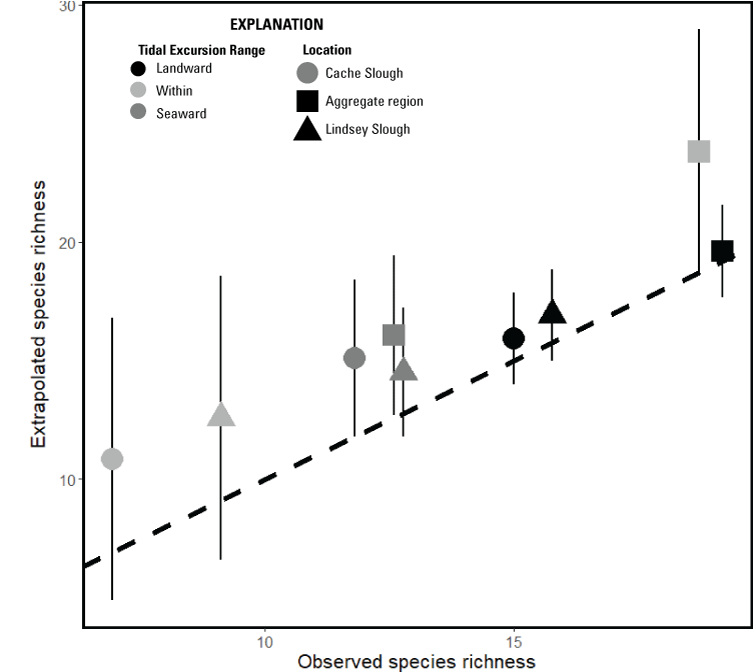
Extrapolated species richness relative to the tidal excursion range (landward, within, seaward) in each slough (Cache Slough, Aggregate Region, Lindsey Slough). The data are from Steinke and others (2019d), and the figure is adapted from Huntsman and others (2023). Points are means with 95-percent confidence intervals as the error bars. The broken line represents a 1:1 line between observed and extrapolated species richness.
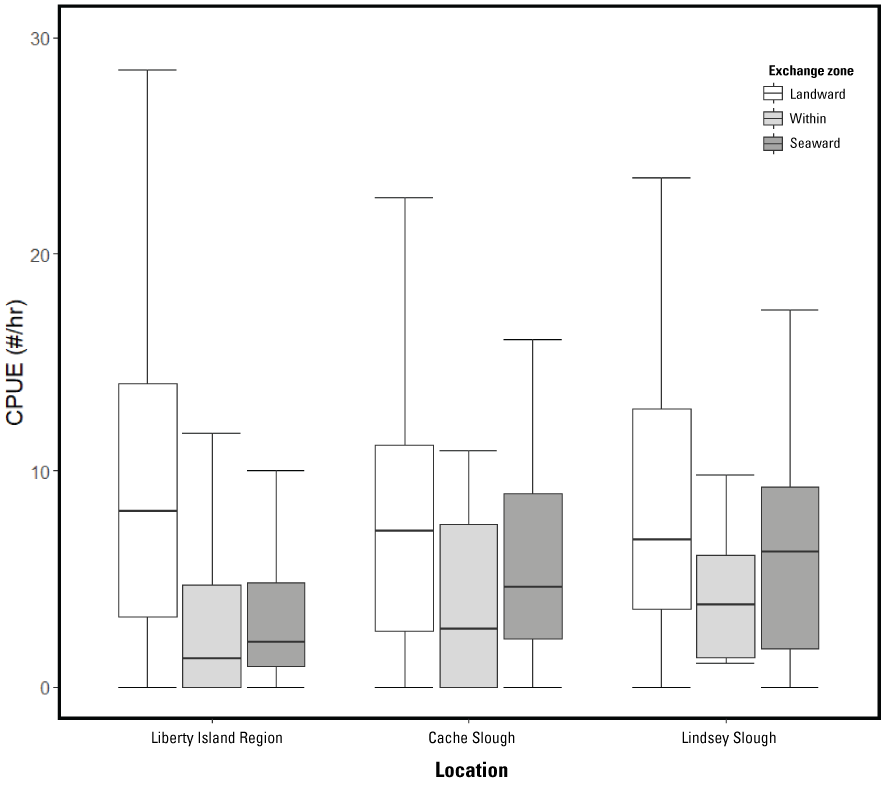
Total fish catch per unit effort (CPUE), in number of fishes per hour (#/hr) for Cache Slough, The Aggregate Region (a region composed of flooded agricultural tracts and distributary channels that includes Liberty Island, Little Holland Tract, and most of the distributary channels to the north), and Lindsey Slough by position relative to the tidal excursion (landward, within, seaward; Steinke and others, 2019d). The box represents the median and interquartile range (IQR), and the whiskers extend to 1.5 times the IQR. Points represent individual samples. The figure is adapted from Huntsman and others (2023).
Multivariate community analysis was performed with a PERMANOVA based on a Bray-Curtis dissimilarity matrix using the vegan package in program R (Oksanen and others, 2020). Analyses indicated that fish community structure was significantly affected by slough (F2,46=6.86, p<0.001), exchange habitat (F2,46=6.12, p<0.001), and season (F3,46=2.00, p=0.016). Similarity percentages analysis on the dissimilarity matrix (matrix of Bray-Curtis dissimilarity of all pairwise combinations) indicated that overall dissimilarity was highest when comparing the Aggregate Region with Cache Slough (overall dissimilarity=0.582) or Lindsey Slough (overall dissimilarity=0.581), with dissimilarity being lower between Cache and Lindsey (overall dissimilarity=0.487). Catfishes and Sacramento splittail catches per unit effort (CPUE) were higher in the Aggregate Region compared to the two sloughs. Lindsey Slough had higher Largemouth Bass CPUE than either the Aggregate Region or Cache Slough.
Similarity percentages analysis indicated that the CPUE of native Sacramento Sucker, tule perch, and hitch, and of introduced threadfin shad and crappie (Pomoxis spp.), were higher above the tidal excursion and contributed to significant dissimilarity in fish community structure when compared to the within (p-values<0.05 for all species mentioned) or below the tidal excursion (p-values<0.05 for all species mentioned). The CPUEs of the native pelagic fishes Sacramento pikeminnow and introduced pelagic fishes Striped Bass and American shad were higher below the tidal excursion compared to within the tidal excursion. Although the PERMANOVA identified significant dissimilarity in fish community structure among seasons, there were no common fish species identified to contribute to overall dissimilarity among seasons. Five life-history groupings were identified from the fish community dataset by hierarchical clustering analysis using the “hclust” function in the vegan R package (Oksanen and others, 2020). Count data were then aggregated into the five life-history groupings, and a hierarchical count-based regression model was developed using program JAGS (Plummer, 2017) to help understand how tidal excursion affected the types of fishes captured (table 8; fig. 75). Most fish clusters were more abundant upstream from the tidal excursion except for the pelagic fish cluster (Cluster 5; table 8). Turbidity also significantly affected cluster abundance, except for native fish group 1, which included Sacramento pikeminnow and hitch (Cluster 3). Counts of the benthic fishes (Cluster 1) and native fish group 1 (table 8; fig. 75), which include tule perch, Sacramento Sucker, and Sacramento splittail (Cluster 4), increased with turbidity, while counts of non-native littoral fishes (Cluster 2) and pelagic fishes (Cluster 5) decreased with turbidity (table 8). Counts of benthic fishes and the native fishes, which include tule perch, Sacramento Sucker and Sacramento splittail (Cluster 4), were higher closer to marsh habitat, while littoral fish counts were lower closer to marsh habitat (table 8). Benthic fishes (Cluster 1) were more common in deeper water, and pelagic fishes (Cluster 5) were associated with higher concentrations of chlorophyll-a.
Table 8.
Mean (lower, upper 95-percent credible intervals) parameter estimates and Bayesian p-values for count models fit to fish cluster counts in the Cache Slough Complex (Steinke and others, 2019d).[Parameters where the credible interval included 0 are indicated by NS. Bayesian p-values indicate poor model fit near values of 0 and 1, with best model fit at 0.5. Cluster definitions are provided in figure 75]
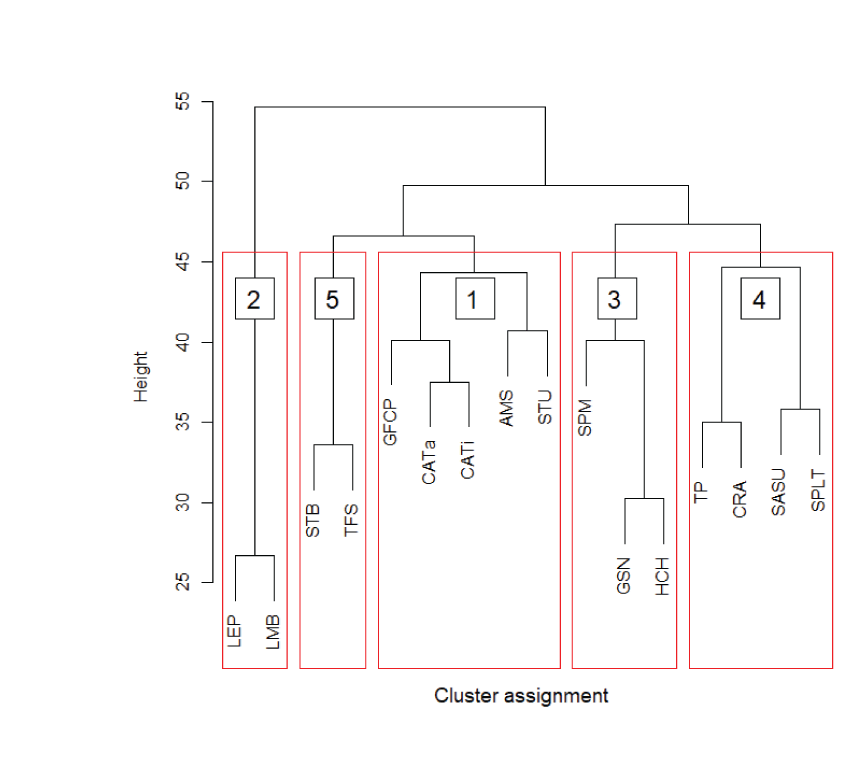
Cluster diagram of fishes captured in the Cache Slough Complex (fig. 3). The Cache Slough Complex includes Cache and Lindsey Sloughs, the Sacramento Deep Water Ship Channel, the Toe Drain, Liberty Island, Little Holland Tract, and associated connecting channels, including the stairsteps at the northern end of Liberty Island. Cluster assignments are 1, benthic; 2, littoral; 3, native species group 1; 4, native species group 2; and 5, pelagic species. Species abbreviations are LEP, all Lepomis species; LMB, Largemouth Bass; STB, Striped Bass; TFS, threadfin shad; GFCP, goldfish and common carp; CATa, Ameiurus catfishes; CATb, Ictalurus catfishes; AMS, American shad; STU, all sturgeon; SPM, Sacramento pikeminnow; GSN, golden shiner; HCH, hitch; TP, tule perch; CRA, all Pomoxis species; SASU, Sacramento Sucker; and SPLT, Sacramento splittail. The height represents the distance between clusters. Scientific names are provided in table 7, data are from Steinke and others (2019d), and the figure is adapted from Huntsman and others (2023).
Overall, the results of this study element indicate some important patterns in how organisms are using these dead-end slough habitats. Only the pelagic fishes cluster (Cluster 5) was not associated with distance from the tidal excursion range or distance from marsh. This observation of the pelagic fishes is consistent with the idea that pelagic fishes move freely throughout the Cache Slough Complex rather than being associated with any particular habitat or hydrodynamic feature. Threadfin shad, a common prey item of Striped Bass, is a filter feeder that consumes phytoplankton that would be expected to be associated with higher chlorophyll-a concentrations (indicator of phytoplankton food) and might select more turbid water to reduce predation risk from Striped Bass. The benthic fishes cluster (Cluster 1) is dominated by introduced species, except for sturgeon. This group is associated with upstream, deep, turbid habitats in channels that are closely associated with marsh habitats. The littoral fish cluster (Cluster 2), including Largemouth Bass and Lepomis sunfish, was most abundant in clear waters upstream from the tidal excursion range and not associated with marsh. These species are generally associated with submerged aquatic vegetation rather than marsh habitat (Conrad and others, 2016; Young and others, 2018). The native fishes cluster (Cluster 4) that includes tule perch, Sacramento splittail, and Sacramento Sucker was found in turbid areas upstream from the tidal excursion range and in the vicinity of tidal marsh habitat. This observation of native fishes is similar to the benthic fishes but without an association with deeper water. The native fish group 1 cluster (Cluster 3), which includes Sacramento pikeminnow and hitch, was similar to the pelagic cluster (Cluster 5) because it was associated with few of the tested variables. Cluster 3 was most abundant upstream from the tidal excursion range but was not associated with other variables. As discussed in the “Ryer Island” section, Sacramento pikeminnow appears to be a wide-ranging species, perhaps moving often in search of areas rich in prey. Little is known about hitch in the Delta. Adults are known to feed on zooplankton, and they may move to search out the highest densities of prey without regard to the other variables mentioned, similar to what we hypothesized for Sacramento pikeminnow.
The overall implication of the results is that fish communities appear to be dependent on areas upstream from the tidal excursion range rather than within or downstream from the tidal excursion range, except for mobile pelagic species that range widely. The filter-feeding clam, Corbicula, is most abundant downstream from the tidal excursion range in the Cache Slough Complex (see “Clam” section), which indicates that phytoplankton biomass eventually transported downstream from the tidal excursion range is at least partially consumed by clams rather than completely advected into downstream areas of the estuary.
In another application of the LE ratio concept in the Cache Slough Complex, we examined the hydrodynamic and ecological interactions in the Sacramento River Deep Water Ship Channel. The Sacramento River Deep Water Ship Channel is a man-made channel that was built to provide access for large, ocean-going vessels to the port of West Sacramento (not shown) at the northern end of the Sacramento River Deep Water Ship Channel (fig. 76). The Sacramento River Deep Water Ship Channel is long (approximately 42 km), has a uniform, consistent bathymetry (a central lane approximately 11 m deep with narrow benches approximately 2 m deep), and is terminal, meaning that it has no hydrologic inputs except at the downstream mouth. Thus, the Sacramento River Deep Water Ship Channel functions ecologically as a “dead-end channel,” but without the habitat variability (tidal marshes) that was important in the previous study (“Cache Slough Complex I” section of this report). Thus, the hydrodynamics of the system are relatively simple, and the formation of a tidal excursion is expected based on an LE ratio<1 (fig. 14). A previous study (Feyrer and others, 2017) established that there are gradients in physical and biological parameters with a unimodal peak in turbidity located partially along the Sacramento River Deep Water Ship Channel and specific conductance increasing consistently heading landward. The intermediate turbidity peak was associated with peaks in abundance of zooplankton, pelagic decapods, and pelagic fishes (Feyrer and others, 2017). In this section, we build on the previous section to better understand how hydrodynamic and hydrologic variability affect pelagic habitat, pelagic zooplankton and nekton, and trophic pathways.
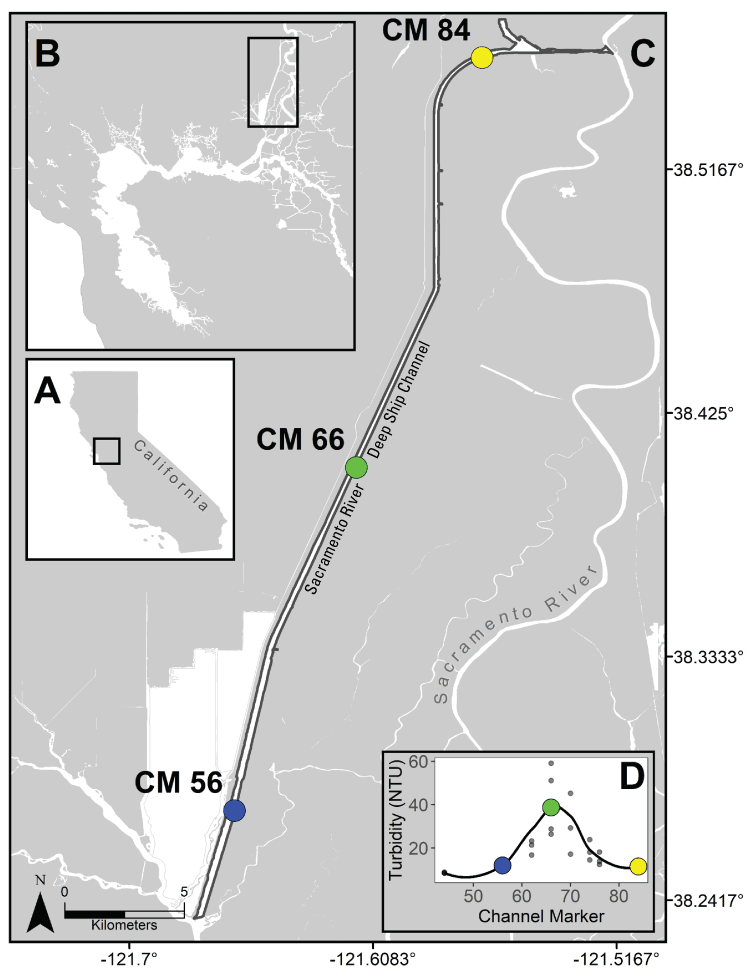
A, Location of the San Francisco Estuary within California and B, the Sacramento River Deep Water Ship Channel within the San Francisco Estuary, channel marker (CM) 56 (blue dot); CM 66 (Sacramento River Deep Water Ship Channel near Clarksburg; U.S. Geological Survey station 11455136; U.S. Geological Survey, 2022; green dot), CM 84 (yellow dot). C, sampling stations along the Sacramento Deep Water Ship Channel are noted circles. D, sampling stations were selected landward (CM 56; blue), within (CM 66; green), and landward (CM 84; yellow) of the local turbidity maximum. Plot shows sample sites along a loess curve through turbidity data (in Nephelometric Turbidity Units [NTU]) from Feyrer and others (2017). Base layer source data were obtained from California State Geoportal (CSG; California Department of Technology, 2022).
Sampling stations in this study were selected near three specific channel markers (CMs) within the Sacramento River Deep Water Ship Channel (fig. 76). The most seaward station (CM 56; table 1) was seaward from the mean tidal excursion in every sample season except for winter 2017, when CM 56 was at the mean tidal excursion (fig. 77). In all sampling periods, CM 56 was within the high-exchange zone (figs. 14, 77). The middle station (CM 66; table 1) was at or near the upstream extent of the low-exchange zone (figs. 14, 77). In all sampling periods, sampling station (CM 84; table 1) was >15 km landward from the uppermost extent of the low-exchange zone boundary (no-exchange zone; figs. 14, 77). Therefore, we used data from stations CM 56 (blue), CM 66 (green), and CM 84 (yellow) to categorize the high-, low-, and no-exchange zones, respectively, for analyses described in this section and for visual comparisons presented in figures 77–81.
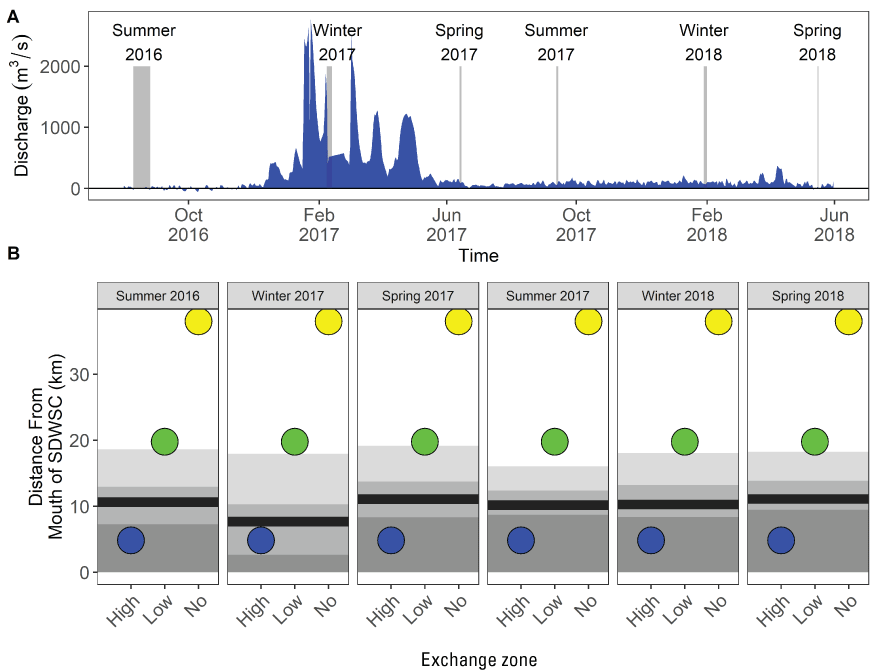
A, Seasonal variability in discharge (U.S. Geological Survey station 11455136; U.S. Geological Survey, 2022; station CM 66 in table 1) during the sampling period (summer 2016 through spring 2018), in cubic meters per second (m3/s), with sampling events noted by gray vertical bars. B, distance of each sampling location in the channel from the mouth of the Sacramento River Deep Water Ship Channel (SDWSC), in kilometers (km); channel marker (CM) 56 (blue dot); CM 66 (Sacramento River Deep Water Ship Channel near Clarksburg; U.S. Geological Survey station 11455136, U.S. Geological Survey, 2022; green dot), CM 84 (yellow dot). Mean tidal excursion within a season is noted with a solid black bar. Shaded gray shows the extent of hydrodynamic exchange along the channel for the month around the sampling period. Darkest gray denotes the high-exchange zone, lightest gray denotes the low-exchange zone, and white denotes the no-exchange zone (fig. 14). The data are from Larwood and others (2020), and the figure is adapted from Young and others (2020b).
We collected samples in three seasons, spring (May–June), summer (August–September), and winter (January–February) of two consecutive years (summer 2016 through spring 2018). Fishes and shrimp were captured by midwater trawl, zooplankton were captured with a plankton net, and water quality was measured with a portable YSI EXO2 sonde. Phytoplankton, dominant aquatic vegetation (emergent or submerged aquatic vegetation), particulate organic matter, zooplankton, and nekton were collected and analyzed for stable isotopes of carbon (C) and N to characterize food web pathways from primary producers (phytoplankton versus vegetation) to consumers.
Environmental and biological (densities of zooplankton and nekton) characteristics were compared using two‐way analysis of variance with station and season as factors. The results indicated that environmental and biological characteristics of the sampled habitats were consistently and significantly (p<0.05) different across exchange zones and seasons (fig. 78). Specific conductance increased from seaward to landward in most seasons, except in winter 2017 and spring 2017, when specific conductance was highest in the low-exchange zone (station CM 66; Larwood and others, 2020). Turbidity was highest in the low-exchange zone (station CM 66), except in winter 2017, when the high-exchange zone (station CM 56) was most turbid (fig. 79; Larwood and others, 2020). Chlorophyll-a concentrations generally increased from as the amount of exchange decreased, although in summer chlorophyll-a concentrations were highest in the low-exchange zone (station CM 66; fig. 78; Larwood and others, 2020). Seasonal chlorophyll-a patterns were weak, with the highest values in winter and lowest values in summer. Fluorescent dissolved organic matter (fDOM), an indicator of bioavailable detrital material, generally decreased as the amount of exchange decreased (from high- to low- to no-exchange), except in winter 2017, when the pattern was reversed (fig. 78).
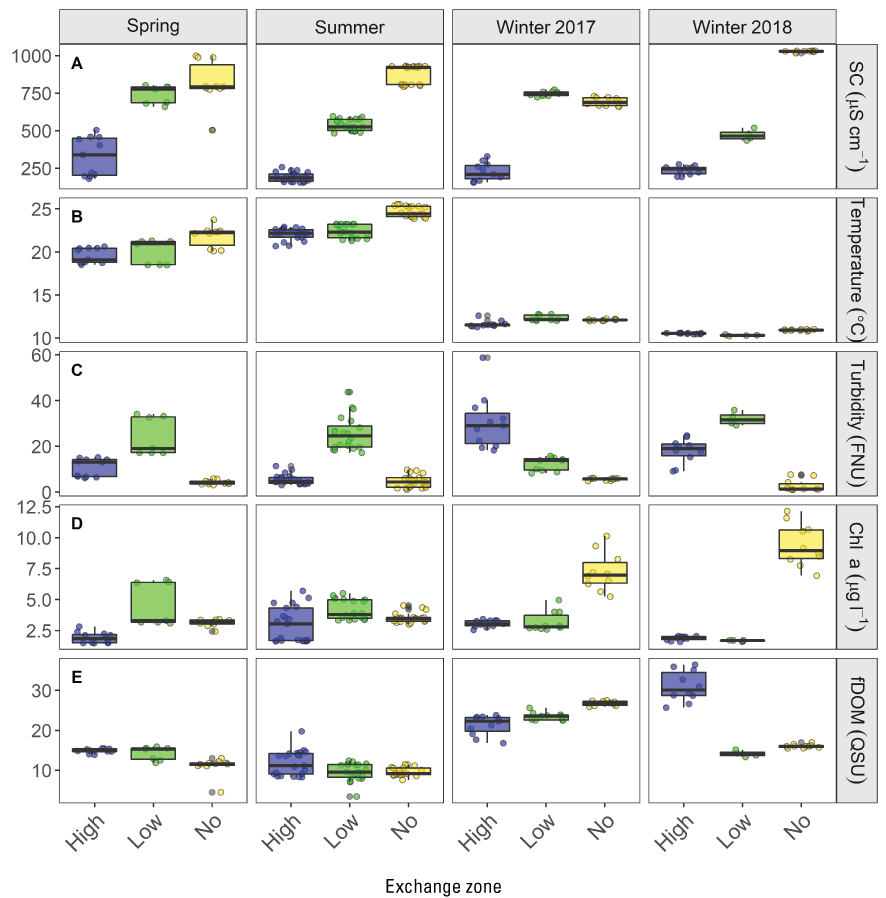
Sampled water-quality parameters associated with high- (CM 56, blue; table 1), low- (CM 66, green; table 1), and no-exchange (CM 84, yellow; table 1) zones as defined in figures 14 and 77. Spring and summer from different years are pooled because of low variability while winters are kept separate. Box represents the median and interquartile range (IQR), and the whiskers extend to 1.5 times the IQR. Points represent individual samples: A, Specific conductance (SC) is in units of microsiemens per centimeter at 25 degrees Celsius (µS/cm at 25 °C); B, temperature is in degrees Celsius (°C); C, turbidity is in Formazin Nephelometric Units (FNU); D, chlorophyll-a concentration (Chl-a) is in micrograms per liter (µg/L); and E, fluorescent dissolved organic matter (fDOM) is in quinine sulfate units (QSU). The data are from Larwood and others (2020), and the figure is adapted from Young and others (2020b).
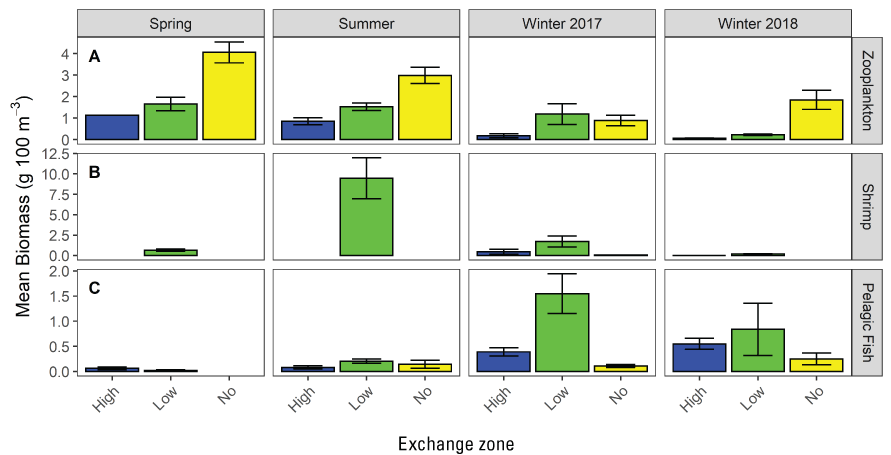
Biomass of pelagic community constituents in high- (CM 56, blue; table 1), low- (CM 66, green; table 1), and no-exchange (CM 84, yellow; table 1) zones, in grams per 100 cubic meters (g 100 m−3), with colored bars representing the mean and whiskers representing the standard error: A, Zooplankton densities, converted to match units for B, shrimp and C, pelagic fishes. The data are from Larwood and others (2020), and the figure is adapted from Young and others (2020b).
Zooplankton densities were highest in the low-exchange zone (station CM 66; table 1; fig. 73; Larwood and others, 2020), and zooplankton groups known to be important to local pelagic fishes (calanoid copepods and Cladocera; Slater and Baxter, 2014) showed similar patterns. Zooplankton community composition varied greatly (PERMANOVA; p<0.05) with exchange zone and season largely because of increased density of cladocerans in the no-exchange zone (station CM 84) relative to low- (CM 66) and high-exchange (CM 56) zones. Seasonal differences were driven largely by typical local species turnover (Kimmerer and others, 2018) in the copepods.
Siberian prawn (Exopalaemon modestus) dominated the nekton (fig. 79; 89 percent of total organisms and 84 percent of nekton biomass) and were overwhelmingly sampled in the low-exchange zone (station CM 66, table 1). Of the 15 fish species observed, threadfin shad and American shad were the most abundant (8 percent of nektonic organisms and 75 percent of sampled fishes). Two additional small-bodied pelagic fish species were collected, delta smelt (n=6) and wakasagi (Hypomesus nipponensis; n=4). Collectively, these four species represent the sampled pelagic-fish community and were included for food-web analysis. Pelagic fish densities were highest in the low-exchange zone (station CM 66) in all seasons except for spring, when densities were highest in the high-exchange zone (CM 56, table 1; fig. 79). Pelagic communities were compared using PERMANOVA with exchange zone and season as factors. The results indicated that the pelagic nekton community did not differ across exchange zones or seasons (PERMANOVA; all p>0.05).
Based on results from stable isotope analyses, proportions of consumer diets composed of phytoplankton and detrital food-web pathways varied by season (fig. 80). Calanoid and cladoceran zooplankton groups were consistently more reliant on the phytoplankton pathway across all seasons and exchange zones (fig. 80). Shrimp were largely reliant on the detrital pathway, and the phytoplankton pathway only comprised a large proportion of the diet in the high-exchange zone (CM 56, table 1) in winter 2017. Fishes were more complex. Threadfin shad are omnivorous filter feeders and may feed directly on phytoplankton or feed on zooplankton and other organisms that have used one of the phytoplankton or detrital food-web pathways or a mixture of the two. Delta smelt and American shad primarily consume zooplankton, but as noted for threadfin shad, the invertebrates they consume can use variable food-web pathways at different places and times. For example, although threadfin shad diets were numerically dominated by zooplankton (calanoid copepods and cladocerans), ostracods, harpacticoid copepods, insects, and amphipods were all consumed variably in space and time. These taxa were not included in the stable isotope analysis of this study, but likely drive the contribution of detritus to the diets of threadfin shad and other pelagic fishes (Grimaldo and others, 2009b; Young and others, 2020a).
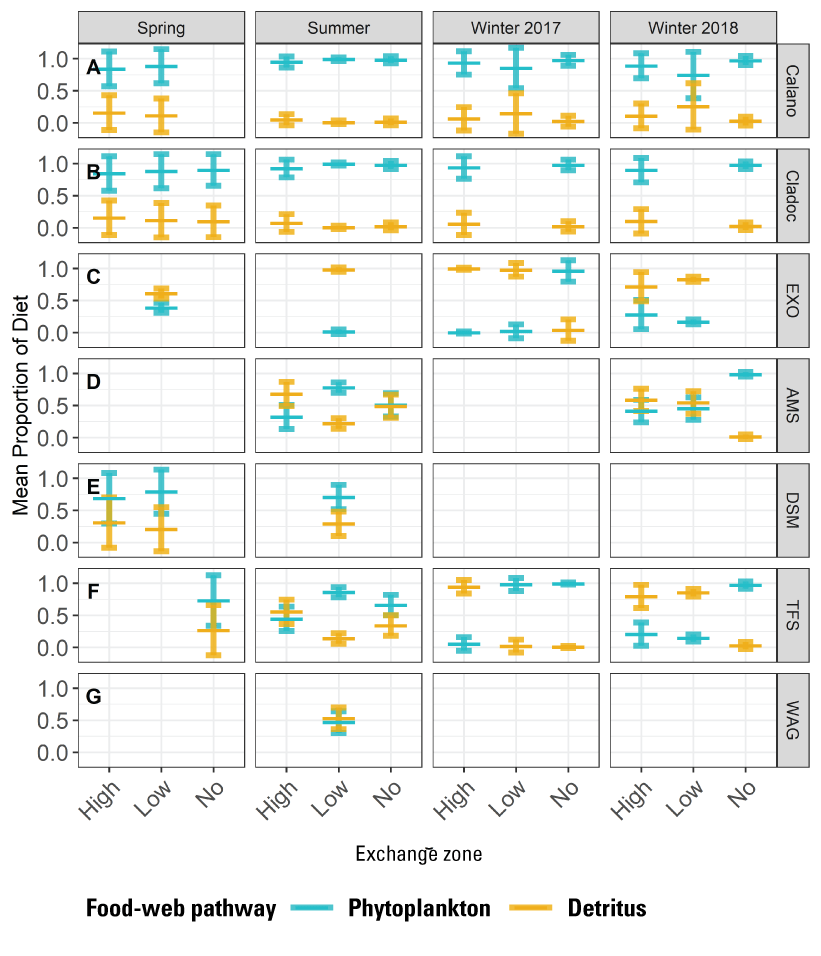
Mixing model results, presented as means and standard deviation of model posterior distributions among seasons and exchange zones (Young and others, 2020b). Plot includes A, zooplankton (Calano=Calanoid copepods); B, Cladoc (Cladocera); C, nekton (EXO=Siberian prawn, Exoplaemon modestus); D, AMS (American shad, Alosa sapidissima); E, DSM (delta smelt, Hypomesus transpacificus); F, TFS (threadfin shad, Dorosoma petenense); and G, WAG (wakasagi, Hypomesus nipponensis). The high-, low-, and no-exchange zones are based on data from sites CM 56, CM 66, and CM 84, respectively (table 1). The data are from Larwood and others (2020), and the figure is adapted from Young and others (2020b).
In general, the contribution from the phytoplankton pathway was most in the no-exchange zone, and the contribution from the detrital pathway was most consistent in the high-exchange zone. The phytoplankton pathway generally comprised a higher proportion of the diets in the low-exchange zone (CM 66, table 1) in summer and in winter 2017, and the detrital pathway comprised a higher proportion of the diets in the low-exchange zone (CM 66, table 1) in winter 2018. The contribution from differing primary producer pathways to pelagic biomass changed seasonally and among exchange zones (fig. 81). The relative importance of the phytoplankton pathway to total pelagic biomass was always highest in the no-exchange zone (CM 84, table 1). The contribution of the detrital pathway in the low-exchange zone (station CM 66, table 1) always exceeded 50 percent.
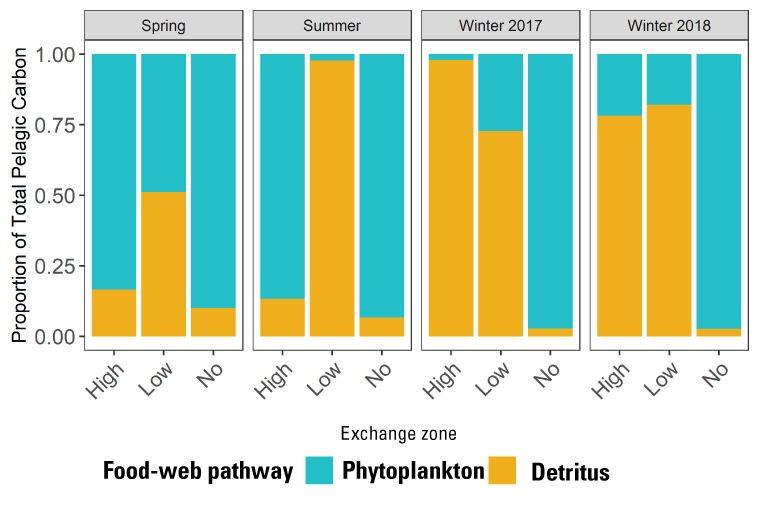
Proportion of total pelagic carbon (zooplankton, shrimp, and fish) derived from phytoplankton and detrital food-web pathways during different seasons and in different exchange zones. The high-, low-, and no-exchange zones are based on data from sites CM 56, CM 66, and CM 84, respectively (table 1). The data are from Larwood and others (2020), and the figure is adapted from Young and others (2020b).
The results of this study of an engineered dead-end channel had several similarities with the studies of more natural channels presented earlier. Most importantly, nekton abundance was highest in the no-exchange zone (CM 84, table 1) in the Sacramento River Deep Water Ship Channel. In the more natural channels, fish abundance was greatest in the no-exchange zone (CM 84, table 1), except for the highly mobile pelagic fish group. One difference is that the pelagic group, which included threadfin shad, was negatively correlated with turbidity in the more natural channels (table 8), which is consistent with observations in other systems (Bull and others, 1995). However, in the Sacramento River Deep Water Ship Channel, there was a positive relation between pelagic fishes and turbidity, indicating that multiple habitat variables affect the distribution of pelagic fishes. The Sacramento River Deep Water Ship Channel is one of the few regions where delta smelt still are regularly observed in fish surveys. Delta smelt are positively associated with turbidity, so a turbid refuge area in the vicinity of high zooplankton densities would seem to be an ideal location. However, summer water temperatures at stations in the no-exchange (CM 84; table 1) and low-exchange (CM 66; table 1) zones were in the stressful range for delta smelt (Flow Alteration-Management, Analysis and Synthesis Team, 2020), which may have limited use of the area by delta smelt during this study.
The periodic contribution of the detrital pathway to the food web in the Sacramento River Deep Water Ship Channel affects populations of consumers. The steady importance of the phytoplankton pathway to zooplankton is consistent with other studies in the Delta (Müller-Solger and others, 2002; Grimaldo and others, 2009b). However, nekton, including invasive shrimp, threadfin shad, and American shad, used the detrital pathway during some seasons at some stations. This contribution of the detrital pathway, in the form of vascular macrophytes and associated detritus, to pelagic consumers is widely recognized as an important element of pelagic food webs (Vadeboncoeur and others, 2002; Perissinotto and others, 2003). In this study, the balance of these two food web pathways differed across hydrodynamic habitats and hydrologic regimes. Food webs with at least periodic subsidy from multiple productivity pathways are more resilient and robust to perturbation, either natural or anthropogenic (McMeans and others, 2016).
Management Implications
The site-level studies detailed above have several implications for habitat restoration for species of concern.
-
• The physical configuration of a restoration site affects habitat quality. Dendritic channel systems associated with wetland habitat appear to provide better habitat for some native fishes compared to flooded islands.
-
• Understanding flux of zooplankton from tidal wetland restoration projects to surrounding channels depends on multiple factors, including time of day. Although the data are limited, some zooplankton appear to avoid movement during daylight hours, which can affect flux calculations. Incorporating these behaviors in future studies of zooplankton could help identify management actions that enhance food webs.
-
• The hydrodynamic concepts summarized by the LE ratio also seem to apply in natural and anthropogenic dead-end sloughs, as most nekton appear to be concentrated in the no-exchange zone. The exceptions are wide-ranging pelagic species.
-
• Clams are generally abundant near and seaward from the tidal excursion in Lindsey and Cache Sloughs, indicating the potential for clams to reduce transport of phytoplankton biomass from relatively shallow channels to seaward pelagic habitats.
-
• Within the no-exchange zone, different habitat conditions appear to favor different species groups at different times. The proximities of tidal marshes and elevated turbidities appear to favor several native species.
-
• Pelagic fishes and shrimp can use food sources derived from either phytoplankton or detrital-based food web pathways. Detrital-based food web support is likely one of the important functions of tidal marshes (Howe and Simenstad, 2011).
Discussion
The primary goal of this report was for the U.S. Geological Survey to provide the Bureau of Reclamation with the scientific information needed to evaluate the efficacy of ongoing and future adaptive management actions and to improve the scientific basis for more flexible management intended to balance water-supply reliability and fish protection. This report provides a framework for understanding how hydrodynamics affect sediment, nutrients, and phytoplankton at the base of the food web and how these factors interact with clams and zooplankton to affect fish-species distribution and abundance. Although we did not address many other factors affecting the ecology of the San Francisco Estuary, such as contaminants or the role of microbial communities in nutrient cycling, we believe the hydrodynamically based “physics to fish” framework will help in understanding these factors when they are addressed. We briefly review and expand upon the management implications from each topical section and then apply these ideas to several concepts that have been topics of discussion in the upper San Francisco Estuary, including reconciliation ecology, wetlands as suppliers of food subsidies to pelagic fishes, and the Arc concept for conserving native fishes.
Hydrodynamics
The San Francisco Estuary, like all estuaries, is tidally dominated during most flow conditions, particularly in the summer and fall when river flows are relatively low. This means that concepts of unidirectional flow (advection) do not apply, even in the fresh and slightly brackish waters of the upper San Francisco Estuary. The sill near Benicia Bridge (fig. 3) acts as a hydraulic control on the magnitude of the tidal prism entering the upper San Francisco Estuary. Although the volume of tidal exchange landward of the Benicia sill cannot be increased, it can be redirected. Therefore, large changes in bathymetry in the upper estuary could potentially affect the functions of restored tidal wetlands elsewhere. For example, flooding of multiple subsided islands in the central Delta could affect inundation frequency of wetland habitats in the Cache Slough Complex and Suisun Marsh. The three-dimensional (3D) hydrodynamic models currently available could be used to model such scenarios and determine the degree of risk (MacWilliams and others, 2016).
The interaction of the fixed tidal prism with the existing channel network and bathymetry of the upper San Francisco Estuary results in regions with differing hydrodynamics (fig. 3). These regional characteristics can be altered by manipulating existing water management infrastructure (Delta Cross Channel, Suisun Marsh Salinity Control Gate Facility). Existing 3D hydrodynamic models can be used to predict the effects of such alterations on hydrodynamics, but similar ecological models do not exist, so the ecological effects still require study (Kimmerer and others, 2019). Our results indicate that information about new construction projects or management actions involving reoperation of existing infrastructure could be incorporated into hydrodynamic models to improve understanding of ecological effects of management actions and the ability to predict ecological outcomes of management activities. Several such efforts are already underway regarding delta smelt, including studies at the Suisun Marsh Salinity Control Gate Facility (California Natural Resources Agency, 2016) and flow augmentation in the Toe Drain of Yolo By-Pass (Frantzich and others, 2018). Understanding the regional-level effects of these actions is dependent on understanding hydrodynamic responses at the local scale.
At the local scale, the Lagrangian to Eulerian (LE) ratio can be used to understand the relative importance of various hydrodynamic processes. Channels with LE ratios <1 in a channel network or in a dead-end slough are hydrodynamically able to develop gradients in chemical and physical properties between areas with long residence time and no exchange with other areas with short residence time and that are well mixed with seaward waters (figs. 13, 14). Gradients are formed at the transition (exchange zone) between the high and no-exchange regions where dispersive transport processes generate gradients in various water-quality constituents.
Sediment
Historically, there have been large changes in the sediment budget of the San Francisco Estuary as large quantities of sediment deposited in river channels from hydraulic mining activities have gradually been transported seaward. Currently, the sediment budget is limited by upstream supply because reservoirs act as sediment traps. Generally, Suisun Bay is erosive during wet years and depositional during dry years. Average turbidity across the Delta is dependent on annual hydrology. In the Cache Slough Complex, increased turbidity during dry years compared to Suisun Bay and the lower Sacramento River can be attributed to dispersive transport processes that move suspended sediment landward. In wet years, more sediment is moved into Suisun Bay compared to dry years, and turbidity remains high because of wind wave resuspension in Suisun Bay.
When Yolo By-Pass is not flooding and river flows are lower, sediment is usually transported into the Cache Slough Complex. This movement results from flood-dominant tidal asymmetry, which moves suspended sediment from seaward areas of the upper estuary into the Cache Slough Complex. These hydrodynamic conditions also favor the formation of turbidity maximums (TMs) in the Cache Slough Complex. The TMs provide areas of higher suspended-sediment concentration, resulting in higher turbidity habitat favored by some fishes, including delta smelt. The hydrodynamic processes creating TMs can also concentrate other constituents, including phytoplankton and organic carbon that can be important in food webs.
We developed a better understanding of the processes leading to increased turbidity in Little Holland Tract in summer and fall. Wind direction, wind waves, depth, and fine-sediment supply were all important factors; however, our understanding of the local hydrodynamics suggests that the turbid water was not transported to areas accessible to delta smelt. In fact, there was a net flux of suspended sediment into Little Holland Tract in the summer and fall. This highlights the need to understand local and regional hydrodynamics when management actions involve transport of material from one place to another by water movement. Because of the importance of tides and dispersive transport mechanisms, the outcomes are often not intuitive or obvious. The use of available data, including local and regional hydrodynamics, winds, and sediment supply using models and empirical observations, to understand the system before implementing management actions meant to increase turbidity and improve habitat for species of concern would likely improve outcomes. Furthermore, monitoring at local and regional scales could help assess the success of such actions and improve design and implementation of future projects.
Nutrients and Phytoplankton
The San Francisco Estuary has long been considered to have low phytoplankton productivity resulting in food-limitation of consumers (Jassby, 2008). Pelagic primary production by phytoplankton supports pelagic fishes such as delta smelt in Delta food webs, but phytoplankton abundance in the Delta has been declining during recent decades. Although many environmental factors can affect phytoplankton production (see “Nutrients and Phytoplankton” subsection of the “Results” section), changes in the sources and distributions of nutrients are thought to be a contributing factor in the declining incidence of phytoplankton blooms. (Parker and others, 2012; Dahm and others, 2016). This report examined how nutrients, hydrodynamics, and other factors affect phytoplankton blooms. We identified three distinct types of phytoplankton bloom events in the Delta that potentially supply carbon or seed stock to the San Francisco Estuary, and each type of bloom was associated with a distinct set of hydrologic conditions.
The first type of bloom is the productivity cascade. Productivity cascades highlight how local processes can contribute to phytoplankton blooms observed at the regional scale. Specifically, areas detached from tidal exchange (LE ratio<1) have longer residence times, which permits phytoplankton to grow and accumulate. As neap tides progress to spring tides, some of the longer-residence-time water, which contains accumulated phytoplankton, is entrained into the tidal exchange. In rare cases, this process can stimulate a bloom in the seaward area, perhaps progressively expanding over several tidal cycles into a regional-scale bloom (fig. 40). This concept is compatible with the North Delta Food Web Action, which used a pulse flow down the Toe Drain of Yolo By-Pass to attempt to stimulate phytoplankton production (California Natural Resources Agency, 2016; Frantzich and others, 2018). Coordination of this action with the tidal conditions conducive to generating a productivity cascade would increase the likelihood of success and minimize the conditions that might misdirect Toe Drain water and production into the low-exchange stairstep region.
In the second type, we observed phytoplankton blooms in the upper San Francisco Estuary that were associated with transport out of Yolo By-Pass. The concept of transport blooms moving from Yolo By-Pass to the lower Sacramento River through the Cache Slough Complex has been described before (Schemel and others, 2004). The benefits of Yolo By-Pass flooding to fishes have been well studied (Sommer and others, 2004, 2014); however, the details of phytoplankton production have not been as well studied. Collectively, our studies suggest that primary production and increases in phytoplankton biomass are greatest on the western side of Liberty Island, which is shallower, has longer residence time, and receives inputs of nutrients and other materials from west-side tributaries (fig. 43). This phytoplankton is mainly transported down the western side of the Cache Slough Complex through Shag Slough, rather than down the Toe Drain. Understanding the hydrodynamics could help to properly monitor such events and properly design management actions intended to reproduce such events using controlled levels of flooding.
In the third type, we observed a series of phytoplankton blooms that are in the confluence area at the landward edge of Suisun Bay (fig. 45). The conditions leading to creation of confluence phytoplankton blooms are not yet understood. As explained earlier, the confluence region is part of the Arc concept connecting the Cache Slough Complex with Suisun Marsh. Thus, the confluence provides a movement corridor for some fishes, such as Chinook salmon. Restoration of rearing habitat and maximizing production of phytoplankton and zooplankton along this corridor could help provide additional food resources for migratory and resident native fishes.
Clams
At the landscape scale, the distributions of the invasive clams Potamocorbula and Corbicula are driven by salinity. At smaller scales, the distribution of either species in a region is best understood by scaling up from the local level. In the Cache Slough Complex, the area landward of the tidal excursion in regions with LE ratio<1 was characterized by low abundances of Corbicula. This abundance pattern is likely best explained by lack of recruitment in these areas because recruits from seaward areas are not transported past the exchange zone, and landward tributaries lack adult Corbicula to provide an upstream source of recruits. Corbicula biomass is highest near or downstream from the exchange zone, which is consistent with production of phytoplankton in the exchange zone. Phytoplankton not consumed by local grazers are then transported seaward in the high-exchange zone (figs. 13, 14). Overall, this led to relatively high median grazing rates in Cache and Lindsey Sloughs because stations were mostly in the high-exchange downstream areas; the most landward stations in these sloughs had the lowest grazing rates (Shrader and others, 2020). Median grazing rates were low in the Sacramento River Deep Water Ship Channel and in the northern regions of the Cache Slough Complex, where many of the stations were in no-exchange zones (figs. 15, 49, 57).
Our results indicate that habitats can be designed to not support high abundances of Corbicula. As described earlier, no-exchange zones are not favorable for Corbicula recruitment. There may also be other factors associated with no-exchange zones, such as substrate characteristics or predator densities, that may also be important and deserve further study (Baumsteiger and others, 2017). Intertidal areas are also poor areas for Corbicula based on results in Little Holland Tract. Corbicula will likely become established in areas that would ideally transport constituents, including phytoplankton, seaward as described for productivity cascades, but the severity of Corbicula grazing could be reduced by manipulating the hydrodynamic characteristics of waterways, as long as the beneficial and harmful effects of such manipulations on the organisms meant to benefit from increased phytoplankton production, including zooplankton and fish species of concern, are considered.
Fishes
At the landscape scale, the distribution of fishes is driven by the position of the salinity field. Specific geographic regions in the estuary can experience different salinity conditions ranging from salt water to fresh water with more variable areas in between, and the observed fish communities demonstrate this variability. Our study element contrasted Ryer Island, in a region of variable salinity, with the Cache Slough Complex, a region with fresh water. Ryer Island had an abundance of native species, such as Sacramento splittail, tule perch, and Sacramento pikeminnow, and freshwater invasive species, such as Largemouth Bass and Bluegill, were absent (table 4). Freshwater invasive species have increased in the consistently freshwater areas of the San Francisco Estuary as native species have declined (Brown and Michniuk, 2007). The native species were almost exclusively captured in wetland and nearshore shallow-water habitat regardless of water-quality conditions. Some species, such as non-native Striped Bass, were generalists and were found in all habitat types during all conditions. We also found white sturgeon in the estuary at Ryer Island year-round. They were rarely captured in studied wetland habitat but were common and abundant in shallow and deep open-water habitat. Our results indicate that the physical configuration of habitat restoration projects, such as the presence of tidal wetlands and shoals, will drive fish responses in the low-salinity zone of the estuary, which has salinities inappropriate for many non-native fishes that dominate freshwater regions. Most native species are found in wetland and nearshore shallow-water habitats, which provides support for the restoration of this type of habitat. Striped Bass were functionally ubiquitous and should be expected to appear in virtually any habitat configuration. Our results support the work of others that indicate habitat restoration in regions with variable salinity regimes could be highly beneficial for native species (Moyle and others, 2010).
In the Cache Slough Complex, our regional scale objective was to clarify how hydrodynamic-physical habitat interactions drive fish-community structure. In one study element, we contrasted Little Holland Tract and Liberty Island Conservation Bank, which have different physical configurations but similar water-quality conditions. The main conclusions were that fishes were able to use the dendritic channel system of Liberty Island Conservation Bank and the shallow and largely intertidal open-water habitat of Little Holland Tract. Both habitats supported native species. Liberty Island Conservation Bank favored most native species, including Sacramento sucker, Sacramento pikeminnow, and hitch. The intertidal nature of Little Holland Tract appeared to favor highly mobile species able to enter and exit Little Holland Tract as it flooded and drained. These species included the native Sacramento splittail and non-native American shad. These results indicate that physical configuration of restoration projects can be designed to favor specific species of interest. Dendritic systems appear better able to support a fish community with species composition resembling historical fish communities, while flooded islands dominated by large areas of intertidal habitat support those species best able to exploit the transient character of the habitat.
In another study element, we examined fish community productivity (total fish counts) and diversity (richness and community analyses) among habitat types created by hydrodynamics in three separate terminal channels in the northern Sacramento–San Joaquin Delta: Lindsey Slough, Cache Slough, and the Aggregate region (a terminal channel complex composed of flooded agricultural tracts and distributary channels). Most fish community metrics (counts, richness) were higher landward from the mean tidal excursion compared to seaward in each channel. Community analyses and modeling of life-history groups corroborated these patterns, which found habitats landward from the tidal excursion to be especially important in supporting high numbers of native fishes compared to the number of native fishes in or downstream from the excursion habitat, suggesting that most of the native fishes were more dependent on food sources produced in the no-exchange zone than in the hot spots of phytoplankton production in the tidal excursion or in the high-exchange zone that transported phytoplankton seaward. Many of the native species were associated with tidal marsh (table 8). More pelagic-oriented, mobile species, such as Striped Bass, threadfin shad, and Sacramento pikeminnow, were more affected by water-quality conditions. A companion study element in the Sacramento River Deep Water Ship Channel demonstrated similar results in that shrimp and fishes were generally found just landward of the mean tidal excursion (fig. 79), and most fishes and shrimp used multiple food sources. The relevance of this work is that hydrodynamics, particularly the physics associated with the tidal excursion, interact with physical-landscape features to drive emergent biological properties.
Lessons for Restoration
As noted earlier, Moyle and others (2012) suggested that reconciliation ecology (Rosenzweig, 2003) provides a workable approach to native fish protection and restoration in the San Francisco Estuary. Our synthesis of data and interpretations compiled from our studies supports this concept. The basic approach of reconciliation ecology is an acceptance that the ecosystem has been irreversibly altered and that large-scale restoration to historical conditions is unlikely. Therefore, effective restoration would be ideally focused at scales most appropriate for restoring the ecological resources and processes of primary interest. Restoration to historical conditions would likely be considered desirable; although dendritic-channel systems like the one in Liberty Island Conservation Bank provide many functions similar to those expected from historical systems, more altered systems can also provide benefits. Delta smelt are often captured in the Sacramento River Deep Water Ship Channel, a highly engineered system. Many management actions proposed for protection of Chinook salmon, delta smelt, and other species also involve using existing management infrastructure to establish environmental conditions and processes. The main challenge for resource managers is to accomplish actions that increase the abundances of these species while documenting through monitoring and research that the management actions have successfully mitigated for the effects of water project operations and assured the reliability of the water supply (Luoma and others, 2015).
The physics to fish concept developed in this project provides a strong framework for designing individual projects and for considering the cumulative effects of multiple projects in a region, using the LE ratio as a guiding metric. As an example, the configuration of Little Holland Tract could be changed in several ways to achieve different results. If the goal was to develop Little Holland Tract as a source of suspended sediment to the region, Little Holland Tract would be maintained as a shallow intertidal open water area where wind could drive resuspension of sediments; however, hydrodynamic modeling could be used to determine if the existing levee breaches should be reconfigured to optimize delivery of suspended sediment to areas where it would most benefit delta smelt. Alternatively, if there was a desire to optimize Little Holland Tract for support of native tidal marsh fishes, hydrodynamic modeling might indicate repair of the surrounding levee and then construction of an internal dendritic channel system with LE ratio<1 and a sufficiently large no-exchange zone to support a community of native and non-native fishes that would colonize the area. Modeling would also allow for determining regional effects of a specific project on regional and landscape scale tidal prism.
The physics to fish concept may also provide a suitable framework for coordinating management actions. As mentioned earlier, the North Delta Food Web Action (California Natural Resources Agency, 2016) could be timed to coincide with and contribute to conditions associated with a productivity cascade or timed to take place between such events. Proposed management actions to use the Sacramento River Deep Water Ship Channel to increase Cache Slough Complex phytoplankton production could be coordinated in a similar manner (Bureau of Reclamation, 2018). For example, if using the north Delta as a phytoplankton subsidy to the upper estuary is determined to be the primary goal for the region, then hydrodynamic modeling could identify approaches to reconfigure the existing channel network (installation of permanent barriers or tidal gates or levee removal) to optimize that function.
There has been a longstanding discussion about the role of tidal wetlands as subsidies of “food” to more seaward habitats (Herbold and others, 2014). Our data indicated that Liberty Island Conservation Bank had a positive outward flux of phytoplankton biomass during the summer but not during the spring. We hypothesize that during the summer, biogeochemical processes in the wetlands release nutrients that are limiting in neighboring channels, allowing higher rates of primary production and phytoplankton reproduction. Our data and results did not support the idea that Little Holland Tract had a positive outward flux of phytoplankton during any season.
Tidal wetlands as sources of zooplankton, the actual food for many fishes, is more problematic because zooplankton life cycles are on the order of weeks, so positive outward flux of organisms would require zooplankton to maintain position in the wetland for long enough to reproduce. This duration of residence time seems unlikely if pelagic zooplankton remain in the water column and move in and out of the wetland with the tide and are regularly being dispersedly mixed into waters of neighboring channels; however, our data (fig. 16) and other studies (Kimmerer and others, 2018) indicate that zooplankton behavior, especially diel vertical migration, can play an important role in determining patterns of zooplankton transport. Thus, determining zooplankton flux requires studies that consider the diel and tidal cycles, how zooplankton behaviorally respond to each, and how these responses affect zooplankton life cycles. Additional analyses of our data could provide more information on this topic. Another issue has been the volume of the water body receiving fluxes out of the tidal wetland. If the receiving-water body has a much larger volume than the tidal wetland, the small volumes of water (and associated constituents) from the tidal wetland will disperse and be diluted into the larger body of water (fig. 13). However, these ideas have not been considered in the context of our hydrodynamic framework.
Tidal wetlands can function in several ways in the hydrodynamic framework. Relatively small tidal wetlands with short channel networks with LE ratios>1 were not able to maintain a landward no-exchange zone (figs. 13, 14). This likely means that any contributions to pelagic food webs would be limited to resources derived from wetland vegetation, which can include dissolved and particulate organic matter (detritus) and populations of secondary consumers that can increase in abundance based on those resources. These smaller systems can join neighboring channels with different characteristics. If they join a large system such as Suisun Bay, then any contribution is likely to be rapidly dispersed in the larger volume; however, the channel junction might provide a focal point for consumers such as fishes to congregate and feed on material leaving the wetland on ebb tides before it is dispersed in the larger volume (Colombano and others, 2021).
If a small wetland exits into a channel network that maintains a tidal excursion but also includes a landward no-exchange zone (fig. 14), then the wetland can contribute to those areas in several ways. Our data showed that wetlands export dissolved organic carbon material that accumulates in areas with high residence times (fig. 31). We have already described how elevated dissolved-nutrient concentrations in wetlands can allow for higher primary production when neighboring channels are depleted of nutrients. Our data also indicate that detrital and phytoplankton food web pathways are important in different pelagic habitats defined by amount of exchange (figs. 80, 81) and that these zones support high biomasses of zooplankton and nekton (fig. 79), including native fishes (see “Fishes” section).
Restored areas with channel systems with LE ratio<1 can provide all previously described benefits on their own, but location and design might still be important in the context of regional benefits. The concept of productivity cascades developed in the “Nutrients and Phytoplankton” section could be used as the framework for understanding regional phytoplankton production and how that production can be transported to other areas; however, more research is needed to evaluate this concept. These ideas might also be applicable to transport of zooplankton and organic carbon from no-exchange zones to seaward areas with variable amounts of exchange. Such restored areas would also have the hydrodynamic conditions favorable to the formation of a TM, which would provide additional high-turbidity habitat.
The ideas developed during this project have a direct connection to the Arc concept developed by Moyle and others (2012, 2016; fig. 82). Although we have not performed actual calculations, we hypothesize that Suisun Marsh, like the Cache Slough Complex, is characterized by a large proportion of channels with LE ratio<1 (fig. 82). This hypothesis is consistent with the observation that smaller dead-end sloughs provide better habitat for native species compared to larger sloughs in Suisun Marsh (Matern and others, 2002). In this context, the Arc concept represents two areas with high levels of ecological function (indicated by many channels with LE ratio<1) connected by a migration corridor of relatively low-quality habitat. Although habitat restoration in the two high-quality areas would likely benefit overall ecological function, improving the quality of the migration corridor would also likely benefit overall ecological function. Better understanding of the confluence phytoplankton blooms we observed and how those blooms translate to benefits for consumer populations could result in management actions that would improve food-web support for some species using the corridor.
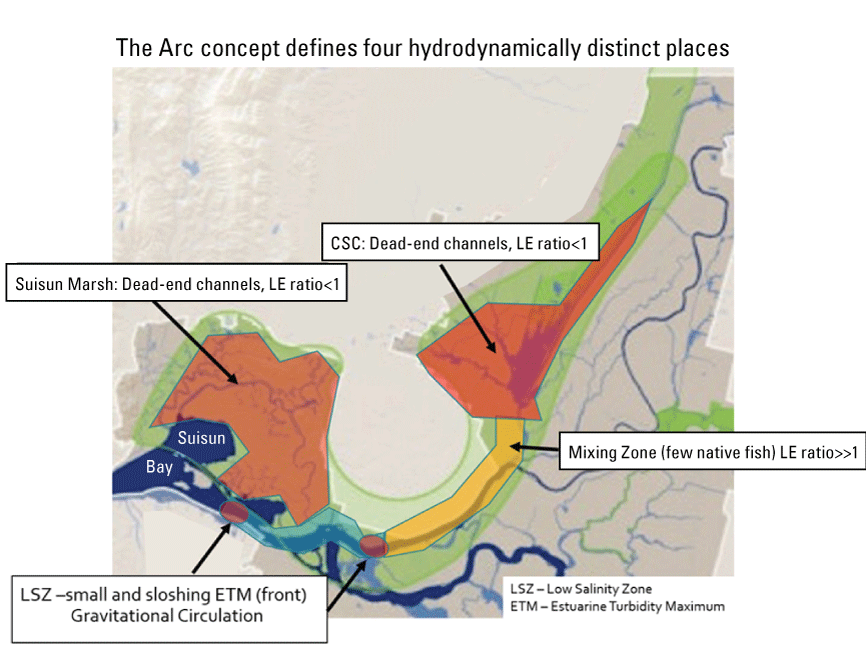
The Arc concept showing four hydrodynamically distinct regions. The Cache Slough Complex (CSC; fig. 3) includes Cache and Lindsey Sloughs, the Sacramento Deep Water Ship Channel, the Toe Drain, Liberty Island, Little Holland Tract, and associated connecting channels, including the stairsteps at the northern end of Liberty Island (fig. 1). Suisun Marsh is defined as a complex of tidal and managed wetlands near Ryer Island (fig. 1).
We were not able to directly assess the response of delta smelt to the conditions we observed during our studies. Delta smelt are currently (2023) rare, and we were not permitted to perform targeted sampling for them. However, we did sample other pelagic zooplanktivores during our studies, including threadfin shad and American shad. Although these species are not perfect surrogates for delta smelt, we think delta smelt would respond similarly to these species. The one caveat is that the Cache Slough Complex may become too warm for delta smelt in some months of warmer years (Flow Alteration-Management, Analysis and Synthesis Team, 2020), but enough is known about temperature tolerances of delta smelt that this factor could be integrated into any future assessments of habitat quality for delta smelt.
This report has established a foundation for understanding how different elements of habitat restoration can benefit native fish populations at the local and regional levels. Many of the ideas outlined in this report regarding habitat restoration and channel modifications could improve conditions for native fishes at little or no additional water cost beyond water already dedicated to other management actions. Additional monitoring and studies coordinated with management actions would help assess the costs and benefits of those actions for the species intended to benefit as well as improve the design and implementation of future actions. Additional research into understanding the processes we have documented could provide insights used to design new management actions. We believe the framework now exists to address fish conservation at the local, regional, and landscape scale.
References Cited
Allen, D.M., Haertel-Borer, S.S., Milan, B.J., Bushek, D., and Dame, R.F., 2007, Geomorphological determinants of nekton use of intertidal salt marsh creeks: Marine Ecology Progress Series, v. 329, p. 57–71. [Available at https://doi.org/10.3354/meps329057.]
Alpine, A.E., and Cloern, J.E., 1992, Trophic interactions and direct physical effects control phytoplankton biomass and production in an estuary: Limnology and Oceanography, v. 37, no. 5, p. 946–955. [Available at https://doi.org/10.4319/lo.1992.37.5.0946.]
Anderson, C.W., 2005, Turbidity: U.S. Geological Survey Techniques of Water-Resources Investigations, book 9, chaps. A6.7, 55 p. [Available at https://doi.org/10.3133/twri09A6.7.]
Armi, L., and Farmer, D.M., 1986, Maximal two-layer exchange through a contraction with barotropic net flow: Journal of Fluid Mechanics, v. 164, p. 27–51. [Available at https://doi.org/10.1017/S0022112086002458.]
Aubrey, D.G., and Speer, P.E., 1985, A study of non-linear tidal propagation in shallow inlet/estuarine systems, Part I—Observations: Estuarine, Coastal and Shelf Science, v. 21, p. 185–205. [Available at https://doi.org/10.1016/0272-7714(85)90096-4.]
Ayers, D.E., 2020, Scientific observations of fishes in tidal wetlands of the upper Sacramento San Joaquin Delta using imaging sonar devices, derived from 2018 field data: U.S. Geological Survey data release. [Available at https://doi.org/10.5066/P997P4GM.]
Baumsteiger, J., Schroeter, R.E., O'Rear, T., Cook, J.D., and Moyle, P.B., 2017, Long-term surveys show invasive overbite clams (Potamocorbula amurensis) are spatially limited in Suisun Marsh, California: San Francisco Estuary and Watershed Science, v. 15, no. 2, 11 p. [Available at https://doi.org/10.15447/sfews.2017v15iss2art6.]
Bennett, W.A., and Burau, J.R., 2015, Riders on the storm—Selective tidal movements facilitate the spawning migration of threatened Delta smelt in the San Francisco Estuary: Estuaries and Coasts, v. 38, p. 826–835. [Available at https://doi.org/10.1007/s12237-014-9877-3.]
Bennett, W.A., Kimmerer, W.J., and Burau, J.R., 2002, Plasticity in vertical migration by native and exotic estuarine fishes in a dynamic low‐salinity zone: Limnology and Oceanography, v. 47, no. 5, p. 1496–1507. [Available at https://doi.org/10.4319/lo.2002.47.5.1496.]
Bergamaschi, B.A., Kraus, T.E., Downing, B.D., Soto Perez, J., O'Donnell, K., Hansen, J.A., Hansen, A.M., Gelber, A.D., and Stumpner, E.B., 2020, Assessing spatial variability of nutrients and related water quality constituents in the California Sacramento–San Joaquin Delta at the landscape scale—High resolution mapping surveys: U.S. Geological Survey data release. [Available at https://doi.org/10.5066/P9FQEUAL.]
Bergamaschi, B.A., Fleck, J.A., Downing, B.D., Boss, E., Pellerin, B.A., Ganju, N.K., Schoellhamer, D.H., Byington, A.A., Heim, W.A., Stephenson, M., and Fujii, R., 2012, Mercury dynamics in a San Francisco estuary tidal wetland—Assessing dynamics using in situ measurements: Estuaries and Coasts, v. 35, p. 1036–1048. [Available at https://doi.org/10.1007/s12237-012-9501-3.]
Boyer, K., and Sutula, M., 2015, Factors controlling submersed and floating macrophytes in the Sacramento–San Joaquin Delta: Costa Mesa, Calif., Southern California Coastal Water Research Project, Technical Report no. 870, 87 p. [Available at http://ftp.sccwrp.org/pub/download/DOCUMENTS/TechnicalReports/870_FactorsControllingSubmersedAndFloatingMacrophytesInSac-SanJoaquinDelta.pdf.]
Brooks, M.E., Kristensen, K., van Benthem, K.J., Magnusson, A., Berg, C.W., Nielsen, A., Skaug, H.J., Maechler, M., and Bolker, B.M., 2017, glmmTMB balances speed and flexibility among packages for zero-inflated generalized linear mixed modeling: The R Journal, v. 9, no. 2, p. 378–400. [Available at https://doi.org/10.32614/RJ-2017-066.]
Brown, L.R., and Michniuk, D., 2007, Littoral fish assemblages of the alien-dominated Sacramento–San Joaquin Delta, California, 1980–1983 and 2001–2003: Estuaries and Coasts, v. 30, no. 1, p. 186–200. [Available at https://doi.org/10.1007/BF02782979.]
Brown, L.R., Kimmerer, W., Conrad, J.L., Lesmeister, S., and Mueller-Solger, A., 2016, Food webs of the Delta, Suisun Bay and Suisun Marsh—An update on current understanding and possibilities for management: San Francisco Estuary and Watershed Science, v. 14, no. 3, 41 p. [Available at https://doi.org/10.15447/sfews.2016v14iss3art4.]
Bureau of Reclamation, 2018, Final environmental assessment—Sacramento deep water ship channel nutrient enrichment project: Sacramento, Calif., Bureau of Reclamation, 30 p. [Available at https://www.usbr.gov/mp/nepa/includes/documentShow.php?Doc_ID=35182.]
Bureau of Reclamation, 2022, California-Great Basin—Central Valley Project: Bureau of Reclamation, accessed March 24, 2022, at https://www.usbr.gov/mp/cvp/index.html.
California Department of Fish and Wildlife, 2020, Fish salvage monitoring: U.S. Fish and Wildlife web page, accessed March 22, 2020, at https://wildlife.ca.gov/Conservation/Delta/Salvage-Monitoring.
California Department of Fish and Wildlife, 2022, Fish salvage monitoring: California Department of Fish and Wildlife website, accessed April 27, 2022, at https://apps.wildlife.ca.gov/Salvage.
California Department of Technology, 2022, California State Geoportal, accessed March 24, 2022, at https://gis.data.ca.gov/.
California Department of Water Resources, 2020a, Delta conveyance project—Update November 2021: Sacramento, Calif., California Department of Water Resources, 4 p. [Available at https://water.ca.gov/-/media/DWR-Website/Web-Pages/Programs/Delta-Conveyance/Public-Information/DCP_Overview_Brochure_November-2021.pdf.]
California Department of Water Resources, 2020b, Water data library web page: California Department of Water Resouces, accessed March 22, 2020, at https://wdl.water.ca.gov/waterdatalibrary/.
California Department of Water Resources, 2020c, California Irrigation Management System (CIMIS) web page, accessed March 22, 2020, at https://cimis.water.ca.gov.
California Department of Water Resources, 2021, California EcoRestore Highlights 2015 to 2020: Sacramento, Calif., California Department of Water Resources, 8 p. [Available at https://water.ca.gov/-/media/DWR-Website/Web-Pages/Programs/All-Programs/EcoRestore/EcoRestore-5YR-Fact-Sheet_ay20.pdf?la=en&hash=BF60A28CC870C32351F8 07CC11D5C1E35BAC5461.]
California Department of Water Resources, 2022, California Data Exchange Center website, accessed March 24, 2022, at https://cdec.water.ca.gov/.
California Department of Water Resources, 2023, State Water Project website, accessed March 24, 2023, at https://water.ca.gov/programs/state-water-project.
California Natural Resources Agency, 2016, Delta smelt resiliency strategy: Sacramento, Calif., California Natural Resources Agency, 11 p. [Available at https://resources.ca.gov/docs/Delta-Smelt-Resiliency-Strategy-FINAL070816.pdf.]
California Natural Resources Agency, 2017, Sacramento Valley salmon resiliency strategy June 2017: Sacramento, Calif., California Natural Resources Agency, 14 p. [Available at https://resources.ca.gov/docs/Salmon-Resiliency-Strategy.pdf.]
Carlton, J.T., Thompson, J.K., Schemel, L.E., and Nichols, F.H., 1990, Remarkable invasion of San Francisco Bay (California, USA) by the Asian clam Potamocorbula amurensis, I.—Introduction and dispersal: Marine Ecology Progress Series, v. 66, p. 81–94. [Available at https://doi.org/10.3354/meps066081.]
Cheng, R.T., Casulli, V., and Gartner, J.W., 1993, Tidal, residual, intertidal mudflat (TRIM) model and its applications to San Francisco Bay, California: Estuarine, Coastal and Shelf Science, v. 36, p. 235–280. [Available at https://doi.org/10.1006/ecss.1993.1016.]
Cloern, J.E., 1987, Turbidity as a control on phytoplankton biomass and productivity in estuaries: Continental Shelf Research, v. 7, nos. 11–12, p. 1367–1381. [Available at https://doi.org/10.1016/0278-4343(87)90042-2.]
Cloern, J.E., 2001, Our evolving conceptual model of the coastal eutrophication problem: Marine Ecology Progress Series, v. 210, p. 223–253. [Available at https://doi.org/10.3354/meps210223.]
Cloern, J.E., 2007, Habitat connectivity and ecosystem productivity—Implications from a simple model: The American Naturalist, v. 169, no. 1, p. E21–E33. [Available at https://doi.org/10.1086/510258.]
Cloern, J.E., Hieb, K.A., Jacobson, T., Sansó, B., Di Lorenzo, E., Stacey, M.T., Largier, J.L., Meiring, W., Peterson, W.T., Powell, T.M., Winder, M., and Jassby, A.D., 2010, Biological communities in San Francisco Bay track large‐scale climate forcing over the North Pacific: Geophysical Research Letters, v. 37, no. 21, 6 p. [Available at https://doi.org/10.1029/2010GL044774.]
Cloern, J.E., and Jassby, A.D., 2010, Patterns and scales of phytoplankton variability in estuarine—Coastal ecosystems: Estuaries and Coasts, v. 33, p. 230–241. [Available at https://doi.org/10.1007/s12237-009-9195-3.]
Cloern, J.E., Jassby, A.D., Thompson, J.K., and Hieb, K.A., 2007, A cold phase of the East Pacific triggers new phytoplankton blooms in San Francisco Bay: Proceedings of the National Academy of Sciences, v. 104, no. 47, p. 18561–18565. [Available at https://doi.org/10.1073/pnas.0706151104.]
Cloern, J.E., Schraga, T.S., Nejad, E., and Martin, C., 2020, Nutrient status of San Francisco Bay and its management implications: Estuaries and Coasts v. 43, p. 1299–1317. [Available at https://doi.org/10.1007/s12237-020-00737-w.]
Cohen, A.N., and Carlton, J.T., 1998, Accelerating invasion rate in a highly invaded estuary: Science, v. 279, no. 5350, p. 555–558. [Available at https://doi.org/10.1126/science.279.5350.555.]
Colombano, D.D., Handley, T.B., O’Rear, T.A., Durand, J.R., and Moyle, P.B., 2021, Complex tidal marsh dynamics structure fish foraging patterns in the San Francisco Estuary: Estuaries and Coasts, v. 44, no. 6, p. 1604–1618. [Available at https://doi.org/10.1007/s12237-021-00896-4.]
Conrad, J.L., Bibian, A.J., Weinersmith, K.L., De Carion, D., Young, M.J., Crain, P., Hestir, E.L., Santos, M.J., and Sih, A., 2016, Novel species interactions in a highly modified estuary—Association of largemouth bass with Brazilian waterweed Egeria densa: Transactions of the American Fisheries Society, v. 145, p. 249–263. [Available at https://doi.org/10.1080/00028487.2015.1114521.]
Cooke, J., Joab, C., and Lu, Z., 2018, Delta nutrient research plan: Report by the Regional Water Quality Control Board Central Valley Region and the California Environmental Protection Agency, 50 p. [Available at https://www.waterboards.ca.gov/centralvalley/water_issues/delta_water_quality/delta_nutrient_research_plan/2018_0802_dnrp_final.pdf.]
Cornwell, J.C., Glibert, P.M., and Owens, M.S., 2014, Nutrient fluxes from sediments in the San Francisco Bay Delta: Estuaries and Coasts, v. 37, p. 1120–1133. [Available at https://doi.org/10.1007/s12237-013-9755-4.]
Crespo, D., Dolbeth, M., Leston, S., Sousa, R., and Pardal, M.Â., 2015, Distribution of Corbicula fluminea (Müller, 1774) in the invaded range—A geographic approach with notes on species traits variability: Biological Invasions, v. 17, no. 7, p. 2087–2101. [Available at https://doi.org/10.1007/s10530-015-0862-y.]
Crump, B.C., and Baross, J.A., 1996, Particle-attached bacteria and heterotrophic plankton associated with the Columbia River turbidity maxima: Marine Ecology Progress Series, v. 138, p. 265–273. [Available at https://doi.org/10.3354/meps138265.]
Dahm, C.N., Parker, A.E., Adelson, A.E., Christman, M.A., and Bergamaschi, B.A., 2016, Nutrient dynamics of the Delta—Effects on primary producers: San Francisco Estuary and Watershed Science, v. 14, no. 4, 35 p. [Available at https://doi.org/10.15447/sfews.2016v14iss4art4.]
Domagalski, J., and Saleh, D., 2015, Sources and transport of phosphorus to rivers in California and adjacent states, U.S., as determined by SPARROW modeling: Journal of the American Water Resources Association, v. 51, no. 6, p. 1463–1486. [Available at https://doi.org/10.1111/1752-1688.12326.]
Downing, B.D., Bergamaschi, B.A., Kendall, C., Kraus, T.E.C., Dennis, K.J., Carter, J.A., and Von Dessonneck, T.S., 2016, Using continuous underway isotope measurements to map water residence time in hydrodynamically complex tidal environments: Environmental Science and Technology, v. 50, no. 24, p. 13387–13396. [Available at https://doi.org/10.1021/acs.est.6b05745.]
Downing-Kunz, M.A., Work, P.A., and Schoellhamer, D.H., 2021, Tidal asymmetry in ocean-boundary flux and in-estuary trapping of suspended sediment following watershed storms—San Francisco Estuary, California, USA: Estuaries and Coasts, v. 44, no. 8, p. 2194–2211. [Available at https://doi.org/10.1007/s12237-021-00929-y.]
Dugdale, R.C., Wilkerson, F.P., Hogue, V.E., and Marchi, A., 2007, The role of ammonium and nitrate in spring bloom development in San Francisco Bay: Estuarine, Coastal and Shelf Science, v. 73, nos. 1–2, p. 17–29. [Available at https://doi.org/10.1016/j.ecss.2006.12.008.]
Durand, J.R., 2015, A conceptual model of the aquatic food web of the upper San Francisco Estuary: San Francisco Estuary and Watershed Science, v. 13, no. 3, 37 p. [Available at https://doi.org/10.15447/sfews.2015v13iss3art5.]
Enos, E.R., Steinke, D.A., Young, M.J., and Feyrer, F.V., 2020, Little Holland Tract and Wildlands flux study; zooplankton, phytoplankton, and larval fish taxonomic data, 2017–2018: U.S. Geological Survey data release. [Available at https://doi.org/10.5066/P9217ML2.]
Eppley, R.W., Rogers, J.N., and McCarthy, J.J., 1969, Half-saturation constants for uptake of nitrate and ammonium by marine phytoplankton: Limnology and Oceanography, v. 14, no. 6, p. 912–920. [Available at https://doi.org/10.4319/lo.1969.14.6.0912.]
Farruggia, M.J., Clause, J.K., Feyrer, F., and Young, M.J., 2019, Fish abundance and distribution in restored tidal wetlands in the northern Sacramento–San Joaquin Delta, California, 2017–2018: U.S. Geological Survey data release. [Available at https://doi.org/10.5066/P9F0ZASV.]
Feyrer, F., Cloern, J., Brown, L., Fish, M., Hieb, K., and Baxter, R., 2015, Estuarine fish communities respond to climate variability over both river and ocean basins: Global Change Biology, v. 21, no. 10, p. 3608–3619. [Available at https://doi.org/10.1111/gcb.12969.]
Feyrer, F., Herbold, B., Matern, S.A., and Moyle, P.B., 2003, Dietary shifts in a stressed fish assemblage—Consequences of a bivalve invasion in the San Francisco Estuary: Environmental Biology of Fishes, v. 67, p. 277–288. [Available at https://doi.org/10.1023/A:1025839132274.]
Feyrer, F., Nobriga, M.L., and Sommer, T.R., 2007, Multidecadal trends for three declining fish species—Habitat patterns and mechanisms in the San Francisco Estuary, California, USA: Canadian Journal of Fisheries and Aquatic Sciences, v. 64, p. 723–734. [Available at https://doi.org/10.1139/f07-048.]
Feyrer, F., Slater, S.B., Portz, D.E., Odom, D., Morgan-King, T., and Brown, L.R., 2017, Pelagic nekton abundance and distribution in the northern Sacramento–San Joaquin Delta, California: Transactions of the American Fisheries Society, v. 146, no. 1, p. 128–135. [Available at https://doi.org/10.1080/00028487.2016.1243577.]
Feyrer, F., Young, M.J., Huntsman, B.M., and Brown, L.R., 2021, Disentangling stationary and dynamic estuarine fish habitat to inform conservation—Species-specific responses to physical habitat and water quality in the San Francisco Estuary: Marine and Coastal Fisheries—Dynamics, Management, and Ecosystem Science, v. 13, no. 5, p. 548–563. [Available at https://doi.org/10.1002/mcf2.10183.]
Fischer, H.B., List, E.J., Koh, R.C.Y., Imberger, J., and Brooks, N.H., 1979, Mixing in inland and coastal waters: Academic Press, 483 p. [Available at https://doi.org/10.1016/C2009-0-22051-4.]
Flow Alteration-Management, Analysis and Synthesis Team, 2020, Synthesis of data and studies relating to Delta smelt biology in the San Francisco Estuary, emphasizing water year 2017: Sacramento, Calif., Interagency Ecological Program Technical Report no. 95, 2 p. [Available at https://iep.ca.gov/Publications/Technical-Publications.]
Foe, C., and Knight, A., 1985, The effect of phytoplankton and suspended sediment on the growth of Corbicula fluminea (Bivalvia): Hydrobiologia, v. 127, p. 105–115. [Available at https://doi.org/10.1007/BF00004190.]
Frantzich, J., Sommer, T., and Schreier, B., 2018, Physical and biological responses to flow in a tidal freshwater slough complex: San Francisco Estuary and Watershed Science, v. 16, no. 1, 26 p. [Available at https://doi.org/10.15447/sfews.2018v16iss1/art3.]
Fregoso, T.A., Wang, R-F, Alteljevich, E., and Jaffe, B.E., 2017, San Francisco Bay-Delta bathymetric/topographic digital elevation model (DEM): U.S. Geological Survey data release. [Available at https://doi.org/10.5066/F7GH9G27.]
Ganju, N.K., and Schoellhamer, D.H., 2006, Annual sediment flux estimates in a tidal strait using surrogate measurements: Estuarine, Coastal and Shelf Science, v. 69, nos. 1–2, p. 165–178. [Available at https://doi.org/10.1016/j.ecss.2006.04.008.]
Ganju, N.K., Schoellhamer, D.H., Murrell, M.C., Gartner, J.W., and Wright, S.A., 2007, Constancy of the relation between floc size and density in San Francisco Bay, in Maa, J.P.-Y., Sanford, L.P., and Schoellhamer, D.H., eds., Estuarine and Coastal Fine Sediments Dynamics. Elsevier Science B.V., p. 75–91. [Available at https://doi.org/10.1016/S1568-2692(07)80007-6.]
Gibson, R.N., 2003, Go with the flow—Tidal migration in marine animals, in Migrations and dispersal of marine organisms: Dordrecht, Springer, p. 153–161. [Available at https://doi.org/10.1007/978-94-017-2276-6_17.]
Glibert, P.M., 2010, Long-term changes in nutrient loading and stoichiometry and their relationships with changes in the food web and dominant pelagic fish species in the San Francisco Estuary, California: Reviews in Fisheries Science, v. 18, no. 2, p. 211–232. [Available at https://doi.org/10.1080/10641262.2010.492059.]
Glibert, P.M., Dugdale, R.C., Wilkerson, F., Parker, A.E., Alexander, J., Antell, E., Blaser, S., Johnson, A., Lee, J., Lee, T., Murasko, S., and Strong, S., 2014, Major—but rare—spring blooms in 2014 in San Francisco Bay Delta, California—A result of the long-term drought, increased residence time, and altered nutrient loads and forms: Journal of Experimental Marine Biology and Ecology, v. 460, p. 8–18. [Available at https://doi.org/10.1016/j.jembe.2014.06.001.]
Greene, V.E., Sullivan, L.J., Thompson, J.K., and Kimmerer, W.J., 2011, Grazing impact of the invasive clam Corbula amurensis on the microplankton assemblage of the northern San Francisco Estuary: Marine Ecology Progress Series, v. 431, p. 183–193. [Available at https://doi.org/10.3354/meps09099.]
Grimaldo, L.F., Smith, W.E., and Nobriga, M.L., 2021, Re-examining factors that affect delta smelt (Hypomesus transpacificus) entrainment at the State Water Project and Central Valley Project in the Sacramento–San Joaquin Delta: San Francisco Estuary and Watershed Science, v. 19, no. 1, 18 p. [Available at https://doi.org/10.15447/sfews.2021v19iss1art5.]
Grimaldo, L.F., Sommer, T., Ark, N.V., Jones, G., Holland, E., Moyle, P.B., Herbold, B., and Smith, P., 2009a, Factors affecting fish entrainment into massive water diversions in a tidal freshwater estuary—Can fish losses be managed?: North American Journal of Fisheries Management, v. 29, no. 5, p. 1253–1270. [Available at https://doi.org/10.1577/M08-062.1.]
Grimaldo, L.F., Stewart, A.R., and Kimmerer, W., 2009b, Dietary segregation of pelagic and littoral fish assemblages in a highly modified tidal freshwater estuary: Marine and Coastal Fisheries—Dynamics, Management, and Ecosystem Science, v. 1, no. 1, p. 200–217. [Available at https://doi.org/10.1577/C08-013.1.]
Hammock, B.G., Hartman, R., Slater, S.B., Hennessy, A., and Teh, S.J., 2019, Tidal wetlands associated with foraging success of Delta smelt: Estuaries and Coasts, v. 42, p. 857–867. [Available at https://doi.org/10.1007/s12237-019-00521-5.]
Harfmann, J., Kurobe, T., Bergamaschi, B., Teh, S., and Hernes, P., 2019, Plant detritus is selectively consumed by estuarine copepods and can augment their survival: Scientific Reports, v. 9, no. 9076, 9 p. [Available at https://doi.org/10.1038/s41598-019-45503-6.]
Hartleb, C.F., and Moring, J.R., 1995, An improved gastric lavage for removing stomach contents from live fish: Fisheries Research, v. 24, p. 261–265. [Available at https://doi.org/10.1016/0165-7836(95)00390-V.]
Hasenbein, M., Fangue, N.A., Geist, J., Komoroske, L.M., Truong, J., McPherson, R., and Connon, R.E., 2016, Assessments at multiple levels of biological organization allow for an integrative determination of physiological tolerances to turbidity in an endangered fish species: Conservation Physiology, v. 4, no. 1, 16 p. [Available at https://doi.org/10.1093/conphys/cow004.]
Helsel, D.R., Hirsch, R.M., Ryberg, K.R., Archfield, S.A., and Gilroy, E.J., 2020, Statistical methods in water resources: U.S. Geological Survey Techniques and Methods, book 4, chap. A3, 458 p., available at https://doi.org/10.3133/tm4A3. [Supersedes USGS Techniques of Water-Resources Investigations, book 4, chap. A3, version 1.1.]
Henriques, S., Cardoso, P., Cardoso, I., Laborde, M., Cabral, H.N., and Vasconcelos, R.P., 2017, Processes underpinning fish species composition patterns in estuarine ecosystems worldwide: Journal of Biogeography, v. 44, no. 3, p. 627–639. [Available at https://doi.org/10.1111/jbi.12824.]
Herbold, B., Baltz, D.M, Brown, L., Grossinger, R., Kimmerer, W., Lehman, P., Simenstad, C., Wilcox, C., and Nobriga, M., 2014, The role of tidal marsh restoration in fish management in the San Francisco Estuary: San Francisco Estuary and Watershed Science, v. 12, no. 1, 6 p. [Available at https://doi.org/10.15447/sfews.2014v12iss1art1.]
Hestir, E.L., Schoellhamer, D.H., Morgan-King, T., and Ustin, S.L., 2013, A step decrease in sediment concentration in a highly modified tidal river delta following the 1983 El Niño floods: Marine Geology, v. 345, p. 304–313. [Available at https://doi.org/10.1016/j.margeo.2013.05.008.]
Hestir, E.L., Schoellhamer, D.H., Greenberg, J., Morgan-King, T., and Ustin, S.L., 2016, The effect of submerged aquatic vegetation expansion on a declining turbidity trend in the Sacramento–San Joaquin Delta: Estuaries and Coasts, v. 39, p. 1100–1112. [Available at https://doi.org/10.1007/s12237-015-0055-z.]
Howe, E.R., and Simenstad, C.A., 2011, Isotopic determination of food web origins in restoring and ancient estuarine wetlands of the San Francisco Bay and Delta: Estuaries and Coasts, v. 34, p. 597–617. [Available at https://doi.org/10.1007/s12237-011-9376-8.]
Huntsman, B.M., Young, M.J., Feyrer, F.V., Stumpner, P.R., Brown, L.R., and Burau, J.R., 2023, Hydrodynamics and habitat interact to structure fish communities within terminal channels of a tidal freshwater delta: Ecosphere, v. 14, no. 1, 18 p. [Available at https://doi.org/10.1002/ecs2.4339.]
Interagency Ecological Program-Management, Analysis and Synthesis Team, 2015, An updated conceptual model of Delta smelt biology—Our evolving understanding of an estuarine fish: Sacramento, Calif., Interagency Ecological Program-Management, Analysis and Synthesis Team, Technical Report no. 90, 206 p. [Available at https://pubs.er.usgs.gov/publication/70141018.]
Iowa State University, 2018, Iowa Environmental Mesonet: ASOS Network, Iowa State University, accessed August 30, 2018, at https://mesonet.agron.iastate.edu/request/download.phtml?network=CA_ASOS.
Jassby, A., 2008, Phytoplankton in the upper San Francisco Estuary—Recent biomass trends, their causes, and their trophic significance: San Francisco Estuary and Watershed Science, v. 6, no. 1, 24 p. [Available at https://doi.org/10.15447/sfews.2008v6iss1art2.]
Jassby, A.D., and Cloern, J.E., 2000, Organic matter sources and rehabilitation of the Sacramento–San Joaquin Delta (California, USA): Aquatic Conservation—Marine and Freshwater Ecosystems, v. 10, p. 323–352. [Available at https://doi.org/10.1002/1099-0755(200009/10)10:5<323::AID-AQC417>3.0.CO;2-J.]
Jassby, A.D., Cloern, J.E., and Cole, B.E., 2002, Annual primary production—Patterns and mechanisms of change in a nutrient‐rich tidal ecosystem: Limnology and Oceanography, v. 47, p. 698–712. [Available at https://doi.org/10.4319/lo.2002.47.3.0698.]
Jassby, A.D., Kimmerer, W.J., Monismith, S.G., Armor, C., Cloern, J.E., Powell, T.M., Schubel, J.R., and Vendlinski, T.J., 1995, Isohaline position as a habitat indicator for estuarine populations: Ecological Applications, v. 5, no. 1, p. 272–289. [Available at https://doi.org/10.2307/1942069.]
Jay, D.A., and Musiak, J.D., 1994, Particle trapping in estuarine tidal flows: Journal of Geophysical Research, v. 99, no. C10, p. 20445–20461. [Available at https://doi.org/10.1029/94JC00971.]
Jeffres, C.A., Holmes, E.J., Sommer, T.R., and Katz, J.V.E., 2019, Detrital food web drives aquatic ecosystem productivity in a seasonally inundated managed floodplain: BioRxiv, 35 p. [Available at https://doi.org/10.1101/610055.]
Jordan, R.C., Howe, D.V., Hurst, T.P., and Juanes, F., 2003, Feeding habits of age-0 striped bass, Morone saxatilis, in the mid-Hudson River Estuary—Temporal, spatial, and ontogenetic variation: Estuaries, v. 26, no. 6, p. 1486–1493. [Available at https://doi.org/10.1007/BF02803657.]
Kimmerer, W., 2004, Open water processes of the San Francisco Estuary—From physical forcing to biological responses: San Francisco Estuary and Watershed Science, v. 2, no. 1, 143 p. [Available at https://doi.org/10.15447/sfews.2004v2iss1art1.]
Kimmerer, W., 2005, Long‐term changes in apparent uptake of silica in the San Francisco estuary: Limnology and Oceanography: v. 50, no. 3, p. 793–798. [Available at https://doi.org/10.4319/lo.2005.50.3.0793.]
Kimmerer, W.J., and Lougee, L.A., 2015, Bivalve grazing causes substantial mortality to an estuarine copepod population: Journal of Experimental Marine Biology and Ecology, v. 473, p. 53–63. [Available at https://doi.org/10.1016/j.jembe.2015.08.005.]
Kimmerer, W., and Thompson, J.K., 2014, Phytoplankton growth balanced by clam and zooplankton grazing and net transport into the low-salinity zone of the San Francisco Estuary: Estuaries and Coasts, v. 37, p. 1202–1218. [Available at https://doi.org/10.1007/s12237-013-9753-6.]
Kimmerer, W.J., Burau, J.R., and Bennett, W.A., 1998, Tidally oriented vertical migration and position maintenance of zooplankton in a temperate estuary: Limnology and Oceanography, v. 43, no. 7, p. 1697–1709. [Available at https://doi.org/10.4319/lo.1998.43.7.1697.]
Kimmerer, W.J., Burau, J.R., and Bennett, W.A., 2002, Persistence of tidally-oriented vertical migration by zooplankton in a temperate estuary: Estuaries, v. 25, no. 3, p. 359–371. [Available at https://doi.org/10.1007/BF02695979.]
Kimmerer, W.J., Gross, E.S., and MacWilliams, M.L., 2009, Is the response of estuarine nekton to freshwater flow in the San Francisco Estuary explained by variation in habitat volume?: Estuaries and Coasts, v. 32, p. 375–389. [Available at https://doi.org/10.1007/s12237-008-9124-x.]
Kimmerer, W.J., Gross, E.S., and MacWilliams, M.L., 2014, Tidal migration and retention of estuarine zooplankton investigated using a particle‐tracking model: Limnology and Oceanography, v. 59, no. 3, p. 901–916. [Available at https://doi.org/10.4319/lo.2014.59.3.0901.]
Kimmerer, W., Ignoffo, T.R., Bemowski, B., Modéran, J., Holmes, A., and Bergamaschi, B., 2018, Zooplankton dynamics in the Cache Slough Complex of the upper San Francisco Estuary: San Francisco Estuary and Watershed Science, v. 16, no. 3, 25 p. [Available at https://doi.org/10.15447/sfews.2018v16iss3art4.]
Kimmerer, W.J, MacWilliams, M.L., and Gross, E.S., 2013, Variation of fish habitat and extent of the low-salinity zone with freshwater flow in the San Francisco Estuary: San Francisco Estuary and Watershed Science, v. 11, no. 4, 16 p. [Available at https://doi.org/10.15447/sfews.2013v11iss4art1.]
Kimmerer, W., Wilkerson, F., Downing, B., Dugdale, R., Gross, E.S., Kayfetz, K., Khanna, S., Parker, A.E, and Thompson, J., 2019, Effects of drought and the emergency drought barrier on the ecosystem of the California Delta: San Francisco Estuary and Watershed Science, v. 17, no. 3, 28 p. [Available at https://doi.org/10.15447/sfews.2019v17iss3art2.]
Kratzer, C.R., Kent, R.H., Seleh, D.K., Knifong, D.L., Dileanis, P.D., and Orlando, J.L., 2011, Trends in nutrient concentrations, loads, and yields in streams in the Sacramento, San Joaquin, and Santa Ana Basins, California, 1975–2004: U.S. Geological Survey Scientific Investigations Report 2010–5228, 112 p. [Available at https://pubs.usgs.gov/sir/2010/5228/.]
Kraus, T.E.C., Bergamaschi, B.A., and Downing, B.D., 2017a, An introduction to high-frequency nutrient and biogeochemical monitoring for the Sacramento–San Joaquin Delta, northern California: U.S. Geological Survey Scientific Investigations Report 2017–5071, 41 p. [Available at https://doi.org/10.3133/sir20175071.]
Kraus, T.E.C., Carpenter, K.D., Bergamaschi, B.A., Parker, A.E., Stumpner, E.B., Downing, B.D., Travis, N.M., Wilkerson, F.P., Kendall, C., and Mussen, T.D., 2017b, A river‐scale Lagrangian experiment examining controls on phytoplankton dynamics in the presence and absence of treated wastewater effluent high in ammonium: Limnology and Oceanography, v. 62, no. 3, p. 1234–1253. [Available at https://doi.org/10.1002/lno.10497.]
Kraus, T.E.C., O’Donnell, K., Downing, B.D., Burau, J.R., and Bergamaschi, B.A., 2017c, Using paired in situ high frequency nitrate measurements to better understand controls on nitrate concentrations and estimate nitrification rates in a wastewater‐impacted river: Water Resources Research, v. 53, no. 10, p. 8423–8442. [Available at https://doi.org/10.1002/2017WR020670.]
Lacy, J.R., Carlson, E.M., and Ferreira, J.C.T., 2016, Wind-wave and sediment-transport time-series data from Liberty Island and Little Holland Tract, Sacramento–San Joaquin Delta, California, 2015–2017 (ver. 2.0, September 2019): U.S. Geological Survey data release. [Available at https://doi.org/10.5066/F73R0R07.]
Lacy, J.R., Dailey, E.T., and Morgan-King, T.L., 2023, What controls suspended-sediment concentration and export in flooded agricultural tracts in the Sacramento–San Joaquin Delta?: San Francisco Estuary and Watershed Science, v. 21, no. 1, 27 p. [Available at https://doi.org/10.15447/sfews.2023v21iss1art4.]
Larwood, V.L., Steinke, D.A., Young, M.J., and Feyrer, F.V., 2020, Physical and biological drivers of fish populations in the Sacramento Deep Water Shipping Channel, California, 2016–2018: U.S. Geological Survey data release. [Available at https://doi.org/10.5066/P9VCNYAZ.]
Lehman, P.W., 2000, Phytoplankton biomass, cell diameter, and species composition in the low salinity zone of northern San Francisco Bay Estuary: Estuaries, v. 23, no. 2, p. 216–230. [Available at https://doi.org/10.2307/1352829.]
Lehman, P., Boyer, G., Hall, C., Waller, S., and Gehrts, K., 2005, Distribution and toxicity of a new colonial Microcystis aeruginosa bloom in the San Francisco Bay Estuary, California: Hydrobiologia, v. 541, p. 87–99. [Available at https://doi.org/10.1007/s10750-004-4670-0.]
Lehman, P., Kurobe, T., Lesmeister, S., Baxa, D., Tung, A., and Teh, S.J., 2017, Impacts of the 2014 severe drought on the Microcystis bloom in San Francisco Estuary: Harmful Algae, v. 63, p. 94–108. [Available at https://doi.org/10.1016/j.hal.2017.01.011.]
Lehman, P.W., Mayr, S., Mecum, L., and Enright, C., 2010, The freshwater tidal wetland Liberty Island, CA was both a source and sink of inorganic and organic material to the San Francisco Estuary: Aquatic Ecology, v. 44, no. 2, p. 359–372. [Available at https://doi.org/10.1007/s10452-009-9295-y.]
Lenth, R., 2019, emmeans—Estimated marginal means, aka least-squares means: The R Project Package, version 1.3.5, 98 p. [Available at https://cran.r-project.org/web/packages/emmeans/emmeans.pdf.]
Levesque, V.A., and Oberg, K.A., 2012, Computing discharge using the index velocity method: U.S. Geological Survey Techniques and Methods, book 3, chap. A23, 148 p. [Available at https://pubs.usgs.gov/tm/3a23/.]
Lopez, C.B., Cloern, J.E., Schraga, T.S., Little, A.J., Lucas, L.V., Thompson, J.K., and Burau, J.R., 2006, Ecological values of shallow-water habitats—Implications for the restoration of disturbed ecosystems: Ecosystems, v. 9, p. 422–440. [Available at https://doi.org/10.1007/s10021-005-0113-7.]
Lucas, L.V., and Thompson, J. K., 2012, Changing restoration rules—Exotic bivalves interact with residence time and depth to control phytoplankton productivity: Ecosphere, v. 3, no. 12, p. 1–26. [Available at https://doi.org/10.1890/ES12-00251.1.]
Lucas, L.V., Cloern, J.E., Thompson, J.K., and Monsen, N.E., 2002, Functional variability of habitats within the Sacramento–San Joaquin Delta—Restoration implications: Ecological Applications, v. 12, no. 5, p. 1528–1547. [Available at https://doi.org/10.1890/1051-0761(2002)012[1528:FVOHWT]2.0.CO;2.]
Luoma, S.N., Dahm, C.N., Healey, M., and Moore, J.N., 2015, Challenges facing the Sacramento–San Joaquin Delta—Complex, chaotic, or simply cantankerous?: San Francisco Estuary and Watershed Science, v. 13, no. 3, 25 p. [Available at https://doi.org/10.15447/sfews.2015v13iss3art7.]
MacVean, L.J., and Lacy, J.R., 2014, Interactions between waves, sediment, and turbulence on a shallow estuarine mudflat: Journal of Geophysical Research—Oceans, v. 119, no. 3, p. 1534–1553. [Available at https://doi.org/10.1002/2013JC009477.]
MacWilliams, M.L., Ateljevich, E.S., Monismith, S.G., and Enright, C., 2016, An overview of multi-dimensional models of the Sacramento–San Joaquin Delta: San Francisco Estuary and Watershed Science, v. 14, no. 4, 35 p. [Available at https://doi.org/10.15447/sfews.2016v14iss4art2.]
Madsen, J.D., Chambers, P.A., James, W.F., Koch, E.W., and Westlake, D.F., 2001, The interaction between water movement, sediment dynamics, and submersed macrophytes: Hydrobiologia, v. 444, p. 71–84. [Available at https://doi.org/10.1023/A:1017520800568.]
Manooch, C.S., 1973, Food habits of yearling and adult striped bass, Morone saxatilis (Walbaum), from Albermarle Sound, North Carolina: Chesapeake Science, v. 14, p. 73–86. [Available at https://doi.org/10.2307/1350872.]
Matern, S.A., Moyle, P.B., and Pierce, L.C., 2002, Native and alien fishes in a California estuarine marsh—Twenty-one years of changing assemblages: Transactions of the American Fisheries Society, v. 131, no. 5, p. 797–816. [Available at https://doi.org/10.1577/1548-8659(2002)131<0797:NAAFIA>2.0.CO;2.]
McCleave, J.D., 1978, Rhythmic aspects of estuarine migration of hatchery‐reared Atlantic salmon (Salmo salar) smolts: Journal of Fish Biology, v. 12, no. 6, p. 559–570. [Available at https://doi.org/10.1111/j.1095-8649.1978.tb04202.x.]
McIvor, C.C., and Odum, W.E., 1988, Food, predation risk, and microhabitat selection in a marsh fish assemblage: Ecology, v. 69, no. 5, p. 1341–1351. [Available at https://doi.org/10.2307/1941632.]
McKee, L.J., Ganju, N.K., and Schoellhamer, D.H., 2006, Estimates of suspended sediment entering San Francisco Bay from the Sacramento and San Joaquin Delta, San Francisco Bay, California: Journal of Hydrology, v. 323, p. 335–352. [Available at https://doi.org/10.1016/j.jhydrol.2005.09.006.]
McKee, L.J., Lewicki, M., Schoellhamer, D.H., and Ganju, N.K., 2013, Comparison of sediment supply to San Francisco Bay from watersheds draining the Bay Area and Central Valley of California: Marine Geology, v. 345, nos. 1–4, p. 47–62. [Available at https://doi.org/10.1016/j.margeo.2013.03.003.]
McMeans, B.C., McCann, K.S., Tunney, T.D., Fisk, A.T., Muir, A.M., Lester, N., Shuter, B., and Rooney, N., 2016, The adaptive capacity of lake food webs—From individuals to ecosystems: Ecological Monographs, v. 86, no. 1, p. 4–19. [Available at https://doi.org/10.1890/15-0288.1.]
Monismith, S.G., 2016, A note on Delta outflow: San Francisco Estuary and Watershed Science, v. 14, no. 3, p. 1–16. [Available at https://doi.org/10.15447/sfews.2016v14iss3art3.]
Monismith, S.G., Burau, J.R., and Stacey, M.T., 1996, Stratification dynamics and gravitational circulation in northern San Francisco Bay, in Hollibaugh, J.T., ed., San Francisco Bay—The ecosystem: San Francisco, Calif., Pacific Division American Association for the Advancement of Science, p. 123–153.
Monsen, N.E., Cloern, J.E., Lucas, L.V., and Monismith, S.G., 2002, A comment on the use of flushing time, residence time, and age as transport time scales: Limnology and Oceanography, v. 47, p. 1545–1553. [Available at https://doi.org/10.4319/lo.2002.47.5.1545.]
Moore, A., Potter, E.C.E., Milner, N.J., and Bamber, S., 1995, The migratory behaviour of wild Atlantic salmon (Salmo salar) smolts in the estuary of the River Conwy, North Wales: Canadian Journal of Fisheries and Aquatic Sciences, v. 52, no. 9, p. 1923–1935. [Available at https://doi.org/10.1139/f95-784.]
Morgan, C.A., Cordell, J.R., and Simenstad, C.A., 1997, Sink or swim? Copepod population maintenance in the Columbia River estuarine turbidity-maxima region: Marine Biology, v. 129, p. 309–317. [Available at https://doi.org/10.1007/s002270050171.]
Morgan-King, T.L., and Conlen, A.L., 2022, Model archive summary and time-series suspended-sediment concentrations computed from a surrogate turbidity regression at USGS station 11313405 Old River at Bacon Island, CA (2010–2019): U.S. Geological Survey data release. [Available at https://doi.org/10.5066/P9FW7L0B.]
Morgan-King, T.L., and Schoellhamer, D.H., 2013, Suspended-sediment flux and retention in a backwater tidal slough complex near the landward boundary of an estuary: Estuaries and Coasts, v. 36, p. 300–318. [Available at https://doi.org/10.1007/s12237-012-9574-z.]
Moser, M.L., Olson, A.F., and Quinn, T.P., 1991, Riverine and estuarine migratory behavior of coho salmon (Oncorhynchus kisutch) smolts: Canadian Journal of Fisheries and Aquatic Sciences, v. 48, p. 1670–1678. [Available at https://doi.org/10.1139/f91-198.]
Moyle, P.B., Daniels, R.A., Herbold, B., and Baltz, D.M., 1986, Patterns in distribution and abundance of a non-coevolved assemblage of estuarine fishes in California: Fishery Bulletin, v. 84, p. 105–117. [Available at https://spo.nmfs.noaa.gov/sites/default/files/pdf-content/1986/841/moyle.pdf.]
Moyle, P.B., Lund, J.R., Bennett, W.A., and Fleenor, W.E., 2010, Habitat variability and complexity in the upper San Francisco Estuary: San Francisco Estuary and Watershed Science, v. 8, no. 3, 24 p. [Available at https://doi.org/10.15447/sfews.2010v8iss3art1.]
Moyle, P.B., Durand, J., and Manfree, A., 2016, Reconciling wild things with tamed species—A future for native fish species in the Delta: California Water Blog, Center for Watershed Sciences. [Available at https://californiawaterblog.com/2016/11/06/the-north-delta-habitat-arc-an-ecosystem-strategy-for-saving-fish/.]
Müller-Solger, A.B., Jassby, A.D., and Müller-Navarra, D.C., 2002, Nutritional quality of food resources for zooplankton (Daphnia) in a tidal freshwater system (Sacramento–San Joaquin River Delta): Limnology and Oceanography, v. 47, no. 5, p. 1468–1476. [Available at https://doi.org/10.4319/lo.2002.47.5.1468.]
Nichols, F.H., 1985, Increased benthic grazing—An alternative explanation for low phytoplankton biomass in northern San Francisco Bay during the 1976–1977 drought: Estuarine, Coastal and Shelf Science, v. 21, no. 3, p. 379–388. [Available at https://doi.org/10.1016/0272-7714(85)90018-6.]
Nichols, F.H., Thompson, J.K., and Schemel, L.E., 1990, Remarkable invasion of San Francisco Bay (California, USA) by the Asian clam Potamocorbula amurensis. II. Displacement of a former community: Marine Ecology Progress Series, v. 66, nos. 1–2, p. 95–101. [Available at https://doi.org/10.3354/meps066095.]
Nicolini, M.H., and Penry, D.L., 2000, Spawning, fertilization, and larval development of Potamocorbula amurensis (Mollusca: Bivalvia) from San Francisco Bay, California: Pacific Science, v. 54, no. 4, p. 377–388. [Available at https://scholarspace.manoa.hawaii.edu/bitstream/10125/1663/v54n4-377-388.pdf.]
Nobriga, M., and Feyrer, F.F., 2008, Diet composition in San Francisco Estuary striped bass—Does trophic adaptability have its limits?: Environmental Biology of Fishes, v. 83, p. 495–503. [Available at https://doi.org/10.1007/s10641-008-9376-0.]
Novick, E., Holleman, R., Jabusch, T., Sun, J., Trowbridge, P., Senn, D., Guerin, M., Kendall, C., Young, M., and Peek, S., 2015, Characterizing and quantifying nutrient sources, sinks and transformations in the Delta—Synthesis, modeling, and recommendations for monitoring: Richmond, Calif., San Francisco Estuary Institute. [Available at https://www.sfei.org/documents/delta-nutrient-sources.]
O'Donnell, K., Gelber, A., Graham, N., Stumpner, E., Gosselink, S., Richardson, E., Kraus, T., Downing, B., and Bergamaschi, B., 2021a, Assessment of nutrients and water-quality constituents in the North Delta during Yolo By-Pass flooding events in March 2017: U.S. Geological Survey data release. [Available at https://doi.org/10.5066/P9SD54QW.]
O'Donnell, K., Richardson, E., Gelber, A., Graham, N., Gosselink, S., Stumpner, E., Kraus, T., Downing, B., and Bergamaschi, B., 2021b, Assessment of nutrients and water-quality constituents at the Sacramento-San Joaquin River Confluence during a phytoplankton bloom in July 2017: U.S. Geological Survey data release. [Available at https://doi.org/10.5066/P9DI7VSY.]
Oksanen, J., Blanchet, F.G., Friendly, M., Kindt, R., Legendre, P., McGlinn, D., Minchin, P.R., O’Hara, R.B., Simpson, G.L., Solymos, P., Stevens, M.H.H., Szoecs, E., and Wagner, H., 2020, vegan—Community ecology package: The R Project website. [Available at https://cran.r-project.org/package=vegan.]
Orlando, J.L., and Drexler, J.Z., 2017, Factors affecting marsh vegetation at the Liberty Island Conservation Bank in the Cache Slough region of the Sacramento–San Joaquin Delta, California, 2017: U.S. Geological Survey Open-File Report 2017–1077, 25 p. [Available at https://doi.org/10.3133/ofr20171077.]
Palmer, M.W., 1990, The estimation of species richness by extrapolation: Ecology, v. 71, no. 3, p. 1195–1198. [Available at https://doi.org/10.2307/1937387.]
Parchaso, F., and Thompson, J.K., 2002, The influence of hydrologic processes on reproduction of the introduced bivalve Potamocorbula amurensis in northern San Francisco Bay, California: Pacific Science, v. 56, no. 3, p. 329–345. [Available at https://doi.org/10.1353/psc.2002.0027.]
Parker, A.E., Dugdale, R.C., and Wilkerson, F.P., 2012, Elevated ammonium concentrations from wastewater discharge depress primary productivity in the Sacramento River and the Northern San Francisco Estuary: Marine Pollution Bulletin, v. 64, no. 3, p. 574–586. [Available at https://doi.org/10.1016/j.marpolbul.2011.12.016.]
Patton, O., Larwood, V., Young, M., and Feyrer, F., 2020, Estuarine habitat of white sturgeon: San Francisco Estuary and Watershed Science, v. 18, no. 4, 10 p. [Available at https://doi.org/10.15447/sfews.2020v18iss4art4.]
Pellerin, B.A., Bergamaschi, B.A., Gilliom, R.J., Crawford, C.G., Saraceno, J., Frederick, C.P., Downing, B.D., and Murphy, J.C., 2014, Mississippi River nitrate loads from high frequency sensor measurements and regression-based load estimation: Environmental Science and Technology, v. 48, no. 21, p. 12612–12619. [Available at https://doi.org/10.1021/es504029c.]
Pellerin, B.A., Downing, B.D., Kendall, C., Dahlgren, R.A., Kraus, T.E.C., Saraceno, J., Spencer, R.G.M., and Bergamaschi, B.A., 2009, Assessing the sources and magnitude of diurnal nitrate variability in the San Joaquin River (California) with an in situ optical nitrate sensor and dual nitrate isotopes: Freshwater Biology, v. 54, no. 2, p. 376–387. [Available at https://doi.org/10.1111/j.1365-2427.2008.02111.x.]
Perissinotto, R., Nozais, C., Kibirige, I., and Anandraj, A., 2003, Planktonic food webs and benthic-pelagic coupling in three South African temporarily-open estuaries: Acta Oecologica, v, 24, no. S1, p. S307–S316. [Available at https://doi.org/10.1016/S1146-609X(03)00028-6.]
Perry, R.W., Pope, A.C., Romine, J.G., Brandes, P.L., Burau, J.R., Blake, A.R., Ammann, A.J., and Michel, C.J., 2018, Flow-mediated effects on travel time, routing, and survival of juvenile Chinook salmon in a spatially complex, tidally forced river delta: Canadian Journal of Fisheries and Aquatic Sciences, v. 75, no. 11, p. 1886–1901. [Available at https://doi.org/10.1139/cjfas-2017-0310.]
Peterson, M.S., 2003, A conceptual view of environment-habitat-production linkages in tidal river estuaries: Reviews in Fisheries Science, v. 11, no. 4, p. 291–313. [Available at https://doi.org/10.1080/10641260390255844.]
Peterson, D.H., Conomos, T.J., Broenkow, W.W., and Doherty, P.C., 1975, Location of the non-tidal current null zone in northern San Francisco Bay: Estuarine and Coastal Marine Science, v. 3, no. 1, p. 1–11. [Available at https://doi.org/10.1016/0302-3524(75)90002-X.]
Porterfield, G., Busch, R.D., and Waananen, A.O., 1978, Sediment transport in the Feather River, Lake Oroville to Yuba City, California: U.S. Geological Survey Water-Resources Investigations Report 78–20, 73 p. [Available at https://doi.org/10.3133/wri7820.]
Plummer, M., 2017, JAGS—Just Another Gibbs Sampler News [Web log post]: SourceForge webpage. [Available at https://sourceforge.net/p/mcmc-jags/code-0/ci/default/tree/NEWS.]
Rasmussen, P.P., Gray, J.R., Glysson, G.D., and Ziegler, A.C., 2009, Guidelines and procedures for computing time-series suspended-sediment concentrations and loads from in-stream turbidity-sensor and streamflow data: U.S. Geological Survey Techniques and Methods, book 3, chap. C4, 52 p. [Available at https://pubs.usgs.gov/tm/tm3c4/.]
Reeves, R.R., McQuirk, J., Ameri, K., Perry, R.W., Romine, J.G., Liedtke, T.L., Burau, J.R., Blake, A.R., Fitzer, C., Smith, N., Pagliughi, S., Johnston, S., Kumagai, K., and Cash, K., 2012, 2011 Georgiana Slough non-physical barrier performance evaluation project report: Sacramento, Calif., California Department of Water Resources, 228 p. [Available at https://data.cnra.ca.gov/dataset/2011-and-2012-georgiana-slough-non-physical-barrier-performance-evaluation-gsnpb-11_legacy_reports-v.]
Reeves, R.L., McQuirk, J., Cane, M., Adams, N., Perry, R.W., Romine, J.G., Liedtke, T.L., Burau, J.R., Blake, A.R., Horn, M., Fitzer, C., Pagliughi, S., Leidy, R., Hanson, C., Johnson, S., Kumagai, K., and Cash, K., 2015, 2012 Georgiana Slough non-physical barrier performance evaluation project report: Sacramento, Calif., California Department of Water Resources, 224 p. [Available at https://data.cnra.ca.gov/dataset/2011-and-2012-georgiana-slough-non-physical-barrier-performance-evaluation-gsnpb-12_legacy_reports-v.]
Reeves, R.L., McQuirk, J., Cane, M., Adams, N., Perry, R.W., Romine, J.G., Liedtke, T.L., Burau, J.R., Blake, A.R., Pope, A., Horn, M., Pagliughi, S., Leidy, R., Hanson, C., Johnson, S., Kumagai, K., Greenwood, M., and Cash, K., 2016, 2014 Georgiana Slough floating fish guidance structure performance evaluation project report: Sacramento, Calif., California Department of Water Resources, 486 p. [Available at https://data.cnra.ca.gov/dataset/2014-georgiana-slough-floating-fish-guidance-structure-performance-evaluation-gsnpb-14_legacy_report.]
Robinson, A.H., Safran, S.M., Beagle, J., Grossinger, R.M., Grenier, J.L., and Askevold, R.A., 2014, A Delta transformed—Ecological functions, spatial metrics, and landscape change in the Sacramento–San Joaquin Delta: Richmond, Calif., San Francisco Estuary Institute—Aquatic Science Center, 139 p. [Available at https://www.sfei.org/documents/delta-transformed-ecological-functions-spatial-metrics-and-landscape-change-sacramento-san.]
Rosenzweig, M.L., 2003, Win-win ecology—How the Earth’s species can survive in the midst of human enterprise: New York, Oxford University Press, 211 p. [Available at https://doi.org/10.1093/oso/9780195156041.001.0001.]
Rudershausen, P.J., Tuomikoski, J.E., Buckel, J.A., and Hightower, J.E., 2005, Prey selectivity and diet of striped bass in western Albemarle Sound, North Carolina: Transactions of the American Fisheries Society, v. 134, no. 5, p. 1059–1074. [Available at https://doi.org/10.1577/T04-115.1.]
Russo, M., 2010, Sacramento River Flood Control Project weirs and flood relief structures: California Department of Water Resources, Division of Flood Management, Fact Sheet, 23 p., accessed April 27, 2022, at https://www.rd108.org/wp-content/uploads/2015/07/WeirsReliefStructures.pdf.
Sadar, M.J., 1998, Turbidity science: HACH, Technical Information Series-Booklet No. 11, 26 p. [Available at https://www.hach.com/asset-get.download.jsa?id=7639984474.]
Saleh, D., and Domagalski, J., 2015, SPARROW modeling of nitrogen sources and transport in rivers and streams of California and adjacent states US: Journal of the American Water Resources Association, v. 51, no. 6, p. 1487–1507. [Available at https://doi.org/10.1111/1752-1688.12325.]
Schemel, L.E., Sommer, T.R., Muller-Solger, A.B., and Harrell, W.C., 2004, Hydrologic variability, water chemistry, and phytoplankton biomass in a large floodplain of the Sacramento River, CA, USA: Hydrobiologia, v. 513, p. 129–139. [Available at https://doi.org/10.1023/B:hydr.0000018178.85404.1c.]
Schlegel, B., and Domagalski, J.L., 2015, Riverine nutrient trends in the Sacramento and San Joaquin Basins, California—A comparison to state and regional water quality policies: San Francisco Estuary and Watershed Science, v. 13, no. 4, 30 p. [Available at https://doi.org/10.15447/sfews.2015v13iss4art2.]
Schoellhamer, D.H., 2011, Sudden clearing of estuarine waters upon crossing the threshold from transport to supply regulation of sediment transport as an erodible sediment pool is depleted—San Francisco Bay, 1999: Estuaries and Coasts, v. 34, no. 5, p. 885–899. [Available at https://doi.org/10.1007/s12237-011-9382-x.]
Schoellhamer, D.H., Wright, S.A., and Drexler, J.Z., 2012, Conceptual model of sedimentation in the Sacramento–San Joaquin River Delta: San Francisco Estuary and Watershed Science, v. 10, no. 3, 25 p. [Available at https://doi.org/10.15447/sfews.2012v10iss3art3.]
Schoellhamer, D.H., Wright, S.A., and Drexler, J.Z., 2013, Adjustment of the San Francisco estuary and watershed to decreasing sediment supply in the 20th century: Marine Geology, v. 345, p. 63–71. [Available at https://doi.org/10.1016/j.margeo.2013.04.007.]
Schubel, J.R., Armor, C., Chadwick, P., Cloern, J., Collins, J., Cowan, J., Foin, T.C., Fullerton, D., Hatfield, S., Herbold, B., Herrgesell, P., Jay, D., Jassby, A., Kimmerer, W., Miller, L., Monismith, S., Moyle, P., Nichols, F., Peterson, D., Powell, T., Simenstad, C., Smith, L., Thomas, G., and Williams, P., 1993, Managing freshwater discharge to the San Francisco Bay/Sacramento–San Joaquin Delta Estuary—The scientific basis for an estuarine standard: San Francisco, Calif., San Francisco Estuary Project, U.S. Environmental Protection Agency, 109 p., accessed May 1, 2014, at https://www2.epa.gov/sites/production/files/documents/sfep_1993_managing_fw_discharge_sf_bay_Delta_estuary_0.pdf.
Seaburg, K.G., 1957, A stomach sampler for live fish: Progressive Fish-Culturist, v. 19, no. 3, p. 137–139. [Available at https://doi.org/10.1577/1548-8659(1957)19[137:ASSFLF]2.0.CO;2.]
Senn, D.B., and Novick, E., 2014, Suisun Bay ammonium synthesis report: Richmond, Calif., San Francisco Estuary Institute, 189 p. [Available at https://sfbaynutrients.sfei.org/sites/default/files/SuisunSynthesisI_Final_March2014.pdf.]
Shrader, K.H., Zierdt Smith, E.L., Parchaso, F., and Thompson, J.K., 2020, Benthic community and bivalve metrics data in the Sacramento–San Joaquin Delta from 2015 to 2018: U.S. Geological Survey data release. [Available at https://doi.org/10.5066/P9JJOL3W.]
Slater, S.B., and Baxter, R.D., 2014, Diet, prey selection, and body condition of age-0 delta smelt, Hypomesus transpacificus, in the upper San Francisco Estuary: San Francisco Estuary and Watershed Science, v. 12, no. 3, 24 p. [Available at https://doi.org/10.15447/sfews.2014v12iss3art1.]
Smith, L.H., and Cheng, R.T., 1987, Tidal and tidally averaged circulation characteristics of Suisun Bay, California: Water Resources Research, v. 23, no. 1, p. 143–155. [Available at https://doi.org/10.1029/WR023i001p00143.]
Sobczak, W.V., Cloern, J.E., Jassby, A.D., and Müller-Solger, A.B., 2002, Bioavailability of organic matter in a highly disturbed estuary: the role of detrital and algal resources: Proceedings of the National Academy of Sciences, v. 99, no. 12, p. 8101–8105. [Available at https://doi.org/10.1073/pnas.122614399.]
Sommer, T., Armor, C., Baxter, R., Breuer, R., Brown, L., Chotkowski, M., Culberson, S., Feyrer, F., Gingras, M., Herbold, B., Kimmerer, W., Mueller-Solger, A., Nobriga, A., and Souza, K., 2007, The collapse of pelagic fishes in the upper San Francisco Estuary: Fisheries, v. 32, no. 6, p. 270–277. [Available at https://doi.org/10.1577/1548-8446(2007)32[270:TCOPFI]2.0.CO;2.]
Sommer, T., Harrell, B., Nobriga, M., Brown, R., Moyle, P., Kimmerer, W., and Schemel, L., 2001, California's Yolo By-Pass—Evidence that flood control can be compatible with fisheries, wetlands, wildlife, and agriculture: Fisheries, v. 26, no. 8, p. 6–16. [Available at https://doi.org/10.1577/1548-8446(2001)026<0006:CYB>2.0.CO;2.]
Sommer, T.R., Harrell, W.C., and Feyrer, F., 2014, Large-bodied fish migration and residency in a flood basin of the Sacramento River, California, USA: Ecology of Freshwater Fish, v. 23, no. 3, p. 414–423. [Available at https://doi.org/10.1111/eff.12095.]
Sommer, T.R., Harrell, W.C., Solger, A.M., Tom, B., and Kimmerer, W., 2004, Effects of flow variation on channel and floodplain biota and habitats of the Sacramento River, California, USA: Aquatic Conservation: Marine and Freshwater Ecosystems, v. 14, no. 3, p. 247–261. [Available at https://doi.org/10.1002/aqc.620.]
Sommer, T., and Mejia, F., 2013, A place to call home: a synthesis of Delta smelt habitat in the upper San Francisco Estuary: San Francisco Estuary and Watershed Science, v. 11, no. 2, 25 p. [Available at https://doi.org/10.15447/sfews.2013v11iss2art4.]
Steinke, D.A., Young, M.J., and Feyrer, F., 2019a, Fishes of Ryer Island, Suisun Bay, California, 2016–2017: U.S. Geological Survey data release. [Available at https://doi.org/10.5066/P94A0YGJ.]
Steinke, D.A., Young, M.J., and Feyrer, F.V., 2019b, Abundance and distribution of fishes in the northern Sacramento–San Joaquin Delta, California, 2017–2018 (ver. 1.1, December 2019): U.S. Geological Survey data release. [Available at https://doi.org/10.5066/P9FUQXJL.]
Steinke, D.A., Young, M.J., and Feyrer, F., 2019c, White sturgeon set line sampling at Ryer Island, Suisun Bay, California, 2017–2018: U.S. Geological Survey data release. [Available at https://doi.org/10.5066/P9087XOC.]
Steinke, D.A., Young, M.J., Smith, C.D., and Feyrer, F., 2019d, Diets of striped bass and Sacramento Pikeminnow at Ryer Island, Suisun Bay, California, 2018: U.S. Geological Survey data release. [Available at https://doi.org/10.5066/P9YGG46K.]
Stern, M., Flint, L., Minear, J., Flint, A., and Wright, S., 2016, Characterizing changes in streamflow and sediment supply in the Sacramento River Basin, California, using hydrological simulation program—FORTRAN (HSPF): Water, v. 8, no. 10, 21 p. [Available at https://doi.org/10.3390/w8100432.]
Stumpner, E.B., Bergamaschi, B.A., Kraus, T.E.C., Parker, A.E., Wilkerson, F.P., Downing, B.D., Dugdale, R.C., Murrell, M.C., Carpenter, K.D., Orlando, J.L., and Kendall, C., 2020a, Spatial variability of phytoplankton in a shallow tidal freshwater system reveals complex controls on abundance and community structure: Science of The Total Environment, v. 700, 17 p. [Available at https://doi.org/10.1016/j.scitotenv.2019.134392.]
Stumpner, E.B., Bergamaschi, B.A., Downing, B.D., Kraus, T., O'Donnell, K., Soto Perez, J., and Steinke, D.A., 2020b, Assessment of water-quality in the California Sacramento–San Joaquin Delta during a North Delta directed flow action—August - October 2018 (ver. 2.0, September 2021): U.S. Geological Survey data release. [Available at https://doi.org/10.5066/P9EFDWZP.]
Stumpner, P.R., Burau, J.R., and Forrest, A.L., 2021, A lagrangian-to-eulerian metric to identify estuarine pelagic habitats: Estuaries and Coasts, v. 44, p. 1231–1249. [Available at https://doi.org/10.1007/s12237-020-00861-7.]
Sutherland, T.F., Lane, P.M., Amos, C.L., and Downing, J., 2000, The calibration of optical backscatter sensors for suspended sediment of varying darkness levels: Marine Geology, v. 162, nos. 2–4, p. 587–597. [Available at https://doi.org/10.1016/S0025-3227(99)00080-8.]
Ta, J., Anderson, L.W.J., Christman, M.A., Khanna, S., Kratville, D., Madsen, J.D., Moran, P.J., and Viers, J.H., 2017, Invasive aquatic vegetation management in the Sacramento–San Joaquin River Delta—Status and recommendations: San Francisco Estuary and Watershed Science, v. 15, no. 4, 19 p. [Available at https://doi.org/10.15447/sfews.2017v15iss4art5.]
Uncles, R.J., 1983, Modeling tidal stress, circulation, and mixing in the Bristol Channel as a prerequisite for ecosystem studies: Canadian Journal of Fisheries and Aquatic Sciences, v. 40, no. S1, p. 8–19. [Available at https://doi.org/10.1139/f83-265.]
U.S. Fish and Wildlife Service, 2008, Formal endangered species act consultation on the proposed coordinated operations of the central valley project (CVP) and state water project (SWP): Sacramento, Calif., U.S. Fish and Wildlife Service. [Available at https://www.fws.gov/sfbaydelta/documents/SWP-CVP_OPs_BO_12-15_final_OCR.pdf.]
U.S. Fish and Wildlife Service, 2019, BIOLOGICAL OPINION for the reinitiation of consultation on the coordinated operations of the central valley project and state water project: Sacramento, Calif., U.S. Fish and Wildlife Service, Service File No. 08FBTD00-2019-F-0164. [Available at https://www.fws.gov/sfbaydelta/cvp-swp/documents/10182019_ROC_BO_final.pdf.]
U.S. Geological Survey, 2016, Policy and guidance for approval of surrogate regression models for computation of time series suspended-sediment concentration and loads: Office of Surface Water Technical Memorandum 2016.07, Office of Water Quality Technical Memorandum 2016.10, 40 p. [Available at https://water.usgs.gov/admin/memo/SW/sw.2016.07+wq.2016.10.pdf.]
U.S. Geological Survey, 2022, USGS water data for the Nation: U.S. Geological Survey National Water Information System database, accessed March 24, 2022, at https://doi.org/10.5066/F7P55KJN.
Vadeboncoeur, Y., Vander Zanden, M.J., and Lodge, D.M., 2002, Putting the lake back together—Reintegrating benthic pathways into lake food web models: Bioscience, v. 52, no. 1, p. 44–54. [Available at https://doi.org/10.1641/0006-3568(2002)052[0044:PTLBTR]2.0.CO;2.]
Valentine, D., Young, M., and Feyrer, F., 2020, Sacramento pikeminnow migration record: Journal of Fish and Wildlife Management, v. 11, no. 2, p. 588–592. [Available at https://doi.org/10.3996/JFWM-20-038.]
Valle-Levinson, A., and Wilson, R.E., 1994, Effects of sill bathymetry on oscillating barotropic forcing and vertical mixing on estuary/ocean exchange: Journal of Geophysical Research, v. 99, no. C3, p. 5149–5169. [Available at https://doi.org/10.1029/93JC03333.]
Visintainer, T.A., Bollens, S.M., and Simenstad, C., 2006, Community composition and diet of fishes as a function of tidal channel geomorphology: Marine Ecology Progress Series, v. 321, p. 227–243. [Available at https://doi.org/10.3354/meps321227.]
Wagner, R.J., Boulger, R.W., Jr., Oblinger, C.J., and Smith, B.A., 2006, Guidelines and standard procedures for continuous water-quality monitors—Station operation, record computation, and data reporting: U.S. Geological Survey Techniques and Methods, book 1, chap. D3, 51 p., 8 attachments. [Available at https://pubs.water.usgs.gov/tm1d3.]
Walter, J.F., III, Overton, A.S., Ferry, K.H., and Mather, M.E., 2003, Atlantic coast feeding habits of striped Bbass—A synthesis supporting a coast‐wide understanding of trophic biology: Fisheries Management and Ecology, v. 10, no. 5, p. 349–360. [Available at https://doi.org/10.1046/j.1365-2400.2003.00373.x.]
Walters, R.A., and Gartner, J.W., 1985, Subtidal sea level and current variations in the northern reach of San Francisco Bay: Estuarine, Coastal and Shelf Science, v. 21, no. 1, p. 17–32. [Available at https://doi.org/10.1016/0272-7714(85)90003-4.]
Walters, R.A., Cheng, R.T., and Conomos, T.J., 1985, Time scales of circulation and mixing processes of San Francisco Bay waters: Hydrobiologia, v. 129, no. 1, p. 13–36. [Available at https://doi.org/10.1007/BF00048685.]
Water Education Foundation, 2022, Aquapedia background—Shasta Dam: Water Education Foundation webpage, accessed April 27, 2022, at https://www.watereducation.org/aquapedia/shasta-dam.
Whipple, A., Grossinger, R.M., Rankin, D., Stanford, B., and Askevold, R.A., 2012, Sacramento–San Joaquin Delta historical ecology investigation—Exploring pattern and process—SFEI Contribution No. 672: Richmond, Calif., San Francisco Estuary Institute. [Available at https://www.sfei.org/documents/sacramento-san-joaquin-delta-historical-ecology-investigation-exploring-pattern-and-proces.]
Wright, S.A., and Schoellhamer, D.H., 2004, Trends in the sediment yield of the Sacramento River, California, 1957–2001: San Francisco Estuary and Watershed Science, v. 2, no. 2, 14 p. [Available at https://doi.org/10.15447/sfews.2004v2iss2art2.]
Wright, S.A., and Schoellhamer, D.H., 2005, Estimating sediment budgets at the interface between rivers and estuaries with application to the Sacramento‐San Joaquin River Delta: Water Resources Research, v. 41, no. 9, 17 p. [Available at https://doi.org/10.1029/2004WR003753.]
Young, M.J., Feyrer, F., Smith, C.D., Valentine, D.A., 2022, Habitat-Specific Foraging by Striped Bass (Morone saxatilis) in the San Francisco Estuary, California—Implications for Tidal Restoration: San Francisco Estuary & Watershed Science, v. 20, no. 3, 20 p. [Available at https://doi.org/10.15447/sfews.2022v20iss3art4.]
Young, M.J., Feyrer, F., Stumpner, P.R., Larwood, V., Patton, O., and Brown, L.R., 2020b, Hydrodynamics drive pelagic communities and food web structure in a tidal environment: International Review of Hydrobiology, v. 106, no. 2, p. 69–85. [Available at https://doi.org/10.1002/iroh.202002063.]
Young, M.J., Feyrer, F.V., Colombano, D.D., Louise Conrad, J., and Sih, A., 2018, Fish-habitat relationships along the estuarine gradient of the Sacramento–San Joaquin Delta, California—Implications for habitat restoration: Estuaries and Coasts, v. 41, no. 8, p. 2389–2409. [Available at https://doi.org/10.1007/s12237-018-0417-4.]
Young, M.J., Howe, E., O’Rear, T.A., Berridge, K.B., and Moyle, P.B., 2020a, Food web fuel differs across habitats and seasons of a tidal freshwater estuary: Estuaries and Coasts, v. 44, p. 286–301. [Available at https://doi.org/10.1007/s12237-020-00762-9.]
Zierdt Smith, E.L., Shrader, K.H., Parchaso, F., and Thompson, J.K., 2021, A spatially and temporally intensive sampling study of benthic community and bivalve metrics in the Sacramento–San Joaquin Delta (ver. 2.0, May 2021): U.S. Geological Survey data release, https://doi.org/10.5066/P93BAY64.
Appendix 1. Products Completed as Part of the Physics to Fish Project
Completed Conference Presentations and Posters
Study element 1a: Delta Flow and Water-Quality Monitoring
-
Burau, J.R., 2015, Delta challenges workshop, part 3: The Delta ecosystem—Hydrodynamics, water quality, salinity, nutrients, and the food web, in Delta Science Program, April 23, 2015, Oral presentation and panel participation.
-
Burau, J.R., 2016, A tale of two Deltas—A comparison of transport processes in the predevelopment and contemporary Delta, in Biennial Bay-Delta Science Conference, 9th, November 15, 2016, Oral presentation.
-
Burau, J.R., 2016, Sacramento/San Joaquin River Delta USGS flow and water quality monitoring—The foundation of a Delta-wide Decision Support System, in Independent Science Board Monitoring Program Review, April 19, 2016, Oral presentation.
-
Burau, J.R., 2017, Delta Stewardship Council Panel—Examining the science behind the proposed Delta Conveyance Amendment, presentation and panel discussion, June 7, 2017.
-
Burau, J.R., 2018, North Delta hydrodynamics with emphasis on habitat connectivity, in Bay-Delta Science Conference, September 10–12, Oral presentation.
-
Burau, J.R., 2019, Research in the Cache Slough Complex and an overview of habitat restoration projects, in Association of California Water Agency Annual Meeting, December 4, 2019, San Diego, Calif., Oral presentation.
-
Burau, J.R., 2020, On North Delta hydrodynamics and juvenile salmon entrainment in junctions and survival, in DWR/NMFS/CDFW Delta Conveyance Project Technical Meeting, September 16, 2020, Oral presentation.
-
Burau, J.R., 2020, Examples of tidally driven connectivity in Suisun Bay and the Sacramento-San Joaquin River Delta, in Delta Science Program Estuarine Connectivity Symposium, February 18, 2020, Oral presentation.
-
Burau, J.R., 2021, Overview of North Delta hydrodynamics and fish movements, in CDFW SWP ITP Measure 8.9 Workshop—Salmon Migration Coordination Group Minimization of Sacramento River Winter-Run Chinook Salmon and Central Valley Spring-Run Chinook Salmon Migration into the Central and South Delta, April 27, 2021.
-
Conlen, A., and Morgan-King, T., 2019, Turbidity in the Sacramento–San Joaquin Delta during water years 2017–2018, in Interagency Ecological Program Annual Workshop, March 5–7, 2019.
-
Huddleston-Adrianza, C., 2019, Water quality characteristics of a tidally-influenced, dead-end channel, in National Water Quality Monitoring Conference, Denver, Colo., March 25–29, 2019, Poster presentation.
-
Lenoch, L., 2021, Dispersion and stratification dynamics in the upper Sacramento Deep Water Ship Channel, in Biennial Bay-Delta Science Conference, 11th, April 8, 2021, Oral presentation.
-
Ruhl, C., 2017, Integrated monitoring networks, in National Water Data Training Workshop, Spokane, Wash., August 28–31, 2017, Poster presentation.
-
Ruhl, C., and others, 2018, Long-term, Integrated Monitoring Networks in the Sacramento–San Joaquin Delta, in Interagency Ecological Program Annual Workshop, March 6–8, 2018.
-
Stumpner, E.B., and Morgan-King, T., 2018, Sediment transport and water quality in and around Little Holland Tract and Wildlands, in Interagency Ecological Program Workshop, March 7, 2018.
-
Stumpner, P., 2021, Hydrodynamic Metrics to Evaluate Tidal Marsh Dynamics in the Sacramento–San Joaquin Delta, in Biennial Bay-Delta Science Conference, 11th April 6, 2021, Oral presentation.
-
Violette, T., 2019, To burst or not to burst? How to sample high frequency data to eliminate noise, in National Water Data Training Workshop, Columbus, Ohio, August 26–29, 2019.
Study element 1b: Delta Suspended-Sediment Concentrations and Flux
-
Morgan-King, T.L., 2018, Sacramento–San Joaquin Delta sediment characteristics following the extremely wet conditions during 2017, in Bay-Delta Science Conference, September 10–12, Oral presentation.
-
Morgan-King, T., and Wright, S., 2016, Sediment budgets, transport, and depositional trends in a large tidal delta, in Federal Interagency Sedimentation Conference, 10th, April 19–22, 2015, Proceedings: Reno, Nev., https://pubs.usgs.gov/publication/70179039.
-
Morgan, T.L., and Wright, S.A., 2016, Primary sediment supply, pathways, and transport mechanisms to the central Sacramento–San Joaquin Delta, in Bay-Delta Science Conference, Sacramento, Calif., November 15–17, 2016, Proceedings: Sacramento, Calif., Bay-Delta Science Conference.
-
Morgan-King, T., and Wright, S., 2016, Primary sediment pathways that increase sediment concentrations and turbidity in the Sacramento–San Joaquin Delta, in Interagency Ecological Program Workshop, April 20–22, 2016.
-
Morgan-King, T., and Lacy, J., 2018, Delta sediment 2017—An extremely wet year [abs.] in Biennial Bay-Delta Science Conference, 10th, Sacramento, Calif., September 10–12, 2018: Sacramento, Calif., Biennial Bay-Delta Science Conference, 1 p.
-
Stumpner, E.B., and Morgan-King, T., 2018, Sediment transport and water quality in and around Little Holland Tract and Wildlands, in Interagency Ecological Program Workshop, March 7, 2018.
-
Wright, S.A., and Morgan, T.L., 2015, Suspended sediment transport through a large fluvial-tidal channel network, in Federal Interagency Sedimentation Conference, 10th, Reno, Nev., April 19–22, 2015, Proceedings: Reno, Nev., Federal Interagency Sedimentation, https://acwi.gov/sos/pubs/3rdJFIC/Contents/8D-Wright.pdf.
Study element 1c: Understanding Aquatic Habitats in Suisun Bay: Monitoring Turbidity and Suspended-Sediment Concentration at Benicia Bridge
-
Schoellhamer, D., McKee, L., Pearce, S., Dusterhoff, S., and Marineau, M., 2017, Sediment supply to San Francisco Bay—Today and into the future, in State of the San Francisco Estuary Conference, Oakland, Calif., October 10–11, 2017, Proceedings: Oakland, Calif., State of the San Francisco Estuary, https://www.sfestuary.org/wp-content/uploads/2017/10/SOE17Oral18_SFBSediment.pdf.
-
Schoellhamer, D.H., Morgan-King, T.L., and Wright, S.A., 2018, Evaluation of whether the sediment supply to the San Francisco Estuary, California USA, is continuing to decrease, in American Geophysical Union Ocean Sciences Meeting, Portland, Oreg., February 11–16, 2018: Portland Oreg., American Geophysical Union, https://agu.confex.com/agu/os18/meetingapp.cgi/Paper/322402.
Study element 1d: Nutrients and Physics as Drivers of Production and Aquatic Habitat Conditions
-
Bergamaschi, B., and Downing, B., 2018, The etiology of phytoplankton productivity and bloom formation in the northern Delta [abs.], in 2018 Annual Bay Delta Science Conference, Sacramento, Calif., September 2018.
-
Bergamaschi, B., Downing, B., Kraus, T., and others, 2018, Phytoplankton blooms in the North Delta in water year 2017 [abs.]: Sacramento, Calif., 10th Biennial Bay-Delta Science Conference, September 10–12, 2018, 1 p.
-
Bergamaschi, B.A., Downing, B., Pellerin, B., Kraus, T., Fleck, J., and Fujii, R., 2015, Nutrient and organic carbon cycling processes in tidal marshes and shallow estuarine habitats, in American Geophysical Union Fall Meeting, San Francisco, Calif., December 14–19: San Francisco Calif., American Geophysical Union.
-
Bergamaschi, B., Kraus, T., O’Donnell, K., and Downing, B., 2015, Using continuous sensor data to infer nitrification rates of wastewater-derived ammonium, in Coastal and Estuarine Research Federation Conference, Portland, Oreg., November 8–12: Portland, Oreg., Coastal and Estuarine Research Federation.
-
Bergamaschi, B., Smith, R.A., Shih, J., Sohl, T.L., Sletter, B.M., and Zhu, Z., 2015, Future Nutrient Loads to the Estuary and Approaches for Monitoring [abs.], in Biennial State of the San Francisco Estuary Conference, 12th, Oakland, Calif., September 17–18, 2015: Oakland, Calif., State of the San Francisco Estuary.
-
Dennis, K.J., Carter, J.A., Winkler, R., Downing, B., Kendall, C., and Bergamaschi, B., 2015, Continuous, high-resolution spatial mapping of water isotopes: improving tools for quantifying local evaporation and residence times [abs.], in European Geosciences Union, General Assembly, Vienna, Austria, April 12–17, 2015, Programme: Geophysical Research Abstracts, v. 17, p. 8329.
-
Downing, B., Bergamaschi, B., Kendall, C., Dennis, K.J., Carter, J.A., Kraus, T., and Huang, K., 2015, Using continuous water isotope measurements to understand water residence times in hydrodynamically complex tidal environments, in 2015 Association for the Sciences of Limnology and Oceanography Aquatic Sciences Meeting, Granada, Spain, February 24, Oral presentation: Granada, Spain, Association for the Sciences of Limnology and Oceanography.
-
Downing, B.D., Bergamaschi, B.A., Kraus, T.E.C., Stumpner, E., and O’Donnell, K., 2018, Assessing spatial variability of nutrients, water quality constituents in the San Francisco Estuary using high-speed boat mapping [abs.], in Ocean Sciences Meeting, Portland, Ore., February 11–16, 2018, Program: American Geophysical Union, 1 p.
-
Downing, B.D., Bergamaschi, B.A., Kraus, T.E.C., and O’Donnell, K., 2016, Using continuous sensor data to infer nitrification rates of wastewater-derived ammonium [abs.]: Santa Fe, N. Mex., Association for the Sciences of Limnology and Oceanography Conference, June 5–10, 2016.
-
Downing, B., Bergamaschi, B., Kraus, T., Pellerin, B., and Stumpner, E., 2015, Fixed-station measurements and synoptic spatial characterization provide insights into organic-matter, nutrient, and algal-pigment dynamics in the San Francisco Bay-Delta [abs.], in Biennial State of the San Francisco Estuary Conference, 12th, Oakland, Calif., September 17–18, 2015: San Francisco Estuary Partnership.
-
Downing, B., Bergamaschi, B., Pellerin, B., Nagel S., and O’Donnell, K., 2015, Insights from high frequency continuous monitoring of nutrient dynamics in the Sacramento–San Joaquin Delta [abs.], in Coastal and Estuarine Research Federation Conference, Portland, Oreg., November 8–12, 2015: Portland, Oreg., Coastal Estuarine Research Federation, 1 p.
-
Downing, B.D., and others, 2018, Annual and interannual variation in nitrate concentrations in the North Delta and lower Sacramento River [abs.], in Biennial Bay-Delta Science Conference, 10th, Sacramento, Calif., September 10–12, 2018, 1 p.
-
Downing, B., Pellerin, B.A., Read, J., and Garner, B., 2016, Metadata and diagnostics: information for real-time quality assurance of field sensors [abs.], in Federal Advisory Committee on Water Information, 10th National Monitoring Conference, Tampa, Fla., May 2–6, 2016, https://acwi.gov/monitoring/conference/2016/.
-
Hansen, A., Kraus, T., Downing, B., Rego, J., and Bergamaschi, B., 2018, Mapping nitrogen concentrations in the Delta: Results from a newly developed continuous flow-through ammonium analyzer [abs.], in Biennial Bay-Delta Science Conference, 10th, Sacramento, Calif., September 10–12, 2018, 1 p.
-
Kraus, T.E.C., Bergamaschi, B., and Downing, B., 2017, High-frequency nutrient and biogeochemical monitoring—Connecting the dots between drivers and effects of constituent concentrations, in Annual Water Quality Health Indicator and Data Science Symposium, 2d, Sacramento, Calif., June 29–30, 2017: California Environmental Protection Agency, Surface Water Ambient Monitoring Program (SWAMP), accessed at https://www.waterboards.ca.gov/resources/data_databases/wq_science_symposium.shtml.
-
Kraus, T., Downing, B., and Bergamaschi, B., 2015, In situ, high frequency water quality monitoring tools that can help us detect and understand controls on HABs to inform lake and reservoir management, in Annual California Lake and Reservoir Management (CALMS) Conference, 30th, Ontario, Calif., October 5–6.
-
Kraus, T., Downing, B., and Bergamaschi, B., 2018, Measuring biogeochemical rates effecting nitrogen concentrations in a hydrodynamically complex Delta [abs.], Biennial Bay-Delta Science Conference, 10th, Sacramento, Calif., September 10–12, 2018, 1 p.
-
Kraus, T.E.C., O’Donnell, K., Bergamaschi, B.A., Downing, B.D., and Burau, J.R., 2017, Using paired in situ high-frequency nitrate measurements to better understand controls on nitrate concentrations and estimate nitrification rates [abs.], in Interagency Ecological Program Annual Workshop, Folsom, Calif., March 1–3, 2017.
-
O’Donnell, K., Bergamaschi, B., Downing, B., Kraus, T., Stumpner, E., and others, 2018, Nitrate concentration-discharge relationships in the Sacramento River and Northern Delta—Insights from high frequency data [abs.], in Biennial Bay-Delta Science Conference, Sacramento, Calif., 10th, September 10–12, 2018, 1 p.
-
O’Donnell, K., Gelber, A., Bergamaschi, B., and Downing, B., 2018, Deployment of in situ, high frequency ammonium analyzer in the northern San Francisco Bay Delta, CA [abs.], in Annual Bay Delta Science Conference, Sacramento, Calif., September 2018.
-
O’Donnell, K., Rego, J., Bergamaschi, B.A., Downing, B.D., and Kraus, T.E.C., 2017, Deployment of in situ, high frequency nutrient (ammonium, phosphate) analyzers in the northern San Francisco Bay Delta [abs.], in Annual Inter-Agency Ecological Program Workshop, Folsom, Calif., March 2017.
-
Pellerin, B.A., 2015, Applications of high frequency nutrient sensors in surface and groundwater—A revolution for research and monitoring? [abs.], in NovCare 2015, Lawrence, Kans., May 19–21, 2015, 1 p.
-
Stumpner, E., Bergamaschi, B., Downing, B., O’Donnell, K., Gosselink, S., and Burau, J., 2018, The effects of transport processes on phytoplankton and nutrient dynamics in the Cache Slough Complex: Observations over spatial and temporal scales [abs.], in Biennial Bay-Delta Science Conference, 10th, Sacramento, Calif., September 10–12, 2018, 1 p.
-
Stumpner, E., Bergamaschi, B., Downing, B., Kraus, T., O’Donnell, K., Graham, N., Johnston, T., and Nakatsuka, K., 2018, High-resolution water-quality mapping in the Sacramento-San Joaquin Delta and San Francisco Estuary [abs.], in Biennial Bay-Delta Science Conference, Sacramento, Calif., 10th, September 10–12, 2018, 1 p.
-
Stumpner, E., Bergamaschi, B., Downing, B., Parker, A., Wilkerson, F., Kraus, T., and others, 2016, Spatial variability reveals complex controls on phytoplankton abundance and community structure in a shallow tidal freshwater system [abs.], in Biennial Bay-Delta Science Conference, 9th, Sacramento, Calif., November 15–17, 2016, Oral abstracts: p. 23.
Study element 2c: Wind Waves and Sediment Dynamics in Liberty Island and Little Holland Tract
-
Carlson, E.M., and Lacy, J.R., 2016, Influence of the 2016 Yolo By-Pass flood event on suspended sediment in Little Holland Tract, in Biennial Bay-Delta Science Conference, 9th, Sacramento, Calif., November 2016, Oral presentation.
-
Lacy, J.R., and Carlson, E.M., 2017, Linking sediment dynamics to habitat quality in tidal fresh water shallows, in Oral presentation, Coastal and Estuarine Research Federation Conference, Providence, R.I., November 2017, Oral presentation.
-
Lacy, J.R., Dailey, E., and Morgan, T.A., 2018, Influence of flood and drought on bed erodibility and turbidity in two flooded agricultural tracts in the North Delta, in Biennial Bay-Delta Science Conference, 10th, Sacramento, Calif., September 2018, Oral presentation.
Study element 2e: Physical and Biological Drivers of Fish Populations
-
Ayers, D., Donovan, J., Colombano, D., Stumpner, P., and Feyrer, F., 2018, TidalTrend–A tool to distill large tidal datasets for analysis and visualization: Folsom, Calif., IEP Annual Workshop, Poster presentation.
-
Ayers, D., Smith, C., Stumpner, P., and Feyrer, F., 2016, A high frequency solution to understanding tidal wetlands as fish habitat, in Biennial Bay-Delta Science Conference, 9th, Sacramento, Calif., Poster presentation.
-
Ayers, D., Stumpner, P., Stumpner, E., Young, M., Huddleston, C., Burau, J., and Feyrer, F., 2018, Do physical forcing and landscape features determine habitat Quality in Tidal Marshes?, in Interagency Ecological Program Annual Workshop, Folsom, Calif., Poster presentation.
-
Ayers, D., Young, M.J., Smith, C., and Feyrer, F.V., 2017, Information overload—Efforts to optimize subsampling rates for acoustic camera data, in Interagency Ecological Program Annual Workshop, Folsom, Calif., Oral presentation.
-
Ayers, D.E., Young, M.J., Smith, C.D., and Feyrer, F., 2019, Use of subsampling techniques to improve the precision, accuracy, and efficiency of imaging sonar results, in Interagency Ecological Program Annual Workshop, Folsom, Calif., Poster presentation.
-
Blake, A., Stumpner, P., and Burau, J.R., 2016, Techniques for estimating entrainment rates in riverine junctions under future engineering scenarios, in Biennial Bay-Delta Science Conference, 9th, November 15, 2016, Oral presentation.
-
Brown, L.R., Burau, J.R., Bergamaschi, B.A., Lacy, J.R., Morgan, T., Feyrer, F., Young, M., and Thompson, J.K., 2018, Integrating multiple data types to improve understanding of the North Delta, in Biennial Bay-Delta Science Conference, 10th, Sacramento, Calif., September 10–12, 2018, Oral presentation.
-
Burau, J.R., 2014, Reducing hydrodynamic complexity at junctions and the challenge of producing accurate Lagrangian simulations, in Biennial Bay-Delta Science Conference, 8th, October 28–30, 2014, Oral presentation.
-
Burau, J.R., 2015, Independent science board fish and flows workshop, December 9, 2015: Oral presentation and panel participation.
-
Burau, J.R., 2017, Transiting the future Delta for dummies—A survival guide for juvenile salmon, in Interagency Ecological Program annual meeting, March 1–3, 2017, Oral presentation.
-
Clark, E., Gusto, E., Patton, O., Valle, C., Young, M., and Feyrer, F., 2018, Spatial distribution of sturgeon across an environmental gradient in the upper San Francisco Estuary, California, USA, in Biennial Bay-Delta Science Conference, 10th, Sacramento, Calif., September 10–12, 2018, Poster presentation.
-
Clause, J., Young, M., Ayers, D., and Feyrer, F., 2018, To flood or to build—Using habitat function to inform restoration, in Biennial Bay-Delta Science Conference, 10th, Sacramento, Calif., September 10–12, 2018, Oral presentation.
-
Clause, J., Young, M., Ayers, D., Stumpner, P., and Feyrer, F., 2019, If you build it, they may come—Linking ecological outcomes to physical characteristics in restored habitats, in American Fisheries Society Annual Conference, Reno, Nev., Oral presentation.
-
Clause, J., Young, M., and Feyrer, F., 2018, Contrasting the biological characteristics of two adjacent wetland ecotypes, in Interagency Ecological Program Annual Workshop, Folsom, Calif., Poster presentation.
-
Donovan, J., Ayers, D., Colombano, D., Stumpner, P., and Feyrer, F., 2018, TidalTrend—A tool to distill large tidal datasets for analysis and visualization: Sacramento, Calif., 10th Biennial Bay-Delta Science Conference, September 10–12, 2018, Poster presentation.
-
Feyrer, F., 2015, Drivers of pelagic fish distribution in the north Delta, in Interagency Ecological Program Annual Workshop, Folsom, Calif., Oral presentation.
-
Feyrer, F., Stumpner, P., Ayers, D. Burau, J., and Brown, L., 2016, Physics to fish—Linking stationary and dynamic habitat features to small-scale fish distribution in the Sacramento–San Joaquin Delta, in Biennial Bay-Delta Science Conference, 9th, Sacramento, Calif., Oral presentation.
-
Feyrer, F., Stumpner, P., Burau, J., Ayers, D., and Brown, L., 2016, Physics to fish—Interdisciplinary research for conservation and management, in Bay Delta Science Conference, Oral presentation.
-
Feyrer, F., Young, M., Ayers, D., Patton, O., and Stumpner, P., 2017, When the levee breaks—Drivers of ecological function in the north Delta, in Interagency Ecological Program Annual Workshop, Folsom, Calif., Oral presentation.
-
Feyrer, F., Young, M., Patton, O., Brown, L., Thompson, J., and Parchaso, F., 2018, Patterns of fish community composition and abundance across an open water-tidal wetland interface in the upper San Francisco Estuary provide a recipe for habitat restoration, in Biennial Bay-Delta Science Conference, 10th, Sacramento, Calif., September 10–12, 2018, Oral presentation.
-
Gusto, E., Clark, E., Young, M., Patton, O., Vallee, C., and Feyrer, F., 2017, Estuarine habitat of white sturgeon—Distribution across an environmental gradient in the upper San Francisco Estuary, in Interagency Ecological Program Annual Workshop, Folsom, Calif., Poster presentation.
-
Kathan, J., Young, M., Feyrer, F., Wulff, M., Brown, L., and May, J., 2018, Spatial variation in zooplankton community composition during an unusually wet year, in Biennial Bay-Delta Science Conference, 10th, Sacramento, Calif., September 10–12, 2018, Poster presentation.
-
Larwood, V., Patton, O., Young, M., and Feyrer, F., 2017, Preliminary results on what drives the biological outcomes in the Sacramento deep water shipping channel, in Interagency Ecological Program Annual Workshop, Folsom, Calif., Poster presentation.
-
Larwood, V., Patton, O., Young, M., and Feyrer, F., 2019, White sturgeon distribution across a physical habitat gradient in the San Francisco Estuary, California, in American Fisheries Society Annual Conference, Reno, Nev., Oral presentation.
-
Larwood, V., Young, M., Patton, O., and Feyrer, F., 2018, Terminal channel dynamics—Sacramento Deep Water Shipping Channel as a model system, in Biennial Bay-Delta Science Conference, 10th, Sacramento, Calif., September 10–12, 2018, Oral presentation.
-
Patton, O., Young, M., Feyrer, F., and O’Rear, T., 2018, Contextualizing fish communities of a model wetland near Suisun Bay, in Biennial Bay-Delta Science Conference, 10th, Sacramento, Calif., September 10–12, 2018, Poster presentation.
-
Patton, O., and Feyrer, F.V., 2017, A look into the spatial variability and fish community structure at Ryer Island, in Interagency Ecological Program Annual Workshop, Folsom, Calif., Poster presentation.
-
Patton, O., Young, M.J., and Feyrer, F.V., 2017, Fish diversity and density along an open water/tidal wetland interface in the upper San Francisco Estuary, California, USA, in American Fisheries Society National Meeting, Tampa, Fla., Poster presentation.
-
Smith, C., Ayers, D., Stumpner, P., and Feyrer, F., 2016, Lots of data without the fishy smell—Application of acoustic imaging to evaluate fish behavior near tidal wetlands, in Biennial Bay-Delta Science Conference, 9th, Sacramento, Calif., Poster presentation.
-
Smith, C., Ayers, D., Stumpner, P., and Feyrer, F.V., 2017, Evaluating fish abundance and behavior at tidal wetland entrances using acoustic imaging, in Interagency Ecological Program Annual Workshop, Folsom, Calif., Poster presentation.
-
Steinke, D., Young, M., Durand, J., and Feyrer, F., 2018, Differential habitat use of tule perch (Hysterocarpus traskii) and Lepomis sp. in the Cache Slough Complex, in Biennial Bay-Delta Science Conference, 10th, Sacramento, Calif., September 10–12, 2018, Poster presentation.
-
Stienke, D., Young, M., and Feyrer, F., 2017, Differences in fish communities Across the northern Sacramento–San Joaquin Delta, in Interagency Ecological Program Annual Workshop, Folsom, Calif., Poster presentation.
-
Stumpner P., Burau, J.R., and Blake, A., 2016, Hydrodynamics in a river bend adjacent to the FremontWeir—Implications for fish passage structures, in Biennial Bay-Delta Science Conference, 9th, November 15, 2016, Oral presentation.
-
Wulff, M., and Feyrer, F.V., 2017, Gillnet selectivity for fishes of the upper San Francisco Estuary and Sacramento–San Joaquin Delta, in Interagency Ecological Program Annual Workshop, Folsom, Calif., Poster presentation.
-
Young, M.J., Ayers, D., Smith, C., Contreras, D., and Feyrer, F.V., 2017, A novel approach to assessing movement and habitat use by fish communities, in Interagency Ecological Program Annual Workshop, Folsom, Calif., Poster presentation.
-
Young, M.J., Clark, E., Patton, O., Ayers, D, Mahardja, B., La Luz, F., and Feyrer, F.V., 2017, California dreamin’—Conservation challenges for California’s Endemic Minnows, in American Fisheries Society National Meeting, Tampa, Fla., Oral presentation.
-
Young, M., Clause, J., Farruggia, N.J., Stumpner, P., and Feyrer, F., 2019, Restored tidal wetlands—Configuration, fish assemblage, and distribution, in Interagency Ecological Program Annual Workshop, Folsom, Calif., Oral presentation.
-
Young, M., Durand, J., and Feyrer, F., 2017, Magnificent minnows: Distribution of Cypriniform fishes in the Cache Slough Complex, in Interagency Ecological Program Annual Workshop, Folsom, Calif., Oral presentation.
-
Young, M., Durand, J., and Feyrer, F., 2018, Fish communities of the Cache Slough Complex—Marshes, Macrophytes, and Liberty Island, in Biennial Bay-Delta Science Conference, 10th, Sacramento, Calif., September 10–12, 2018, Oral presentation.
-
Young, M., Farruggia, M.J., Larwood, V., Clause, J.K., and Feyrer, F., 2018, Determining macrophyte contribution to particulate organic matter in a restored tidal wetland, in Biennial Bay-Delta Science Conference, 10th, Sacramento, Calif., September 10–12, 2018, Poster presentation.
Task 3: Coordination and Annual Reporting
-
Brown, L.R., Burau, J.R., Bergamaschi, B.A., Lacy, J.R., Morgan, T., Feyrer, F., Young, M., and Thompson, J.K., 2018, Integrating multiple data types to improve understanding of the North Delta, in Biennial Bay-Delta Science Conference, 10th, Sacramento, Calif., September 10–12, 2018, Oral presentation.
Completed USGS Data Releases, Reports, and Journal Articles
Note: numerous database deliverables (CDEC, NWIS) as well as quarterly progress reports have also been completed, but are not listed here.
Study element 1a: Defining Aquatic Habitats in the North and Central Delta: Tidal Flow and Turbidity Stations
-
Burau, J.R., Ruhl, C.A., and Work, P.A., 2016, Innovation in monitoring—The U.S. Geological Survey Sacramento–San Joaquin River Delta, California, flow-station network: U.S. Geological Survey Fact Sheet 2015–3061, 6 p., https://doi.org/10.3133/fs20153061.
Study element 1b: Delta Suspended-Sediment Concentrations and Flux
-
Conlen, A.L., and Morgan-King, T.L., 2021, Model archive summary for turbidity derived suspended-sediment concentrations at USGS station 11455315 Cache Slough at South Liberty Island Near Rio Vista, CA: U.S. Geological Survey, https://doi.org/10.5066/P9FI5B88.
-
Conlen, A.L., and Morgan-King, T.L., 2021, Model archive summary for turbidity derived suspended-sediment concentrations at USGS station 11455335 Sacramento River Deep Water Ship Channel Near Rio Vista, CA: U.S. Geological Survey, https://doi.org/10.5066/P9LYA4BI.
-
Conlen, A.L., and Morgan-King, T.L., 2021, Model archive summary for turbidity derived suspended-sediment concentrations at USGS station Cache Slough at Ryer Island, CA (2008–2013): U.S. Geological Survey, https://doi.org/10.5066/P94NJ2ZQ.
-
Conlen, A.L., and Morgan-King, T.L., 2021, Model archive summary for turbidity derived suspended-sediment concentrations at USGS station 11312676 Middle River at Middle River, CA (2010–2015): U.S. Geological Survey, https://doi.org/10.5066/P9EFRLW4.
-
Conlen, A.L., and Morgan-King, T.L., 2021, Model archive summary for turbidity derived suspended-sediment concentrations at USGS station 11337190 San Joaquin River at Jersey Point, CA: U.S. Geological Survey, https://doi.org/10.5066/P9OKD93I.
-
Marineau, M.D., and Wright, S.A., 2017, Bed-material characteristics of the Sacramento–San Joaquin Delta, California, 2010–13: U.S. Geological Survey Data Series 1026, 55 p., https://doi.org/10.3133/ds1026.
-
Morgan-King, T.L., and Conlen, A.L., 2021, Model archive summary for turbidity derived suspended-sediment concentrations at USGS station 11455143 Little Holland Tract North Breach, CA: U.S. Geological Survey, https://doi.org/10.5066/P990P1IE.
-
Morgan-King, T.L., and Conlen, A.L., 2021, Model archive summary for turbidity derived suspended-sediment concentrations at USGS station 11455146 Liberty Cut at Little Holland Tract Near Courtland, CA: U.S. Geological Survey, https://doi.org/10.5066/P9N3E505.
-
Morgan-King, T.L., and Conlen, A.L., 2021, Model archive summary for turbidity derived suspended-sediment concentrations at USGS station 11455139 Toe Drain at Mallard Rd. Near Courtland, CA: U.S. Geological Survey, https://doi.org/10.5066/P9TDFO6T.
-
Morgan-King, T.L., and Conlen, A.L., 2021, Model archive summary for turbidity derived suspended-sediment concentrations at USGS station 11455167 Prospect Slough at Toe Drain Near Courtland, CA: U.S. Geological Survey, https://doi.org/10.5066/P9F1ARTI.
-
Morgan-King, T.L., and Conlen, A.L., 2021, Model archive summary for turbidity derived suspended-sediment concentrations at USGS station 11455315 Cache Slough at South Liberty Island Near Rio Vista, CA: U.S. Geological Survey, https://doi.org/10.5066/P9I9N407.
-
Morgan-King, T.L., and Conlen, A.L., 2021, Model archive summary for turbidity derived suspended-sediment concentrations at USGS station 11312676 Middle River at Middle River, CA (2015–2020): U.S. Geological Survey, https://doi.org/10.5066/P9MGMO7Q.
-
Morgan-King, T.L., and Conlen, A.L., 2021, Model archive summary for turbidity derived suspended-sediment concentrations at USGS station 11304810 San Joaquin River Below Garwood Bridge at Stockton, CA (2010–2014): U.S. Geological Survey, https://doi.org/10.5066/P9E7BRJ0.
-
Morgan-King, T.L., and Conlen, A.L., 2021, Model archive summary for turbidity derived suspended-sediment concentrations at USGS station 11447903 Georgiana Slough Near Sacramento River, CA (2010–2015): U.S. Geological Survey, https://doi.org/10.5066/P9E0460S.
-
Morgan-King, T.L., and Conlen, A.L., 2022, Model archive summary and time-series suspended-sediment concentrations computed from a surrogate turbidity regression at USGS station 11313405 Old River at Bacon Island, CA (2010–2019): U.S. Geological Survey data release, https://doi.org/10.5066/P9FW7L0B.
-
Morgan-King, T.L., and Conlen, A.L., 2022, Model archive summary for turbidity derived suspended-sediment concentrations at USGS station 11455165 Miner Slough at Highway 84 Bridge, CA: U.S. Geological Survey, https://doi.org/10.5066/P9FP5FK3.
Study element 1c: Understanding Aquatic Habitats in Suisun Bay: Monitoring Turbidity and Suspended-Sediment Concentration at Benicia
-
Buchanan, P.A., Downing-Kunz, M.A., Schoellhamer, D.H., and Livsey, D.N., 2018, Continuous water-quality and suspended-sediment transport monitoring in the San Francisco Bay, California, water years 2014–15 (ver. 1.1, May 2018): U.S. Geological Survey Fact Sheet 2018–3013, 5 p., https://doi.org/10.3133/fs20183013.
-
Downing-Kunz, M.A., Schoellhamer, D.H., and Livsey, D.N., 2020, Continuous water-quality and suspended-sediment transport monitoring in the San Francisco Bay, California, water years 2016–17: U.S. Geological Survey Fact Sheet 2020–3023, 4 p., https://doi.org/10.3133/fs20203023.
-
Schoellhamer, D., McKee, L., Pearce, S., Kauhanen, P., Salomon, M., Dusterhoff, S., Grenier, J.L., Marineau, M., and Trowbridge, P., 2018, Sediment supply to San Francisco Bay, water years 1995 through 2016—Data, trends, and monitoring recommendations to support decisions about water quality, tidal wetlands, and resilience to sea level rise: Richmond, Calif., San Francisco Estuary Institute, SFEI Contribution Number 842.
Study element 1d: Nutrients and Physics as Drivers of Production and Aquatic Habitat Conditions
-
Bergamaschi, B.A., Downing, B.D., Kraus, T.E.C., and Pellerin, B.A., 2017, Designing a high-frequency nutrient and biogeochemical monitoring network for the Sacramento–San Joaquin Delta, northern California: U.S. Geological Survey Scientific Investigations Report 2017–5058, 40 p., https://doi.org/10.3133/sir20175058.
-
Dahm, C.N., Parker, A.E., Adelson, A.E., Christman, M.A., and Bergamaschi, B.A., 2016, Nutrient dynamics of the Delta—Effects on primary producers: San Francisco Estuary and Watershed Science, v. 14, no. 4 (December), 35 p., https://doi.org/10.15447/sfews.2016v14iss4art4.
-
Downing, B.D., Bergamaschi, B.A., Kendall, C., Kraus, T.E.C., Dennis, K.J., Carter, J.A., and Von Dessonneck, T.S., 2016, Using continuous underway isotope measurements to map water residence time in hydrodynamically complex tidal environments: Environmental Science and Technology, v. 50, no. 24, p. 13387–13396, https://doi.org/10.1021/acs.est.6b05745.
-
Downing, B.D., Bergamaschi, B.A., and Kraus, T.E.C., 2017, Synthesis of data from high-frequency nutrient and associated biogeochemical monitoring for the Sacramento–San Joaquin Delta, northern California: U.S. Geological Survey Scientific Investigations Report 2017–5066, 28 p., https://doi.org/10.3133/sir20175066.
-
Kimmerer, W.J., Ignoffo, T.R., Bemowski, B., Modéran, J., Holmes, A., and Bergamaschi, B., 2018, Zooplankton dynamics in the Cache Slough Complex of the Upper San Francisco Estuary: San Francisco Estuary and Watershed Science, v. 16, no. 3, 25 p., https://doi.org/10.15447/sfews.2018v16iss3art4.
-
Kraus, T.E., Bergamaschi, B.A., and Downing, B.D., 2017a, An introduction to high-frequency nutrient and biogeochemical monitoring for the Sacramento–San Joaquin Delta, northern California: U.S. Geological Survey Scientific Investigations Report 2017–5071, 41 p., https://doi.org/10.3133/sir20175071.
-
Kraus, T.E.C., Carpenter, K.D., Bergamaschi, B.A., Parker, A.E., Stumpner, E.B., Downing, B.D., Travis, N.M., Wilkerson, F.P., Kendall, C., and Mussen, T.D., 2017b, A river‐scale Lagrangian experiment examining controls on phytoplankton dynamics in the presence and absence of treated wastewater effluent high in ammonium: Limnology and Oceanography, v. 62, no. 3, p. 1234–1253, https://doi.org/10.1002/lno.10497.
-
Kraus, T.E.C., O'Donnell, K., Downing, B.D., Burau, J.R., and Bergamaschi, B.A., 2017c, Using paired in situ high frequency nitrate measurements to better understand controls on nitrate concentrations and estimate nitrification rates in a wastewater-impacted river: Water Resources Research, v. 53, no. 10, p. 8423–8442, https://doi.org/10.1002/2017WR020670.
-
O'Donnell, K., Gelber, A., Graham, N., Stumpner, E., Gosselink, S., Richardson, E., Kraus, T., Downing, B., and Bergamaschi, B., 2021, Assessment of nutrients and water-quality constituents in the North Delta during Yolo By-Pass flooding events in March 2017: U.S. Geological Survey data release, https://doi.org/10.5066/P9SD54QW.
-
O'Donnell, K., Richardson, E., Gelber, A., Graham, N., Gosselink, S., Stumpner, E., Kraus, T., Downing, B., and Bergamaschi, B., 2021, Assessment of nutrients and water-quality constituents at the Sacramento-San Joaquin River Confluence during a phytoplankton bloom in July 2017: U.S. Geological Survey data release, https://doi.org/10.5066/P9DI7VSY.
-
Stumpner, E.B., Bergamaschi, B.A., Kraus, T.E.C., Parker, A.E., Wilkerson, F.P., Downing, B.D., Dugdale, R.C., Murrell, M.C., Carpenter, K.D., Orlando, J.L., and Kendall, C., 2020, Spatial variability of phytoplankton in a shallow tidal freshwater system reveals complex controls on abundance and community structure: Science of the Total Environment, v. 700, 17 p., https://doi.org/10.1016/j.scitotenv.2019.134392.
-
Stumpner, E.B., Bergamaschi, B.A., Downing, B.D., Kraus, T., O'Donnell, K., Soto Perez, J., and Steinke, D.A., 2020, Assessment of water-quality in the California Sacramento–San Joaquin Delta during a North Delta directed flow action: August - October 2018 (ver. 2.0, September 2021): U.S. Geological Survey data release, https://doi.org/10.5066/P9EFDWZP.
Study element 2a: Water Transport and Constituent Flux in Little Holland Tract
Section included in this Synthesis report.
Study element 2b: Drivers of Aquatic Habitat Conditions: Physical Attributes and Dynamics of the Deep Water Ship Channel
-
Lenoch, L.E.K., Stumpner, P.R., Burau, J.R., Loken, L.C., and Sadro, S., 2021, Dispersion and stratification dynamics in the Upper Sacramento River Deep Water Ship Channel: San Francisco Estuary and Watershed Science, v. 19, no. 4, 29 p., https://doi.org/10.15447/sfews.2021v19iss4art5.
-
Stumpner, P.R., Burau, J.R., and Forrest, A.L., 2021, A lagrangian-to-eulerian metric to identify estuarine pelagic habitats: Estuaries and Coasts v. 44, p. 1231–1249, https://doi.org/10.1007/s12237-020-00861-7.
Study element 2c: Wind Waves and Sediment Dynamics in Liberty Island and Little Holland Tract
-
Lacy, J.R., Carlson, E.M., and Ferreira, J.C.T., 2016, Wind-wave and sediment-transport time-series data from Liberty Island and Little Holland Tract, Sacramento–San Joaquin Delta, California, 2015–2017 (ver. 2.0, September 2019): U.S. Geological Survey data release, https://doi.org/10.5066/F73R0R07.
-
Lacy, J.R., Dailey, E.T., and Carlson, E.M., 2018, Bed sediment properties in Little Holland Tract and Liberty Island, Sacramento–San Joaquin Delta, California, 2014 to 2017: U.S. Geological Survey data release, https://doi.org/10.5066/F7V1241K.
-
Snyder, A.G., Lacy, J.R., Stevens, A.W., and Carlson, E.M., 2016, Bathymetric survey and digital elevation model of Little Holland Tract, Sacramento–San Joaquin Delta, California: U.S. Geological Survey Open-File Report 2016‒1093, 14 p., https://doi.org/10.3133/ofr20161093.
-
Snyder, A.G., Stevens, A.W., Carlson, E., and Lacy, J.R., 2016, Digital elevation model of Little Holland Tract, Sacramento–San Joaquin Delta, California, 2015: U.S. Geological Survey data release, https://doi.org/10.5066/F7RX9954.
Study element 2d: Drivers of Aquatic Habitat Quality: The Role of the Benthos
-
Flow Alteration-Management Analysis and Synthesis Team, 2022, White papers providing a synthesis of knowledge relating to Delta Smelt biology in the San Francisco Estuary, emphasizing effects of flow: Interagency Ecological Program, Sacramento, CA. IEP Technical Report 98, 191 p., https://nrm.dfg.ca.gov/FileHandler.ashx?DocumentID=200748&inline.
-
Kimmerer, W., Wilkerson, F., Downing, B., Dugdale, R., Gross, E.S., Kayfetz, K., Khanna, S., Parker, A.E, and Thompson, J., 2019, Effects of drought and the emergency drought barrier on the ecosystem of the California Delta: San Francisco Estuary and Watershed Science, v. 17, no. 3, 28 p., https://doi.org/10.15447/sfews.2019v17iss3art2.
-
Shrader, K.H., Zierdt Smith, E.L, Parchaso, F., and Thompson, J.K., 2020, Benthic Community and Bivalve Metrics Data in the Sacramento–San Joaquin Delta from 2015 to 2018: U.S. Geological Survey data release, https://doi.org/10.5066/P9JJOL3W.
-
Zierdt Smith, E.L., Shrader, K.H., Parchaso, F., and Thompson, J.K., 2021, A spatially and temporally intensive sampling study of benthic community and bivalve metrics in the Sacramento–San Joaquin Delta (ver. 2.0, May 2021): U.S. Geological Survey data release, https://doi.org/10.5066/P93BAY64.
Study element 2e: Physical and Biological Drivers of Fish Populations
-
Ayers, D., 2020, Scientific observations of fishes in tidal wetlands of the upper Sacramento–San Joaquin Delta using imaging sonar devices, derived from 2018 field data: U.S. Geological Survey data release, https://doi.org/10.5066/P997P4GM.
-
Enos, E.R., Steinke, D.A., Young, M.J., and Feyrer, F.V., 2020, Little Holland Tract and Wildlands Flux Study; Zooplankton, Phytoplankton, and Larval Fish Taxonomic Data, 2017–2018: U.S. Geological Survey data release, https://doi.org/10.5066/P9217ML2.
-
Farruggia, M.J., Clause, J.K., Feyrer, F.V., and Young, M.J., 2019, Fish abundance and distribution in restored tidal wetlands in the northern Sacramento–San Joaquin Delta, California, 2017–2018: U.S. Geological Survey data release, https://doi.org/10.5066/P9F0ZASV.
-
Feyrer, F., Young, M.J., Huntsman, B.M., and Brown, L.R., 2021, Disentangling stationary and dynamic estuarine fish habitat to inform conservation: species-specific responses to physical habitat and water quality in the San Francisco Estuary: Marine and Coastal Fisheries: Dynamics, Management, and Ecosystem Science, v. 13, no. 5, p. 548–563, https://doi.org/10.1002/mcf2.10183.
-
Gusto, E.V., Steinke, D.A., Young, M.J., and Feyrer, F.V., 2020, Zooplankton Survey of the Northern Sacramento–San Joaquin Delta, California, 2016–2018: U.S. Geological Survey data release, https://doi.org/10.5066/P9OZWUIP.
-
Huntsman, B.M., Feyrer, F.V., and Young, M.J., 2020a, Largemouth bass population assessment within flooded islands of the Sacramento–San Joaquin Delta: U.S. Geological Survey data release, https://doi.org/10.5066/P9ALAHE8.
-
Huntsman, B.M., Feyrer, F., Young, M.J., Hobbs, J.A., Acuña, S., Kirsch, J.E., Mahardja, B., and Teh, S., 2020b, Recruitment dynamics of non-native largemouth bass within the Sacramento–San Joaquin Delta: Canadian Journal of Fisheries and Aquatic Sciences, v. 78, no. 5, p. 505–521, https://doi.org/10.1139/cjfas-2020-0241.
-
Huntsman, B.M., Young, M.J., Feyrer, F.V., Stumpner, P.R., Brown, L.R., and Burau, J.R., 2023, Hydrodynamics and habitat interact to structure fish communities within terminal channels of a tidal freshwater delta: Ecosphere, v. 14, no. 1, 18 p., https://doi.org/10.1002/ecs2.4339.
-
Larwood, V.L., Steinke, D.A., Young, M.J., and Feyrer, F.V., 2020b, Physical and Biological Drivers of Fish Populations in the Sacramento Deep Water Shipping Channel, California, 2016–2018: U.S. Geological Survey data release, https://doi.org/10.5066/P9VCNYAZ.
-
Patton, O., Larwood, V., Young, M., and Feyrer, F., 2020, Estuarine habitat of white sturgeon: San Francisco Estuary and Watershed Science, v. 18, no. 4, 10 p., https://doi.org/10.15447/sfews.2020v18iss4art4.
-
Steinke, D.A., Young, M.J., and Feyrer, F.V., 2019, Fishes of Ryer Island, Suisun Bay, California, 2016–2017: U.S. Geological Survey data release, https://doi.org/10.5066/P94A0YGJ.
-
Steinke, D.A., Young, M.J., and Feyrer, F.V., 2019a, Abundance and distribution of fishes in the northern Sacramento–San Joaquin Delta, California, 2017–2018 (ver. 1.1, December 2019): U.S. Geological Survey data release, https://doi.org/10.5066/P9FUQXJL.
-
Steinke, D.A., Young, M.J., and Feyrer, F.V., 2019b, White sturgeon set line sampling at Ryer Island, Suisun Bay, California, 2017–2018: U.S. Geological Survey data release, https://doi.org/10.5066/P9087XOC.
-
Steinke, D.A., Young, M.J., Smith, C.D., and Feyrer, F.V., 2019c, Diets of striped bass and Sacramento pikeminnow at Ryer Island, Suisun Bay, California, 2018: U.S. Geological Survey data release, https://doi.org/10.5066/P9YGG46K.
-
Valentine, D., Young, M., and Feyrer, F., 2020, Sacramento pikeminnow migration record: Journal of Fish and Wildlife Management, v. 11, no. 2, p. 588–592, https://doi.org/10.3996/JFWM-20-038.
-
Wulff, M.L., Feyrer, F.V., and Young, M.J., 2019, Gillnet data for fishes of the upper San Francisco Estuary: U.S. Geological Survey data release, https://doi.org/10.5066/P99HDPFT.
-
Wulff, M.L., Feyrer, F.V., and Young, M.J., 2022, Gill net selectivity for fifteen fish species of the upper San Francisco Estuary: San Francisco Estuary and Watershed Science, v. 20, no. 2, 10 p., https://doi.org/10.15447/sfews.2022v20iss2art4.
-
Young, M.J., Feyrer, F., Stumpner, P.R., Larwood, V., Patton, O., and Brown, L.R., 2020, Hydrodynamics drive pelagic communities and food web structure in a tidal environment: International Review of Hydrobiology, v. 106, no. 2, p. 69–85, https://doi.org/10.1002/iroh.202002063.
-
Young, M.J., Feyrer, F., Smith, C.D., and Valentine, D.A., 2022, Habitat-specific foraging by Striped Bass (Morone saxatilis) in the San Francisco Estuary, California: San Francisco Estuary and Watershed Science, v. 20, no. 3, 19 p., https://doi.org/10.15447/sfews.2022v20iss3art4.
Task 3: Coordination and Annual Reporting
-
Brown, L.R., Burau, J., Morgan-King, T., Wright, S., Schoellhamer, D., Downing-Kunz, M., Bergamaschi, B., Downing, B., Stumpner, P., Lacy, J., Thompson, J., Parchaso, F., Feyrer, F., and Young, M., 2016, Scientific support for adaptive management in the Sacramento–San Joaquin Bay-Delta—Understanding the physical and biological processes that influence aquatic habitat quality for Delta smelt and other imperiled fish populations, Annual Report 2015: Annual Report from USGS to Reclamation.
-
Brown, L.R., Burau, J., Morgan-King, T., Wright, S., Schoellhamer, D., Downing-Kunz, M., Bergamaschi, B., Downing, B., Stumpner, P., Lacy, J., Thompson, J., Parchaso, F., Feyrer, F., and Young, M., 2017, Scientific support for adaptive management in the Sacramento–San Joaquin Bay-Delta—Understanding the physical and biological processes that influence aquatic habitat quality for Delta smelt and other imperiled fish populations, Annual Report 2016: Annual Report from USGS to Reclamation.
-
Brown, L.R., Burau, J., Morgan-King, T., Wright, S., Schoellhamer, D., Downing-Kunz, M., Bergamaschi, B., Downing, B., Stumpner, P., Lacy, J., Thompson, J., Parchaso, F., Feyrer, F., and Young, M., 2018, Scientific support for adaptive management in the Sacramento–San Joaquin Bay-Delta—Understanding the physical and biological processes that influence aquatic habitat quality for Delta smelt and other imperiled fish populations, Annual Report 2017: Annual Report from USGS to Reclamation.
Conversion Factors
U.S. customary units to International System of Units
International System of Units to U.S. customary units
Temperature in degrees Celsius (°C) may be converted to degrees Fahrenheit (°F) as follows:
°F = (1.8 × °C) + 32.
Datum
Vertical coordinate information is referenced to the North American Vertical Datum of 1988 (NAVD 88).
Horizontal coordinate information is referenced to the North American Datum of 1983 (NAD 83).
Altitude, as used in this report, refers to distance above the vertical datum.
Supplemental Information
Specific conductance is given in microsiemens per centimeter at 25 degrees Celsius (µS/cm at 25 °C).
Concentrations of chemical constituents in water are given in milligrams per liter (mg/L), micrograms per liter (µg/L), or micromolar (µM).
Grazing rate turnover (GRTO) is the volume of water filtered by bivalves per square meter per day (m3/m2/d).
Salinity is given in practical salinity units (PSU).
Turbidity is given as either formazin nephelometric units (FNU) or nephelometric turbidity units (NTU).
Dissolved oxygen is given in percent saturation (%) or concentration in milligrams per liter (mg/L).
Fluorescent dissolved organic matter (fDOM) is given in quinine sulfate units (QSU).
Rate of suspended-sediment flux is given in units of grams per second (g/s) or metric tons per 15 minutes (t/15min).
Total suspended-sediment flux is given in units of metric tons (t), thousand metric tons (Kt), or million metric tons (Mt).
Rate of zooplankton flux is given in individuals per cubic meter per 15 minutes (individuals/m3/15min).
Total flux of zooplankton is given as counts of total individuals.
Mean biomasses of pelagic community constituents are given in grams per 100 cubic meters (g/100m3).
Transport (water-residence) time is given in days (d).
Habitat-averaged phytoplankton biomass is given in micrograms of chlorophyll-a per liter (µg Chl-a/L).
Habitat-averaged net primary productivity is given in milligrams of chlorophyll per square meter per day (mg Chl/m2/d).
Biomass and distribution of biomass of Potamocorbula amurensis and Corbicula fluminea are given in grams of ash-free dry weight (AFDW) per square meter (g AFDW/m2).
Corbicula recruits are given in number of recruits per 0.05 square meter (recruits/0.05m2).
Speeds of otter trawl tows are given in kilometers per hour (km/h).
Dispersive and advective flux measured in metric tons/15-minutes.
Wind speed is given in miles per hour (mi/h).
Total fish catch per unit effort (CPUE) is given in number of fishes per hour (#/hr).
Predicted fish catch per unit effort (CPUE) is given in number of fishes per 5-minute otter trawl or number of fishes per 1-hour gillnet set.
Abbreviations
CM
channel marker
CPUE
catch per unit effort
CVP
Central Valley Project
DO
dissolved oxygen
ETM
estuarine turbidity maximum
GRTO
grazing rate turnover
IEP
Interagency Ecological Program
LE
Lagrangian to Eulerian
NWIS
National Water Information System
Reclamation
Bureau of Reclamation
SAV
submerged aquatic vegetation
SSC
suspended-sediment concentration
SSF
suspended-sediment flux
SWP
State Water Project
TM
turbidity maximum
UNR
unrestored connecting channels
USGS
U.S. Geological Survey
WWTP
wastewater treatment plant
WY
water year
For more information concerning the research in this report, contact the
Director, California Water Science Center
U.S. Geological Survey
6000 J Street, Placer Hall
Sacramento, California 95819
https://www.usgs.gov/centers/ca-water/
Publishing support provided by the U.S. Geological Survey
Science Publishing Network, Sacramento Publishing Service Center
Disclaimers
Any use of trade, firm, or product names is for descriptive purposes only and does not imply endorsement by the U.S. Government.
Although this information product, for the most part, is in the public domain, it also may contain copyrighted materials as noted in the text. Permission to reproduce copyrighted items must be secured from the copyright owner.
Suggested Citation
Brown, L.R., Ayers, D.E., Bergamaschi, B., Burau, J.R., Dailey, E.T., Downing, B., Downing-Kunz, M., Feyrer, F.V., Huntsman, B.M., Kraus, T., Morgan, T., Lacy, J.R., Parchaso, F., Ruhl, C.A., Stumpner, E., Stumpner, P., Thompson, J., and Young, M.J., 2024, Physics to fish—Understanding the factors that create and sustain native fish habitat in the San Francisco Estuary: U.S. Geological Survey Open-File Report 2023–1087, 150 p., https://doi.org/10.3133/ofr20231087.
ISSN: 2331-1258 (online)
Study Area
| Publication type | Report |
|---|---|
| Publication Subtype | USGS Numbered Series |
| Title | Physics to fish—Understanding the factors that create and sustain native fish habitat in the San Francisco Estuary |
| Series title | Open-File Report |
| Series number | 2023-1087 |
| DOI | 10.3133/ofr20231087 |
| Publication Date | January 16, 2024 |
| Year Published | 2024 |
| Language | English |
| Publisher | U.S. Geological Survey |
| Publisher location | Reston, VA |
| Contributing office(s) | California Water Science Center, National Research Program - Western Branch, Pacific Coastal and Marine Science Center, WMA - Earth System Processes Division |
| Description | xiv, 150 p. |
| Country | United States |
| State | California |
| Other Geospatial | San Francisco Estuary |
| Online Only (Y/N) | Y |