

Occurrence of Mixed Organic and Inorganic Chemicals in Groundwater and Tapwater, Town of Campbell, Wisconsin, 2021–22
Links
- Document: Report (1.62 MB pdf) , HTML , XML
- Data Releases:
- USGS data release - Target-chemical concentrations for assessment of mixed-organic/inorganic chemical and biological exposures in private-well tapwater at Campbell, Wisconsin, 2021
- USGS data release - Quarterly sample results for perand polyfluoroalkyl substances (PFAS) for locations in Campbell, Wisconsin, 2021–22
- NGMDB Index Page: National Geologic Map Database Index Page (html)
- Download citation as: RIS | Dublin Core
Acknowledgments
The authors would like to thank the volunteers who participated in this study for their time and effort.
Abstract
In response to previous reports of per- and polyfluoroalkyl substances (PFAS) contamination in French Island’s (located in the Mississippi River within the town of Campbell, Wisconsin) primary source of drinking water, 11 locations were sampled by the U.S. Geological Survey (USGS) in October 2021 to assess the potential presence of contaminant mixtures, including PFAS, in tapwater. Three locations were assessed seven times each over the course of three days. These samples were chosen to evaluate the water quality of the deeper Mount Simon bedrock aquifer and the water quality of the shallower sand and gravel (alluvial) aquifer at two locations. The other eight sample locations were spatially distributed within Campbell and were sampled once each. For each of these 11 sites, tapwater samples were analyzed for disinfection byproducts (DBP), pesticides, PFAS, pharmaceuticals, semi-volatile organic compounds (SVOC), volatile organic compounds (VOC), cations, anions, trace elements, alkalinity, microbial indicators, as well as measurements of water temperature, specific conductance, and pH. Of the 506 organic compounds analyzed in each water-quality sample, 74 (14 percent) were detected at least one time in any of the samples collected. Of the 14 percent, detected analytes included 27 pesticides (5 percent), 14 PFAS (3 percent), 6 pharmaceuticals (1 percent), 7 SVOC (1 percent), and 20 VOC (4 percent). No DBP were detected. The total number of organic compounds detected per sample ranged from 0–20 (median of 10), with the sum of concentrations ranging from not detected (nd)–2.53 micrograms per liter (μg/L; median of 0.333 μg/L). Of the inorganic constituents measured, eight were not detected above their reporting limit in any of the samples. The inorganic constituents that were not detected were antimony, arsenic, beryllium, cadmium, cobalt, molybdenum, selenium, and vanadium.
Along with the 11 sites sampled throughout Campbell, Wisconsin, beginning in October 2021, four more wells were sampled on the Upper Midwest Environmental Sciences Center (UMESC) campus for PFAS. Three of these sites withdraw water from the shallow alluvial aquifer (the same source water for tapwater site 002) and one from the Mount Simon aquifer (the same source of water for tapwater site 001). This sampling is ongoing with results from samples through December 2022 summarized in this report. Of the 33 PFAS analyzed in samples from the four UMESC locations, 15 individual PFAS were detected at least one time in any of the samples analyzed with the sum of PFAS concentrations ranging from nd–1.49 μg/L (median of 0.309 μg/L).
Introduction
Due to human influences on water resources and quality, the U.S. Geological Survey (USGS) Environmental Health Program (EHP) has been conducting tapwater exposure studies assessing potential human exposures to contaminant mixtures in point-of-use (point-of-exposure) drinking water around the nation since 2016. To date, eight studies assessing co-occurring organic and inorganic chemical constituents, microbial indicators, and in-vitro bioactivities have been completed at the point-of-use in public supply and private-well tapwater as well as bottled water (Bradley and others, 2018, 2020, 2021a, 2021b, 2022, 2023a, 2023b and Smalling and others, 2023). These samplings were conducted at 243 locations, including 159 public-supply (source water, pre-distribution drinking water, and point-of-use tapwater), 53 private-groundwater locations, as well as samples from 31 bottled water brands, and additional studies are on-going. The current collaborative study, while building on the broader tapwater portfolio, was conducted in Campbell, Wisconsin in 2021 to support ongoing efforts to address community drinking-water concerns arising from per- and polyfluoroalkyl substances (PFAS) contamination within the shallow alluvial aquifer, which is utilized by the residents of Campbell for their drinking water (Schultz, 2021).
While working in conjunction with the USGS Upper Midwest Environmental Sciences Center (UMESC) and the town of Campbell (located on French Island in the middle of the Mississippi River in Wisconsin), the USGS collected samples from 11 sites (8 tapwater and 3 groundwater wells, fig. 1). All samples were collected from private residential- or community-groundwater well locations. The groundwater source for 10 of the sampling locations was the shallow, unconsolidated alluvial aquifer composed of sand and gravel (referred to as the alluvial aquifer in this report) discussed in Hunt and others (2003) that currently serves as the primary drinking-water source for the 4,462 residents of Campbell (U.S. Census Bureau, 2023). The groundwater source for the remaining sample location was the deeper Mount Simon aquifer that is composed mostly of sandstone and dolomite bedrock (Olcott, 1992; Hunt and others, 2003). This groundwater source underlies the alluvial aquifer and is under consideration as an alternative drinking-water source for Campbell. To gain a broader perspective of potential human exposures to drinking-water contaminants (in addition to PFAS), all 11 of the point-of-use and groundwater water samples were analyzed for 506 organic compounds (disinfection byproducts [DBP], pesticides, PFAS, pharmaceuticals, semi-volatile organic compounds [SVOC], and volatile organic compounds [VOC]), 34 inorganic constituents (cations, anions, trace elements, and alkalinity), 3 microbial indicator groups, and 3 field parameters (pH, water temperature, and specific conductance). All samples were collected by USGS personnel, and all analyses were completed at USGS laboratories. A full list of compounds analyzed, and results are available in Romanok and others (2023a) and are summarized herein.
Additional PFAS samples were collected quarterly, beginning in 2021, by USGS UMESC personnel from four wells located on UMESC property and analyzed by private and public laboratory facilities. Data from 2021 to 2022 are summarized herein and a full list of compounds that were analyzed, as well as their results, can be found in Romanok and others (2023b). Users can download the files from these data releases for site information and compound-specific results.
Purpose and Scope
The purpose of this report is to present a summary of the site selection, sampling and analytical methods, and organic, inorganic, and microbiological results for water-quality samples collected from 11 groundwater well locations in Campbell, Wisconsin from October 18–20, 2021. These wells were selected to provide spatial and depth representation of the current and potential drinking-water supplies. Three of those locations were selected for further temporal evaluation of the occurrence of water contaminants, specifically, the area around the La Crosse Regional Airport, a previously documented source of PFAS to the alluvial aquifer (Schultz, 2021). The sampling design and sample collection were developed and conducted by USGS in collaboration with the town of Campbell. An additional four groundwater wells in the shallow alluvial and Mount Simon aquifers were sampled on a quarterly basis beginning in 2021 to assess PFAS. These 4 wells also serve as the source water for the 11 locations sampled from October 18–20, 2021. U.S. Environmental Protection Agency National Primary Drinking Water Regulations (EPA NPDWR) are applicable only to public-supply drinking water sources (sites 001 and WR972) and are provided herein for reference in relation to private wells (sites 002–011).
Methods
Innovative sampling and analytical approaches and methods were utilized in this study to assess the temporal and spatial occurrence of inorganic and organic constituents in groundwater.
Site Selection
Water-quality samples were collected from two taps within the UMESC facility, three residential tapwater locations, three community tapwater locations, two community parks, and one fire department pump station (fig. 1 and table 1). Sample locations were selected from available public community buildings, residential volunteer participants, and UMESC locations to provide broad spatial coverage of Campbell, part of French Island, Wisconsin, specifically focusing on the area that borders the La Crosse Regional Airport, which is part of the City of La Crosse, Wisconsin. Samples were collected from October 18–20, 2021. All but one sample (taken at site 001) were collected from groundwater wells withdrawing water from the shallow alluvial aquifer. Samples from site 001 were collected from a groundwater well that withdrew water from the deeper Mount Simon aquifer. Due to agency-mandated pandemic physical-distancing policies in place at the time of sampling, residential building tapwater samples were collected from exterior, non-potable taps (spigots).
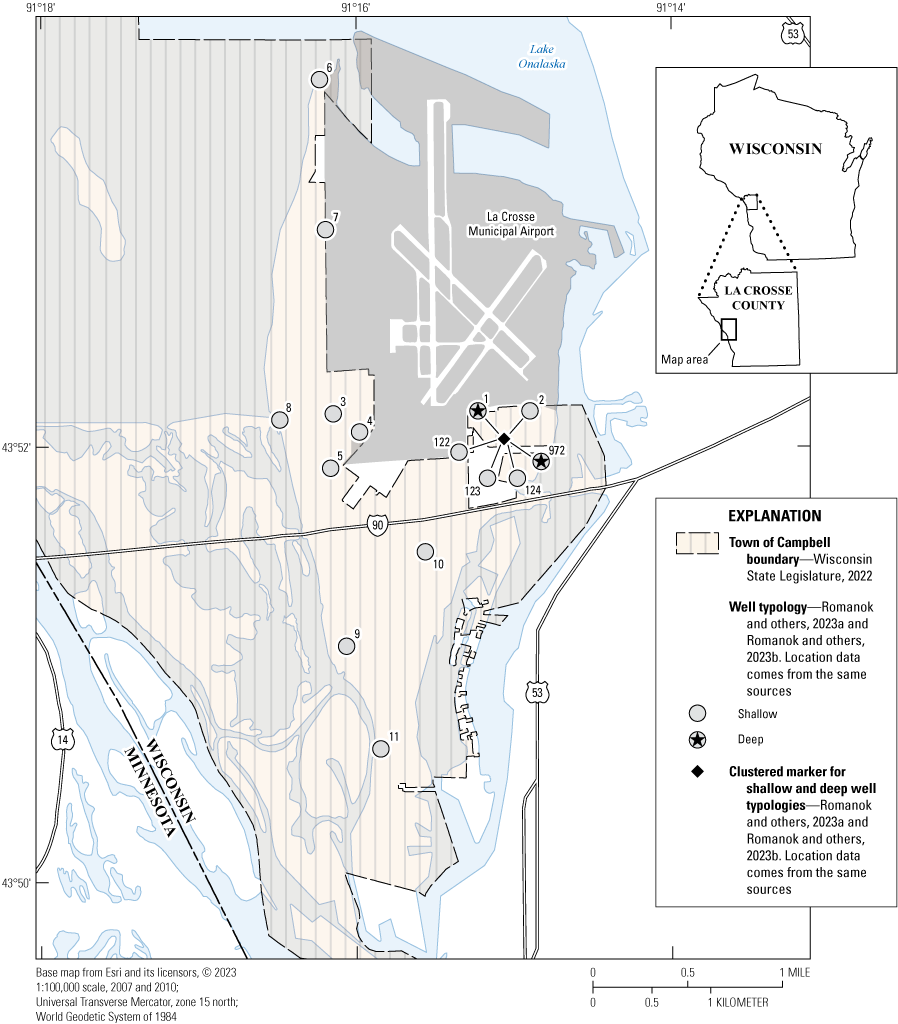
Map of site locations for the French Island Tapwater Exposure Study, town of Campbell, Wisconsin, 2021–22.
Table 1.
Site information for locations sampled for the French Island Tapwater Exposure Study, town of Campbell, Wisconsin, 2021–22.Three sites (sites 001, 002, and 003) were selected to be sampled over the course of three days to evaluate potential short-term temporal changes in drinking-water contaminant exposures. These sites were chosen due to their depth profiles and proximity to the airport, a suspected source of PFAS (Schultz, 2021). The precise depths of the wells are unknown.
Four groundwater wells (sampled for only PFAS) located on the UMESC property were sampled by UMESC personnel. Three of these wells (Wisconsin unique well numbers BG122, BG123, and BG124) were drilled in 1973 to 22.3–22.9 meters below land surface (Wisconsin Department of Natural Resources website, undated). These wells pump water from the shallow alluvial aquifer and are the source of water for site 002. The fourth well (Wisconsin unique well number WR972) was drilled in 2011 to 62.2 meters below land surface and cased to 52.1 meters below land surface. WR972 pumps water from the deeper Mount Simon aquifer and is located approximately 320 meters from the airport boundaries. This well is the source of water for site 001.
Analytical Methods
For the October 18–20, 2021 sampling event, a total of 32 samples (including 3 quality-assurance field blanks) were analyzed for 506 organic compounds, 34 ions and trace elements, and 3 microbial indicator groups. Water temperature, specific conductance, and pH were measured at the time of sample collection using a multi-parameter sonde. Refer to table 2 for sample handling, volume, and container information. For complete lists of all chemical compounds analyzed, refer to Romanok and others (2023a and 2023b)26.
Table 2.
Summary of chemical groups analyzed and handling requirements, in order of collection, in the town of Campbell, Wisconsin, 2021.[RCL, Redox Chemistry Laboratory, Boulder, Colorado; ATECL, Analytical Trace Element Chemistry Laboratory, Boulder, Colorado; EPHML, Environmental and Public Health Microbiology Laboratory, St. Petersburg, Florida; NWQL, National Water Quality Laboratory, Denver, Colorado; OGRL, Organic Geochemistry Research Laboratory, Lawrence, Kansas; OCRL, Organic Chemistry Research Laboratory, Sacramento, California; PFAS, per- and polyfluoroalkyl substances; SVOC, semi-volatile organic compounds; DBP, disinfection byproducts; VOC, volatile organic compounds; mL, milliliter; L, liter; HDPE, high density polyethylene; AA, ascorbic acid; PETG, polyethylene terephthalate; μL, microliter; HNO3, nitric acid; HCl, hydrochloric acid; μm, micrometer; NLS, Northern Lake Service, Inc., Crandon, Wisconsin; WSHL, Wisconsin State Laboratory of Hygiene, University of Wisconsin-Madison, Madison, Wisconsin; SGS AXYS, Standard Global Services, Inc., British Columbia, Canada]
USGS National Water Quality Laboratory (NWQL), Denver, Colorado
Tapwater samples were analyzed at the NWQL for 212 pesticides, 32 PFAS, 111 pharmaceuticals, 53 SVOC, and 76 VOC.
Pesticide samples (10 milliliters [mL]) were filtered in the field using a 0.7-micrometer (μm) nominal pore-size glass-fiber syringe filter and analyzed using direct aqueous injection-high performance liquid chromatography and tandem mass spectrometry (DAI HPLC-MS/MS) as detailed in Sandstrom and others (2015). Method detection limits (MDL) are determined using EPA procedures that are outlined in U.S. Environmental Protection Agency (2005). Reporting limits, reported as laboratory reporting limits, were set to twice the MDL (Childress and other, 1999). Concentration results are reported in nanograms per liter (ng/L).
Whole-water samples were analyzed by DAI HPLC-MS/MS for PFAS as described in Kolpin and others (2021). MDL were determined using American Society for Testing and Materials (ASTM) detection and quantitation-estimation and data assessment-utilizing software (DQCALC; ASTM International, 2016). Interim reporting limits (IRL) were set at twice the MDL. Concentration results are reported in ng/L.
Pharmaceutical samples (10 mL) were filtered in the field using a 0.7-μm nominal pore-size glass-fiber syringe filter and analyzed using DAI LC-MS/MS, which is further detailed in Furlong and others (2014). MDL are determined using EPA procedures outlined in U.S. Environmental Protection Agency (2005). IRL were determined as described in Oblinger Childress and others (1999) and allow for quantitation below the corresponding MDL. Concentration results are reported in ng/L.
Whole-water samples were analyzed for SVOC (base/neutral and acid extractable compounds). A 1-liter (L) water sample was extracted prior to analysis by gas chromatography/mass spectrometry (Fishman, 1993). Minimum reporting levels (MRL) were determined by the DQCALC procedure to get the reporting limit detected by DQCALC (RLDQC). The RLDQC is referred to in U.S. Geological Survey (2015) which is further described in ASTM International (2016). Concentration results are reported in μg/L.
Two different whole-water analytical methods were used to determine VOC concentrations in sample water. While both methods utilized electron impact ionization mass spectrometry, 37 heat-purgeable VOC were analyzed in simultaneous full scan/selected ion monitoring mode and 49 ambient purgeable VOC were analyzed in full scan mode (Rose and others, 2016). Reporting limits were determined using the RLDQC method, except for 2-Ethyl-1-hexanol, chloromethane, methylene chloride, and toluene, which were blank-limited and are reported using MRL as described in Oblinger Childress and others (1999). Concentration results are reported in μg/L.
USGS Organic Chemical Research Laboratory (OCRL), Sacramento, California
Whole-water samples were measured for 22 DBP as detailed in Hladik and others (2014). Samples were extracted using an Oasis HLB (hydrophilic and lipophilic balance) solid-phase extraction (SPE) cartridge (Waters Corporation, Milford, MA), and then were analyzed by gas chromatography/mass spectrometry. MDL were determined using methods described in U.S. Environmental Protection Agency, 2005. Concentration results are reported in μg/L.
USGS Redox Chemistry Laboratory (RCL) and Analytical Trace Element Chemistry Laboratory (ATECL), Boulder, Colorado
Filtered (0.45 μm pore-size nylon filter) water samples were analyzed for anions, and whole-water samples were analyzed for major cations and trace elements at the RCL. Lead, arsenic, hexavalent chromium, and total chromium were analyzed by graphite-furnace, atomic-absorption spectrometry, and results are reported in μg/L (Ball and McCleskey, 2003; McCleskey and others, 200320; Hergenreder, 2011). Anions (bromide, chloride, fluoride, nitrate as nitrogen, and sulfate) were analyzed by ion chromatography (U.S. Environmental Protection Agency, 1993; Brinton and others, 1996). Results are reported in milligrams per liter (mg/L). Major cations (calcium, magnesium, potassium, silica, and sodium), phosphorus, and trace elements (aluminum, antimony, barium, beryllium, boron, cadmium, cobalt, copper, iron, lithium, manganese, molybdenum, nickel, selenium, strontium, vanadium, and zinc) were analyzed by inductively coupled plasma-optical emission spectrometry (U.S. Environmental Protection Agency, 2014). Results are reported in mg/L for major ions and μg/L for trace elements (table 1.1). Uranium was analyzed at the ATECL by inductively coupled plasma-mass spectrometry (McCleskey and others, 2019). Uranium results are reported in μg/L.
SGS AXYS Laboratory, British Columbia, Canada
The SGS AXYS analytical method used for PFAS was MLA-110 REV. 02 VER. 11, dated January 13, 2021, and is available upon request from SGS AXYS (Sean Campbell, Environment, Health, and Safety project manager, written commun., 2021). Samples were stored in high-density polyethylene containers that were frozen for up to 90 days. After spiking with isotopically labeled surrogate standards, samples were extracted and cleaned by SPE. Analysis of the sample extract was performed by ultra-high performance liquid chromatography and tandem mass spectrometry (UHPLC-MS/MS) and reversed phase C18 column (18 carbon chains) using a solvent gradient. The column was coupled to a triple-quadrupole mass spectrometer run at unit-mass resolution in the Multiple Reaction Monitoring in negative-electrospray ionization mode. Target compounds were quantified using the isotope dilution/internal standard method, comparing the area of the primary (quantifying) transition product ion of the target compound to the carbon-13-labeled (or deuterium-labeled) standard and correcting for response factors. Results are reported in ng/L.
Northern Lakes Service Inc., Crandon, Wisconsin
The Northern Lakes Service (NLS) utilizes EPA Method 537.1 to analyze for 33 PFAS (U.S. Environmental Protection Agency, 2020). After the addition of isotopically labeled standards, samples were passed through SPE and analyzed using UHPLC-MS/MS. Additional method details are available upon request from NLS (Steve Hefter, laboratory manager, written commun., 2021). MDL (National Archives, 2023) and results are reported in ng/L.
Wisconsin State Laboratory of Hygiene, Environmental Health Division, University of Wisconsin-Madison, Madison, Wisconsin
The Wisconsin State Laboratory of Hygiene (WSLH) utilizes their “PFAS in Water” method, developed at WSLH based on both EPA Method 537.1 and ISO/DIS 21675, to analyze for 33 PFAS (International Organization of Standardization, 2019; U.S. Environmental Protection Agency, 2020). Samples are stored chilled to 6°C for no more than 28 days before SPE. Prior to SPE, isotopically labeled standards are added. Samples are analyzed using HPLC-MS/MS in negative ion electrospray ionization mode. Additional method details are available upon request from WSLH (Alex Schwartz, Environmental Health Division, written commun., 2021). According to the WSLH standard operating procedures, MRL are set at 1 ng/L, or by multiplying the MDL by 2 and rounding up to the nearest calibration standard, whichever value is higher. Values between the MDL and MRL are reported as estimates. Results are reported in ng/L.
USGS Environmental and Public Health Microbiology Laboratory, St. Petersburg, Florida
The tapwater samples were analyzed for total coliforms, Escherichia coli (E. coli), and heterotrophic plate counts (HPC) by the USGS Environmental and Public Health Microbiology Laboratory (EPHML). Total coliforms were measured using Standard Method 9222B (Lipps and others, 2022b), membrane filtration with Endo Media. E. coli was measured using modified membrane-thermotolerant E. coli agar as described in EPA method 1603 (U.S. Environmental Protection Agency, 2014). HPC was measured using membrane filtration as described in Standard Methods 9215D (Lipps and others, 2022a). Results for all methods are reported in colony-forming units per 100 milliliters (CFU/100 mL).
USGS Organic Geochemical Research Laboratory, Lawrence, Kansas
Three 1-liter (L) baked glass-amber bottles filled with unfiltered water were collected at each site (labelled A, B, and C bottles) and extracted and concentrated to a total final volume of 300 microliters (µL). These extracted samples are archived at the OGRL.
The sample masses were calculated from the mass of the bottle before and after extraction. Each 1 L sample was extracted using a 24-port vacuum rack with Teflon tubing attached to 6 mL SPE cartridge adapters. The 200-milligram HLB SPE cartridges (Waters Corp., Milford, Massachusetts) were conditioned with 8 mL of methanol followed by 8 mL of water. The samples were loaded into the cartridges at a flow rate of about 10 mL per minute (min), the bottle and cartridge were rinsed with 8 mL of water, and air was passed through the cartridge for at least 20 minutes. A 24-port vacuum rack equipped with disposable polytetrafluoroethylene (PTFE) liners was used to elute the cartridges with two aliquots of 4 mL of methanol into 15 mL glass conical-bottom centrifuge tubes, and elution colors were recorded. The samples were evaporated to approximately 1 mL at 40°C, and the extracts from the B and C bottles were washed into the A bottle centrifuge tube with two aliquots of 1 mL of methanol. This combined extract was evaporated to 10 µL and then brought to a final volume of 300 µL with liquid chromatography/mass spectrometry (LC-MS)-grade methanol. The sample was transferred to a 12 by 32-millimeter plastic vial with an amber glass 0.1 mL insert and aluminum seal with PTFE/silicone liner lids. Extracts are archived at −20°C.
Quality Assurance and Quality Control
Quality assurance and quality control (QA/QC) for the 11 temporal and spatial sites sampled from October 18–20, 2021 included field blanks, laboratory blanks and spikes, and stable isotope surrogates. Low-level detections (nitrate, chloride, and sulfate ranging from 0.01 to 0.2 mg/L) in inorganic field blanks did not result in any blank-correction procedures for chloride and sulfate, but nitrate was censored to the reporting level. There were single detections of four compounds in the organic field blanks (butyl benzyl phthalate [0.8 μg/L], di-n-butyl phthalate [0.17 μg/L], diethyl phthalate [0.1 μg/L], and ethyl acetate [0.05 μg/L]). All four compounds were blank censored to two times the value detected in the blank. The median isotopic-surrogate percent recovery for the VOC, pharmaceutical, and pesticide compounds was 102 percent (ranging from 11.8–369 percent, 25th and 75th percentiles are 93.5 and 116 percent, respectively).
QA/QC for the UMESC PFAS samples included 1 laboratory blank (SGS AXYS), 20 field blanks (NLS), and 4 matrix spike samples (SGS AXYS). There were no PFAS detections in the laboratory blank or field blanks. The median matrix spike percent recovery was 92.5 percent (ranging from 57.8–137 percent, 25th and 75th percentiles are 82 and 97.6 percent, respectively). Two compounds (perfluoro-1-hexanesulfonate [PFHxS] and perfluoro-n-octanoate [PFOA]) from the June 6, 2021, sample were not reported due to quality-assurance issues at the laboratory. Additional laboratory QA/QC information can be requested from the participating laboratories.
Sampling Methods
Samples for the 11 sites were collected according to tapwater-sampling protocols described in Romanok and others (2018). Prior to sampling, a clean area was created by laying out a large plastic bag near the sampling point. After putting on clean gloves, an additional clean glove was placed on the cold-water handle, and 22 sample bottles and associated supplies were laid out on the clean surface. Gloves were replaced as necessary to maintain cleanliness.
Consistent with prior USGS tapwater studies (Bradley and others, 2020, 2022), sample collection began immediately after the spigot was turned on, in the order listed in table 2. Table 2 also details the bottle type and preservation for each chemical group. Field rinses, where specified, were done in triplicate; the bottles were filled with a small aliquot of water and then were capped, shaken, and emptied prior to final bottle filling. The total amount of water being flushed during the approximate 20 minutes of sampling was about 10 liters. After all (22) of the sample containers were filled, properly preserved where applicable, and capped, the sample containers were placed in resealable bags on ice for overnight shipment to the analytical laboratories. Field parameters (water temperature [degrees C], specific conductance [µS/cm], and pH [standard units]) were collected after bottle filling. These efforts to maintain the same analytical methods and the containers, as well as the same sampling team, allow for cross-study comparisons.
Samples for the 3-day temporal assessment were collected at three locations. On the first day, three tapwater samples were collected: an initial sample that has not been used for 6-plus hours (stagnant first-flush) sample, a sample 30 minutes after the start of the initial sample collection (post-flush), and a sample collected 6 hours (post-6h) after the initial sample. For the next two days, only stagnant first-flush and post-6h samples were collected. Due to COVID-19 pandemic restrictions, two of these locations had not been used for several days prior to sampling. Sampling points were not cleaned, and aeration screens (if present) were not removed from the tap prior to sampling. There were no point-of-use filtration systems on any of the sampled locations. All sample locations identified in figures have been anonymized for privacy, so exact locations are not identified.
Samples for the UMESC groundwater PFAS study were collected quarterly beginning in February 2021. Samples from February 4, 2021, were analyzed at SGS AXYS laboratory. Samples from June 30, 2021, were analyzed at the WSLH. The remaining samples (beginning in January 2022) were analyzed at NLS. Samples for sites BG122, BG123, and BG124 were collected from individual well-pump spigots inside the pump house, and samples for site WR972 were collected from a spigot inside the public building prior to the on-site water softener. There were no aeration filters or screens installed on taps. See table 2 for details on sample collection.
Results
Organic and inorganic chemical constituent concentration and microbiological results of this report are available from Romanok and others (2023a) and Romanok and others (2023b) and are summarized herein. Authors encourage users to download these files for site information and compound-specific results. To sum organic concentrations, units have been converted from ng/L (equivalent to parts per trillion [ppt]) to μg/L (equivalent to parts per billion [ppb]) when necessary.
Level of Occurrence
Three field parameters (water temperature, specific conductance, and pH) were measured on site. Samples were analyzed for 34 inorganic constituents (nine anions and cations, along with alkalinity, nitrate [as nitrogen], and phosphorus), including 22 trace elements (tables 1.1 and 1.2). Of the inorganic constituents measured, eight were not detected in any of the samples in this study (antimony, arsenic, beryllium, cadmium, cobalt, molybdenum, selenium, and vanadium).
Ten inorganic constituents have U.S. Environmental Protection Agency National Primary Drinking Water Regulations (EPA NPDWR) maximum contaminant levels (MCL): antimony (6 μg/L), arsenic (10 μg/L), barium (2,000 μg/L), beryllium (4 μg/L), cadmium (5 μg/L), chromium (100 μg/L), fluoride (4,000 μg/L), nitrate (10 mg/L), selenium (50 μg/L), and uranium (30 μg/L; U.S. Environmental Protection Agency, 2008). Two constituents have treatment technique action levels (TTAL) established for public-supply drinking water to protect the public health (U.S. Environmental Protection Agency, 2009): copper (1,300 μg/L) and lead (15 μg/L). EPA NPDWR are applicable only to public-supply drinking-water sources and are presented here for reference only for private wells. No inorganic constituent exceeded the respective MCL or TTAL in this study.
Of the 506 unique organic compounds analyzed for the spatially and temporally (October 18–20, 2021) collected water-quality samples, 74 (14 percent of total unique organic analytes) were detected at least one time in any sample (tables 1.3 and 1.4). Detected organic compounds include 27 pesticides (5 percent of total unique organic analytes), 14 PFAS (3 percent), 5 pharmaceuticals (1 percent), 7 SVOC (1 percent), and 21 VOC (4 percent). Three additional PFAS were detected in the quarterly UMESC sampling, which were not detected in the October 18–20, 2021, spatial or temporal sampling; however, the concentration results were below the reporting level for the October 18–20, 2021, samples analyzed at the NWQL. Almost half of all detected organic compounds analyzed at the NWQL had maximum concentrations near or below the reporting limits. Reported values above the limit of detection (LOD), but below the reporting levels, were considered “detections”. There were no detections of DBP in any sample in this study.
Eight organic compounds detected in this study have established EPA NPDWR MCL: 1,4-dichlorobenzene (75 μg/L), benzene (5 μg/L), chlorobenzene (100 μg/L), m-xylene plus p-xylene (10,000 μg/L), styrene (100 μg/L), tetrachloroethene (5 μg/L), bis(2-ethylhexyl) phthalate (6 μg/L), and simazine (4 μg/L) (U.S. Environmental Protection Agency, 2009). EPA NPDWR are applicable only to public-supply drinking-water sources and are for reference for private wells. None of these compounds were detected at concentrations that exceeded their respective MCL.
In June 2022, the EPA published non-regulatory Lifetime Drinking Water health advisory levels (HAL) for four PFAS. The EPA interim PFAS HAL are: perfluoro-n-octanoate (PFOA), 0.004 ng/L (0.000004 μg/L) and perfluorooctanesulfonate (PFOS), 0.02 ng/L (0.00002 μg/L). The EPA final HAL for hexafluoropropylene oxide dimer acid (HFPO-DA; commonly referred to as “GenX”) and perfluorobutane sulfonate (PFBS) are 10 ng/L (0.01 μg/L) and 2,000 ng/L (2 μg/L), respectively. More information can be found in the Federal Registry at U.S. Environmental Protection Agency, 2022.
Subsequently, in March 2023, the EPA released a proposed NPDWR (as MCL) for PFOA and PFOS: 4 ng/L (0.004 μg/L) for each; however, until the respective MCL are finalized and promulgated, the interim HAL remains in effect (U.S. Environmental Protection Agency, 2022 and U.S. Environmental Protection Agency, 2023). In addition to PFOA and PFOS, a hazard index (HI) for PFHxS, HFPO-DA (“GenX”), PFNA, and PFBS has been proposed—the calculated HI is not to exceed one. The interim HAL, as well as the proposed MCL for PFOA, was exceeded at sites 002, 003, 004, and 005, and PFOS was exceeded in samples from sites 002, 003, 004, 005, and 007. Additionally, the 3 shallow UMESC groundwater wells (BG122, BG123, and BG124) exceeded the interim HAL and proposed MCL for PFOA and PFOS. The proposed HI was exceeded at tapwater site 002, as well as sites BG122, BG123, and BG124, which are the sources of water for tapwater site 002.
The tapwater samples were analyzed for total coliforms, E. coli, and HPC at all sites in this study (table 6 in Romanok and others, 2023a). There were no detections of E. coli at any site. HPC results at all three temporal sites decreased over the course of the three days of sampling. At site 001, the maximum HPC concentration of 1,620 CFU/100 mL was detected on day 1, and HPC was not detected in the post-6h sample on day 3. At site 002, the HPC had colony growth greater than 20,000 CFU/100 mL in multiple samples during the first two days of sampling; however, by the post-6h sample on day 3, HPC was not detected. At site 003, the maximum HPC concentration was 4,170 CFU/100 mL in the stagnant first-flush sample on day 1, and although HPC remained at similar levels the following day, by the post-6h sample on day 3, the HPC level was 4 CFU/100 mL. For the temporal samples, total coliforms were present in one sample from site 001 (day 1, post-6h; 100 CFU/100 mL) and in one sample at site 002 (day 1, 30 min; 2 CFU/100 mL). In the remaining samples, total coliforms were present in two locations: sites 004 and 009, and HPC ranged from 311–28,000 CFU/100 mL. No MCL exists for HPC; however, there is a TTAL for public-supply water from groundwater sources influenced by surface water (U.S. Environmental Protection Agency, 2009) which states, among other details, that HPC should not exceed 500 bacterial colonies per milliliter. The Revised Total Coliform Rule established by the EPA requires a repeat sampling for E. Coli and total coliforms for any public supply water after a positive detection for E. Coli and (or) total coliforms (U.S. Environmental Protection Agency, 2013), and violations would be based upon those subsequent results.
Spatial Occurrence
Result concentrations in groundwater samples at the 11 locations were used to assess the spatial occurrence of inorganic constituents and organic compounds. Comparison of the deeper Mount Simon aquifer to the alluvial aquifer (currently used for drinking water) was accomplished by comparing concentrations in groundwater from site 001 sourced by the Mount Simon aquifer to the groundwater in the remaining alluvial aquifer sites. The spatial distribution of inorganic constituents and organic compounds in groundwater were assessed by comparing median concentrations for the 3-day temporally sampled sites (001, 002, and 003) along with the one-time sample at the remaining sites.
Inorganic Constituents
When considering the spatial distribution and aquifer comparison of inorganic constituents, little variation is apparent between most sites, but there are two notable exceptions: site 006 (the community-park drinking-water fountain at the northern, upstream tip of the island) and site 001 (UMESC tapwater sourced from the deeper Mount Simon aquifer; table 3 in Romanok and others, 2023a). The tapwater sample from site 006 had some of the highest concentrations of trace elements, including lead (8.5 μg/L), iron (8,600 μg/L), and manganese (104 μg/L). The tapwater sample from site 001 had some of the lowest concentrations of many inorganic constituents, including aluminum, barium, calcium, chloride, magnesium, manganese, nitrate, potassium, strontium, uranium, and iron. Trace elements, such as barium, strontium, and uranium are commonly an order of magnitude lower at site 001 when compared to other sites. The median concentration of barium and strontium from the 10 locations drawing from the alluvial aquifer were 54.5 μg/L (interquartile range=39.5–70.5 μg/L) and 86.5 μg/L (interquartile range=67.2–104 μg/L), respectively, but neither barium nor strontium were detected at site 001 (table 1.5). Similar results are reported for uranium. The median concentration of uranium in samples from the shallow aquifer locations was 0.255 μg/L (interquartile range=0.16–0.562 μg/L), and the median from site 001 was 0.002 μg/L (table 1.5).
Organic Compounds
Of the 74 organic compounds detected (table 1.4), the 4 most frequently detected compounds were didealkylatrazine, metolachlor SA, PFBA, and PFBS, with detections in at least half of the sites (table 1.4). The total number of compounds detected in each sample ranged from 0 to 20 (median number of compounds detected per site of 11), and the sum of concentrations ranged from nd to 2.53 μg/L (median sum of concentrations per site of 0.342 μg/L; fig 2 and table 1.6).
Pesticides were detected in samples from all sites, but the median of the sum of pesticide concentrations from the seven samples collected at site 001 was below the detection limit. The sum of pesticide concentrations per sample ranged from nd to 1.26 μg/L (median per site of 0.086 μg/L; table 1.6). Among the most frequently detected pesticides were metabolites of both metolachlor (metolachlor SA) and atrazine (didealkylatrazine; table 1.4). PFAS were detected at 7 of the 11 locations, with the total number of detections per sample ranging from 0–14 (median per site of 1; table 1.6). The sum of PFAS concentrations per sample ranged from nd to 0.661 μg/L (median sum of concentrations per site of 0.014 μg/L). Sites 002 and 004 had the most PFAS detections per sample with 14 (median of 13) and 7, respectively, and concentration sums of 0.609 (median) and 0.164 μg/L, respectively (fig. 3 and table 1.6) Concentrations of PFOA and PFOS exceeded both the EPA interim HAL and the proposed MCL at sites 002, 003, 004, and 005. Site 007 exceeded the EPA interim HAL for PFOS only.
Pharmaceuticals were detected at 5 of the 11 sites, with total detections per sample ranging from 0–1 (median per site of 0), and the sum of pharmaceutical concentrations per sample ranged from nd–0.036 μg/L (median per site of nd). SVOC were detected in 5 of the 11 sites, with the total number of detected compounds per sample ranging from 0–6 (median per site of 0), and the sum of concentrations per sample ranging from nd–2.2 μg/L (median per site of nd). Sites 004, 007, and 010 had a single SVOC detection at each location; however, site 006 had 6 detected SVOC (table 1.6). VOC were detected in 9 of the 11 sites; however, the median concentration of the 7 samples collected at site 001 was below the detection limit (nd). The total number of VOC detected in all samples ranged from 0–11 (median per site of 1), and the sum of concentrations per sample ranged from nd to 1.9 μg/L (median per site of 0.113 μg/L; table 1.6).
At site 006, VOC and SVOC were the most frequently detected compound groups (11 and 6 compounds detected, respectively) comprising 85 percent of detections. There were no PFAS detected in the sample (table 1.6). Sites 002 and 006 had the most organic compounds detected with 20 each. Residential tapwater sites 007 and 008 on the western edge of the island (fig. 1) had 19 and 13 organic compound detections, respectively. Sites 009, 010, and 011 had 4 or fewer detections of any organic compounds, and no PFAS were detected at any of these locations (table 1.6 and figs. 2 and 3). Site 001, the well that withdraws water from the Mount Simon aquifer, had the fewest number of detected organic compounds and the lowest sum of organic concentrations (tables 1.5 and 1.6).
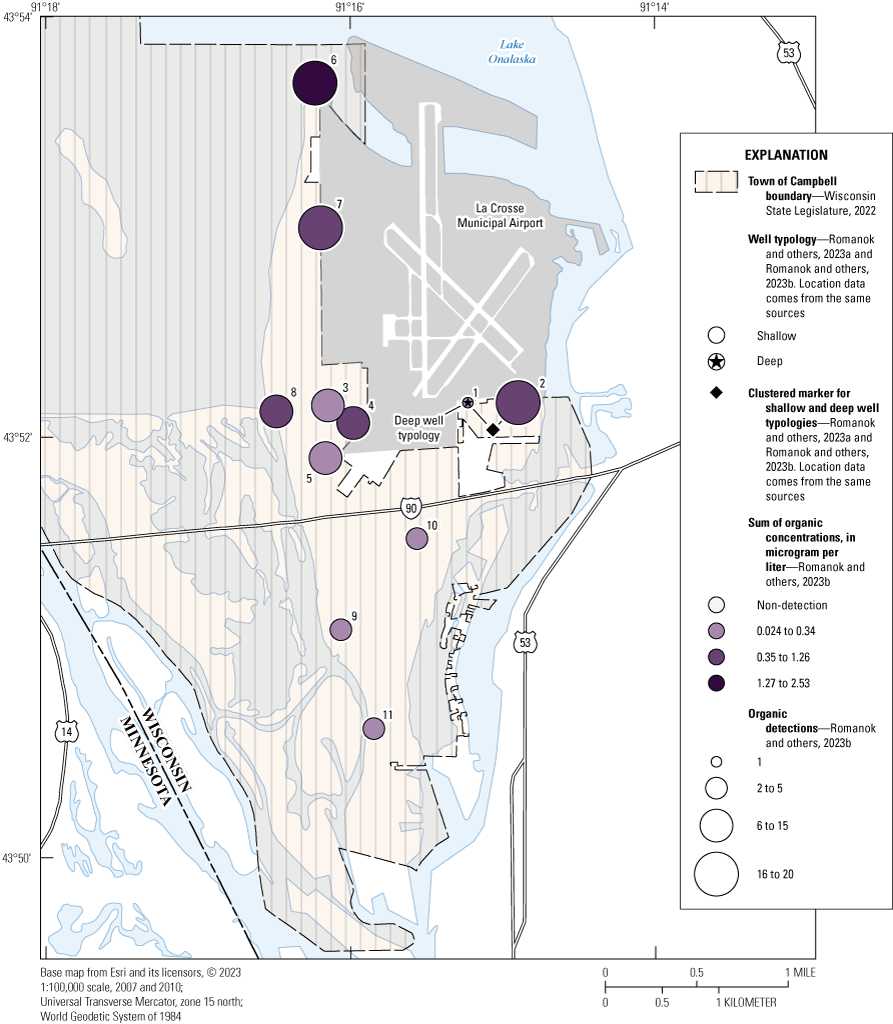
Map showing the sum of total organic compounds for the French Island Tapwater Exposure Study, town of Campbell, Wisconsin, 2021. [Median sum of concentrations used for sites 001, 002, and 003.]
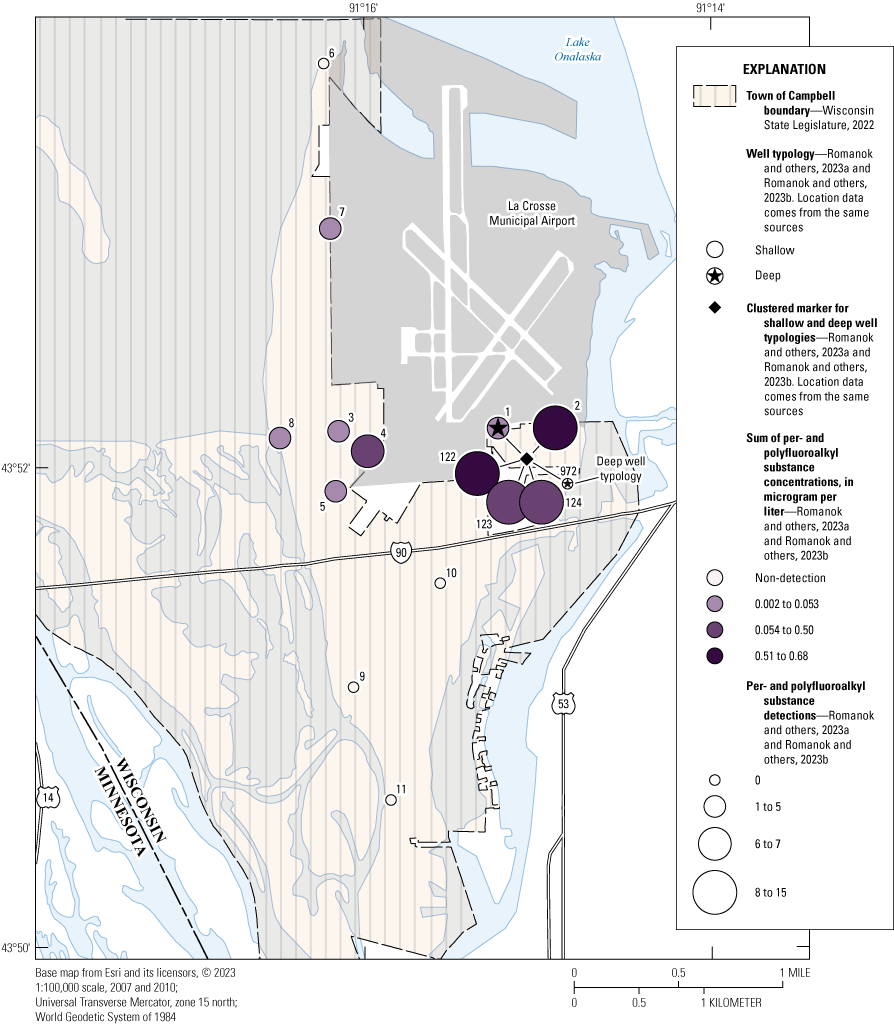
Map showing the sum of total per- and polyfluoroalkyl substances (PFAS) for the French Island Tapwater Exposure Study, town of Campbell, Wisconsin, 2021–22. [Median sum of PFAS concentrations used for sites 001, 002, 003, BG122, BG123, BG124, and WR972.]
Temporal Occurrence
Short-term temporal variability was assessed for 3 days (October 18–20, 2021) at 3 tapwater site locations. Sites 002 and 003 withdraw water from the alluvial aquifer and site 001 withdraws water from the Mount Simon aquifer. Long-term temporal variability was also assessed for PFAS in samples collected from 4 groundwater wells, which supply water to sites 001 and 002.
Inorganic Constituents
Overall, there was little variation in inorganic concentrations in any of the three sites evaluated temporally during October 18–20, 2021. At site 001, water temperatures ranged from 17–22.1°C (median of 18.6°C), specific conductance ranged from 509–519 μS/cm (median of 512 μS/cm), and pH ranged from 7.1–7.8 (median of 7.4; table 1.2). Seventeen inorganic constituents were detected, with 5 (aluminum, chromium, hexavalent chromium, manganese, and phosphorus) only detected in the stagnant first-flush sample on day 1. Iron was only detected in the first-flush (37 μg/L) and post-6h (4 μg/L) samples on day 1 (table 3 in Romanok and others, 2023a). The maximum value for boron occurred during the first-flush sample on day 1 (84 μg/L), with the remaining concentrations for this site ranging from 13–20 μg/L (median for all boron samples at site 001 was 15 μg/L; table 1.2).
At site 002, water temperature ranged from 19.5–25.4°C (median of 24°C), specific conductance ranged from 420–428 μS/cm (median of 426 μS/cm), and pH ranged from 7–7.5 (median of 7.2; table 1.2). Of the 21 inorganic constituents detected, chromium, fluoride, hexavalent chromium, iron, and lead were only detected in the samples collected on the first day at this site and were generally at or near the analytical reporting level. With a few exceptions, all other inorganics were detected at concentrations that remained stable throughout the sampling. For example, boron was detected in every sample with concentrations ranging from 17–18 μg/L (table 1.2). One exception was manganese, with a concentration of 189 μg/L, which was the maximum detected concentration and occurred in the post-flush sample on day 2 (table 3 in Romanok and others, 2023a).
At site 003, water temperature ranged from 17.2–18.1°C (median of 17.8°C), specific conductance ranged from 728 to 731 μS/cm (median of 729 μS/cm), and pH ranged from 7.5–7.8 (median of 7.6; table 1.2). Twenty-four inorganic compounds were detected at site 003. Median concentrations were generally higher at site 003 than at any other site in the study and concentrations were stable throughout the three days of sampling with a few exceptions. For example, chloride was detected in every sample, with concentrations ranging from 75.8–77.4 mg/L (median of 76.3 mg/L; table 1.2).
One exception was between the first-flush and post-flush samples on day 1 for copper and iron, as the concentration in the first-flush sample for copper was 617 μg/L (the maximum detected concentration), and the post-flush was 30 μg/L (the minimum detected concentration). Concentrations generally remained stable throughout the rest of the samples (concentration range was 332–517 μg/L; table 3 in Romanok and others, 2023a). The iron concentration in the first-flush sample on day 1 was 13 μg/L (the minimum detected concentration), while in the post-flush sample on day 1 the concentration was 108 μg/L (the maximum detected concentration), which also remained stable for the rest of the sampling period (concentration range is 48–73 μg/L; table 3 in Romanok and others, 2023a).
Organic Compounds
Six organic compounds were detected at least once in the seven samples collected at site 001 during October 18–20, 2021: 1 pesticide, 1 PFAS, 2 pharmaceuticals, and 2 VOC (table 1.3). On the first day, 2–3 organic compounds were detected from the 3 samplings, with the sum of concentrations per sample ranging from 0.024–1.92 μg/L (median of 0.024 μg/L; table 1.6). These findings included one detection each of isopropyl alcohol (1.9 μg/L in the stagnant first-flush sample), flubendiamide (0.0005 μg/L), and caffeine (E [estimated] 0.005 μg/L) in the post-flush sample, and dehydronifedipine (E0.036 μg/L) in the post-6h sample (table 3 in Romanok and others, 2023a). Perfluorobutyrate (PFBA) was the only compound detected consistently on the first day, with concentrations ranging from nd–E0.025 μg/L (table 1.3). On the following days, only PFBA was detected on day 2 (stagnant first-flush sample), and only methyl acetate was detected on day 3 (post-6h sample). No SVOC were detected at site 001 (table 1.5).
At site 002, there was little variability over the course of the three days of sampling. Twenty-six total compounds were detected at least once in the seven samples. These included 9 pesticides, 14 PFAS, 1 pharmaceutical, and 2 VOC (table 1.3). On the first day, 18–20 compounds (median of 20) were detected in all three samplings; similar results were observed on the second (17 and 20 compounds detected) and third (16 and 20 compounds detected) days (table 1.6). The sum of concentrations per sample ranged from 0.931–1.28 μg/L (median of 1.08 μg/L; table 1.6). In each sample, 2–5 pesticides were detected, with the sum of concentrations per sample ranging from 0.029–0.302 μg/L (median concentration sum was 0.132 μg/L; table 1.6). The most frequently detected pesticides were metabolites of metolachlor, alachlor, and atrazine. No SVOC were detected at this site. Methylbenzotriazole and 1,1-difluoroethane were detected in every sample collected at site 002 (table 1.3), with concentrations ranging from E0.1–E0.141 μg/L (median of E0.123 μg/L) and from 0.208–0.262 μg/L (median of 0.238 μg/L), respectively (table 1.3).
Of the 32 PFAS analyzed, 12–14 (median of 13) were consistently detected at site 002 during the October 18–20, 2021 sampling period: PFBA, PFBS, PFHxS, PFOA, PFOS, perfluoro-n-pentanoate (PFPeA), perfluoro-1-pentanesulfonate (PFPeS), perfluoro-1-hexanesulfonamide (FHx-SA), perfluoro-n-heptanoate (PFHpA), perfluoro-1-heptanesulfonate (PFHpS), perfluoro-n-hexanoate (PFHxA), perfluorobutane sulfonamide (FBSA), 1H,1H,2H,2H-perfluorohexane sulfonate (6:2) (6:2 FTS), and perfluoro-n-nonanoate (PFNA; table 1.6 and table 1.3). This site had the most PFAS detections with the highest individual concentrations for those compounds compared to other locations (table 1.6). Eleven of the 14 PFAS were detected in all of the samples at this location; FBSA, 6:2 FTS, and PFNA were detected in 85.7, 71.4, and 57.1 percent of the samples, respectively (table 1.3). Of the detected PFAS, PFHxS and PFOS had the highest median concentrations with 0.158 μg/L and 0.156 μg/L, respectively (table 1.6). The sum of PFAS concentrations per sample ranged from 0.527–0.661 μg/L (median sum of concentration was 0.609 μg/L) (table 1.6).
Site 003 also showed little variability over the three days of sampling. Of the 19 total compounds detected at this site (6 pesticides, 5 PFAS, 2 pharmaceuticals, 2 SVOC, and 4 VOC, table 1.3), 9–12 compounds were detected at each sampling (median of 9), with the sum of concentrations per sample ranging from 0.165–2.46 μg/L (median sum of concentration was 0.226 μg/L; table 1.6). Of the six detected pesticide compounds, metabolites of metolachlor and atrazine were the most frequently detected (table 1.3). Bis (2-ethylhexyl) phthalate was only detected in the stagnant first-flush sample on day 1 (E2.2 μg/L). Four VOC were detected frequently: 1-Chloro-1,1-difluoroethane (HCFC-142b), 1,4-dichlorobenzene, butanal, and butane. 1,4-dichlorobenzene was detected consistently throughout the three days of sampling, with concentrations per sample ranging from 0.039–0.175 μg/L (median of 0.058 μg/L; table 1.3). Butane was detected in all samples on day 1. Butanal was only detected in the stagnant first-flush sample on each day and in the post-6h sample on day 1. HCFC-142b was not detected on day 1 but was consistently detected on subsequent days (table 3 in Romanok and others, 2023a).
Five PFAS were detected at site 003: PFBA, PFBS, PFHxS (sum of linear and branched isomers), PFOA, and PFOS (sum of linear and branched isomers). PFBS, PFHxS, and PFOA (except for one sample) were detected consistently over the course of three days (table 3 in Romanok and others, 2023a). PFBS concentrations ranged from 0.012–0.014 μg/L (median of 0.012 μg/L), PFHxS ranged from 0.002–0.004 μg/L (median of 0.003 μg/L), and PFOA ranged from nd–E0.005 μg/L (median of 0.005; table 1.3). PFBA and PFOS were each detected in 57 percent of the samples. PFBA ranged from nd–E0.013 μg/L (median of 0.012 μg/L) and PFOS concentrations ranged from nd–0.005 μg/L (median of 0.003 μg/L; table 1.3). The sum of all PFAS concentrations per sample ranged from 0.017–0.039 μg/L (median sum of concentrations was 0.033 μg/L; table 1.6).
For the long-term PFAS sampling at UMESC, 15 of the 33 PFAS were detected at least one time in any sample (table 1.7). Only PFBS (0.0006 μg/L) and FOSA (perfluoro-1-octanesulfonamide; 0.0005 μg/L) were detected (one time each) in the deep well (WR972) at concentrations near the method LOD and below the method quantitation limit (table 3 in Romanok and others, 2023b). The median number of detections ranged from 11.5–12 for the 3 wells in the shallow alluvial aquifer (BG122, BG123, and BG124), with the median sum of concentrations per sample ranging from 0.276–0.676 μg/L (table 1.7). With one exception (PFHpS was only detected in 87.5 percent of samples at site BG123), 10 PFAS were detected in every sample collected from these three wells (table 1.7). These results are consistent with the results collected at sites 001 and 002 in the 3-day temporal sampling during October 18–20, 2021.
Summary
Eleven sites were sampled in Campbell, Wisconsin in October 2021. All samples were collected from groundwater sources, eight of which were collected from private or community tapwater locations. The sites were spatially distributed within Campbell and 3 of the sites were selected to be sampled for short-term temporal variability over a 3-day period. These three sites were selected to include both the shallow sand and gravel (alluvial) aquifer and the deeper sandstone and dolomite of the Mount Simon aquifer. Each of these samples were analyzed for 506 unique organic compounds, 34 cations, anions, trace elements, 3 microbial indicators, and 3 field parameters (pH, specific conductance, and water temperature). Additionally, groundwater wells BG122, BG123, and BG124 that supply water to tapwater site 002 and one well (site WR972) that supplies water to tapwater site 001 were sampled for only PFAS (per- and polyfluoroalkyl substances) to assess long-term variability.
Of the 32 inorganic constituents (cations, anions, and trace elements) analyzed from October 18–20, 2021, eight were not detected in any sample, and none were reported at concentrations that would have exceeded an MCL (maximum contaminant load) or TTAL (treatment technique action level). U.S. Environmental Protection Agency National Primary Drinking Water Regulations (EPA NPDWR) are applicable only to public-supply drinking water sources (site 001) and are for reference only for private wells (sites 002–011). For the sites that were evaluated temporally, concentration ranges, with few exceptions, showed little variability over the three days. This lack of variability is also demonstrated in the spatially distributed samples, with one exception: site 006 (the northernmost site). Site 001, the well withdrawing water from the deeper Mount Simon aquifer, had the lowest concentrations for some ions and trace elements, for example, nitrate, strontium, and uranium, compared to the other 10 locations.
Of the 506 organic compounds analyzed from October 18–20, 2021, 74 were detected at least one time in any sample. These organic compounds included 27 pesticides, 14 PFAS, 5 pharmaceuticals, 7 SVOC (semi-volatile organic compounds), and 21 VOC (volatile organic compounds). No DBP (disinfection byproducts) were detected in any sample. None of the compounds detected exceeded their respective MCL (provided for reference only), but the interim HAL (health advisory levels) and recently proposed MCL for select PFAS were exceeded in samples from 4 sites for PFOA (perfluoro-n-octanoate) and 5 sites for PFOS (perfluorooctanesulfonate). Additionally, the proposed EPA HI calculated for perfluoro-1-hexanesulfonate HFPO-DA (commonly referred to as “GenX”, which was not detected at any site), PFNA (perfluoro-n-nonanoate), and PFBS (perfluoro-1-butanesulfonate) was exceeded at site 002.
Four sites were sampled quarterly, beginning in 2021, to assess long-term PFAS temporal variability as part of the UMESC PFAS groundwater study. Fifteen of the 33 PFAS were detected at least one time in any sample. Eleven of the 15 PFAS were detected in almost every sample from the three groundwater wells sourced from the alluvial aquifer. Concentrations of PFOA and PFOS exceeded both the EPA interim HAL and proposed MCL (provided for reference) in each of the 23 samples where they were detected. The proposed EPA HI calculated for PFHxS, HFPO-DA (“GenX”, which was not detected at any site), PFNA, and PFBS was exceeded at sites BG122, BG123, and BG124. There were only two detections of PFAS (PFBS and perfluoro-1-octanesulfonamide [FOSA]) in samples taken from well (WR972) in the deeper Mount Simon aquifer and both detections were at the method LOD and below the method quantitation limit.
References Cited
ASTM International, 2016, Standard practice for performing detection and quantitation estimation and data assessment utilizing DQCALC software, based on ASTM practices D6091 and D6512 of committee D19 on water: ASTM Designation D7510–10, 2 p., accessed November 18, 2022, at https://www.astm.org/Standards/D7510.htm.
Ball, J.W., and McCleskey, R.B., 2003, A new cation-exchange method for accurate field speciation of hexavalent chromium: U.S. Geological Survey Water-Resources Investigations Report 03–4018, 17 p., accessed November 10, 2022, at https://wwwbrr.cr.usgs.gov/projects/GWC_chemtherm/pubs/WRIR%2003-4018.pdf.
Bradley, P.M., Argos, M., Kolpin, D.W., Meppelink, S.M., Romanok, K.M., Smalling, K.L., Focazio, M.J., Allen, J.M., Dietze, J.E., Devito, M.J., Donovan, A.R., Evans, N., Givens, C.E., Gray, J.L., Higgins, C.P., Hladik, M.L., Iwanowicz, L.R., Journey, C.A., Lane, R.F., Laughrey, Z.R., Loftin, K.A., McCleskey, R.B., McDonough, C.A., Medlock-Kakaley, E., Meyer, M.T., Putz, A.R., Richardson, S.D., Stark, A.E., Weis, C.P., Wilson, V.S., and Zehraoui, A., 2020, Mixed organic and inorganic tapwater exposures and potential effects in greater Chicago area, USA: Science of the Total Environment, v. 719, p. 137236, accessed December 20, 2022, at https://doi.org/10.1016/j.scitotenv.2020.137236.
Bradley, P.M., Kolpin, D.W., Romanok, K.M., Smalling, K.L., Focazio, M.J., Brown, J.B., Cardon, M.C., Carpenter, K.D., Corsi, S.R., DeCicco, L.A., Dietze, J.E., Evans, N., Furlong, E.T., Givens, C.E., Gray, J.L., Griffin, D.W., Higgins, C.P., Hladik, M.L., Iwanowicz, L.R., Journey, C.A., Kuivila, K.M., Masoner, J.R., McDonough, C.A., Meyer, M.T., Orlando, J.L., Strynar, M.J., Weis, C.P., and Wilson, V.S., 2018, Reconnaissance of mixed organic and inorganic chemicals in private and public supply tapwaters at selected residential and workplace sites in the United States: Environmental Science & Technology, v. 52, no. 23, 14 p., accessed December 20, 2022, at https://doi.org/10.1021/acs.est.8b04622.
Bradley, P.M., Kolpin, D.W., Thompson, D.A., Romanok, K.M., Smalling, K.L., Breitmeyer, S.E., Cardon, M.C., Cwiertny, D.M., Evans, N., Field, R.W., Focazio, M.J., Beane Freeman, L.E., Givens, C.E., Gray, J.L., Hager, G.L., Hladik, M.L., Hofmann, J.N., Jones, R.R., Kanagy, L.K., Lane, R.F., McCleskey, R.B., Medgyesi, D., Medlock-Kakaley, E.K., Meppelink, S.M., Meyer, M.T., Stavreva, D.A., and Ward, M.H., 2023b, Juxtaposition of intensive agriculture, vulnerable aquifers, and mixed chemical/microbial exposures in private-well tapwater in northeast Iowa: Science of the Total Environment, v. 868, 11 p., accessed January 24, 2023, at https://doi.org/10.1016/j.scitotenv.2023.161672.
Bradley, P.M., LeBlanc, D.R., Romanok, K.M., Smalling, K.L., Focazio, M.J., Cardon, M.C., Clark, J.M., Conley, J.M., Evans, N., Givens, C.E., Gray, J.L., Earl Gray, L., Hartig, P.C., Higgins, C.P., Hladik, M.L., Iwanowicz, L.R., Loftin, K.A., McCleskey, R.B., McDonough, C.A., Medlock-Kakaley, E.K., Weis, C.P., and Wilson, V.S., 2021a, Public and private tapwater—Comparative analysis of contaminant exposure and potential risk, Cape Cod, Massachusetts, USA: Environment International, v. 152, p. 106487, accessed December 20, 2022, at https://doi.org/10.1016/j.envint.2021.106487.
Bradley, P.M., Padilla, I.Y., Romanok, K.M., Smalling, K.L., Focazio, M.J., Breitmeyer, S.E., Cardon, M.C., Conley, J.M., Evans, N., Givens, C.E., Gray, J.L., Gray, L.E., Hartig, P.C., Higgins, C.P., Hladik, M.L., Iwanowicz, L.R., Lane, R.F., Loftin, K.A., McCleskey, R.B., McDonough, C.A., Medlock-Kakaley, E., Meppelink, S., Weis, C.P., and Wilson, V.S., 2021b, Pilot-scale expanded assessment of inorganic and organic tapwater exposures and predicted effects in Puerto Rico, USA: Science of the Total Environment, v. 788, p. 147721, accessed December 20, 2022, at https://doi.org/10.1016/j.scitotenv.2021.147721.
Bradley, P.M., Romanok, K.M., Smalling, K.L., Focazio, M.J., Charboneau, R., George, C.M., Navas-Acien, A., O’Leary, M., Red Cloud, R., Zacher, T., Breitmeyer, S.E., Cardon, M.C., Cuny, C.K., Ducheneaux, G., Enright, K., Evans, N., Gray, J.L., Harvey, D.E., Hladik, M.L., Kanagy, L.K., Loftin, K.A., McCleskey, R.B., Medlock-Kakaley, E.K., Meppelink, S.M., Valder, J.F., Weis, C.P., 2022, Tapwater exposures, effects potential, and residential risk management in Northern Plains nations: ACS ES&T Water, v. 2, no. 10, 16 p., accessed December 20, 2022, at https://doi.org/10.1021/acsestwater.2c00293.
Bradley, P.M., Romanok, K.M., Smalling, K.L., Focazio, M.J., Evans, N., Fitzpatrick, S.C., Givens, C.E., Gordon, S.E., Gray, J.L., Green, E.M., Griffin, D.W., Hladik, M.L., Kanagy, L.K., Lisle, J.T., Loftin, K.A., McCleskey, R.B., Medock-Kakaley, E.K., Navas-Acien, A., Roth, D.A., South, P., and Weis, C.P., 2023a, Bottled water contaminant exposures and potential human effects: Environment International, v. 171, 13 p., accessed December 20, 2022, at https://doi.org/10.1016/j.envint.2022.107701.
Brinton, T.I., Antweiler, R.C., and Taylor, H.E., 1996, Method for the determination of dissolved chloride, nitrate, and sulfate in natural water using ion chromatography: U.S. Geological Survey Open-File Report 95–426A, 16 p., accessed November 10, 2022, at https://doi.org/10.3133/ofr95426A.
Fishman, M.J., ed., 1993, Methods of analysis by the U.S. Geological Survey National Water Quality Laboratory—Determination of inorganic and organic constituents in water and fluvial sediments, U.S. Geological Survey Open-File Report 93–125, 217 p., accessed November 20, 2023, at https://doi.org/10.3133/ofr93125.
Furlong, E.T., Noriega, M.C., Kanagy, C.J., Kanagy, L.K., Coffey, L.J., and Burkhardt, M.R., 2014, Determination of human-use pharmaceuticals in filtered water by direct aqueous injection–high-performance liquid chromatography/tandem mass spectrometry: U.S. Geological Survey Techniques and Methods, book 5, chap. B10, 49 p., accessed November 7, 2022, at https://doi.org/10.3133/tm5B10.
Hergenreder, R.L., 2011, Trace metals in waters by GFAAS, in accordance with U.S. EPA and Health Canada requirements: Shelton, Conn., PerkinElmer, Inc., 5 p., accessed November 10, 2022, at https://resources.perkinelmer.com/lab-solutions/resources/docs/PinAAcleTraceMetalsinWaterbyGFAAAppNote.pdf.
Hladik, M.L., Focazio, M.J., and Engle, M., 2014, Discharges of produced waters from oil and gas extraction via wastewater treatment plants are sources of disinfection by-products to receiving streams: Science of the Total Environment, v. 466–467, p. 1085–1093, accessed November 8, 2022, at https://doi.org/10.1016/j.scitotenv.2013.08.008.
Hunt, R.J., Saad, D.A., and Chapel, D.M., 2003, Numerical simulation of ground-water flow in La Crosse County, Wisconsin, and into nearby pools of the Mississippi River: U.S. Geological Survey Water-Resources Investigations Report 03–4154, 36 p., accessed March 20, 2023, at https://pubs.usgs.gov/wri/wri034154/pdf/WRIR-03-4154.pdf.
International Organization of Standardization, 2019, Water quality—Determination of perfluoroalkyl and polyfluoroalkyl substances (PFAS) in water—Method using solid phase extraction and liquid chromatography-tandem mass spectrometry (LC-MS/MS): ISO Standards Catalogue, 43 p., accessed March 24, 2023, at https://www.iso.org/standard/71338.html.
Kolpin, D.W., Hubbard, L.E., Cwiertny, D.M., Meppelink, S.M., Thompson, D.A., Gray, J.L. 2021, A comprehensive statewide spatiotemporal stream assessment of per- and polyfluoroalkyl substances (PFAS) in an agricultural region of the United States: Environmental Science Technology Letters, v. 8, p. 981–988, accessed November 8, 2022, at https://doi.org/10.1021/acs.estlett.1c00750.
Lipps, W.C., Baxter, T.E., Braun-Howland, E., eds. 2022a, 9215 Heterotrophic plate count: Standard Methods for the Examination of Water and Wastewater: Washington, D.C.: APHA Press, accessed January 24, 2023, at https://www.standardmethods.org/doi/full/10.2105/SMWW.2882.188.
Lipps, W.C., Baxter, T.E., Braun-Howland, E., eds., 2022b, 9222 Membrane filter technique for members of the coliform group: Standard Methods For the Examination of Water and Wastewater: Washington, D.C., APHA Press, accessed January 24, 2023, at https://www.standardmethods.org/doi/full/10.2105/SMWW.2882.193.
McCleskey, R.B., Nordstrom, D.K., and Ball, J.W., 2003, Metal interferences and their removal prior to the determination of As(T) and As(III) in acid mine waters by hydride generation atomic absorption spectrometry: U.S. Geological Survey Water-Resources Investigations Report 03–4117, 20 p., accessed November 10, 2022, at https://doi.org/10.3133/wri034117.
McCleskey, R.B., Roth, D.A., Mahony, D., Nordstrom, D.K., and Kinsey, S., 2019, Sources, fate, and flux of geothermal solutes in the Yellowstone and Gardner Rivers, Yellowstone National Park, WY: Applied Geochemistry, v. 111, 14 p., accessed November 10, 2022, at https://doi.org/10.1016/j.apgeochem.2019.104458.
National Archives, 2023, Appendix B to Part 136—Definition and procedure for the determination of the method detection limit—Revision 2: Code of Federal Regulations, title 40, part 136, accessed March 22, 2023, at https://www.ecfr.gov/current/title-40/chapter-I/subchapter-D/part-136/appendix-Appendix%20B%20to%20Part%20136.
Oblinger Childress, C.J., Foreman, W.T., Connor, B.F., and Maloney, T.J., 1999, New reporting procedures based on long-term method detection levels and some considerations for interpretations of water-quality data provided by the U.S. Geological Survey National Water Quality Laboratory: U.S. Geological Survey Open-File Report 99–193, 19 p., accessed November 10, 2022, at https://doi.org/10.3133/ofr99193.
Olcott, P.G., 1992,, Groundwater atlas of the United States Iowa, Michigan, Minnesota, Wisconsin— Cambridge-Ordovician aquifer system: HA 730–J, accessed March 21, 2023, at https://pubs.usgs.gov/ha/ha730/ch_j/J-text8.html.
Romanok, K.M., Bradley, P.M., Smalling, K.L., Meppelink, S.M., McCleskey, R.B., Hladik, M.L., Gray, J.L., and Kanagy, L.K., 2023a, Target-chemical concentrations for assessment of mixed-organic/inorganic chemical and biological exposures in private-well tapwater at Campbell, Wisconsin, 2021: U.S. Geological Survey data release, https://doi.org/10.5066/P9EUBGUF.
Romanok, K.M., Hines, R.K., Gaikowski, M.P., Bradley, P.M., and Smalling, K.L., 2023b, Quarterly sample results for per- and polyfluoroalkyl substances (PFAS) for locations in Campbell, Wisconsin, 2021–22: U.S. Geological Survey data release, https://doi.org/10.5066/P9J6XKVS.
Romanok, K.M., Kolpin, D.W., Meppelink, S.M., Argos, M., Brown, J.B., DeVito, M., Dietze, J.E., Givens, C.E., Gray, J.L., Higgins, C.P., Hladik, M.L., Iwanowicz, L.R., McCleskey, B.R., Meyers, M.T., Strynar, M.J., Weis, C.P., Wilson, V.S., and Bradley, P.M., 2018, Methods used for the collection and analyses of chemical and biological data for the tapwater exposure and human-health Study, United States, 2016–17: U.S. Geological Survey Open-File Report 2018–1098, 79 p., accessed November 7, 2022, at https://doi.org/10.3133/ofr20181098.
Rose, D.L., Sandstrom, M.W., and Murtagh, L.K., 2016, Determination of heat purgeable and ambient purgeable volatile organic compounds in water by gas chromatography/mass spectrometry: U.S. Geological Survey Techniques and Methods, book 5, chap. B12, 61 p., accessed November 8, 2022, at https://doi.org/10.3133/tm5B12.
Sandstrom, M.W., Kanagy, L.K., Anderson, C.A., and Kanagy, C.J., 2015, Determination of pesticides and pesticide degradates in filtered water by direct aqueous-injection liquid chromatography-tandem mass spectrometry: U.S. Geological Survey Techniques and Methods, book 5, chap. B11, 54 p., accessed November 7, 2022, at https://doi.org/10.3133/tm5B11.
Schultz, Z., 2021, Wisconsin issues drinking water advisory after well testing on French Island identifies PFAS contamination: PBS Wisconsin, March 26, 2021, West Central Region, accessed January 10, 2023, at https://pbswisconsin.org/news-item/wisconsin-issues-drinking-water-advisory-after-well-testing-on-french-island-identifies-pfas-contamination/.
Smalling, K.L., Bradley, P.M., Romanok, K.M., Elliot, S.M., de Lambert, J., Focazio, M.J., Gordon, S.E., Gray, J.L., Kanagy, L.K., Hladik, M.L., Loftin, K.A., McCleskey, R.B., Medlock-Kakaley, E.K., Cardon, M.C., Evans, N., and Weis, C.P., 2023, Exposures and potential health implications of contaminant mixtures in linked source water, finished drinking water, and tapwater from public-supply drinking water systems in Minneapolis/St. Paul area, USA: Environmental Science: Water Research & Technology, 16 p., accessed June 8, 2023, at https://doi.org/10.1039/D3EW00066D.
Shoemaker, J., and Tettenhorst, D., 2020, Method 537.1—Determination of selected per- and polyfluorinated alkyl substances in drinking water by solid phase extraction and liquid chromatography/tandem mass spectrometry (LC-MS/MS): U.S. Environmental Protection Agency, Washington D.C., EPA/600/R-20/006, accessed March 7, 2023, at https://cfpub.epa.gov/si/si_public_file_download.cfm?p_download_id=539984&Lab=CESER.
U.S. Census Bureau, 2023, 2020 census demographic data map viewer [Census tract 103 La Crosse County, Wisconsin]: U.S. Census Bureau database, accessed July 27, 2023, at https://mtgisportal.geo.census.gov/arcgis/apps/MapSeries/index.html?appid=2566121a73de463995ed2b2fd7ff6eb7.
U.S. Environmental Protection Agency, 1993, Method 300.0—Determination of inorganic anions by ion chromatography: Revision 2.1, Cincinnati, Ohio, 28 p., accessed November 10, 2022, at https://www.epa.gov/sites/default/files/2015-08/documents/method_300-0_rev_2-1_1993.pdf.
U.S. Environmental Protection Agency, 1994, Method 200.7, Revision 4.4—Determination of metals and trace elements in water and wastes by inductively coupled plasma-atomic emission spectrometry: U.S. Environmental Protection Agency Office of Research and Development, Cincinnati, Ohio, 59 p., accessed November 10, 2022, at https://www.epa.gov/sites/default/files/2015-08/documents/method_200-7_rev_4-4_1994.pdf.
U.S. Environmental Protection Agency, 2005, Part 136, Appendix B—Definition and procedure for the determination of the method detection limit—Revision 1.11, in Guidelines establishing test procedures for the analysis of pollutants: U.S. Code of Federal Regulations, Title 40, revised as of December 30, 2016, p. 319–322, accessed March 24, 2023, at https://www.govinfo.gov/content/pkg/CFR-2012-title40-vol24/pdf/CFR-2012-title40-vol24-part136-appB.pdf.
U.S. Environmental Protection Agency, 2008, Lead and Copper rule—A quick reference guide: U.S. Environmental Protection Agency Office of Water, Washington, D.C., EPA 816–F–08–018, 2 p., accessed December 13, 2022, at https://nepis.epa.gov/Exe/ZyPDF.cgi?Dockey=60001N8P.txt.
U.S. Environmental Protection Agency, 2009, National Primary Drinking Water Regulations: U.S. Environmental Protection Agency, Washington D.C., EPA 816–F–09–004, 6 p., accessed December 13, 2022, at https://www.epa.gov/sites/production/files/2015-11/documents/howeparegulates_mcl_0.pdf.
U.S. Environmental Protection Agency, 2013, Revised total coliform rule—A quick reference guide: U.S. Environmental Protection Agency Office of Water, Washington D.C., 78 FR 10269, v. 78, no. 30, 3 p., accessed July 28, 2023, at https://nepis.epa.gov/Exe/ZyPDF.cgi?Dockey=P100K9MP.txt.
U.S. Environmental Protection Agency, 2014, Method 1603—Escherichia coli (E. coli) in water by membrane filtration using modified membrane-thermotolerant Escherichia coli agar (Modified mTEC): U.S. Environmental Protection Agency Office of Water, Washington, D.C., 42 p., accessed January 24, 2023, at https://www.epa.gov/sites/default/files/2015-08/documents/method_1603_2009.pdf.
U.S. Environmental Protection Agency, 2022, Lifetime Drinking Water Health Advisories for four perfluoroalkyl substances: Federal Register, v. 87, no. 118, p. 36848–36849, accessed November 20, 2023, at https://www.govinfo.gov/content/pkg/FR-2022-06-21/pdf/2022-13158.pdf.
U.S. Environmental Protection Agency, 2023, Proposed PFAS National Drinking Water Regulation FAQs for drinking water primacy agencies, accessed July 27, 2023, at https://www.epa.gov/system/files/documents/2023-03/FAQs_PFAS_States_NPDWR_Final_3.14.23_0.pdf.
U.S. Geological Survey, 2015, Changes to National Water Quality Laboratory (NWQL) procedures used to establish and verify laboratory detection and reporting limits: National Water Quality Laboratory Technical Memorandum 15.02, 21 p., accessed November 8, 2022, at https://nwql.usgs.gov/tech_memos/nwql.2015-02.pdf.
Wisconsin Department of Natural Resources, [undated], Well construction information system: Wisconsin Department of Natural Resources database, accessed October 19, 2023, at https://apps.dnr.wi.gov/wellconstructionpub/#!/PublicSearch/Index.
Appendix 1. Summary Data Tables for the Occurrence of Mixed Organic and Inorganic Chemicals in Groundwater and Tapwater, Town of Campbell, Wisconsin, 2021–22
Table 1.1.
Frequency of detection (in percent for all samples) and concentrations ranges (in units listed), for detected inorganic constituents, and field parameters, collected at 11 spatially distributed sites (eight sampled one time each; median concentration ranges used for sites 001, 002, and 003 for minimum, median, and maximum value presented in table) and analyzed at the U.S. Geological Survey Redox Chemistry Laboratory (RCL) and Analytical Trace Element Chemistry Laboratory in Boulder, Colorado, for the French Island Tapwater Exposure study, Campbell, Wisconsin, 2021.[Water temperature, specific conductance and pH were measured in the field at time of sample collection. Antimony, arsenic, beryllium, cadmium, cobalt, molybdenum, selenium, and vanadium were not detected in any sample. n, number of samples; —, not applicable; °C, degrees Celsius; nd, not detected above reporting limit; μS/cm, microsiemens per centimeter; <, less than; mg/L, milligrams per liter; CaCO3, calcium carbonate; μg/L, micrograms per liter; ^, value reflects median for each of the seven samples collected at sites 001, 002, or 003]
Table 1.2.
Frequency of detection (in percent) and concentrations ranges (in units listed), for detected inorganic constituents, and field parameters, collected at three sites sampled temporally (sampled seven times over three days) and analyzed at the U.S. Geological Survey Redox Chemistry Laboratory and Analytical Trace Element Chemistry Laboratory in Boulder, Colorado, for the French Island Tapwater Exposure study, Campbell, Wisconsin, 2021.[Water temperature, specific conductance and pH were measured in the field at time of sample collection. Antimony, arsenic, beryllium, cadmium, cobalt, molybdenum, selenium, and vanadium were not detected in any sample. n, number of samples; —, not applicable; °C, degrees Celsius; nd, not detected above reporting limit; <, less than; mg/L, milligrams per liter; μg/L, micrograms per liter; μS, microsiemens; CaCO3, calcium carbonate]
Table 1.3.
Frequency of detection (in percent) and concentrations ranges (in micrograms per liter) for detected organic compounds collected at three sites sampled temporally (each site was sampled seven times over three days) and analyzed at the U.S. Geological Survey National Water Quality Laboratory, Denver, Colorado, for the French Island Tapwater Exposure Study, Campbell, Wisconsin, 2021–22.[PFHxS and PFOS represent the sum of the branched and linear isotopes. Reporting limit for PFHxS branched was <0.009 μg/L, and for PFOS branched was <0.040 μg/L. μg/L, micrograms per liter; n, number of samples; <, less than; nd, not detected above reporting limit; E, estimated value]
Table 1.4.
Frequency of detection (in percent for all samples) and concentrations ranges (in micrograms per liter) of detected organic compounds collected at eleven spatially distributed sites (eight sampled one time each; median concentration ranges used for sites 001, 002, and 003 for minimum, median, and maximum value presented in table) and analyzed at the U.S. Geological Survey National Water Quality Laboratory, Denver, Colorado, for the French Island Tapwater Exposure Study, Campbell, Wisconsin, 2021–22.[PFHxS and PFOS represent the sum of the branched and linear isotopes. Reporting limit for PFHxS branched was <0.009 μg/L, and for PFOS branched was <0.040 μg/L. μg/L, micrograms per liter; n, number; nd, not detected above reporting limit; <, less than; E, estimated value; ^, maximum value reported for sites 001, 002, or 003, but median value is nd]
Table 1.5.
Summary statistics for detected inorganic constituents and grouped organic concentration results (in units listed) for the ten spatially distributed samples collected from the shallow sand and gravel (alluvial) aquifer (median results used for sites 002 and 003), as well as the median concentration results from site 001, finished in the sandstone and dolomite of the Mount Simon aquifer, analyzed by the U.S. Geological Survey Redox Chemistry Laboratory and Analytical Trace Element Chemistry Laboratory in Boulder, Colorado, and the National Water Quality Laboratory in Denver, Colorado, for the French Island Tapwater Exposure Study, Campbell, Wisconsin, 2021–22.[Antimony, arsenic, beryllium, cadmium, cobalt, molybdenum, selenium, and vanadium were not detected in any sample. Disinfection byproducts (DBP) were not detected in any sample. n, number of samples; °C, degrees Celsius; μS/cm, microsiemens per centimeter; μg/L, micrograms per liter; mg/L, milligrams per liter; —, not applicable; <, less than; nd, not detected above reporting limit; CaCO3, calcium carbonate; PHARM, pharmaceuticals; VOC, volatile organic compounds; SVOC, semi-volatile organic compounds; PEST, pesticides; PFAS, per- and polyfluoroalkyl substances]
Table 1.6.
Summary information, total number of detections, sum of concentrations (in micrograms per liter) and medians for organic compounds, detected at least one time in any sample (by group), analyzed at the U.S. Geological Survey National Water Quality Laboratory for the French Island Tapwater Exposure Study, Campbell, Wisconsin, 2021. [—Left][Disinfection byproducts (DBP) were not detected in any sample. First-flush; initial 6-plus hour overnight (stagnant first-flush) sample; post-flush, sample collected 30 minutes after the start of the initial sample collection; post-6h, sample collected 6 hours after the initial. yyyymmdd, year month day; HHMM, hour minute; μg/L, micrograms per liter; PHARM, pharmaceuticals; VOC, volatile organic compounds; SVOC, semi-volatile organic compounds; PEST, pesticides; PFAS, per- and polyfluoroalkyl substances; —, not applicable]
Table 1.7.
Frequency of detection (in percent) and concentrations ranges (in micrograms per liter) for detected per- and polyfluoroalkyl substances (PFAS) collected at four sites (sampled 7 or 8 times each beginning in 2021) and analyzed by SGS AXYS, British Columbia, Northern Lake Service, Inc., Crandon, Wisconsin, and Wisconsin State Laboratory of Hygiene, Madison, Wisconsin, for the Upper Midwest Environmental Sciences Center study, Campbell, Wisconsin, 2021–22.[See Romanok and others (2023b) for a full list of PFAS analyzed. n, number of samples; *, value not reported due to laboratory quality assurance issues, therefore n=7; nd, not detected above reporting limit; μg/L, micrograms per liter; —, not applicable]
Conversion Factors
Datum
Vertical coordinate information is referenced to the North American Vertical Datum of 1988 (NAVD 88).
Horizontal coordinate information is referenced to the North American Datum of 1983 (NAD 83).
Altitude, as used in this report, refers to distance above the vertical datum.
Supplemental Information
Specific conductance is given in microsiemens per centimeter at 25 degrees Celsius (µS/cm at 25°C), pH is given in standard units and water temperature in degrees Celsius (degrees C).
Concentrations of chemical constituents in water are given in either milligrams per liter (mg/L, equivalent to parts per million [ppm]), micrograms per liter (μg/L, equivalent to parts per billion [ppb]) or nanograms per liter (ng/L, equivalent to parts per trillion [ppt]).
Abbreviations
6:2 FTS
1H,1H,2H,2H-Perfluorohexane sulfonate (6:2)
ASTM
American Society for Testing and Materials
CFU/100 mL
colony forming units per 100 milliliters
DBP
disinfection byproduct
DQCALC
detection and quantitation estimation and data assessment utilizing software
E
estimated value
E. coli
Escherichia coli
EPA
U.S. Environmental Protection Agency
EPHML
Environmental and Public Health Microbiology Laboratory
FBSA
perfluorobutane sulfonamide
FOSA
perfluoro-1-octanesulfonamide
HAL
health advisory levels
HPC
heterotrophic plate count
HPLC-MS/MS
high performance liquid chromatography-tandem mass spectrometry
IRL
interim reporting limit
LOD
limit of detection
MCL
maximum contaminant level
MDL
method detection limit
MRL
minimum reporting level
nd
not detected above reporting limit
NLS
Northern Lake Service, Inc.
NPDWR
National Primary Drinking Water Regulations
NWQL
National Water Quality Laboratory
PFAS
per- and polyfluoroalkyl substances
PFBA
perfluorobutyrate
PFNA
perfluoro-n-nonanoate
PFBS
perfluoro-1-butanesulfonate
PFOA
perfluoro-n-octanoate
PFOS
perfluorooctanesulfonate
post-6h
post-6 hour
PTFE
polytetrafluoroethylene
RCL
Redox Chemistry Laboratory
RLDQC
reporting limit determined by DQCALC
SGS AXYS
Standard Global Services, Analytical Services Inc.
SPE
solid-phase extraction
SVOC
semi-volatile organic compounds
TTAL
treatment technique action level
UMESC
Upper Midwest Environmental Sciences Center
USGS
U.S. Geological Survey
VOC
volatile organic compounds
WSLH
Wisconsin State Laboratory of Hygiene
For more information, contact:
Director, New Jersey Water Science Center
3450 Princeton Pike, Suite 110,
Lawrenceville, New Jersey 08648
Or go to our website at https://www.usgs.gov/centers/new-jersey-water-science-center.
Publishing support provided by the Baltimore Publishing Service Center.
Disclaimers
Any use of trade, firm, or product names is for descriptive purposes only and does not imply endorsement by the U.S. Government.
Although this information product, for the most part, is in the public domain, it also may contain copyrighted materials as noted in the text. Permission to reproduce copyrighted items must be secured from the copyright owner.
Suggested Citation
Romanok, K.M., Meppelink, S.M., Bradley, P.M., Breitmeyer, S.E., Donahue, L., Gaikowski, M.P., Hines, R.K., and Smalling, K.L., 2023, Occurrence of mixed organic and inorganic chemicals in groundwater and tapwater, town of Campbell, Wisconsin, 2021–22: U.S. Geological Survey Open-File Report 2023–1088, 29 p., https://doi.org/10.3133/ofr20231088.
ISSN: 2331-1258 (online)
Study Area
| Publication type | Report |
|---|---|
| Publication Subtype | USGS Numbered Series |
| Title | Occurrence of mixed organic and inorganic chemicals in groundwater and tapwater, town of Campbell, Wisconsin, 2021–22 |
| Series title | Open-File Report |
| Series number | 2023-1088 |
| DOI | 10.3133/ofr20231088 |
| Publication Date | January 04, 2024 |
| Year Published | 2023 |
| Language | English |
| Publisher | U.S. Geological Survey |
| Publisher location | Reston, VA |
| Contributing office(s) | New Jersey Water Science Center, South Carolina Water Science Center, Upper Midwest Environmental Sciences Center, Central Midwest Water Science Center |
| Description | Report: viii, 29 p.; 2 Data Releases |
| Country | United States |
| State | Wisconsin |
| County | La Crosse County |
| City | Campbell |
| Online Only (Y/N) | Y |
| Additional Online Files (Y/N) | N |