

Changes in Sand Storage in the Colorado River in Grand Canyon National Park from July 2017 through June 2020
Links
- Document: Report (6 MB pdf) , HTML , XML
- NGMDB Index Page: National Geologic Map Database Index Page (html)
- Download citation as: RIS | Dublin Core
Acknowledgments
This study was funded by the U.S. Department of the Interior’s Glen Canyon Dam Adaptive Management Program.
Abstract
Changes in the quantity of sand stored within river segments can affect aquatic and riparian habitat, archeological resources, and recreation. Since summer to fall of 2002, gaging stations on the Colorado River in Grand Canyon National Park and on its major tributaries and selected lesser tributaries have measured the mass of sand transported past each station, which allows for changes in the mass of sand stored between gaging stations to be calculated. Sand mass balances on six Colorado River segments are currently measured; the upstream two segments measure sand mass balance in Marble Canyon, the middle three segments measure sand mass balance within the majority of Grand Canyon, and the downstream-most segment—western Grand Canyon and the Lake Mead delta—measures the quantity of sand transported past Diamond Creek and ultimately deposited in Lake Mead.
Between July 1, 2017, and June 30, 2020, the amount of sand stored in the Colorado River in Marble Canyon decreased, whereas the sand mass balance in Grand Canyon was indeterminate. Of the 3 years of study presented herein, sand was eroded from Marble Canyon during sediment year 2018 (July 1, 2017–June 30, 2018), a year with less than 40 percent of the 2003–2020 mean Paria River sand input, and sediment year 2020 (July 1, 2019–June 30, 2020), a year with negligible Paria River sand input. During sediment year 2018, when the Little Colorado River supplied negligible sand, sand was also eroded from Grand Canyon. The sand mass balance was indeterminate for Grand Canyon during sediment year 2020. During sediment year 2019 (July 1, 2018–June 30, 2019) sand accumulated in both Marble Canyon and Grand Canyon. This sediment year had sand inputs from both the Paria River and the Little Colorado River of more than 170 percent the 2003–2020 mean, coupled with below post-1964 mean discharge from Glen Canyon Dam.
Introduction
Measuring the mass of fine sediment—sand, silt, and clay—transported by and stored in the Colorado River in Grand Canyon National Park is imperative for understanding changes in physical and biological resources within the park. Fine-grained sediment, in particular sand, forms the eddy sandbars, beaches, and other deposits used for recreation and wildlife habitat and provides the source of the aeolian sand that helps preserve archeological sites along the Colorado River in Grand Canyon National Park (U.S. Department of the Interior, 1995; Schmidt and Grams, 2011; East and others, 2016). Closure of the gates of Glen Canyon Dam to begin filling Lake Powell on March 13, 1963, radically altered the Colorado River in Grand Canyon National Park and cutoff approximately (~) 95 percent of the pre-dam sand supply at the upstream park boundary (Carothers and Brown, 1991; Topping and others, 2000a). The reduction in the quantity of sand transported by the Colorado River into Grand Canyon National Park coupled with discharge pattern changes—lower flood peaks and higher base flows—led to erosion of sand from Marble and Grand Canyons (Dolan and others, 1974; Schmidt, 1990; Rubin and others, 2002; Topping and others, 2003, 2021). In response to the erosion, and as required by the Grand Canyon Protection Act of 1992, river managers directed the U.S. Geological Survey (USGS) Grand Canyon Monitoring and Research Center (GCMRC) to study how sediment was transported through the canyons and to develop dam reoperation alternatives to reverse the loss of sand and to sustainably rebuild sandbars, beaches, and other sandy deposits (U.S. Department of the Interior, 1995, 2016a, b).
To better understand how suspended sediment, and in particular sand, is transported through Marble and Grand Canyons in Grand Canyon National Park, the USGS began a program of intensive suspended-sediment monitoring starting in 1998. In August and October 2002, acoustic-Doppler profilers were installed at four gaging stations on the Colorado River so that continuous, 15-minute, suspended-sediment measurements could be made. This monitoring network was expanded in 2007 to five gaging stations. These five gaging stations, an upstream gaging station at Lees Ferry, Arizona, where episodic suspended-sediment measurements are made, other tributary gaging stations with episodic event-based suspended-sediment measurements, and Lake Mead define six sediment-monitoring segments of the Colorado River where sand inputs and exports are continuously measured, allowing the computation of the continuous mass-balance sand budgets analyzed herein. This network, the measurements, and the computational methods used are described in detail by Topping and others (2021).
Purpose and Scope
This report presents the annual sand mass balances for six segments of the Colorado River in Grand Canyon National Park from July 1, 2017, through June 30, 2020. The results herein provide an update to the 2003–2017 mass-balance results presented by Topping and others (2021). The results presented are a partial summary of the GCMRC’s suspended-sediment and sand-budget data (Sibley and others, 2015), which can be accessed at https://www.gcmrc.gov/discharge_qw_sediment.
Study Area
The study area is the Colorado River and its tributaries between Lees Ferry, Ariz., and Lake Mead (fig. 1). By convention first established by the 1923 Birdseye expedition (Birdseye, 1924), longitudinal locations along the Colorado River downstream from Lees Ferry, Ariz., are referenced by river mile (RM) starting with RM 0 at the Colorado River at Lees Ferry, Ariz. gaging station. The abbreviated names, official names, and station numbers for this and other USGS gaging stations used in this report are provided in table 1. Because no large tributaries enter the Colorado River between Glen Canyon Dam and RM 0, in this report, the discharges from the RM 0 station are used as a proxy for dam releases.
The six sand-budgeting segments are as follows: the upper Marble Canyon segment extends from the RM 0 to RM 30 gaging stations; the lower Marble Canyon segment extends from the RM 30 to RM 61 gaging stations; the eastern Grand Canyon segment extends from the RM 61 to RM 87 gaging stations; the east-central Grand Canyon segment extends from the RM 87 to RM 166 gaging stations; the west-central Grand Canyon segment extends from the RM 166 to RM 225 gaging stations; and the western Grand Canyon and Lake Mead delta segment extends from the RM 225 gaging station to Pearce Ferry, near RM 280. Although the western Grand Canyon segment is mostly within Grand Canyon, this segment is separated from the rest of Grand Canyon to simplify the writing in this report. In this report, the combined eastern, east-central, and west-central Grand Canyon segments are referred to as Grand Canyon and the western Grand Canyon segment is referred to separately. Sediment and discharge data for each gaging station, as well as sediment mass balances for each sediment budget reach, can be accessed online at https://www.gcmrc.gov/discharge_qw_sediment.
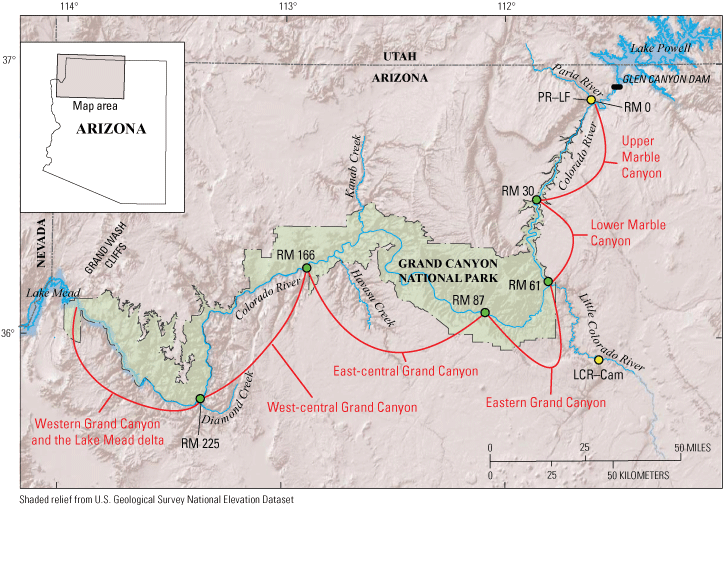
Map showing the study area in northwestern Arizona. Shown are six sand-budgeting segments (highlighted in red brackets and type) on the Colorado River, U.S. Geological Survey (USGS) gaging stations (green circles) where 15-minute suspended-sediment measurements were made, and tributary USGS gaging stations (yellow circles) where the shifting rating-curve method with event-based sampling (see Topping and others, 2021) was used to calculate 15-minute loads. As used in this report, Marble Canyon extends from the Paria River to river mile (RM) 61 just above the Little Colorado River; Grand Canyon extends from RM 61 to RM 225.
Table 1.
Abbreviated name, official name, and station number for each U.S. Geological Survey gaging station used in this report.Methods
The annual change in sand mass, that is, the annual sand mass balance, was calculated in each of the six Colorado River segments as,
where, for each year,ΔS
is the sand mass balance in a river segment;
I
is the measured sand load of the Colorado River entering a river segment;
IT
is the measured sand load of the major tributaries entering a river segment;
ILT
is the estimated sand load of the lesser tributaries entering a river segment; and
E
is the measured sand load of the Colorado River exported from a river segment.
Uncertainties in sand mass balances were calculated according to methods described by Topping and others (2021). Uncertainties in sand loads for each input are propagated through equation 1 to determine the uncertainties reported for ΔS; the absolute magnitude of uncertainties in ΔS accumulate over time. When the uncertainty in the annual sand mass balance for a river segment is more than or equal to (≥)1.5 times the absolute value of the zero-bias value, the sand mass balance is deemed indeterminate. When the uncertainty is less than the absolute value of the zero-bias value, the sand mass balance is demonstrably positive or negative. When the uncertainty falls between these bounds, the sand mass balance is either likely positive or likely negative.
The sand mass balances in the six river segments and in all of Marble and Grand Canyons were calculated for three sediment years: 2018, 2019, and 2020. The “sediment year” used herein is that defined by Topping and others (2000a) and runs from July 1 of the preceding calendar year through June 30 of the current year. For example, sediment year 2018 starts at 0:00 on July 1, 2017, and ends at 23:59 on June 30, 2018. Topping and others (2000a) defined the sediment year such that it began with the season of maximum sand tributary sediment supply and ended with the season of maximum sediment export in the Colorado River.
Results and Discussion
Over the 3 years of the study, 380,000±360,000 metric tons (t) of sand were eroded from Marble Canyon. Sand was eroded from Marble Canyon in both sediment years 2018 and 2020 (−220,000±73,000 and −390,000±34,000 t, respectively), with most of this erosion occurring in the upper Marble Canyon segment (table 2). Conversely, Marble Canyon gained 230,000±250,000 t of sand1 in sediment year 2019, with essentially all this likely sand accumulation occurring in the lower Marble Canyon segment (table 2). Over the 3-year period for the two segments in Marble Canyon, three instances of annual sand erosion occurred, one instance of annual sand accumulation, and two instances of indeterminate sand mass balance during sediment years 2018–2020 (table 2). In this usage, the word “instance” means one year in any segment. The upper Marble Canyon segment lost sand in two years (2018, 2020) and had an indeterminate ΔS in one year (2019); net sand erosion occurred in this segment during 2018–2020. The lower Marble Canyon segment lost sand in one year (2020), gained sand in one year (2019), and had an indeterminate ΔS in one year (2018); the net change in sand mass in this segment was indeterminate during 2018–2020. The suspended sand transported past each gaging station and the lesser tributary sand inputs to each reach of the Colorado River in Marble and Grand Canyons is listed in table 3.
Although the uncertainty (250,000 t) is slightly larger than the zero-bias value (230,000 t), ΔS is likely positive in this case, thus indicating likely sand accumulation, because the uncertainty is less than 1.5 times the absolute value of the zero-bias value.
Over the 3 years of this study, ΔS in Grand Canyon was indeterminate (360,000±650,000 t; table 2). Sand was eroded from Grand Canyon in sediment year 2018, accumulated in sediment year 2019, and ΔS was indeterminate in sediment year 2020. Among the three segments in Grand Canyon, that is, the eastern, east-central, and west-central segments, four instances of annual sand erosion occurred, three instances of annual sand accumulation, and two instances of indeterminate ΔS during sediment years 2018–2020 (table 2). The eastern Grand Canyon segment lost sand in two years (2018, 2020) and gained sand in one year (2019); the net change in sand mass in this segment was indeterminate during 2018–2020. The east-central Grand Canyon segment lost sand in one year (2020), gained sand in one year (2019), and an indeterminate ΔS occurred in one year (2018); the net change in sand mass in this segment was indeterminate during 2018–2020. Similarly, the west-central Grand Canyon segment lost sand in one year (2018), gained sand in one year (2020), and an indeterminate ΔS occurred in one year (2019); the net change in sand mass in this segment was also indeterminate during 2018–2020.
The longitudinal patterns of sand accumulation and erosion in Grand Canyon among the eastern, east-central, and west-central segments differed between the three years. Erosion was the most widespread in Grand Canyon in sediment year 2018. During this year, when 320,000±110,000 t of sand were eroded from Grand Canyon, both the eastern and west-central segments lost sand, and ΔS in the intervening east-central segment was indeterminate (table 2). The pattern was completely different in sediment year 2019, when the eastern and east-central Grand Canyon segments both gained substantial amounts of sand and ΔS in the west-central Grand Canyon segment was indeterminate. The accumulation in the upstream two segments of Grand Canyon combined such that 660,000±450,000 t of sand accumulated in Grand Canyon in sediment year 2019 (table 2). The pattern was different yet again in sediment year 2020, when erosion of sand from the eastern and east-central Grand Canyon segments offset accumulation of sand in the west-central Grand Canyon segment such that ΔS in Grand Canyon was indeterminate (20,000±89,000 t; table 2). The differences in the longitudinal patterns in ΔS in Grand Canyon between the three years likely arose from differences in the longitudinal gradients in bed-sand grain size that control whether sand is eroded or deposited in a river segment (Topping and others, 2021).
Because the western Grand Canyon segment terminates in Lake Mead and has no measured export (E), the sand mass balance (ΔS) in this segment is always positive (table 2). The years with the largest ΔS in this segment tend to be those with higher mean-annual discharge or those when controlled floods (administratively now known as high-flow experiments) are released from Glen Canyon Dam to rebuild sandbars after large tributary sand inputs (U.S. Department of the Interior, 1995, 2016a, b; Webb and others, 1999; Rubin and others, 2002; Wright and Kennedy, 2011; Grams and others, 2015). The controlled flood in November 2018 accounted for ~680,000 t of the 2.0±0.1 million metric tons (Mt) (that is, 34 percent) of the sand input to the western Grand Canyon segment during sediment year 2019 (U.S. Geological Survey, 2022; table 2). In addition to this influence of discharge on ΔS in the western Grand Canyon segment, another large control arises from the tributary floods themselves, as supported by the following correlations. The positive correlation between the combined annual sand input from the Paria and Little Colorado Rivers and annual ΔS in the western Grand Canyon segment (table 2) was near-perfect (r = 0.98), whereas the positive correlation between the annual-mean discharge at the RM 0 gaging station and annual ΔS in the western Grand Canyon segment (table 2) was only strong (r = 0.75). The physical reason for this result is described by Topping and others (2021). Large tributary sand inputs cause bed-sand fining that increases downstream sand transport in the Colorado River. In addition, the sand supplied to the Colorado River during large tributary floods migrates downstream as a sand wave, the front of which typically passes the RM 225 station and enters the western Grand Canyon segment within a week (Topping and others, 2000b, 2021). During the largest floods on these tributaries, ~7 percent of the sand supplied by the Paria River is transported to the western Grand Canyon segment within 7 days, and ~27 percent of the sand supplied by the Little Colorado River is transported to this segment within 7 days (Topping and others, 2021). Indeed, ~40 percent of the ~1.3 Mt of sand input to the western Grand Canyon segment during sediment year 2019 outside of the controlled flood was supplied during only 25 percent of the year, when suspended-sand concentration tended to be elevated at the RM 225 gaging station during periods of flooding on the Paria and Little Colorado Rivers and other upstream tributaries (U.S. Geological Survey, 2022).
Although the sand mass balance (ΔS) in individual river segments is governed by discharge and longitudinal gradients in bed-sand grain size (which are, in turn, controlled by changes in the upstream sand supply), ΔS in the Colorado River over longer time and longitudinal scales can be related to mean discharge and tributary sand supply (Topping and others, 2021). Though such relations have large error because they neglect the influence of grain size and simplify all discharges over the course of a year to one value, they are useful because they allow estimation of ΔS in Marble Canyon and in Grand Canyon only on the basis of the annual-mean discharge released from Glen Canyon Dam and the annual sand supplies from the Paria and Little Colorado Rivers. Topping and others (2021) fit two relations between the annual mean discharge at the RM 0 gaging station and annual ΔS for Marble Canyon and Grand Canyon—one for years with higher tributary sand supply and another for years with lower tributary sand supply. The threshold Paria River annual sand supply that segregated the Marble Canyon ΔS into two groups was 1.1 Mt; the threshold combined Paria River and Little Colorado River annual sand supply that segregated the Grand Canyon ΔS into two groups was 2 Mt (Topping and others, 2021). The data for sediment years 2003–2017 and these relations from figure 10 of Topping and others (2021) are reproduced herein in figure 2, along with the new data from sediment years 2018–2020. Reanalysis of the dependence of annual ΔS on annual-mean discharge and tributary sand supply after inclusion of the 2018–2020 data result in only negligible changes to the relations fit by Topping and others (2021) to the 2003–2017 data (fig. 2). Thus, the changes in sand storage observed in Marble Canyon and in Grand Canyon during sediment years 2018–2020 occurred under the same combination of flow and sand-supply conditions that Topping and others (2021) concluded gave rise to either sand accumulation or erosion during 2003–2017.
During sediment years 2003–2017, sand only accumulated in Marble Canyon during years when the mean-annual discharge from Glen Canyon Dam was less than ~13,400 cubic feet per second (ft3/s) and the Paria River supplied more than 1.1 Mt of sand (Topping and others, 2021). Sand eroded from Marble Canyon during years with dam releases higher than the post-1964 mean-annual discharge, regardless of the magnitude of the Paria River sand supply. In addition, sand eroded from Marble Canyon during all years when the mean-annual dam release exceeded ~11,200 ft3/s and the Paria River supplied less than 1.1 Mt of sand (fig. 2). Similarly, during sediment years 2003–2017, sand only accumulated in Grand Canyon during years when the mean-annual discharge from Glen Canyon Dam was less than ~14,100 ft3/s and the Paria and Little Colorado Rivers combined to supply more than 2 Mt of sand (Topping and others, 2021). At dam releases higher than the post-1964 mean-annual discharge, sand was either eroded from Grand Canyon when the combined Paria and Little Colorado River sand supply was less than 2 Mt, or conveyed through Grand Canyon when the combined Paria and Little Colorado River sand supply exceeded 2 Mt. In addition, sand eroded from Grand Canyon during most years when the mean-annual dam release exceeded ~11,300 ft3/s and the combined Paria and Little Colorado River sand supply was less than 2 Mt (fig. 2).
Given the similarity of data from sediment years 2003–2017 and 2018–2020, the above flow and sand-supply thresholds remain valid for inferring the main drivers of the changes in sand storage observed during 2018–2020. Sand accumulated in Marble and Grand Canyons during sediment year 2019 because the Paria and Little Colorado Rivers both supplied a large amount of sand and dam releases were relatively low. The sand inputs from both tributaries were well above average in 2019; the Paria River sand input was 128 percent of average and the Little Colorado River sand input was 222 percent of average. During sediment year 2019, the Paria River supplied 1.14 Mt of sand, and the combined Paria and Little Colorado River sand supply was 2.43 Mt. These respective amounts of sand were slightly larger than the 1.1-Mt threshold and larger than the 2-Mt threshold that separate high from low tributary-sand-supply conditions in Marble and Grand Canyons, respectively. The sand inputs during sediment year 2019 were the seventh largest for the Paria River and the third largest for the Little Colorado River during the 18 years since continuous suspended-sediment monitoring began on the Colorado River in sediment year 2003. The mean discharge released from Glen Canyon Dam during sediment year 2018 (12,700 ft3/s; table 2) was below the post-1964 mean discharge2 of 13,600 ft3/s. The corresponding total volume of water passing the RM 0 station was 9.19 million acre-feet, 7 percent less than the post-1964 average of 9.85 million acre-feet. This mean-annual discharge was also 5 percent less than the ~13,400-ft3/s maximum discharge under which sand has been observed to accumulate in Marble Canyon under high tributary-sand-supply conditions (table 2, fig. 2). Moreover, this mean-annual dam release was 10 percent less than the ~14,100-ft3/s maximum discharge under which sand has been observed to accumulate in Grand Canyon under high tributary-sand-supply conditions (table 2, fig. 2).
This post-1964 sediment-year value does not include the anomalously lower discharges that characterized much of the initial filling phase of Lake Powell between the closure of Glen Canyon Dam on March 13, 1963, and the end of sediment year 1964 on June 30, 1964 (Topping and others, 2003).
Sand was eroded from Marble and Grand Canyons during sediment year 2018 mainly because dam releases were too high given the small amounts of sand supplied by both the Paria and Little Colorado Rivers. Although the mean discharge released from Glen Canyon Dam (12,600 ft3/s; table 2) and corresponding total volume of water passing the RM 0 gaging station (9.12 million acre-feet) during sediment year 2018 and 2019 were similar, the Paria and Little Colorado Rivers supplied far less sand than in 2019. The sand inputs during sediment year 2018 (table 2) were the sixth smallest for the Paria River and the smallest for the Little Colorado River since continuous suspended-sediment monitoring began (table 2). These amounts of sand were much less than the respective 1.1- and 2-Mt thresholds that separate high from low tributary-sand-supply conditions in Marble and Grand Canyons. The mean-annual discharge released from Glen Canyon Dam (12,600 ft3/s; table 2) exceeded the ~11,200-ft3/s and ~11,300-ft3/s respective thresholds for erosion under low tributary-sand-supply conditions in Marble and Grand Canyons by 13 and 12 percent, respectively (table 2, fig. 2).
Although sand was eroded from Marble Canyon during sediment year 2020, it was conveyed through Grand Canyon. The erosion of sand from Marble Canyon this year was driven by only a negligible amount of sand supplied by the Paria River; dam releases were well below average. Sand was conveyed through Grand Canyon during sediment year 2020 and not eroded from Grand Canyon, as during sediment year 2018, because the Little Colorado River supplied much more sand during sediment year 2020 (table 2). The mean-annual discharge released from Glen Canyon Dam during sediment year 2020 (12,000 ft3/s; table 2) was 12 percent below the post-1964 average and corresponded to a total volume of water passing the RM 0 station of only 8.71 million acre-feet. The mean-annual discharge released from Glen Canyon Dam during this year (12,000 ft3/s) slightly exceeded the ~11,200-ft3/s threshold for erosion under low tributary-sand-supply conditions (table 2, fig. 2). Although the discharge released from the dam also slightly exceeded (that is, by 6 percent) the expected discharge threshold (11,300 ft3/s) for erosion under low tributary-sand-supply conditions in Grand Canyon, ΔS for Grand Canyon was indeterminate for 2020. The combined Paria and Little Colorado River sand supply during this year was only 333,000 t, much less than the 2-Mt threshold separating high from low tributary-sand-supply conditions in Grand Canyon (table 2, fig. 2). The sand inputs during sediment year 2020 (table 2) were the second smallest for the Paria River and the seventh smallest for the Little Colorado River since continuous suspended-sediment monitoring began.
Table 2.
Annual sand-budget results with propagated uncertainties for segments of the Colorado River, Arizona.[ft3/s, cubic feet per second; Mt, million metric tons; RM 0, Colorado River at Lees Ferry, Arizona; LCR, Little Colorado River; UMC, upper Marble Canyon; LMC, lower Marble Canyon; EGC, eastern Grand Canyon; ECGC, east-central Grand Canyon; WCGC, west-central Grand Canyon; WGC, western Grand Canyon and the Lake Mead delta]
Table 3.
Annual sediment loads used in the sand budgets (table 2) for segments and gaging stations on the Colorado River, Arizona.[Sand load consists of suspended-sand load plus sand bed load; calculation of sand loads and their uncertainties are described by Topping and others (2021). Mt, million metric tons; UMC, upper Marble Canyon; LMC, lower Marble Canyon; EGC, eastern Grand Canyon; ECGC, east-central Grand Canyon; WCGC, west-central Grand Canyon]
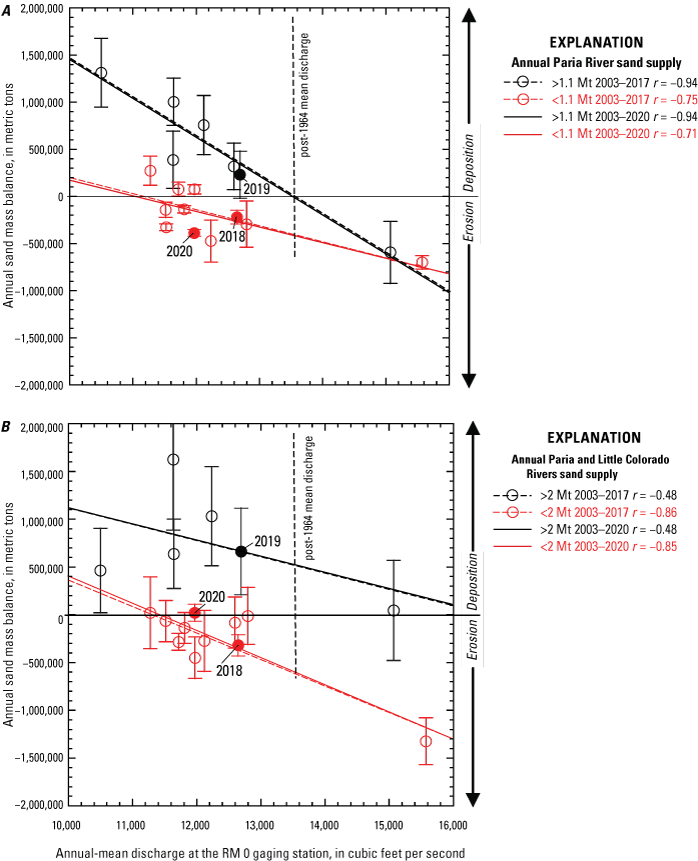
Annual sand mass balance plotted as a function of annual-mean discharge at the RM 0 gaging station for (A) Marble Canyon and (B) Grand Canyon in Arizona. Data are separated into relatively high (black) and relatively low (red) annual tributary sand supply (in million metric tons [Mt]). The values from this study are depicted as filled circles, with each sediment year labeled; values from previous years reproduced from Topping and others (2021) depicted as unlabeled open circles. The least-squares linear regressions fit to each sand-supply condition for the sediment year 2003–2017 data from Topping and others (2021) are depicted as dashed lines; regressions fit to each sand-supply condition for all data from sediment years 2003–2020 are depicted as solid lines. Correlation coefficients (r) associated with each regression are shown. Error bars indicate the magnitudes of the uncertainties in annual sand mass balances propagated through equation 1. The post-1964 mean discharge is the mean discharge at the RM 0 gaging station during sediment years 1965–2020.
Summary
The longitudinal patterns of annual sand accumulation and erosion varied among the 3 years of this study owing to large differences in tributary sand supply and subtle differences in dam releases. The amount of sand stored in Marble Canyon decreased over the 3 years of this study. Accumulation and erosion offset within the uncertainty in Grand Canyon3 over time such that the sand mass balance over the 3 years of this study was indeterminate. Sand accumulated in the downstream-most western Grand Canyon and the Lake Mead delta segment during each year, as it always does, because this segment terminates in Lake Mead. The greatest sand accumulation in this segment occurred in the year with the largest tributary sand supply (sediment year 2019) when a controlled flood was released from Glen Canyon Dam to rebuild sandbars.
As a reminder, “Grand Canyon” in this section refers to that part of Grand Canyon upstream from the western Grand Canyon segment.
Sand accumulated in both Marble Canyon and Grand Canyon during sediment year 2019 (July 1, 2018–June 30, 2019) owing to well above-average sand inputs from both the Paria and the Little Colorado Rivers. The 2019 sand accumulation in Marble Canyon likely occurred in the lower Marble Canyon segment; the sand mass balance in the upper Marble Canyon segment was indeterminate. The 2019 sand accumulation in Grand Canyon occurred in the eastern Grand Canyon and east-central Grand Canyon segments; the sand mass balance in the downstream west-central Grand Canyon segment was indeterminate.
In contrast, sand eroded from both Marble and Grand Canyons during sediment year 2018 (July 1, 2017–June 30, 2018) because the dam releases were high relative to the small amount of sand supplied by both the Paria and Little Colorado Rivers. Similar dam releases between sediment years 2018 and 2019 led to very different sand-storage outcomes because of the large difference in tributary sand input between these two years. The 2018 sand erosion in Marble Canyon likely occurred in the upper Marble Canyon segment; the sand mass balance in the lower Marble Canyon segment was indeterminate. The 2018 sand erosion in Grand Canyon occurred in the eastern Grand Canyon and west-central Grand Canyon segments; the sand mass balance in the intervening east-central Grand Canyon segment was indeterminate.
As during sediment year 2018, sand also eroded from Marble Canyon during sediment year 2020 (July 1, 2019–June 30, 2020). This erosion occurred despite lower dam releases in sediment year 2020 because the sand inputs from the Paria River were negligible. However, because the sand input from the Little Colorado River was much larger than in sediment year 2018, sand did not erode from Grand Canyon during sediment year 2020 and the sand mass balance in Grand Canyon was indeterminate. The 2020 sand erosion in Marble Canyon was pervasive; sand was eroded from both the upper and lower Marble Canyon segments, although more erosion occurred in the upper Marble Canyon segment than in the lower Marble Canyon segment. The indeterminate sand mass balance in Grand Canyon during sediment year 2020 was caused by sand accumulation in the west-central Grand Canyon segment offsetting smaller amounts of sand erosion in the eastern Grand Canyon and east-central Grand Canyon segments.
References Cited
Dolan, R., Howard, A., and Gallenson, A., 1974, Man’s impact on the Colorado River in the Grand Canyon: American Scientist, v. 62, p. 392–401, accessed November 22, 2023, at https://www.jstor.org/stable/27844987.
East, A.E., Collins, B.D., Sankey, J.B., Corbett, S.C., Fairley, H.C., and Caster, J.J., 2016, Conditions and processes affecting sand resources at archeological sites in the Colorado River corridor below Glen Canyon Dam, Arizona: U.S. Geological Survey Professional Paper 1825, 104 p., https://doi.org/10.3133/pp1825.
Grams, P.E., Schmidt, J.C., Wright, S.A., Topping, D.J., Melis, T.S., and Rubin, D.M., 2015, Building sandbars in the Grand Canyon: EOS, Transactions of the American Geophysical Union, v. 96, no. 11, p. 12–16, https://doi.org/10.1029/2015EO030349.
Rubin, D.M., Topping, D.J., Schmidt, J.C., Hazel, J., Kaplinski, K., and Melis, T.S., 2002, Recent sediment studies refute Glen Canyon Dam hypothesis: EOS, Transactions of the American Geophysical Union, v. 83, no. 25, p. 273–278, https://doi.org/10.1029/2002EO000191.
Schmidt, J.C., 1990, Recirculating flow and sedimentation in the Colorado River in Grand Canyon, Arizona: Journal of Geology, v. 98, no. 5, p. 709–724, https://doi.org/10.1086/629435.
Schmidt, J.C., and Grams, P.E., 2011, Understanding physical processes of the Colorado River, in Melis, T.S., ed., Effects of three high-flow experiments on the Colorado River ecosystem downstream from Glen Canyon Dam, Arizona: U.S. Geological Survey Circular 1366, p. 17–52, https://doi.org/10.3133/cir1366.
Sibley, D., Topping, D. J., Hines, M., and Garner B., 2015, User-interactive sediment budgets in a browser—A web application for river science and management: Proceedings of the third Joint Federal Interagency Conference on Sedimentation and Hydrologic Modeling, April 19–23, 2015, Reno, Nevada, p. 595–605, accessed November 22, 2023, at https://acwi.gov/sos/pubs/3rdJFIC/Contents/4A-Sibley.pdf.
Topping, D.J., Grams, P.E., Griffiths, R.E., Dean D.J., Wright, S.A., and Unema, J.A., 2021, Self-limitation of sand storage in a bedrock-canyon river arising from the interaction of flow and grain size: Journal of Geophysical Research—Solid Earth, v. 126, no. 5, 37 p., https://doi.org/10.1029/2020JF005565.
Topping, D.J., Rubin, D.M., Nelson, J.M., Kinzel, P.J., III, and Corson, I.C., 2000b, Colorado River sediment transport—2. Systematic bed-elevation and grain-size effects of sand supply limitation: Water Resources Research, v. 36, no. 2, p. 543–570, https://doi.org/10.1029/1999WR900286.
Topping, D.J., Rubin, D.M., and Vierra, L.E.Jr., 2000a, Colorado River sediment transport—1. Natural sediment supply limitation and the influence of Glen Canyon Dam: Water Resources Research, v. 36, no. 2, p. 515–542, https://doi.org/10.1029/1999WR900285.
Topping, D.J., Schmidt, J.C., and Vierra, L.E., Jr., 2003, Computation and analysis of the instantaneous-discharge record for the Colorado River at Lees Ferry, Arizona—May 8, 1921, through September 30, 2000: U.S. Geological Survey Professional Paper 1677, 118 p., https://doi.org/10.3133/pp1677.
U.S. Department of the Interior, 1995, Operation of Glen Canyon Dam, Colorado River Storage Project, Arizona—Final Environmental Impact Statement: Salt Lake City, Utah, Bureau of Reclamation, Upper Colorado Region, 337 p., accessed November 22, 2023, at https://www.usbr.gov/uc/envdocs/eis/gc/gcdOpsFEIS.html.
U.S. Department of the Interior, 2016a, Glen Canyon Dam long-term experimental and management plan environmental impact statement: Salt Lake City, Utah, Bureau of Reclamation, Upper Colorado Region; Lakewood, Colo., National Park Service, Intermountain Region, 852 p., accessed November 22, 2023, at http://ltempeis.anl.gov/documents/final-eis/.
U.S. Department of the Interior, 2016b, Record of decision for the Glen Canyon Dam long-term experimental and management plan final environmental impact statement: Salt Lake City, Utah; Bureau of Reclamation, Upper Colorado Region; Lakewood, Colo., National Park Service, Intermountain Region, 22 p. plus appendixes, accessed November 22, 2023, at http://ltempeis.anl.gov/documents/docs/LTEMP_ROD.pdf.
U.S. Geological Survey, 2022, Grand Canyon Monitoring and Research Center—Discharge, sediment, and water quality monitoring: U.S. Geological Survey database, accessed September 1, 2022, at https://www.gcmrc.gov/discharge_qw_sediment.
Webb, R.H., Schmidt, J.C., Marzolf, G.R., and Valdez, R.A., eds., 1999, The controlled flood in Grand Canyon: American Geophysical Union Geophysical Monograph 110, 367 p., https://doi.org/10.1029/GM110.
Wright, S.A., and Kennedy, T.A., 2011, Science-based strategies for future high-flow experiments at Glen Canyon Dam, in Melis, T.S., ed., Effects of three high-flow experiments on the Colorado River ecosystem downstream from Glen Canyon Dam, Arizona: U.S. Geological Survey Circular 1366, p. 127–147, https://doi.org/10.3133/cir1366.
Moffett Field Publishing Service Center
Manuscript approved November 28, 2023
Edited by Alex Lyles
Illustration support by Kimber Petersen
Layout by Cory Hurd
Disclaimers
Any use of trade, firm, or product names is for descriptive purposes only and does not imply endorsement by the U.S. Government.
Although this information product, for the most part, is in the public domain, it also may contain copyrighted materials as noted in the text. Permission to reproduce copyrighted items must be secured from the copyright owner.
Suggested Citation
Griffiths, R.E., Topping, D.J., and Unema, J.A., 2024, Changes in sand storage in the Colorado River in Grand Canyon National Park from July 2017 through June 2020: U.S. Geological Survey Open-File Report 2023–1093, 9 p., https://doi.org/10.3133/ofr20231093.
ISSN: 2331-1258 (online)
Study Area
| Publication type | Report |
|---|---|
| Publication Subtype | USGS Numbered Series |
| Title | Changes in sand storage in the Colorado River in Grand Canyon National Park from July 2017 through June 2020 |
| Series title | Open-File Report |
| Series number | 2023-1093 |
| DOI | 10.3133/ofr20231093 |
| Publication Date | January 30, 2024 |
| Year Published | 2024 |
| Language | English |
| Publisher | U.S. Geological Survey |
| Publisher location | Reston, VA |
| Contributing office(s) | Arizona Water Science Center, Southwest Biological Science Center |
| Description | v, 9 p. |
| Country | United States |
| State | Arizona |
| Other Geospatial | Grand Canyon National Park |
| Online Only (Y/N) | Y |