

Non-Negligible Near-Term Risk of Extinction to the Eastern Migratory Population of Monarch Butterflies—An Updated Assessment (2006–22)
Links
- Document: Report (949 kB pdf) , HTML , XML
- Data Release: USGS data release - Eastern migratory monarch butterfly population estimates and associated early warning signals (2006–22)
- Download citation as: RIS | Dublin Core
Abstract
The eastern migratory population of monarch butterflies (Danaus plexippus) started declining as early as the mid-1970s and seemed to stop declining by the early 2000s; the population now (about 2022) persists at a much-reduced abundance. Stochastic variation in abundance, at levels typical of monarch butterflies and other insects, was assessed to determine whether this population is at heightened risk of quasi-extinction, a level of abundance below which recovery of the migratory behavior is uncertain. Using previously published Bayesian state-space modeling methods it was determined roughly equivalent risk of quasi-extinction as was reported in 2016 for the species (28.7 percent [1.9–81.0 credible interval] and 52.0 percent [3.2–97.7 credible interval] at the 10- and 20-year marks, respectively). Though highly uncertain, the risk is non-negligibly positive. Warning signal analysis indicates the current dynamic is dominated by stochastic variation, which seems to be heightening risk with the passage of time. Increasing breeding opportunities through restoration of milkweed in its northern breeding locations seems to be the most promising means of mitigating extinction risk for this species.
Introduction
The migratory population of monarch butterflies (Danaus plexippus) in eastern North America underwent a long period of decline from the mid-1970s to early 2000s (Zylstra and others, 2020) as habitat in the core of their breeding range deteriorated (Pleasants and Oberhauser, 2013; Pleasants and others, 2015; Zaya and others, 2017), leading to increased concerns regarding species imperilment (Semmens and others, 2016). Deterioration of breeding habitat, mainly through removal of the monarch’s larval host plant, milkweed (Asclepias spp.), is associated with the application of glyphosate to corn and soy (Pleasants and Oberhauser, 2013), which have been genetically modified to tolerate herbicide application (Stenoien and others, 2018). Adoption of herbicidally resistant corn and soy now exceeds 90 percent, turning what was once important habitat for monarchs into a nonhabitat matrix through which they must find comparatively sparser remnant milkweed.
Given that milkweed from corn and soy fields is nearly eradicated, continuing decline in population attributable to this threat should have abated about 2006–08 (Thogmartin and others, 2017c; Saunders and others, 2018; Pleasants and others, 2023). It seems the carrying capacity for monarch butterflies is now substantially lower (Pleasants, 2017) with monarch butterflies now varying stochastically between this new upper bound and some lower absorbing boundary. These upper and lower bounds act as basins of attraction (that is, alternative states or conditions leading to long-term behavior in population dynamics). The carrying capacity, or upper bound, has been estimated at 3.2 hectares (ha) of overwinter habitat occupied in central Mexico (Pleasants, 2017); this area estimate serves as a proxy to the species abundance (Thogmartin and others, 2017a). The lower bound is generally labeled an extinction basin and may exist at some level of population size above zero but below a level from which the population cannot resume growth (Semmens and others, 2016). We do not know what this lower-level abundance is, but it is almost certainly smaller than the smallest population size observed to date (2022), 0.67 ha (Rendón-Salinas and Tavera-Olonso, 2014). A population below this threshold level of abundance is identified as quasi-extinct (Semmens and others, 2016), and continental-scale migration of monarch butterflies is not expected to continue at this population size.
Semmens and others (2016) previously assessed extinction risk for the eastern migratory population of monarch butterflies, determining that risk at the 10-year mark was 42 percent (7–88 percent at the 95-percent credible interval [CI]) and at the 20-year mark was 62 percent (9–98 percent at the 95-percent CI). This study was completed before it was suspected monarch butterflies may have entered into a relatively stationary dynamic. Given this apparent abatement in the decline (Thogmartin and others, 2017c), re-assessing the risk faced by the population at its lower but perhaps stationary abundance is appropriate. At this stationary abundance, we can hypothesize that the current risk for the population derives principally from interannual variation in abundance relative to the population’s lowered abundance. The current risk faced by monarch butterflies during this current period of abundance (after 2006 to 2022) was calculated. This time series of abundance was examined for signs that the population may move from the current basin of attraction, as defined by the carrying capacity, to the extinction basin from which the population presumably cannot recover.
The use of generic early warning signals for detecting the proximity of a system moving from one stable state to another is increasingly common (Scheffer and others, 2009; Dakos and others, 2012; Dai and others, 2013). These studies indicate advanced warning can be revealed based on fluctuations in time series, such as temporal variation and autocorrelation. The predictive power of these leading indicators is, of course, limited by the need for long-term observations, which are lacking here. Nevertheless, skewness, kurtosis, autocorrelation, and variance were calculated to determine from these limited data any insight into possible slippage into extinction. If the population were “flickering” ahead of extinction, one would expect variance, autocorrelation, and skewness to increase over time.
Methods
A multivariate first-order auto-regressive state-space model (Holmes and Fagan, 2002; Holmes and others, 2012) described by Semmens and others (2016) was used to replicate their analytical approach. This Bayesian modeling approach permitted separation of observation and process error in these data to allow for generation of probabilistic extinction risk. Explicitly estimating observation and process error is needed to avoid unnecessarily inflating risk deriving from measurement error. Measurement error at the overwintering sites is non-negligible, originating primarily from difficulty in measuring the variable density of monarchs within each colony; published density estimates range greater than about an order of magnitude, from 6.9 to 60.9 million monarchs per hectare (Calvert, 2004; Brower and others, 2004, Thogmartin and others, 2017a). Process error can markedly affect extinction risk because environmental variability can cause populations to stochastically hit extinction thresholds well before a deterministic decline would indicate; this risk from environmentally induced variance, or stochasticity, in the species dynamics is particularly true for small populations (Dennis and others, 1991). Parsing observation error from process error avoids inappropriate amplification of risk from measurement error and allows estimation of risk solely from that relating to environmental stochasticity.
Population data used to inform the model included the annual area (in hectares) of forest occupied by overwintering colonies in Mexico (2006–22; Rendón-Salinas and others, 2023) and the annual number of butterflies counted in summer by the Illinois Butterfly Monitoring Network (2006–21; Illinois Butterfly Monitoring Network, 2022). Semmens and others (2016) used counts of eggs and larvae as reported by the Monarch Larva Monitoring Program to parse the observation process from the state process. The counts of adult monarchs in Illinois were used because they covered a greater range of years than the data available from the Monarch Larva Monitoring Program and were more highly correlated to the overwinter estimate of population size (correlation coefficient [r]=0.77, probability [p]<0.0001; Pleasants and others, 2023).
As in Semmens and others (2016), the log-scale population model takes the following standard form:
wherex
represents the state process (estimated log of the true size of the overwintering population in Mexico) across all years, t, for which we have data. The state process evolves from one year to the next according to a mean population growth rate, , and associated random yearly deviates to growth, wt, which was assumed to be normally distributed with a mean of 0 and a standard deviation q (process noise). Note that = λ, the average annual (nonlogged) population growth rate, where λ values of less than 1 result in population decline, whereas values of greater than 1 result in population growth; and
wt
is normally distributed with mean 0 and standard deviation q.
Values of vt follow a normal distribution with a mean of 0 and a standard deviation of q×p (measurement error), where q is the process noise and p is a proportion parameter. As in Semmens and others (2016), this parameterization was used based on the assumption that process noise in the time series is greater than the measurement error associated with the Mexican overwintering data. Process noise is typically the predominant form of variability in time series of insect populations (Fox and others, 2019).
Similarly, the log of annual estimates of Illinois adult monarch counts, ct, is assumed to deviate from the state, xt, by a, a scaling parameter shifting summer counts to the same scale as the overwintering habitat area index, and ft, where values of f are assumed to be normally distributed with a mean of 0 and a standard deviation of r (measurement error):
whereUsing code amended from Semmens and others (2016), this model was fit using R (version 4.2.2, R Core Team, 2023) and Just Another Gibbs Sampler (known as “JAGS;” Plummer, 2003) and checked convergence using the Brooks–Gelman–Rubin potential scale reduction factor where the coefficient of determination (R) is less than or equal to 1.05 was considered indicative of model convergence (Brooks and Gelman, 1998). To forestall concern that the chosen time series was biased by a high initial abundance and to assess the sensitivity of the extinction results, all analyses were repeated covering 2 fewer years (2008–22, n=15 years); results were indistinguishable in almost all cases and are, therefore, not reported. For example, extinction risk at year 10 was 0.287 (0.019–0.810 at the 95-percent CI) for the 17-year set versus 0.274 (0.014–0.853) for the 15-year set, with the difference a result of a slightly lower rate of decline (estimated annual rate of growth [λ]=0.95 [0.64–1.42]) for the shorter set. Stationarity in the time series was tested for with Kwiatkowski–Phillips–Schmidt–Shin (KPSS) and Dickey-Fuller tests.
Because of the limited data, metric-based early warning signals relating to autocorrelation, standard deviation, skewness, and kurtosis were calculated (Dakos and others, 2012). To examine the robustness of these warnings, varying degrees of smoothing were examined (3, 5, and 7 years). Data and analysis code are available at Thogmartin (2023).
Results
Mean population size of the eastern migratory population of monarch butterflies was 3.16 ha between 2006 and 2022 (standard deviation [SD]=1.73), declining 67.8 percent from 6.87 to 2.21 ha (fig. 1; 52.1-percent decline in 2007–22; 56.3-percent decline in 2008–22).
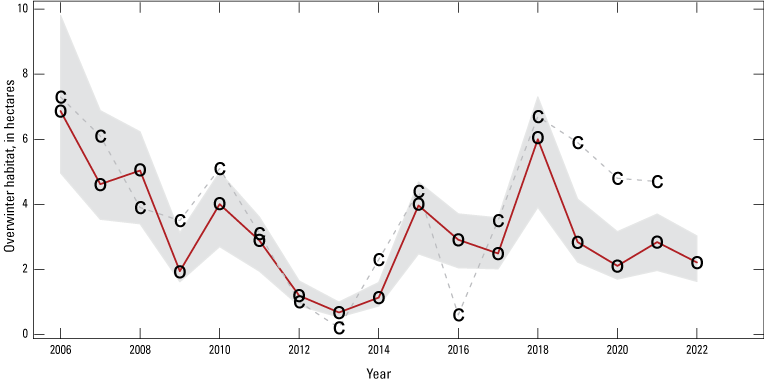
Model estimated annual overwintering population size (median of posterior estimates; red line) with 95-percent credible intervals (gray shaded area). The o symbols define overwintering habitat area data from Mexico, whereas the c symbols represent counts of adult monarch butterflies in Illinois scaled to match the magnitude of the overwintering data.
The estimated annual rate of growth (λ) for 2006–22 was 0.93 (0.67–1.30; hereafter, median and 95-percent CI; fig. 2). About two-thirds (68.3 percent) of the posterior distribution fell below λ=1 (fig. 2), indicating about 2:1 odds in favor of there being a declining population. Tests for stationarity indicated a similar degree of uncertainty in trend with the KPSS test indicating stationarity (H0=time series is stationary; KPSS trend=0.1202, p=0.098) and an augmented Dickey-Fuller test indicating non-stationarity (H0=time series is non-stationary; Dickey-Fuller=−2.12, p=0.526).
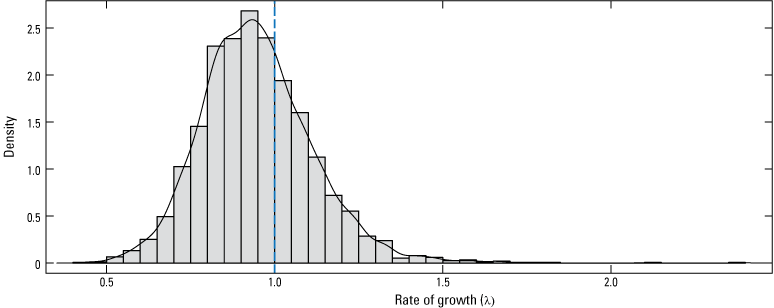
Posterior likelihood distribution for the estimated annual rate of growth in the monarch population. The vertical dashed line identifies the rate of growth that would result in no growth or decline from year to year (λ=1); the solid line is a probability density function fitted to the annual growth rates. λ values greater than 1 result in population growth, whereas values less than 1 result in decline.
Autocorrelation in the time series was relatively low (fig. 3, left panel), indicating a rather moderate return toward equilibrium with each move away. However, relating patterns in annual change to population size indicated that most decreases in abundance from one year to the next occurred when the population size was less than 3 ha (9 of 10 decreases), whereas most increases (4 of 6) occurred when the population size was greater than or equal to 4 ha.
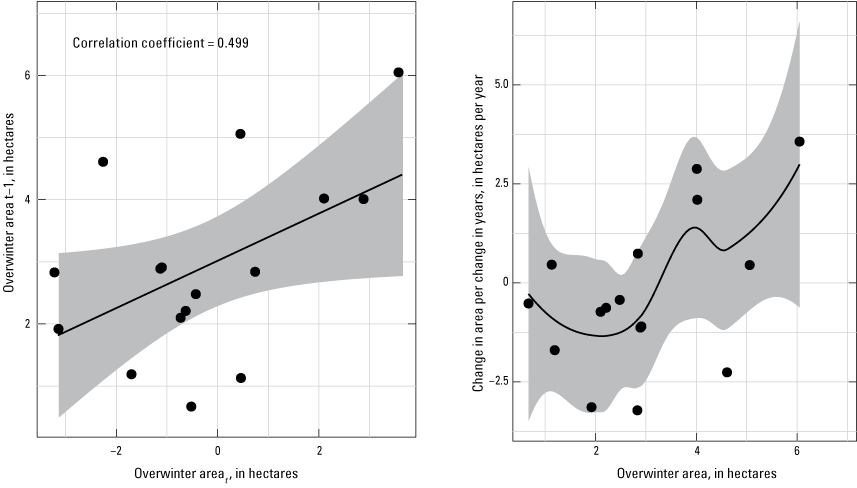
Autocorrelation of annual area occupied by monarch butterflies wintering in Mexico (left panel) and annual change in overwinter area as a function of population size (right panel), in t years. Black lines are the linear (left panel) and loess (right panel) fit to the data (black points), with 95% confidence intervals in gray.
Process noise (in units of standard deviation) was estimated at 0.43 SD (0.22–1.02 CI) and overwintering habitat area observation error at 0.18 SD (0.01–0.47 CI). The estimated probability of extinction over 10- and 20-year periods based on an extinction threshold of 0.25 ha was 28.7 percent (1.9–81.0 CI) and 52.0 percent (3.2–97.7 CI), respectively (fig. 4); note, however, the wide uncertainty, reflecting uncertainty in the estimate of trend.
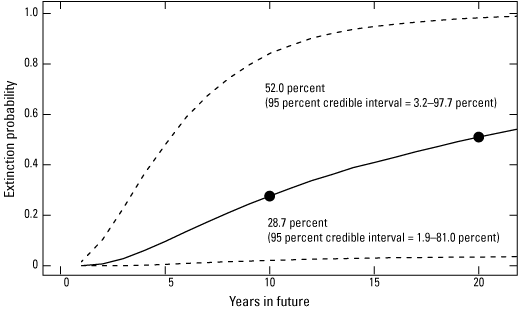
Extinction risk (mean as black line, with 95% confidence limits as dashed lines) for the eastern migratory population of monarch butterflies estimated for 2023–42. The 10- and 20-year estimates are highlighted (year 0 = winter 2022-23).
In contradiction to the hypothesis of an impending state change, autocorrelation declined over the period (Kendall τ7 year=−0.6), whereas skewness (Kendall τ7 year=0.644) and kurtosis (Kendall τ7 year=0.778) increased, in comportment with the hypothesis (fig. 5). Warning signals at finer degrees of smoothing (3 and 5 years) were similar but generally of a lower magnitude than the coarsest smoothing. Variance as measured by standard deviation provided contradictory evidence across the levels of smoothing.
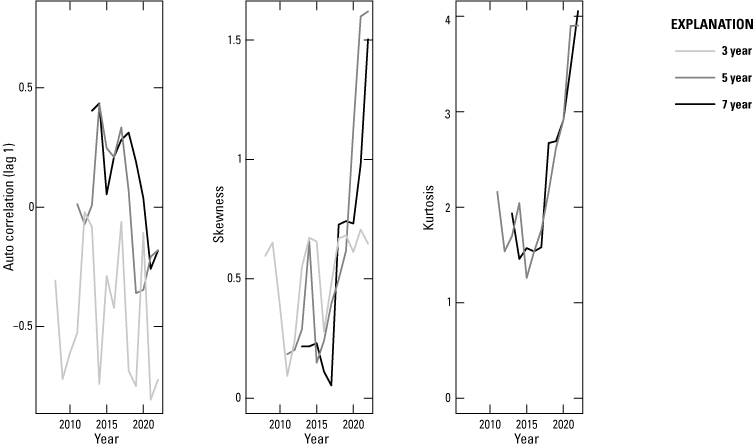
Lag-1 autocorrelation, skewness, and kurtosis for smoothed times series of 7 (black), 5 (dark gray), and 3 (light gray) years of monarch overwinter population size (as measured in hectares occupied in Mexico). Note: there were too few years to estimate kurtosis for the shortest interval.
Discussion
Populations can proceed to extinction in many ways. For small populations, irregular and unpredictable perturbations become increasingly important in determining a population’s risk to extinction (Shaffer, 1987; Lande, 1993; Fagan and Holmes, 2006). At low abundance, risk from annual fluctuations in abundance may accumulate, even if the trend in underlying abundance is nonnegative. So too for the eastern migratory population of monarch butterflies. At its reduced abundance, risk for this species accumulates year over year so that by year 20 (about 2042) there is a predicted 50+ percent probability of dropping below a putative extinction threshold of 0.25 ha. Much of this risk comes from the stochastic nature of its population dynamics. Other early warning signals of impending extinction provide a mixed picture; autocorrelation in abundance seems to be declining with time, whereas skewness and kurtosis (measures of extremes) are increasing. Together these metrics indicate a system increasingly dominated by stochastic variation, heightening risk (Fagan and Holmes, 2006; Melbourne and Hastings, 2008; refer to Appendix 1).
Mean population size for 2006–22 was 3.16 ha, in accordance with the carrying capacity estimated by Pleasants (2017). The λ2006–2022 of 0.93 (0.67–1.30) is indistinguishable from that reported by Semmens and others (2016) for the 1993–2014 period (λ1993–2014=0.94, 0.69–1.30 CI). Process error was similar among periods, q–σ2006–2022=0.43 versus q–σ1993–2014=0.49; measurement error, however, was nearly half that (m–σ2006–2022=0.18, from surveys of adult butterflies, versus m–σ1993–2014=0.44, from egg production data). Median estimates of extinction risk at 10- and 20-years for a quasi-extinction threshold of 0.25 ha were slightly lower for 2006–22 (0.29 and 0.52, respectively) compared to those reported by Semmens and others (2016) for 1993–2014 (0.42 and 0.62, respectively); uncertainty in risk, however, was large in both periods, precluding differentiation.
Perhaps the most concerning observation is that small populations (less than 3 ha) more frequently continued their decrease whereas most increases in abundance only came about when the monarch butterfly population was larger (greater than or equal to 4 ha). Decreasing abundance when the population is particularly small may signal the pull of the extinction vortex (Gilpin and Soulé, 1986) via Allee effects (Courchamp and others, 1999), perhaps by lowering mating success (Kuussaari and others, 1998) or delaying migration to breeding grounds (Edwards and others, 2021).
These analyses are, however, based on a time series of only 17 years. A series of years longer than 17 would have included years in which the monarch butterfly population was still declining from milkweed eradication in row crops. Shorter series would have made risk assessment increasingly difficult (Foley, 1994; Lotts and others, 2004; Fox and others, 2019). Based on these limited data, though, it is reasonable to conclude the eastern migratory population of monarch butterflies remains at substantial near-term risk of dropping below quasi-extinction thresholds from which the possibility of recovery is uncertain.
Risk to this comparatively small population would be mitigated by either an increase in abundance or diminishment of the stochastic variation experienced by the species. Considerable evidence associates the annual variation in monarch butterfly abundance to weather (Thogmartin and others, 2017c; Saunders and others, 2018), a stressor that is likely irreducible given current management tools. Thus, the most promising means of mitigating risk is increasing population size (Semmens and others, 2016), principally through restoration of milkweed to regions where it has been eradicated by herbicidal application to corn and soy agriculture (Pleasants, 2017; Thogmartin and others, 2017b; Solis-Sosa and others, 2021). Strategies are in place for exactly this purpose (Midwest Association of Fish and Wildlife Agencies, 2023), largely focused on milkweed restoration on private agriculture and conservation lands (Janke and others, 2021; Thakur and Hurley, 2023), protected natural lands (Kurzejeski and others, 2020; Lukens and others, 2020), transportation and utility rights of way (Kasten and others, 2016), and urban and developed lands (Johnston and others, 2019). Restoring milkweed provides monarch butterflies the breeding substrate it requires to loosen the grip of stochastic variation as it grows away from the absorbing boundary of extinction.
Acknowledgments
Comments from R. Grundel and W. Janousek, U.S. Geological Survey, on an earlier version of this manuscript are appreciated.
References Cited
Brooks, S.P., and Gelman, A., 1998, General methods for monitoring convergence of iterative simulations: Journal of Computational and Graphical Statistics, v. 7, no. 4, p. 434–455. [Also available at https://doi.org/10.1080/10618600.1998.10474787.]
Brower, L.P., Kust, D.R., Rendón-Salinas, E., García-Serrano, E., Kust, K.R., Miller, J., Fernandez del Rey, C., and Pape, K., 2004, Catastrophic winter storm mortality of monarch butterflies in Mexico during January 2002, in Oberhauser, K.S., and Solensky, M.J., eds., The monarch butterfly—Biology and conservation: Ithaca, New York, Cornell University Press, p. 151–166.
Courchamp, F., Clutton-Brock, T., and Grenfell, B., 1999, Inverse density dependence and the Allee effect: Trends in Ecology & Evolution, v. 14, no. 10, p. 405–410. [Also available at https://doi.org/10.1016/S0169-5347(99)01683-3.]
Dai, L., Korolev, K.S., and Gore, J., 2013, Slower recovery in space before collapse of connected populations: Nature, v. 496, no. 7445, p. 355–358. [Also available at https://doi.org/10.1038/nature12071.]
Dakos, V., Carpenter, S.R., Brock, W.A., Ellison, A.M., Guttal, V., Ives, A.R., Kéfi, S., Livina, V., Seekell, D.A., van Nes, E.H., and Scheffer, M., 2012, Methods for detecting early warnings of critical transitions in time series illustrated using simulated ecological data: PLoS One, v. 7, no. 7, article e41010, 20 p., accessed April 1, 2023, at https://doi.org/10.1371/journal.pone.0041010.
Dennis, B., Munholland, P.L., and Scott, J.M., 1991, Estimation of growth and extinction parameters for endangered species: Ecological Monographs, v. 61, no. 2, p. 115–143. [Also available at https://doi.org/10.2307/1943004.]
Edwards, C., Schultz, C., and Crone, E., 2021, Rapid decline in Western monarch butterflies leads to phenological and geographic Allee effects: bioRxiv, preprint posted December 21, 2021, 18 p., accessed April 1, 2023, at https://doi.org/10.1101/2021.10.22.465529.
Fagan, W.F., and Holmes, E.E., 2006, Quantifying the extinction vortex: Ecology Letters, v. 9, no. 1, p. 51–60. [Also available at https://doi.org/10.1111/j.1461-0248.2005.00845.x.]
Foley, P., 1994, Predicting extinction times from environmental stochasticity and carrying capacity: Conservation Biology, v. 8, no. 1, p. 124–137. [Also available at https://doi.org/10.1046/j.1523-1739.1994.08010124.x.]
Fox, R., Harrower, C.A., Bell, J.R., Shortall, C.R., Middlebrook, I., and Wilson, R.J., 2019, Insect population trends and the IUCN Red List process: Journal of Insect Conservation, v. 23, no. 2, p. 269–278. [Also available at https://doi.org/10.1007/s10841-018-0117-1.]
Holmes, E.E., and Fagan, W.F., 2002, Validating population viability analysis for corrupted data sets: Ecology, v. 83, no. 9, p. 2379–2386. [Also available at https://doi.org/10.1890/0012-9658(2002)083[2379:VPVAFC]2.0.CO;2.]
Holmes, E.E., Ward, E.J., and Wills, K., 2012, MARSS—Multivariate autoregressive state-space models for analyzing time-series data: The R Journal, v. 4, no. 1, p. 11–19, accessed September 5, 2022, at https://doi.org/10.32614/RJ-2012-002.
Illinois Butterfly Monitoring Network, 2022, Illinois Butterfly Monitoring Network: Illinois Butterfly Monitoring Network web page, accessed September 5, 2022, at https://ibmn.org/.
Janke, A.K., Tyndall, J.C., and Bradbury, S.P., 2021, Financial analysis of converting rural lawns to pollinator habitat in the Corn Belt: Journal of Fish and Wildlife Management, v. 12, no. 1, p. 151–162. [Also available at https://doi.org/10.3996/JFWM-20-075.]
Johnston, M.K., Hasle, E.M., Klinger, K.R., Lambruschi, M.P., Lewis, A.D., Stotz, D.F., Winter, A.M., Bouman, M.J., and Redlinski, I., 2019, Estimating milkweed abundance in metropolitan areas under existing and user-defined scenarios: Frontiers in Ecology and Evolution, v. 7, article 210, 22 p., accessed April 1, 2023, at https://doi.org/10.3389/fevo.2019.00210.
Kasten, K., Stenoien, C., Caldwell, W., and Oberhauser, K.S., 2016, Can roadside habitat lead monarchs on a route to recovery?: Journal of Insect Conservation, v. 20, no. 6, p. 1047–1057. [Also available at https://doi.org/10.1007/s10841-016-9938-y.]
Kurzejeski, E.W., Vangilder, L.D., Saltsgaver, N.L., and Hanks, W.A., 2020, Milkweed establishment in restored central Missouri prairie: Wildlife Society Bulletin, v. 44, no. 3, p. 564–569. [Also available at https://doi.org/10.1002/wsb.1109.]
Kuussaari, M., Saccheri, I., Camara, M., and Hanski, I., 1998, Allee effect and population dynamics in the Glanville fritillary butterfly: Oikos, v. 82, no. 2, p. 384–392. [Also available at https://doi.org/10.2307/3546980.]
Lande, R., 1993, Risks of population extinction from demographic and environmental stochasticity and random catastrophes: American Naturalist, v. 142, no. 6, p. 911–927. [Also available at https://doi.org/10.1086/285580.]
Lotts, K.C., Waite, T.A., and Vucetich, J.A., 2004, Reliability of absolute and relative predictions of population persistence based on time series: Conservation Biology, v. 18, no. 5, p. 1224–1232. [Also available at https://doi.org/10.1111/j.1523-1739.2004.00285.x.]
Lukens, L., Kasten, K., Stenoien, C., Cariveau, A., Caldwell, W., and Oberhauser, K., 2020, Monarch habitat in conservation lands: Frontiers in Ecology and Evolution, v. 8, article 13, 13 p., accessed April 1, 2023, at https://doi.org/10.3389/fevo.2020.00013.
Melbourne, B.A., and Hastings, A., 2008, Extinction risk depends strongly on factors contributing to stochasticity: Nature, v. 454, no. 7200, p. 100–103. [Also available at https://doi.org/10.1038/nature06922.]
Midwest Association of Fish and Wildlife Agencies, 2023, 2023 update to the Mid-America Monarch Conservation Strategy, 2018–2038, version 2.0: Midwest Association of Fish and Wildlife Agencies web page, accessed April 1, 2023, at http://www.mafwa.org/wp-content/uploads/2023/07/2023UpdateToTheMidAmericaMonarchConservationStrategy.pdf.
Pleasants, J., 2017, Milkweed restoration in the Midwest for monarch butterfly recovery—Estimates of milkweeds lost, milkweeds remaining and milkweeds that must be added to increase the monarch population: Insect Conservation and Diversity, v. 10, no. 1, p. 42–53. [Also available at https://doi.org/10.1111/icad.12198.]
Pleasants, J.M., and Oberhauser, K.S., 2013, Milkweed loss in agricultural fields because of herbicide use—Effect on the monarch butterfly population: Insect Conservation and Diversity, v. 6, no. 2, p. 135–144. [Also available at https://doi.org/10.1111/j.1752-4598.2012.00196.x.]
Pleasants, J., Thogmartin, W.E., Oberhauser, K.S., Taylor, O.R., and Stenoien, C., 2023, A comparison of summer, fall and winter estimates of monarch population size before and after milkweed eradication from crop fields in North America: Insect Conservation and Diversity, 14 p., accessed April 1, 2023, at https://doi.org/10.1111/icad.12687.
R Core Team, 2023, R—A language and environment for statistical computing: Vienna, Austria, R Foundation for Statistical Computing, accessed April 1, 2023, at https://www.r-project.org/.
Rendón-Salinas, E., Fernández-Islas, A., Mendoza-Pérez, M.A., Cruz-Piña, M., Mondragón-Contreras, G., and Martínez-Pacheco, A., 2023, Area of forest occupied by the colonies of monarch butterflies in Mexico during the 2022–2023 overwintering period: Monarch Butterfly Fund, 4 p., accessed April 1, 2023, at https://monarchconservation.org/wp-content/uploads/2023/03/WWF-Monarch-Butterfly-Report-2022-2023-Final.pdf.
Rendón-Salinas, E., and Tavera-Olonso, G., 2014, Forest surface occupied by monarch butterfly hibernation colonies in December 2013: World Wildlife Fund-Mexico, 4 p., accessed February 18, 2020, at https://www.worldwildlife.org/publications/forest-surface-occupied-by-monarch-butterfly-hibernation-colonies-in-december-2013.
Saunders, S.P., Ries, L., Oberhauser, K.S., Thogmartin, W.E., and Zipkin, E.F., 2018, Local and cross-seasonal associations of climate and land use with abundance of monarch butterflies Danaus plexippus: Ecography, v. 41, no. 2, p. 278–290. [Also available at https://doi.org/10.1111/ecog.02719.]
Scheffer, M., Bascompte, J., Brock, W.A., Brovkin, V., Carpenter, S.R., Dakos, V., Held, H., van Nes, E.H., Rietkerk, M., and Sugihara, G., 2009, Early-warning signals for critical transitions: Nature, v. 461, no. 7260, p. 53–59. [Also available at https://doi.org/10.1038/nature08227.]
Semmens, B.X., Semmens, D.J., Thogmartin, W.E., Wiederholt, R., López-Hoffman, L., Diffendorfer, J.E., Pleasants, J.M., Oberhauser, K.S., and Taylor, O.R., 2016, Quasi-extinction risk and population targets for the Eastern, migratory population of monarch butterflies (Danaus plexippus): Scientific Reports, v. 6, no. 1, article 23265, 7 p., accessed April 1, 2023, at https://doi.org/10.1038/srep23265.
Solis-Sosa, R., Mooers, A.Ø., Larrivée, M., Cox, S., and Semeniuk, C.A.D., 2021, A landscape-level assessment of restoration resource allocation for the eastern monarch butterfly: Frontiers in Environmental Science, v. 9, article 634096, 19 p., accessed April 1, 2023, at https://doi.org/10.3389/fenvs.2021.634096.
Stenoien, C., Nail, K.R., Zalucki, J.M., Parry, H., Oberhauser, K.S., and Zalucki, M.P., 2018, Monarchs in decline—A collateral landscape‐level effect of modern agriculture: Insect Science, v. 25, no. 4, p. 528–541. [Also available at https://doi.org/10.1111/1744-7917.12404.]
Thakur, T., and Hurley, T., 2023, Do farmers need to be paid to grow milkweed for monarchs or will they volunteer if it is easy enough?: Applied Economic Perspectives and Policy, v. 45, no. 2, p. 1008–1024. [Also available at https://doi.org/10.1002/aepp.13290.]
Thogmartin, W.E., 2023, Eastern migratory monarch butterfly population estimates and associated early warning signals (2006–22): U.S. Geological Survey data release, https://doi.org/10.5066/P9WRARO7.
Thogmartin, W.E., Diffendorfer, J.E., López-Hoffman, L., Oberhauser, K., Pleasants, J., Semmens, B.X., Semmens, D., Taylor, O.R., and Wiederholt, R., 2017a, Density estimates of monarch butterflies overwintering in central Mexico: PeerJ, v. 5, article e3221, 18 p., accessed April 1, 2023, at https://doi.org/10.7717/peerj.3221.
Thogmartin, W.E., López-Hoffman, L., Rohweder, J., Diffendorfer, J., Drum, R., Semmens, D., Black, S., Caldwell, I., Cotter, D., Drobney, P., Jackson, L.L., Gale, M., Helmers, D., Hilburger, S., Howard, E., Oberhauser, K., Pleasants, J., Semmens, B., Taylor, O., Ward, P., Weltzin, J., and Wiederholt, R., 2017b, Restoring monarch butterfly habitat in the Midwestern US—“All hands on deck”: Environmental Research Letters, v. 12, no. 7, article 074005, 10 p., accessed April 1, 2023, at https://doi.org/10.1088/1748-9326/aa7637.
Thogmartin, W.E., Wiederholt, R., Oberhauser, K., Drum, R.G., Diffendorfer, J.E., Altizer, S., Taylor, O.R., Pleasants, J., Semmens, D., Semmens, B., Erickson, R., Libby, K., and López-Hoffman, L., 2017c, Monarch butterfly population decline in North America—Identifying the threatening processes: Royal Society Open Science, v. 4, no. 9, article 170760, 16 p., accessed April 1, 2023, at https://doi.org/10.1098/rsos.170760.
Zaya, D.N., Pearse, I.S., and Spyreas, G., 2017, Long-term trends in midwestern milkweed abundances and their relevance to monarch butterfly declines: BioScience, v. 67, no. 4, p. 343–356. [Also available at https://doi.org/10.1093/biosci/biw186.]
Zylstra, E.R., Thogmartin, W.E., Ramírez, M.I., and Zipkin, E.F., 2020, Summary of available data from the monarch overwintering colonies in central Mexico, 1976–1991: U.S. Geological Survey Open-File Report 2020–1150, 10 p., accessed April 1, 2023, at https://doi.org/10.3133/ofr20201150.
Appendix 1
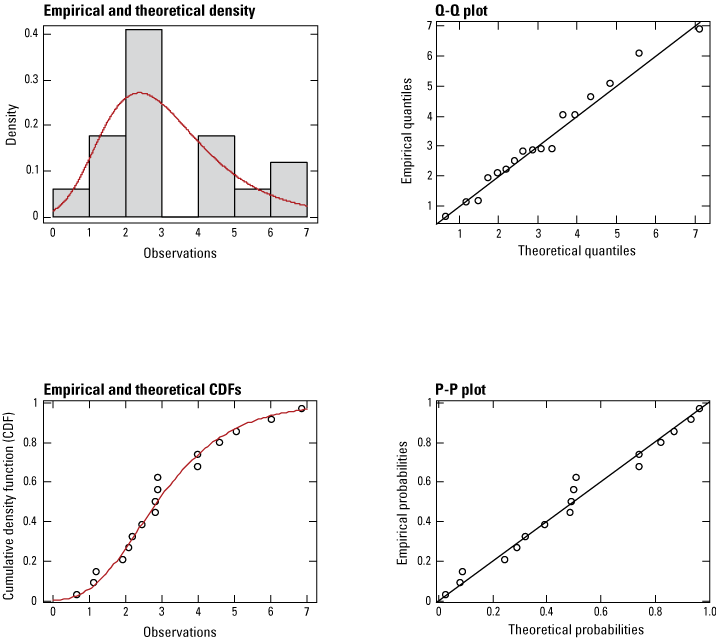
Goodness of fit assessment of monarch butterfly time series of abundance, for 2006–22, as measured at overwintering areas in Mexico. Red lines depict theoretical fit to the empirical densities (gray bars in the top-left panel, open circles in the bottom-left panel). [CDF, cumulative density function, Q-Q, quantile-quantile, P-P, probability-probability]
For more information about this publication, contact:
Director, USGS Upper Midwest Environmental Sciences Center
2630 Fanta Reed Road
La Crosse, Wisconsin 54603
For additional information, visit: https://www.usgs.gov/centers/upper-midwest-environmental-sciences-center
Publishing support provided by the
Rolla Publishing Service Center
Disclaimers
Any use of trade, firm, or product names is for descriptive purposes only and does not imply endorsement by the U.S. Government.
Although this information product, for the most part, is in the public domain, it also may contain copyrighted materials as noted in the text. Permission to reproduce copyrighted items must be secured from the copyright owner.
Suggested Citation
Thogmartin, W.E., 2024, Non-negligible near-term risk of extinction to the eastern migratory population of monarch butterflies—An updated assessment (2006–22): U.S. Geological Survey Open-File Report 2023–1097, 10 p., https://doi.org/10.3133/ofr20231097.
ISSN: 2331-1258 (online)
| Publication type | Report |
|---|---|
| Publication Subtype | USGS Numbered Series |
| Title | Non-negligible near-term risk of extinction to the eastern migratory population of monarch butterflies—An updated assessment (2006–22) |
| Series title | Open-File Report |
| Series number | 2023-1097 |
| DOI | 10.3133/ofr20231097 |
| Publication Date | January 03, 2024 |
| Year Published | 2024 |
| Language | English |
| Publisher | U.S. Geological Survey |
| Publisher location | Reston, VA |
| Contributing office(s) | Upper Midwest Environmental Sciences Center |
| Description | Report: iii, 10 p.; Data Release |
| Online Only (Y/N) | Y |
| Additional Online Files (Y/N) | N |