

Developing and Implementing an International Macroseismic Scale (IMS) for Earthquake Engineering, Earthquake Science, and Rapid Damage Assessment
Links
- Document: Report (7.28 MB pdf) , HTML , XML
- Download citation as: RIS | Dublin Core
Acknowledgments
This work was performed as a part of the International Macroseismic Working Group, which, in addition to the authors, is made up of the participants of the workshop: G. Beattie, A. Charleson, J. Dewey, G. Grünthal, J. M. Ingham, K. Jaiswal, S. Lin, S. McGowan, R. Musson, A. Pomonis, K. Porter, V. Quitoriano, R. Spence, L. Salditch, J. Schwarz, E. So, and T. Wenk. The International Macroseismic Working Group was supported by the John Wesley Powell Center for Analysis and Synthesis in Fort Collins, Colorado, and funded by the U.S. Geological Survey. We thank Dr. Jill Barnes and Demi Bingham of the Powell Center for their guidance and logistical support. Additional thanks go to Dr. Gavin Hayes, Senior Science Advisor of the U.S. Geological Survey, for his support for this workshop and to the U.S. Geological Survey Earthquake Hazards Program External Grants Program for funding parallel research and development by the Applied Technology Council (ATC) and GNS Science in New Zealand under the auspices of the ATC–158 project. T. Goded and S. Lin have been partly funded by the GNS Science Hazards and Risk Management Strategic Science Investment Fund Programme Project 1.6: “Built Environment and Performance” project. Parts of the text for this report were adopted from a proceedings paper that was presented at the Third European Conference on Earthquake Engineering and Seismology (3ECEES) in 2022 in Bucharest, Romania (Wald, Worden, and others, 2022).
Executive Summary
Macroseismic observations and analysis connect our collective seismological past with the present and the present to the future by facilitating hazard estimates and communicating the effects of ground shaking to a wide variety of audiences across the ages. Invaluable ground shaking and building damage information is gained through standardized, systematic approaches for assigning intensities and, importantly, sharing and archiving those assignments in a reproducible form. The applications for these assignments are far reaching. Traditional macroseismic surveys provide vital constraints on critical aspects of earthquakes and their effects on society, whereas internet-based macroseismic datasets are extremely valuable for real-time earthquake situational awareness, and they contribute to later engineering loss and risk analyses. These important applications of macroseismic observations would be helped by revisiting traditional macroseismic surveys for modern environments, standardizing internet-based collection strategies, and ensuring compatibility between traditional and internet-based approaches of macroseismic data collection.
Even with best practices, we have identified several limitations with modern macroseismic data collection approaches, particularly from the U.S. Geological Survey's perspective. First, whereas crowdsourced, internet-based intensities such as “Did You Feel It?” are robust and definitive for lower intensities, they are poorly defined above intensity VII, where damage observations may require expert knowledge of each building’s structural system.
Second, in the United States, we use the Modified Mercalli Intensity (MMI) Scale, which is consistent with—yet inferior to—the more recently developed European Macroseismic Scale (EMS–98; Grünthal and others, 1998). Similarly, New Zealand uses the New Zealand MMI Scale (Dowrick and others, 2008), which lacks detail on how to assign intensities above MMI VIII. The EMS–98 fundamentally advanced the science of macroseismic intensity assignment by requiring quantitative assessments at each location through consistent application on statistical ranges of well-defined damage grades to building-specific vulnerability classes. Lastly, the United States and New Zealand no longer have professionals dedicated to conducting traditional macroseismic field surveys, so a strategy is needed for allowing postearthquake building inspectors and insurance loss assessors to contribute to intensity assignments.
The goals of our International Macroseismic Scale workshop were thus twofold. First, harmonize the MMI Scale with EMS–98 for the United States and New Zealand—which share several similar building types—by considering those structures and associated damage grades that are not well represented in the current EMS–98 building vulnerability class table. Second, begin to formalize the process of augmenting EMS–98 with new regional building classes and damage grades toward the development of a macroseismic scale that can be used globally, beyond the United States and New Zealand. Such an effort necessarily requires reviewing and expanding the original EMS–98 explanatory documents and consideration of any required revisions. We can build on the shoulders of giants in that a few of the original EMS–98 developers and experts participated in and were integral to our workshop. Their background and guidance were key in moving forward toward an international scale.
We agreed that additional building vulnerability classes, damage grades, and written and pictorial descriptions are necessary and ideally accompanied by a detailed paper trail for other nations to follow. If we can improve the macroseismic assignment process in both nations, we can also aim to refine the process of collecting postearthquake impact data, a boon to many engineering and financial concerns.
The benefits of a truly International Macroseismic Scale are considerable for both the engineering and seismology communities. A modern macroseismic scale requires more deliberate archival damage data collection, motivating more consistent and accessible postevent datasets that would have applications beyond the specific event. Applying field-collected building damage data toward macroseismic assignments would allow for increased coordination between engineering reconnaissance teams and local inspectors in collecting such data for official purposes. In addition, rapid and consistent intensity assignments globally would enable more accurate ShakeMaps—and thus improved earthquake engineering and geotechnical forensics, loss and risk estimates, and correlations between macroseismic intensity and ground motion parameters.
A brief summary of the Powell Center IMS workshop was published by Wald and others (2023) in the magazine Eos. This Open-File Report describes the workshop, its discussions, and its outcomes in detail. In summarizing the workshop, we have added important background material and reflections for proper context.
Background
Macroseismic intensity—quantifying the ground shaking levels of an earthquake based on human response and effects on the built environment—has been fundamental to earthquake science from its very beginning. Since 1783 (Sarconi, 1784), macroseismic observations and intensity scales have facilitated documentation of earthquake effects (for a summary of such scales, refer to Musson and Cecić [2002] and Musson and others [2010]). In turn, these data have been heavily used to constrain earthquake locations and magnitudes (and thus, hazard maps), facilitate communication of earthquake shaking and impacts, and allow engineers to relate building damage to shaking levels. In fact, we owe much of what we have learned about the behavior of buildings around the world to carefully collected building damage data, most often collected and archived with the goal of assigning macroseismic intensities in mind. That seismologists today have more sophisticated damage data collection strategies than their predecessors does not obviate the need for carrying out this important macroseismic tradition and process, as we discuss later.
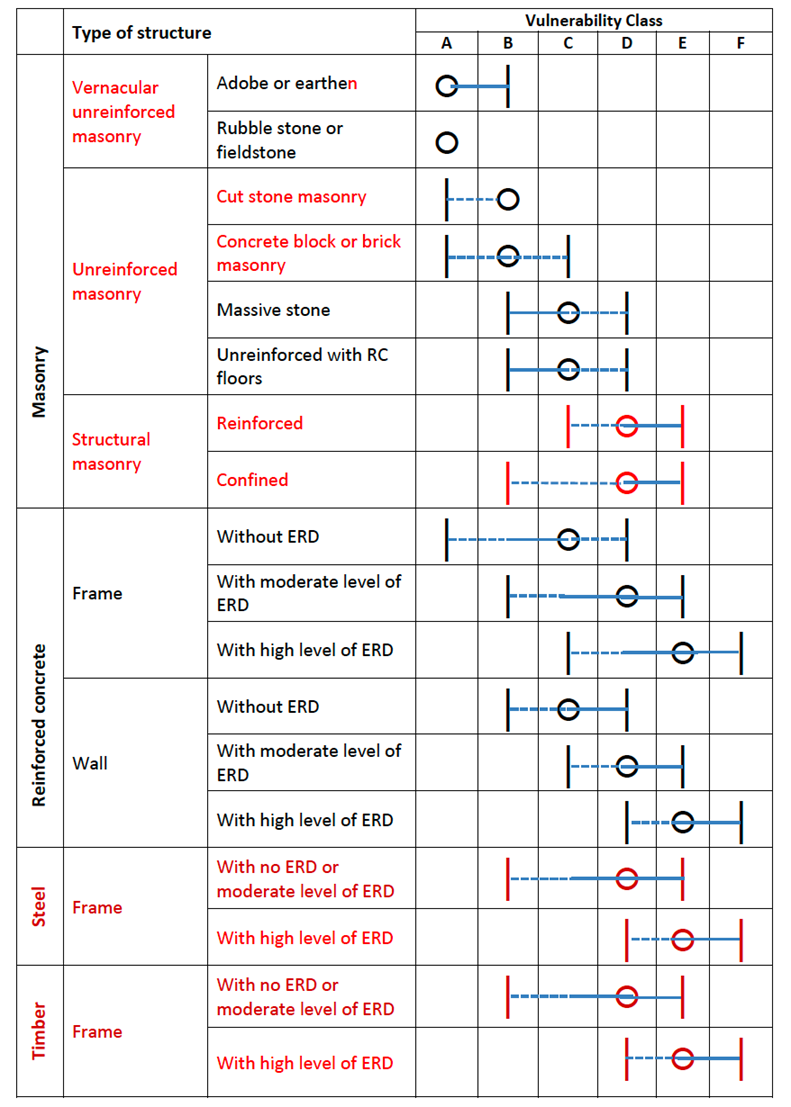
Intensity scales themselves have evolved in their regional applicability, their rigor, and the sophistication with which intensity assignments are made. The evolution of the scales effectively plateaued with the widely used European Macroseismic Scale (EMS–98; Grünthal and others, 1998). The EMS–98 fundamentally advanced the art and science of intensity assignment by requiring quantitative assessments at each location, using a consistent application of statistical ranges of well-defined damage grades to specific building vulnerability classes (building types; fig. 1A–B). And, whereas macroseismic intensity has long been connected to building practices and earthquake engineering, EMS–98 further cemented the earlier art of macroseismology to structural vulnerability analyses by improving the rigor of the assignments with careful definition of damage grades for well-described building structural systems. Such vulnerability assessments are now essential for earthquake shaking-based loss and risk estimation.
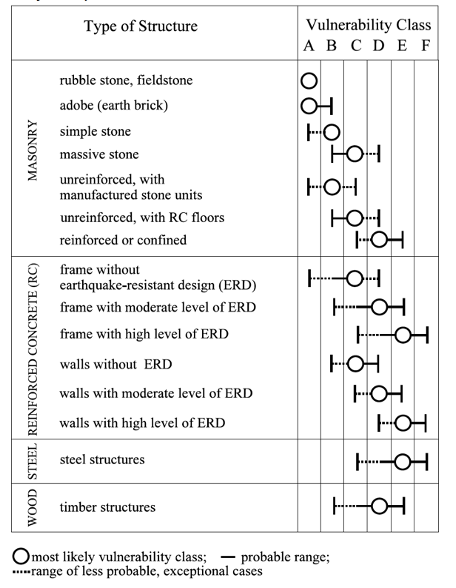
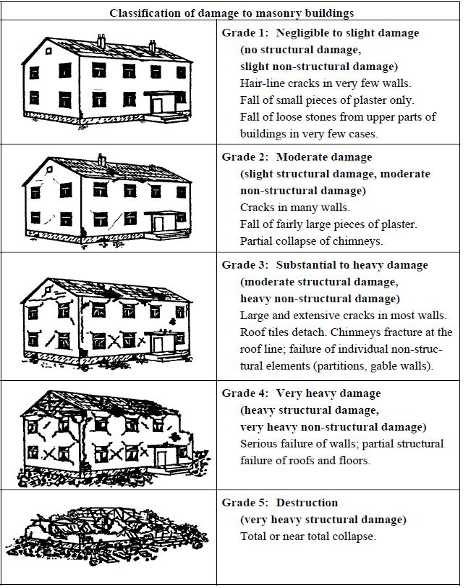
A, European Macroseismic Scale of 1998 vulnerability table—differentiation of structures (buildings) into vulnerability classes; B, classification of damage to masonry buildings (from Grünthal and others, 1998; used with permission).
Around the same time that EMS–98 was introduced, the rapid evolution of internet-based intensity reporting came online following Dengler and Dewey (1998) and Wald and others (1999). The U.S. Geological Survey’s (USGS) “Did You Feel It?” (DYFI; fig. 2) and its Italian counterpart Istituto Nazionale di Geofisica e Vulcanologia’s (National Institute of Geophysics and Volcanology (INGV)] “Hai sentito il terremoto?” (Sbarra and others, 2010), among others, collect input from thousands of citizen science observers with modified versions of traditional questionnaires. The USGS DYFI is an extremely popular way for members of the public to contribute to earthquake science and earthquake response. “Did You Feel It?” has been in operation for nearly two decades (1999–2019) in the United States, and for nearly 15 years globally. During that period, more than 6 million individual DYFI intensity reports—spanning all magnitude and distance ranges—have been amassed and archived (fig. 2).
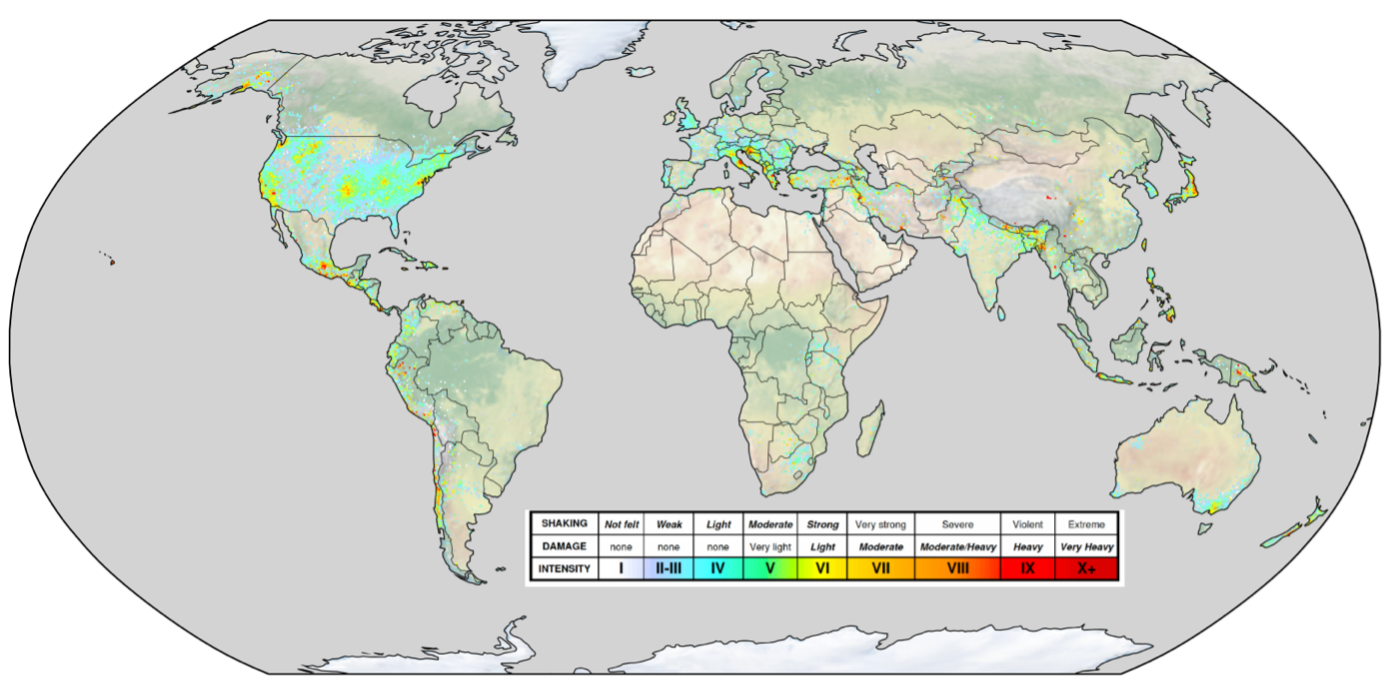
Map of the highest U.S. Geological Survey “Did You Feel It?” (DYFI) intensities obtained throughout 20 years of collecting DYFI observations (2000–21).
In the 2000s, the USGS stopped doing its traditional field- and postal survey-based Modified Mercalli Intensity (MMI) assignments, partly because of the deployment and widespread success of the “Did You Feel It?” community internet intensity system.
However, all macroseismic data are not created equal. Macroseismic observations acquired by different collection procedures may lead to various intensity values being assigned to the same locations in the same earthquake by the different procedures. “Did You Feel It?” and its counterparts around the world have proved fully sufficient as a tool for collecting intensity data at low and moderate intensities (VII and lower). Because the lower range of intensities accounts for more than 95 percent of all macroseismic observations (much larger areas are covered by lower shaking levels, and there are more smaller earthquakes than large ones), DYFI collects the bulk of the data collected. And, although for a given location and earthquake, higher DYFI intensities typically do correlate well with other intensity scales and independent measurements (including ground motion recordings), formally and practically, higher intensities require more expertise on the type of structure and damage state than would be possessed by the typical internet respondent.
Indeed, intensities VII and higher (certainly VIII and higher) warrant evaluation by professionals. So, for destructive earthquakes, alternative systematic macroseismic observations (for example, from engineering reports, media reports, and field reconnaissance) are used to supplement observations obtained with surveys directed at the general public. With this need for professional knowledge of building type and damage grades to make reliable higher intensity assignments, an unresolved problem for the USGS is how to evaluate and assign higher shaking intensities more routinely and automatically. This is especially true because the USGS no longer maintains staff with macroseismic expertise dedicated to assigning intensities for future earthquakes.
Whereas many European nations do employ dedicated macroseismic experts to assign intensities, many countries elsewhere do not have such committed resources. Given the ability of crowdsourced observations like those from DYFI at lower intensities—which as noted, constitute 95 percent of observations—field-based strategies can be limited and focused on locations and events where building damage has occurred.
New Zealand’s macroseismic data collection practices suffer the same limitations as those in the United States—employing crowdsourced observations assignments for mid to lower intensities (Goded and others, 2018) and lacking expertise to assign MMI at higher intensities. Given the lack of dedicated professionals to conduct macroseismic field surveys, a strategy is needed to allow field inspectors—commonly documenting damage but not characterizing the damage with intensity levels—to help contribute to intensity assignments.
We envision that field inspectors—typically either civil engineers, architects, or other professionals trained on the subtleties of Applied Technology Council–20 (ATC–20; ATC, 2005) or other inspection standards—could contribute their collected building damage data for automatic intensity assignments consistent with EMS–98. With minor modifications, most aspects of these ongoing inspections—which are already being carried out for other purposes—could be used to help assign EMS–98-like intensities with proper guidance and documentation on vulnerability class, damage grades, and statistical sampling. Again, these need only be done in the more limited high-intensity areas where building damage is prevalent and thus where DYFI assignments are not well constrained. As described in more detail later, uncertainty assignments of each macroseismic dataset (or observation) would allow the use of DYFI up to MMI VII, and then taper off their effect on ShakeMap by downweighting higher intensity DYFI data in comparison to engineering-based damage assessments; the latter would get full weighting where and when they are provided, allowing for the best possible quantitative representation of the shaking distribution for any earthquake as a function of time after the quake.
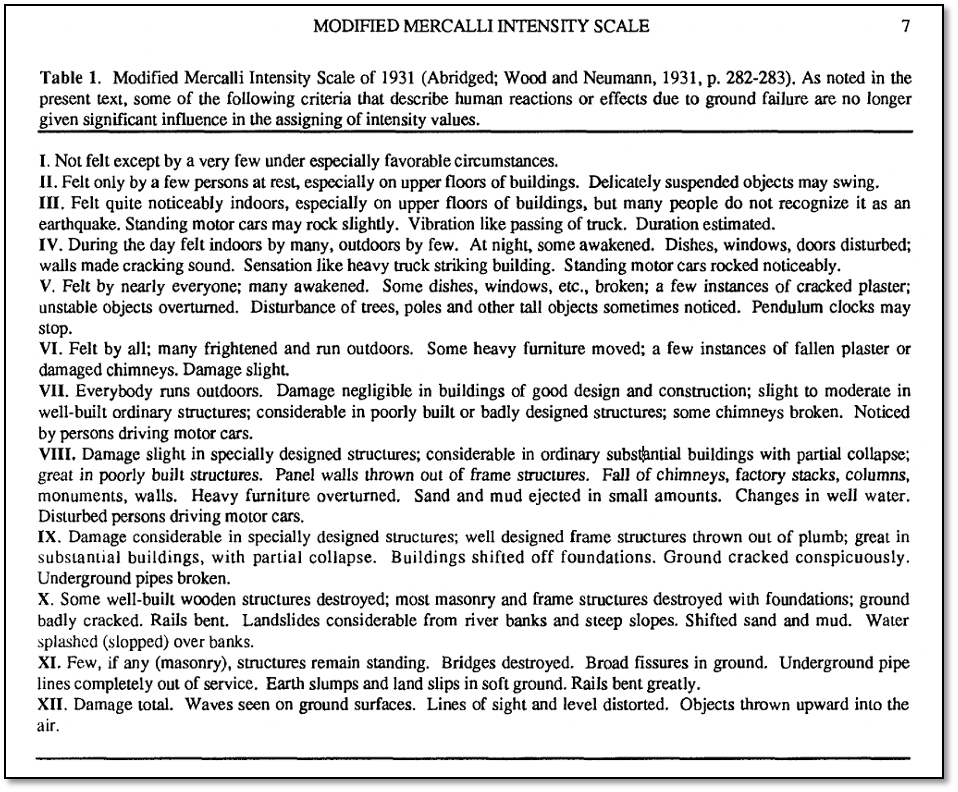
Moreover, EMS–98 is a much more modern intensity scale compared to the previously developed MMI Scale. MMI only has general descriptions of building structural characteristics and associated damage states, and it does not require statistical sampling of damage distributions, whereas EMS–98 is more definitive on all these aspects of its intensity assignment. For example, in the abridged MMI Scale of 1931 (Wood and Neumann, 1931, p. 282–283), the description for MMI VIII is nonspecific about buildings:
“Damage slight in specially designed structures; considerable in ordinary substantial buildings with partial collapse; great in poorly built structures. Panel walls thrown out of frame structures. Fall of chimneys, factory stacks, columns, monuments, walls. Heavy furniture overturned. Sand and mud ejected in small amounts. Changes in well water. Disturbed persons driving motor cars.”
Of course, MMI in its historical use has been fundamental for earthquake science in the United States—delimiting isoseismal areas, constraining historical magnitudes and locations, and documenting past experiences. Yet, because building practices and macroseismic observations have improved, it is imperative to accommodate these changes by using a more appropriate macroseismic scale.
The main challenge to upgrading MMI assignments in the United States is that several important building types are not well represented in the vulnerability class tables provided in EMS–98, which were developed primarily for Europe. Similarly, New Zealand buildings—which share many similarities to U.S. structures, particularly newer building practices—are also not well represented in EMS–98. Behaviors of many such buildings were very well documented after the 2010–11 Christchurch earthquakes in New Zealand and can be leveraged for our purposes. Thus, we aim to update United States and New Zealand macroseismic practices collaboratively, taking advantage of our similar structures, cooperative relationships in both countries among engineering colleagues, and combined building-damage databases for significant recent earthquakes.
So motivated, three main challenges and thus aims were identified for our initial workshop. First, we need to develop the missing building vulnerability classes and damage states for the United States and New Zealand and move away from the MMI Scale at higher intensities to be compatible with EMS–98. Second, we need to leave a paper trail of the procedure to add new regions and structures to the EMS–98 process to facilitate future nations’ efforts to make EMS–98 a truly International Macroseismic Scale (IMS). Although EMS–98 is an international scale in that it has been deployed in many nations outside of Europe and in 30 languages, many nations do not use the EMS–98 approach and may benefit from a more inclusive strategy for adopting and incorporating EMS–98 best practices. Global, standardized macroseismic data collection would be a boon for a wide range of loss and risk studies and mitigation efforts.
Third, we aim to improve United States and New Zealand strategies for rapid macroseismic assignments, particularly for higher intensities, to combine the advantages of DYFI (crowdsourced) intensities—which are already rapid, plentiful, and definitive for lower intensity assignments—with more professionally assigned intensities at damaging shaking levels. We will strategize on how to facilitate high-intensity assignments in the United States and New Zealand by tapping into existing postearthquake building inspection protocols for inspecting buildings so that engineers and other professionals can aid in assigning intensities effectively as a direct byproduct of their inspections.
Our workshop was a variation on the Powell Center’s goal of promoting cutting-edge analysis of Earth system information. Here we aimed to merge a classical approach to quantifying earthquake shaking and damage, used for centuries, with state-of-the-art data acquisition and internet-based citizen science, to facilitate earthquake response and earthquake engineering loss assessments, and for the greater benefit of the world’s population exposed to earthquake risk. The adoption of a widely accepted IMS will require further meetings, expertise, and oversight by some of the founding members of the EMS–98 Working Group to provide both proper guidance and endorsement of any IMS strategy.
Motivation for Standardized Intensity Scales
Casual observers and even seismologists are sometimes skeptical about the quality of DYFI’s citizen-based science data. However, figures 3 and 4 show a similar spread in shaking levels recovered from macroseismic observations (circles) reported by the populace and shaking levels reported by high-quality seismic instruments (triangles), for an earthquake and location for which both types of observation are available. Of course, in most parts of the Nation and the world, cell phone and internet users are much more abundant than seismic sensors, so DYFI fills in tremendous gaps in our very limited instrumental coverage.
“Did You Feel It?” and similar systems are popular and useful ways for members of the public to contribute to science by sharing their experience of an earthquake via an internet-based macroseismic survey. This public participation, in turn, is extremely valuable for earthquake and engineering science and has become a fundamental contribution to earthquake response and situational awareness. Figure 3 shows how valuable DYFI data are for communicating the scope and extent of the shaking for the recent damaging magnitude 6.4 Puerto Rico earthquake of January 7, 2020. About 90 percent of DYFI data arrive within the first hour of an earthquake (Wald and others, 2011), so these data are extremely informative in the immediate aftermath of any earthquake. Even if the higher intensities are initially quite uncertain, that uncertainty can be accommodated in ShakeMap (Worden and others, 2018; Quitoriano and Wald, 2022) and can be updated with professionally assigned values when these are later acquired.
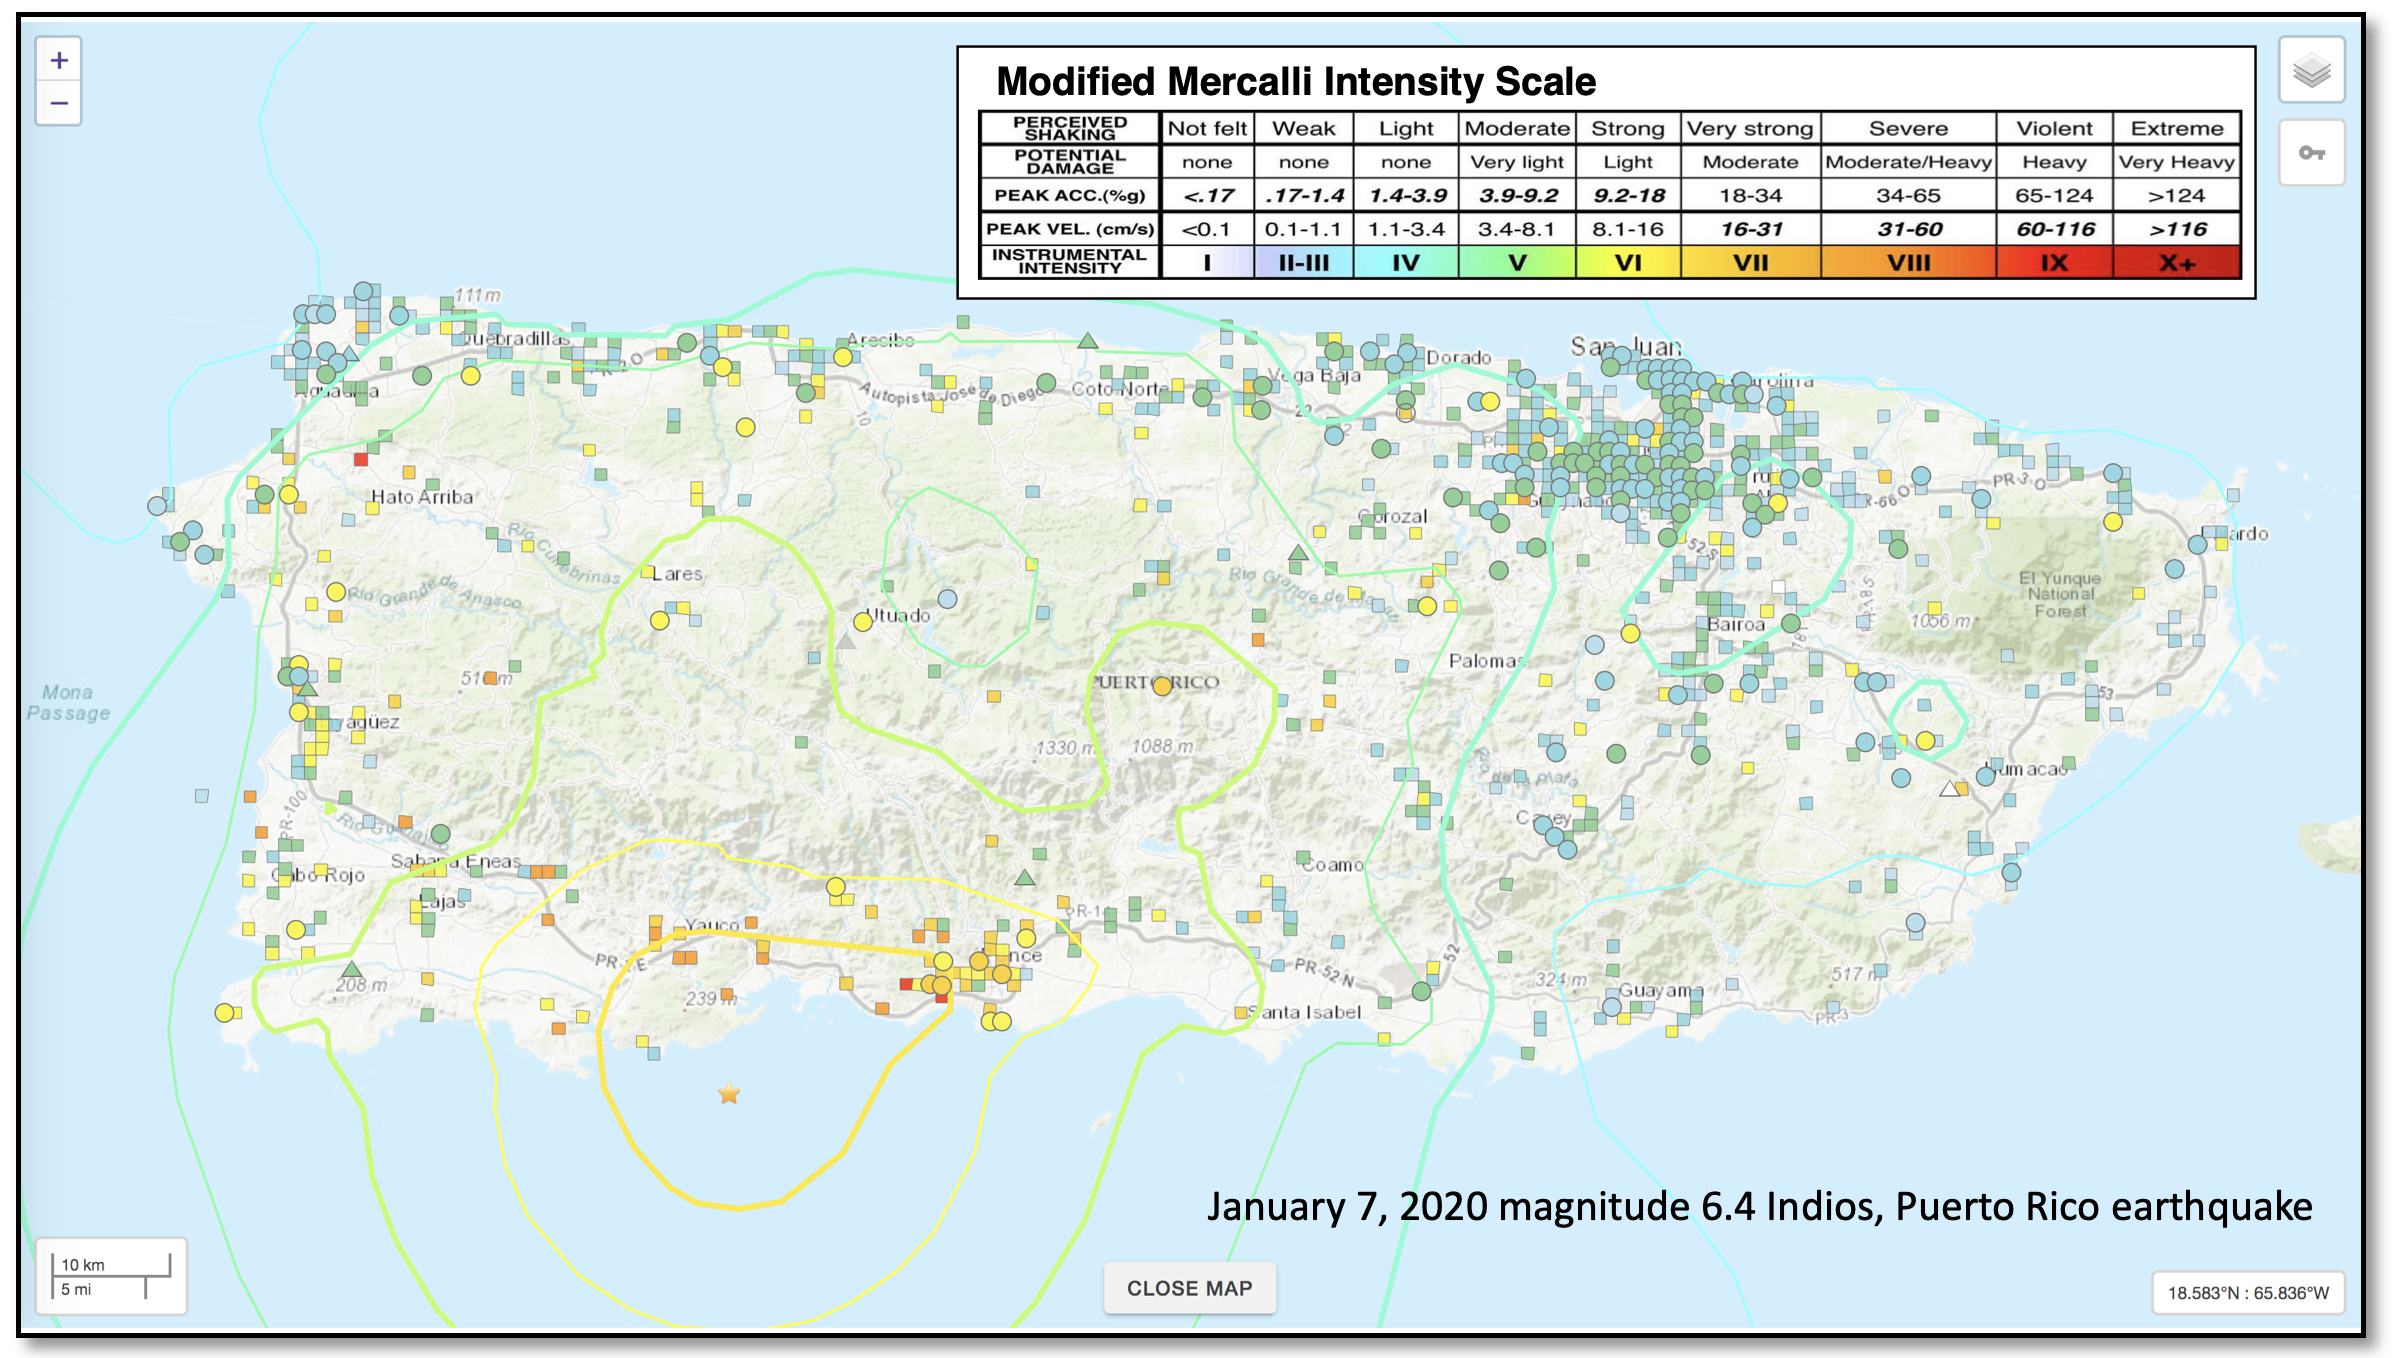
Example of an interactive map from the U.S. Geological Survey event web pages for the January 7, 2020, magnitude 6.4 Indios, Puerto Rico, earthquake (https://earthquake.usgs.gov/earthquakes/eventpage/us70006vll/map?dyfi-responses-10km=true&shakemap-intensity=false). “Did You Feel It?” (DYFI) data are shown in 1-kilometer square blocks color coded to the inset legend used by DYFI and ShakeMap to show the intensity (Wald and others, 2011). ShakeMap intensity contours, in part derived from the DYFI data, are shown with the same color coding. “Did You Feel It?” data are depicted as squares, seismic stations are shown as triangles, and circles denote DYFI data used in ShakeMap (only blocks with three or more DYFI responses are included in ShakeMap).
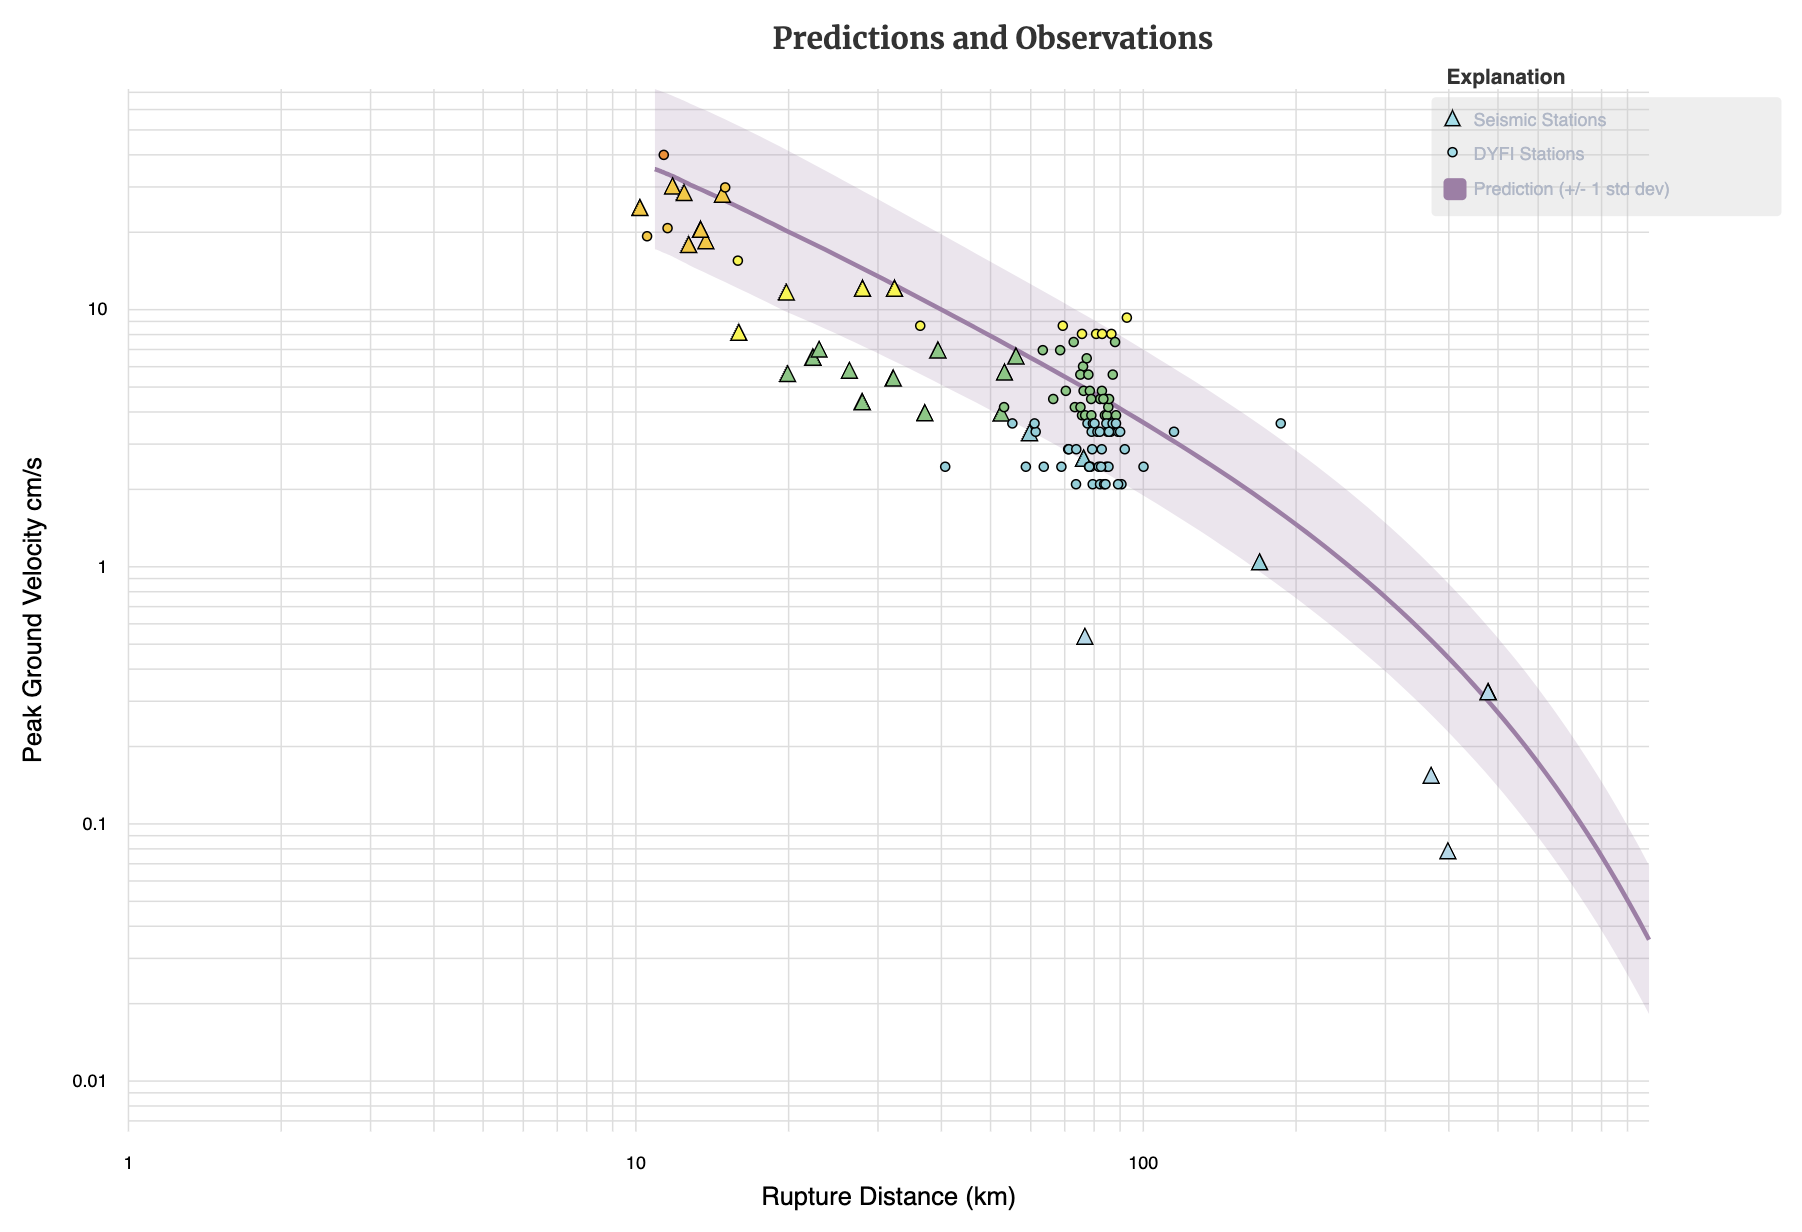
Example of an interactive plot of ground acceleration versus distance for the January 7, 2020, magnitude 6.4 Indios, Puerto Rico, earthquake (https://earthquake.usgs.gov/earthquakes/eventpage/us70006vll/shakemap/analysis). Peak ground accelerations (PGA) inferred from “Did You Feel It?” (DFYI) data, and represented in ShakeMap, are shown as circles, and PGA measured from seismograms are shown as triangles. The curve shown is the prediction of shaking for existing ground motion models used in ShakeMap for the given magnitude and distance. ShakeMap and DYFI data show similar amplitudes, spread, and distance dependence, yet DYFI data are much more numerous. Details of the ground motion prediction equations used are provided in the metadata. cm/s, centimeters per second; +/-, plus or minus; std dev, standard deviation; km, kilometer.
In conjunction with ShakeMap (Wald and others, 1999), DYFI has substantially facilitated the use of seismic intensity throughout the United States, inculcating millions of citizens who experienced earthquakes to think in terms of the varying intensities produced by an earthquake rather than the poorly understood concept of magnitude alone (for example, Celsi and others, 2005; Wald and others, 2011). In fact, given the public’s uptake of macroseismic intensity domestically, the USGS’ public release of the Earthquake Early Warning system in 2019 considered intensity to be the most suitable metric for warning the population of imminent shaking, with intensity-based depictions of earthquake shaking levels. The ShakeAlert Earthquake Early Warning system—now operational along the U.S. West Coast—communicates anticipated shaking intensity by means of MMI and bases the area over which the public should be alerted using prescribed MMI thresholds (for example, ShakeAlert, Given and others, 2018). The ShakeAlert strategy for communicating Earthquake Early Warning with intensity is consistent with the long-held strategy adopted in Japan, where the Japan Meteorological Agency Intensity scale (JMA–96; JMA, 1996) is very well established and understood within the community, in the media, and among decision makers (for example, Doi, 2011), and where magnitude is depreciated as the main earthquake information delivered publicly. Hence, in addition to ShakeMap and DYFI, the concept of intensity is here to stay, and is growing in influence and acceptance because modern earthquake information tools like ShakeAlert and others depend on its general intuitiveness.
Beyond rapidly mapping out crowdsourced intensities, there are several key uses of macroseismic intensity in the realm of seismology, earthquake engineering, and financial decision making that are worth noting. Atkinson and Wald (2007), Wald and others (2011), and Quitoriano and Wald (2020) documented the quality of DYFI by describing the wide range of scientific studies that have come out of these unique data.
In earthquake engineering and loss estimation, strategies to relate ground shaking to damage, losses, and casualties have long used macroseismic intensity as the independent variable. For example, the widely adopted earthquake damage evaluations in ATC–13 (ATC, 1985) developed damage probability matrices for 78 facility types and estimates of the time required to restore damaged facilities to their pre-earthquake usability using expert judgment based on MMI. There are hundreds of analogous studies and methods to estimate damage around the world that use vulnerability curves developed with macroseismic intensity as the measure of shaking. Other standard operating procedures in earthquake engineering include a variety of proprietary and open loss models that depend on intensity as the hazard input, including the USGS Prompt Assessment of Global Earthquakes for Response (PAGER) system (Wald and others, 2008) and many others used for rapid loss assessments described by Erdik and others (2014).
An insightful consideration of the EMS–98 developers—and of earlier macroseismic proponents and practitioners—is that the limited number of degrees of macroseismic intensity scales, the description of shaking levels by discrete integer values, and the use of general vulnerability classes to account for building-by-building variation of the earthquake susceptibility would be very useful but would accommodate structural complexities that would be too difficult to easily observe in the field. In a sense, they recognized a tradeoff of simplicity and usefulness of aggregated damage grades and vulnerability classes against the complexity and speculative nature of component-based fragilities.
In the financial world, catastrophe bonds, or catbonds, and contingency loans can now be triggered via parametric analyses, which depend on earthquake source parameters or shaking estimates and their uncertainties (Wald and Franco, 2017). Other financial products rely on the USGS ShakeMap and PAGER systems for delivering relief funds within 72 hours of a disaster. Typically, loans can be distributed when the population experiencing intensity VI or higher reaches at least 2 percent of the population within the coverage area. Such loans are available in six Latin American and Caribbean countries (Collich and others, 2020).
Why Should Earthquake Engineers and Risk Modelers Care About Macroseismic Intensity?
Macroseismic datasets are also extremely valuable for real-time earthquake situational awareness and response because they directly reflect damage grades to specified structure types.
After an earthquake, structural engineers need to know the causes of building or infrastructure damage. What was the causative shaking level at each site? Ideally, an accelerometer measured the shaking nearby, but that is rarely the case. Instead, engineers rely on interpolated (or estimated) shaking metrics to relate shaking to damage. ShakeMaps are widely used for such earthquake forensics because the shaking estimates are systematically and rigorously constrained. Often, nearby intensity observations can help constrain the shaking, in addition to recordings and ground motion estimates. Worden and others (2018) have shown how abundant intensity observations reduce the ground motion prediction uncertainty.
Similarly, geotechnical engineers must relate shaking and soil properties to incipient or significant ground failure, including landslides, liquefaction, and lateral spreading occurrences. Such site-specific studies also need to infer best possible shaking values at each site.
Likewise, EMS–98 relates carefully observed damage grades to macroseismic intensity. At each site, the intensity can be directly related to peak shaking and spectral response metrics through intensity to ground motion conversion equations (Worden and others, 2012).
Engineering fragility functions and damage probability matrices, such as those in ATC–13, were derived using Modified Mercalli Intensities as the demand parameter.
Many important regional seismic risk assessments use intensities to quantify general exposure, vulnerability, and risk to the area’s building stock (for example, Abrahamczyk and others, 2013).
Loss models and modelers still heavily depend on macroseismic intensities as the demand parameter. For example, the USGS PAGER system and many proprietary industry loss models do so.
Color coding intensity values is more informative when engineers are trying to communicate hazards and risks for clients who do not live and breathe peak ground or spectral accelerations!
Decades and even centuries of building damage data have been collected in the name of macroseismic intensity assignments. These observations of historical structures continue to inform design and retrofit strategies.
The art and science of assigning macroseismic intensities—particularly when using EMS–98—is one of appreciating the structural components and their aggregate performance. Assigning vulnerability classes and damage grades garners an appreciation of overall building performance under extreme loading conditions.
Several direct-to-consumer insurance products also now rely on ShakeMap metrics. For example, Jumpstart (https://www.jumpstartrecovery.com/) currently makes parametric trigger-based earthquake insurance available to individuals in California, with triggers based on those regions with more than 30 centimeters per second of peak ground velocity as reported by ShakeMap, and marketing for such products employs the shaking-to-intensity legends used in ShakeMap for communicating these shaking levels (Wald, Worden, and others, 2022). In addition, in California, the California Earthquake Authority requires all inspectors to place a ShakeMap intensity map in any damage claim file with the loss location indicated.
Workshop Aims and Participation
The aim of the workshop was to bring together engineering experts who could address both United States and New Zealand building types and their damage modes, and macroseismic experts capable of facilitating the adoption of EMS–98 in these two nations. Further goals were to leverage the efforts to adopt EMS–98 in the United States and New Zealand as a template for facilitating others to adapt EMS–98 in other regions around the world, to take a further step toward an IMS, and to discuss strategies to leverage existing engineering surveys for the collection of EMS–98-like intensities in the United States and New Zealand. In all, these efforts will lead to more systematic and accessible loss data beneficial to a wide variety of uses and users worldwide.
The workshop agenda (app. 1) enumerated the following initial goals. These were discussed early in the meeting and modified during the meeting.
-
1) Provide initial framework for applying EMS–98 in the United States and New Zealand EMS
-
2) Identify missing structures, corresponding vulnerability classes, and damage grades needed for the United States and New Zealand
-
3) Provide guidance and a strategy for developing an IMS, including the United States and New Zealand
-
4) Outline plan for a journal article(s) summarizing workshop and recommendations (for example, USGS Open-File Report, ATC report)
-
5) Strategize on approaches to allow field inspectors to contribute their postearthquake field data, for example, ATC–20, for automatic intensity assignments consistent with EMS–98, utilizing existing expertise (to be tackled at a second workshop)
-
6) Organize a second workshop
Benefits of the workshop were aimed at:
-
1) Continuing the expansion of, and guaranteeing the use of, macroseismology for science and basic hazard and risk communication
-
2) Engaging and training the next generation of macroseismic experts
-
3) Improving higher intensity assignments in the United States and New Zealand, and potentially elsewhere
-
4) Facilitating the useful collection of, and access to, postearthquake shaking and damage data
-
5) Delivery of an International Macroseismic Intensity Scale
Table 1 lists the participants of the hybrid remote and in-person workshop. Of the participants, Roger Musson, Jochen Schwarz, and Thomas Wenk were all directly involved with the development of EMS–98 (Grünthal and others, 1998). In addition, Robin Spence contributed more recently to several important publications on moving toward an International Macroseismic Scale (Spence and Foulser-Piggott, 2014, 2015).
Table 1.
Participants of the hybrid remote and in-person International Macroseismic Scale workshop on October 10-14, 2022.[PI, principal investigator; USGS, U.S. Geological Survey; FEMA, Federal Emergency Management Agency; GNS Science, Institute of Geological and Nuclear Sciences; GFZ, GeoForschungsZentrum; ETH, Eidgenössische Technische Hochschule Zürich]
Review of the European Macroseismic Scale of 1998 and Prior International Macroseismic Scale Efforts
“We believe that macroseismic scales are not static, but they instead should be updated on the basis of new experimental observations, as in the case of a recent study” (Tosi and others, 2015, p. 990).
Current Macroseismic Intensity Scales Around the World
Without going into extensive detail, many macroseismic intensity scales around the world are either informal, not well documented, or rely on dated protocols and observations inherent to the scale used. For a summary of most scales, refer to Musson and Cecić (2002) and Musson and others (2010). For the purposes of an IMS, it is useful to note that in addition to the United States and New Zealand, the adoption of an IMS in several key at-risk nations could considerably improve international consistency in earthquake response and hazard and risk analyses. Although adoption of IMS in these countries is beyond the scope of the workshop, it is useful to consider how such a goal would improve upon the current situation.
For example, in the Philippines, the Philippine Institute of Volcanology and Seismology Earthquake Intensity Scale (Philippine Institute of Volcanology and Seismology, 2018) is as nondescript as MMI and still invokes ground failure observations for higher intensities. The Philippine Institute of Volcanology and Seismology Earthquake Intensity Scale was adopted in the Philippines in 1996, replacing the Rossi-Forel Scale used prior.
In China, the Chinese Seismic Intensity Scale (CSIS; State Administration for Market Regulation, Standardization Administration of the People’s Republic of China [SAMR, SAPRC], 2020), now in English, has five general categories of common building types and five building damage grades. The building classes and damage definitions are quite different from EMS–98’s treatment, but the general philosophy of using quantitative ranges of building damage grade and classes is similar. The CSIS also defines instrumental intensity in a very similar fashion to Wald and others (1999) and defers to the instrumental scale over macroseismic observations where seismic stations are present (SAMR, SAPRC, 2020). A challenge for the USGS ShakeMap group, and in developing historical ShakeMaps Atlas (Marano and others, 2023) for important historical events in China, is the outdated use of isoseismals to describe the mesoseismic area in scientific studies rather than reporting site-specific values. Isoseismals are traditionally drawn to separate adjacent areas of equal intensity. They thus have no numerical use because trends in the values are not respected. Often only isoseismal contours are presented rather than tabulating locations with their assigned intensities.
In contrast, whereas the JMA Intensity Scale (JMA, 1996) has corresponding macroseismic observations, official intensity levels are based strictly on instrumentally derived values; macroseismic observations are not considered. This is unique the world over, in that actual damage does not dictate the intensity value: rather, the instrumental value does. Japan Meteorological Agency Intensity values range from 1 to 7, with 5-, 5+, 6-, and 6+ explicitly considered, so there are nine levels in all, consistent with other scales. Of note, Japan has such a dense network of strong-motion accelerometers and intensity meters that these values are widely distributed and are available and in real time. However, because they are based on instrumental data, they are incompatible with macroseismic scales used elsewhere.
Russia, other former Eastern bloc nations, and India use the Medvedev-Sponheuer-Karnik Scale (Medvedev, 1962), known as the MSK or MSK–64. Because MSK–64 is a predecessor and part of the basis of EMS–98, MSK-64 shares many aspects of the newer EMS–98, but differences remain. As well as creating difficult comparisons, varying scales and differing assignment strategies make it difficult to compare and analyze events around the globe directly and uniformly.
Overviews of existing macroseismic intensity scales by Musson and others (2010) indicate that the various scales used worldwide are not all compatible and that the value of an assignment is dependent on the quality of the scale used. Musson and others (2010) go on to provide approximate conversions from several standard scales (for example, MMI, Mercalli-Cancani-Sieberg Scale [MCS], MSK, and JMA–96) to EMS–98, with the implicit assumption that EMS–98 is the most modern and comprehensive scale yet developed.
Short of proposing adoption of a standard IMS, Musson and others (2010) provide strategies for converting among scales and recommend that the macroseismic observations be reinterpreted into the scale of interest (Musson and others, 2010). However, Musson’s conversions do not address many of the informal scales and modifications made in many countries, so caution is warranted. This was particularly problematic for the USGS ShakeMap team when creating its ShakeMap Atlas (Marano and others, 2023), which presents ShakeMaps for 14,000 historical global earthquakes, some of which were constrained primarily by macroseismic observations.
EMS–98 Development
Workshop participants were informed (or reminded) by our EMS–98 forebearers that several key resources and studies contributed and documented efforts toward EMS–98 and to an IMS.
EMS–98 is now the basis for assigning seismic intensities in European nations. As described by Grünthal (2022), the history of the EMS began in 1988 when he initiated a special international Working Group in the framework of the European Seismological Commission (ESC) to review and update the Medvedev-Sponheuer-Karnik Scale (MSK–64), which was used in its basic form in Europe for almost a quarter of a century. The MSK–64 Scale, which itself is an update, is based on the experiences that were available in the early 1960s from the application of the Mercalli-Cancani-Sieberg Scale (MCS) from Sieberg (1932), the Modified Mercalli Scale in its version from 1931 and 1956 (MM–31 and MM–56), and the Medvedev Scale from 1953 (Musson and others, 2010; Grünthal, 2022).
At the 2022 Powell Center meeting, Jochen Schwarz described how the final European Macroseismic Scale (EMS–98; Grünthal and others, 1998) came into being following the EMS–92 draft version for testing rolled out at the 1988 ESC meeting in Prague in 1992. The principal final layout of the European Macroseismic Scale (EMS–92) was created by Gottfried Grünthal, Roger Musson, Jochen Schwarz, and Maximillian Stucchi at a meeting in Potsdam, Germany, on June 17–21, 1992 (Grünthal and others, 1998), and drawings by A.S. Taubajev were widely used. The EMS–92 was used in testing, and the incorporation of the lessons learnt during the worldwide applications of the EMS–92 by several researchers was maintained by the EMS–98 editors. For more details on the contributions to EMS–98, refer to Grünthal and others (1998).
In 1996, the 11th World Conference on Earthquake Engineering in Acapulco, Mexico, featured a special theme session on the scale and its testing and development (Grünthal and others, 1998). In all, the Working Group spent more than 5 years on research and development, followed by 3 years of testing. Later that year, the XXV General Assembly of the ESC in Reykjavik, Iceland, passed a resolution recommending the adoption of the new scale within the member countries of the ESC (Grünthal and others, 1998). The last meeting of that EMS Working Group was at the 1998 ESC meeting in Tel Aviv, Israel.
Continuing EMS–98 Activities Toward an International Macroseismic Scale
Following the adoption of EMS–98, a series of efforts continued to evaluate the use of EMS–98, expand it to other regions, and consider how it could be further adapted for a potential IMS. Early activities involved an “EMS Group” (Jochen Schwarz, Gottfried Grünthal, Roger Musson, and Massimiliano Stucchi) meeting on EMS–98, “Applications, Experiences and Needs,” held in Weimar, Germany, on October 13–14, 2005. Subsequent related publications included Musson and others (2010), a comparison of macroseismic intensity scales, and Schwarz (2011), which was a review of contributions to empirical vulnerability assessment with the damage description in EMS–98.
International Macroseismic Scale Working Group 2013–14
As recounted by Dr. Robin Spence in the Powell Center meeting, the Cambridge Architectural Research and IMS project in 2013–14 (IMS Working Group 2013–14) included several EMS–98 pioneers (Gottfried Grünthal, GeoForschungsZentrum (GFZ), Potsdam, Germany; Roger Musson, British Geological Survey, Edinburgh, Scotland; Jochen Schwarz, Bauhaus-University Weimar, Germany), Thomas Wenk (Wenk Erdbebeningenieurwesen und Baudynamik GmbH, Zurich, Switzerland), Robin Spence (Cambridge Architectural Research, United Kingdom), and Roxane Foulser-Piggott (Cambridge Architectural Research, United Kingdom).
The IMS Working Group 2013–14 was established at the Congress on Recent Advances in Earthquake Engineering and Structural Dynamics 2013 in Vienna, Austria, with a mini symposium “Conclusions from 15 years of international experience with the EMS–98,” organized by Jochen Schwarz, Gottfried Grünthal, Roger Musson, Robin Spence, and Massimiliano Stucchi. The contributions included papers by Maqsood and others (2013) on the “Application of the EMS–98 in the Asia-Pacific Region,” and Stavrianaki and others (2013), who applied EMS–98 to historical earthquakes in Greece. Moreover, Foulser-Piggott and Spence (2013a, b) described extending EMS–98 for more convenient application outside Europe in two papers pertinent to the workshop: “I: Review of field experience using EMS–98” and “II: Development of the International Macroseismic Scale.”
The initial aims and philosophy of the IMS Working Group 2013–14 were to:
-
• Extend the European Macroseismic Scale (EMS–98) and develop it into the IMS to enable it to become more generally applicable to all parts of the globe
-
• Consider that the structure of EMS–98, based on vulnerability classes, is appropriate for such international application
-
• Consider that the main benefit of this development will be to provide a standard scale for international use, reducing the need for interscale conversions
The IMS Working Group 2013–14 background studies in 2013–14 included review of experiences with EMS–98, an investigation of data on global building types, a review of regionally dominant building types, and the quantification of vulnerability modifiers. The aim of the review of field experience using EMS–98 was to identify areas in which the scale could be developed to make it more suitable for international application (Foulser-Piggott and Spence, 2013a, b). Data were collected using an online questionnaire, completed by EMS–98 users in different countries, inside and outside Europe (the 19 respondents are listed in table 2). The questions covered two main areas: (1) key features of EMS–98 study: structure types present, vulnerability, damage grades, and range of intensities; and (2) problems encountered: absence of structure types, insufficient range of vulnerabilities for a structure type, and difficulties in making intensity assignments. Based on these interviews, the authors proposed regional grouping of countries that shared similar predominant building types (table 3). From those groupings, Foulser-Piggott and Spence (2013a) also proposed vulnerability ranges for dominant building types for their proposed regions (table 4 and fig. 5).
Table 2.
Participants of 2013 online questionnaire about EMS–98 use in different countries.[Modified from Foulser-Piggott and Spence (2013a)]
Table 3.
Vulnerability ranges for principal building types and vulnerability class ranges for the proposed regions.[Modified from Foulser-Piggott and Spence (2013a, table 4). —, not applicable; EMS–98, European Macroseismic Scale; A–E are EMS–98 vulnerability classes; RC, reinforced concrete, x or xx, one or two vulnerability class discrepancy]
Table 4.
Proposed vulnerability modifiers for building characteristics for each vulnerability class.[Modified from Spence and Foulser-Piggott (2014, table 4). —, not applicable]
International Macroseismic Scale (IMS) vulnerability table (proposed modifications [in red] by the IMS Working Group by Spence and Foulser-Piggott in 2015. (RC, reinforced concrete; ERD, earthquake-resistant design)
Such efforts, recounted by Robin Spence at the workshop, were described in several proceedings’ papers and reports. Foulser-Piggott and Spence (2013a, b) reviewed field experience using EMS–98 in an initial phase of a project to modify the current version of EMS–98 for intensity levels greater than VI, to make the scale more internationally applicable. They determined that EMS–98 (and its explanatory documentation) would need revision primarily with respect to building damage grades and their descriptions that are more representative of worldwide building types currently missing from existing EMS–98 vulnerability classes.
Spence and Foulser-Piggott (2014; “The International Macroseismic Scale—Extending EMS-98 for Global Application”) took several important steps forward toward an IMS. The authors extended their work by examining dominant building types in the six global regions and assessing their relative vulnerabilities, including the probable failure modes, and reviewing the process of assignment of vulnerability classes to building types in each region. They also added preliminary drawings of the damage characteristics of timber, reinforced concrete, and concrete buildings.
They further presented a series of recommendations for modifications to the EMS–98 document and detailed the additional steps needed and validation required to expand EMS–98 beyond Europe. The most recent effort on their part was a draft of “International Macroseismic Scale Part III: Building Typology, Vulnerability, and Damage (Building Guide)” prepared in 2015. Schwarz and others (2015) further contributed to expanding EMS–98 with vulnerability assessments and damage descriptions for reinforced concrete frame structures following the EMS principles.
After the Vienna congress on recent advances in earthquake engineering and structural dynamics (VEESD 2013), a second IMS Working Group 2013–14 meeting convened in Cambridge, England, in November 2013, and a third meeting convened in Potsdam, Germany, in June 2014. Financial support was provided in part by the Willis Research Network (up to September 2013) and the Global Earthquake Model (GEM) Foundation from March 2014. The IMS Working Group 2013–14 agreed upon principles to govern the development of the new scale:
-
• Intensity is considered as a classification of the severity of ground shaking based on the observed effects in a limited area.
-
• The internal consistency with EMS–98 must be preserved.
-
• The scale must remain robust and simple to use.
Based on a review of the international experience of using EMS–98 for 15 years (in many places outside Europe), the following principal amendments to EMS–98 were proposed for the structure of IMS–2014:
-
• Divide the documentation into three parts: core scale, guidelines, and building plus vulnerability guide.
-
• The core scale and guidelines will be mostly as in the existing EMS–98 booklet, but with some updating and revisions. These will include discussion of web-based intensity assignment procedures.
-
• The building and vulnerability guide will contain an inventory of principal worldwide building types, description of the vulnerability issues for each type, photographic illustrations of examples of the principal building types, and common failure modes. Partly web based, it will be a dynamic document with scope for continuous development.
As reported at the Second European Conference on Earthquake Engineering and Seismology in Istanbul, Turkey, in October 2014, the tasks completed in 2014 were (1) the draft IMS building guide, which contained the general principles and for each separate building type, comprising (i) general description, (ii) regional variations, (iii) the expected vulnerability and vulnerability modifiers (including earthquake-resistant design (ERD), (iv) damage grade descriptions, and (v) limitations; and (2) a draft revised vulnerability table. In their draft IMS building guide, Spence and Foulser-Piggott (2015) described the proposed vulnerability modifiers (table 4) as follows:
-
• Features of a building characteristic responsible for modification to the most likely vulnerability level. These are considered to include quality and workmanship, floor and roof type, state of preservation, regularity, position in the block, and strengthening.
-
• The effect of each modifier on the expected vulnerability class. These are summarized using one of the following three levels of modification:
-
o Increase or decrease vulnerability by one class—modifier affects vulnerability and may increase or decrease the vulnerability by one class or more.
-
o Increase or decrease vulnerability by less than one class—modifier affects vulnerability but in conjunction with other modifiers may increase or decrease the vulnerability by less than one class.
-
o Minor increase or decrease in vulnerability—although the modifier affects vulnerability it is unlikely to cause a shift in the vulnerability class.
-
-
• Vulnerability shifts resulting from each vulnerability modifier are independent of one another, and in principle are additive.
Table 4 was discussed within the IMS group in 2015 and was not fully agreed upon. The engineers were concerned that the outcome may be variable and that the basic elements for EMS and IMS remain the graphical elements used for indicating most likely vulnerability class, probable range(s), range(s) of less probable, and exceptional classes.
At the workshop, Robin Spence noted how the guidelines could be improved with better descriptions on how regional factors affect the seismic vulnerability of buildings. In the EMS–98, a circle defines the most likely vulnerability class for each building type (figs. 1 and 5) and factors affecting seismic vulnerability; for example, consideration of level of workmanship can increase or decrease the vulnerability class of a building. Although the most likely vulnerability class obtained for a particular building type can be varied according to several factors as described in the EMS–98 document, building damage data for particular building types in different locations could be used to identify issues that have arisen as the building stock has changed over time. For example, some types of masonry buildings in a country or region may be more modern and therefore have a lower most likely vulnerability, or they may have routine issues related to poor workmanship that may increase their vulnerability.
Yet, for any building type, the building distribution across vulnerability classes could be investigated by examining regional damage data. That is, by considering factors such as the quality of workmanship, one can reduce or increase (modify) the basic vulnerability. Importantly, Spence and Foulser-Piggott drafted a table of proposed modifications by the IMS Working Group to the existing EMS–98 vulnerability table summarized in table 5. Some of the factors affecting vulnerability assignment defined in the current EMS–98 would also benefit from the addition of descriptive diagrams, such as presented in Spence and Foulser-Piggott (2014). Table 5 was the last discussed working draft of the IMS group, and substantive details need to be worked out further.
Table 5.
Essential recommendations made at the International Macroseismic Scale Working Group meeting in Potsdam, Germany, in January 2015.[No., number; EMS–98, European Macroseismic Scale of 1998; ERD, earthquake-resistant design; RC, reinforced concrete; WG, Working Group; GEM, Global Earthquake Model; RPF, (unknown); RS, Robin Spence; RM, Roger Musson; IMS, International Macroseismic Scale]
The IMS 2014 group also identified tasks not completed in 2014, including (1) a guide to web-based intensity assignments, (2) damage grade illustrations, and (3) the compilation of a revised set of damage photographs. They also identified future activity in 2014 that recommended review by an external review panel, editing and revision, preparation of a web-based version of the building guide, publication of draft text (ESC meeting in Prague, 2015), a period of trial application, and lastly, a final version. Robin Spence noted that none of these last steps have to date been taken, but they remain essential before IMS can become operational at an international level.
Decisions Resulting from the International Macroseismic Scale Working Group Meeting Potsdam January 22–23, 2015
Several essential, editorial, and desirable recommendations were made at the IMS Working Group meeting in Potsdam, Germany, in January 2015. The essential recommendations are provided in table 5, and the editorial and desirable recommendations were incorporated into the Spence and Foulser-Piggott (2015) draft building guide.
International Macroseismic Scale–2015 and 16th World Conference on Earthquake Engineering
Another productive collaboration toward an IMS occurred prior to and at the 16th World Conference on Earthquake Engineering (16WCEE) in Santiago, Chile, in 2017. As described by Jochen Schwarz and Thomas Wenk at the Powell Center, original members of the EMS–98 Working Group convened an IMS Working Group in 2015 (IMS–2015) and held a special session at the 16WCEE. The World Conference on Earthquake Engineering is usually held under the auspices of The International Association for Earthquake Engineering. The 16WCEE special session 96 (SS96), “Evolution of EMS–98: Building Types, Vulnerability Classes and Damage Grade Description toward an International Macroseismic Scale,” was organized by Jochen Schwarz, Thomas Wenk, and Gottfried Grünthal.
At the Powell Center IMS Working Group meeting, Jochen Schwarz and Thomas Wenk summarized the contributions toward an IMS from the IMS Working Group, active from 2013 to 2015, as stated in its final decisions of January 23, 2015. Their recommendations are as follows.
Refinement of the Vulnerability Table
-
• Refinements of reinforced concrete frame and reinforced concrete wall structures by adding a distinction by stories
-
• Refinements of steel structures by adding a distinction by ERD level
-
• Timber structures should be divided into different categories
-
• Refinements of the vulnerability class range by number of floors or by building height
-
• Improvements of most likely values for masonry and reinforced concrete buildings
Descriptions of Damage Grades
-
• Improvements of damage grade descriptions for reinforced concrete frames with shear failure
-
• The classification “few,” “many,” or “most” should be extended to all damage grade descriptions
-
• Currently, this is mainly used for masonry (for example, damage grade 3 for masonry: “large and extensive cracks in most walls”)
-
• SS96: “Recommendations for Descriptions of Damage Grades”
-
• Additional damage grade descriptions for building types with well-known seismic response and structural performance
-
• Additional damage grade descriptions for nonstructural elements are important, even though they were not mentioned in SS96
Recommendations for Simplifying the Field Work
-
• Compilation of a database with predominant building types for each region
-
• Use of geographical information system (GIS) databases of building stock of earthquake-affected areas to simplify the field work and the calculation of quantities and intensities
At its final meeting in Potsdam, Germany, on January 23, 2015, the IMS Working Group (Roxane Foulser-Piggott, Gottfried Grünthal, Roger Musson, Jochen Schwarz, Robin Spence, and Thomas Wenk) summarized its findings in 20 IMS Working Group decisions. These 20 decisions replaced minutes of the Working Group meetings and were grouped in three categories: essential recommendations, editorial recommendations, and desirable recommendations.
The latest effort toward an IMS was a paper at the 16WCEE by Abrahamczyk and others (2017), titled “WHE Reports as a Complementary Database Towards the Development of an International Macroseismic Scale.” The Earthquake Engineering Research Institute’s (EERI) World Housing Encyclopedia (WHE) is a comprehensive database covering the national variations of structural systems for most building types in earthquake-affected regions worldwide (fig. 6).

Overview about existing World Housing Encyclopedia (WHE) reports for main building types in Europe and Central Asia (from Abrahamczyk and others, 2017; used with permission). PGA, peak ground acceleration; m/s2, meter per second squared. O, Ost (east in German)
Abrahamczyk and others (2017) first describe updates of the WHE to give a more harmonized assignment of the most likely vulnerability class (and their ranges) to the respective structure types. Figures 7 and 8 show the vulnerability classes for reinforced concrete and masonry, respectively, expanding on the EMS–98 table.
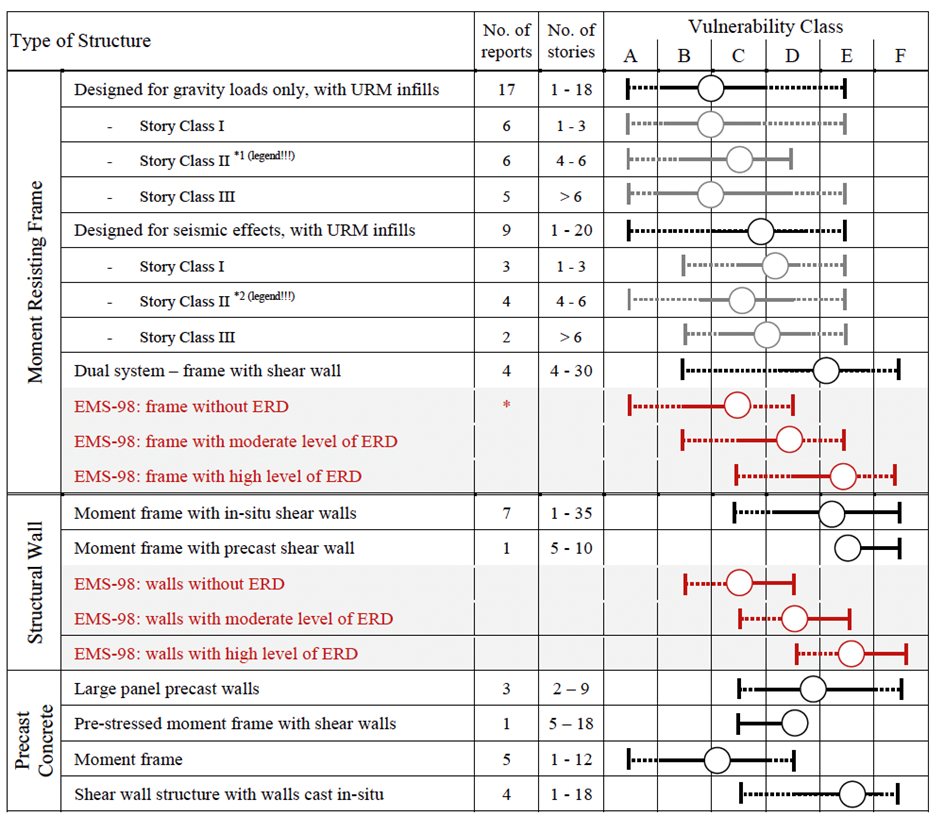
Overview of reinforced concrete building types and assigned vulnerability classes in World Housing Encyclopedia reports transferred into European Macroseismic Scale of 1998 vulnerability classes and ranges (from Abrahamczyk and others, 2017; used with permission). (No., number; URM, unreinforced masonry; >, greater than; ERD, earthquake-resistant design; EMS–98, European Macroseismic Scale of 1998)
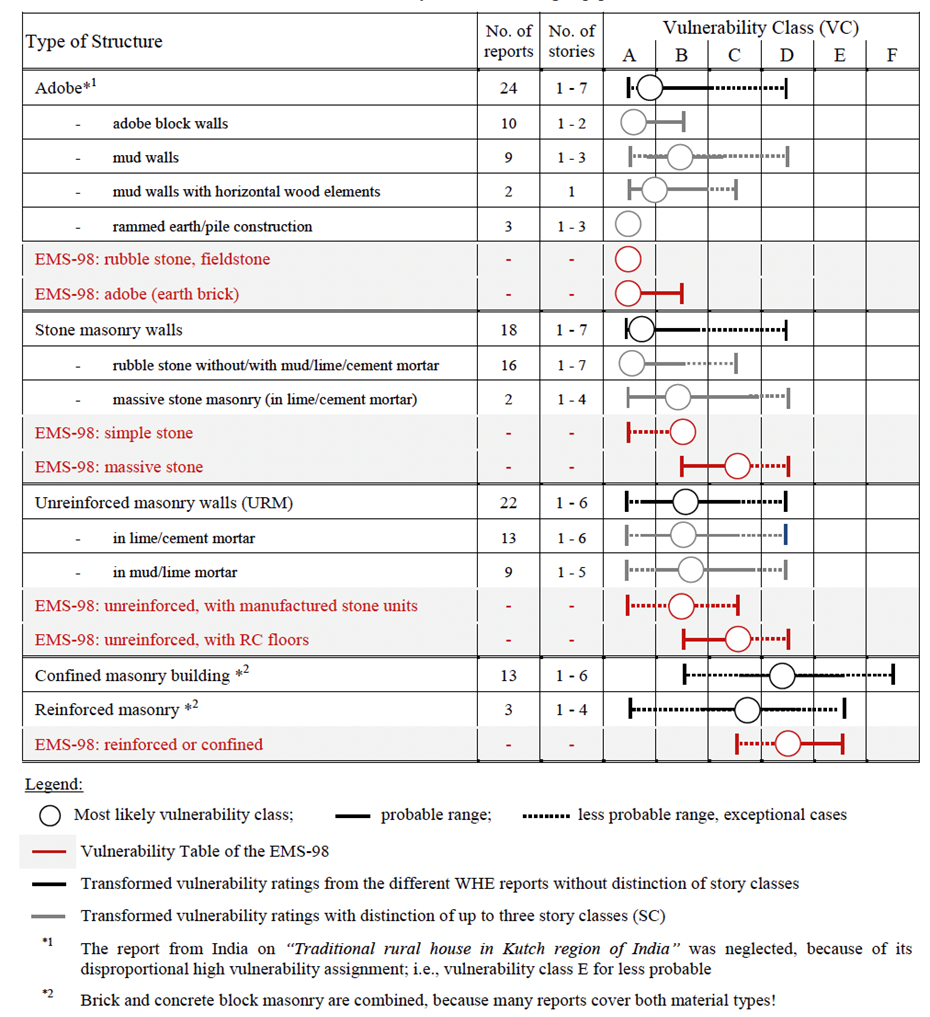
Overview of masonry vulnerability classes in World Housing Encyclopedia reports transferred into European Macroseismic Scale of 1998 vulnerability classes and ranges (from Abrahamczyk and others, 2017; used with permission). (No., number; EMS–98, European Macroseismic Scale of 1998)
Many WHE authors were also asked to indicate the quality of their data, state their confidence level in determining the vulnerability class, and describe the information that their assignment was based upon. This editorial qualification supports the direct link of the reports in transforming EMS–98 into an IMS (Abrahamczyk and others, 2017). Another aspect of the paper that bears directly on IMS considerations are the maps and summary of the regional variations of the building types, and their efforts to correlate knowable building characteristics (for example, age) with seismic vulnerability features (in other words, structural layout, elements, connections, floor, roof type, and so forth) to the expected IMS vulnerability class for each regional variant (Abrahamczyk and others, 2017). Following the updated EMS vulnerability table, regional particularities are expressed in their most likely vulnerability class, along with the ranges of probable and less probable (in other words, exceptional) cases (table 6; modified from Abrahamczyk and others, 2017).
Table 6.
Comparison of most likely vulnerability assignments for all building types.[Modified from Abrahamczyk and others (2017). —, not applicable; A, adobe; b, block walls; m, mud walls; CM, confined masonry; RM, reinforced masonry; RC, reinforced concrete; FD, dual system; W, structural wall; S, steel; Fg, frame designed for gravity loads only; URM, unreinforced masonry; SW, structural wall; P, precast concrete; Fd, frame designed for seismic effects; re, rammed earth; mw, mud walls with timber elements; SM, stone masonry; rs, rubble stone; T, timber]
As noted by Grünthal, EMS–98 was authorized to be translated in the Cahiers du Centre in Luxembourg into French, Spanish, Chinese, and Italian. Likewise, the core scale and (or) short versions are available in 30 languages. In this sense, EMS–98 is effectively an international scale. However, Foulser-Piggott and Spence (2013a, b) and Abrahamczyk and others (2017) identified several important considerations needed for facilitating the expansion of EMS–98 to additional countries that contained structures not explicitly considered in EMS–98 vulnerability class table. The IMS–2015 Working Group’s SS96 recommendations for “Additional Building Types” and their “20 Decisions” provide an essential platform for moving forward on an IMS.
Macroseismic Intensity in New Zealand and the United States
The IMS Working Group recognized that, specifically for higher, damaging intensities, the Modified Mercalli Intensity (MMI) Scale is outmoded compared to EMS–98 (for example, Wald, Quitoriano, and others, 2022). The latter quantitatively accounts for building vulnerability classes and ratios of given structure classes at specific degrees of damage and MMI does not. As such, we aimed to revise the higher MMI levels in the United States and New Zealand to be compatible with EMS–98 by assigning missing United States and New Zealand building vulnerability classes and damage grade descriptors. Further, we aimed to make recommendations so that the strategies we use to add new country and building types could be implemented elsewhere.
Modified Mercalli Intensity in the United States
The MMI used in the United States after 1931 was the scale of Wood and Neumann (1931), with 1956 modifications by Richter (1958).
Musson and Cecić (2002, p. 7–8) provide the best guidance on the complicated and not-particularly-well-documented evolution of MMI:
“Most of the versions in circulation ([e.g.], on internet pages) are either the short form of the 1931 version, or some arrangement of the 1956 version. While papers frequently cite Stover and Coffman (1993) as the currently preferred version, one searches in vain for a copy of the scale according to Stover and Coffman (1993), since even Stover and Coffman do not present it in a unified form. Instead, they give Wood and Neumann’s longer version, and a separate section in which they describe the modifications they apply in practice. Since this is the version of the scale that underlies the “Did You Feel It?” system (Wald and others, 1999) and most of the recent studies on intensity and physical ground motion measures, the Stover and Coffman version is important, and it is strange that, hitherto, it seems to exist nowhere in print as an integrated scale.”
Musson and Cecić (2002, p. 7–8) also provide the most complete description of the MMI Scale at that time. Later, USGS assignments of MMI evolved, yet the specific policy changes were never formally documented and are still difficult to follow. As amended by Stover and Coffman (1993; fig. 9), the USGS no longer uses ground changes (landsliding, liquefaction, faulting, buckling, and so forth) as indicators. Criteria added since have been detailed by Dewey and others (1995) after the 1994 Northridge, California, earthquake, and Dewey and others (2002) following the 2001 Nisqually, Washington, earthquake. Important changes include the convention that MMI IX is only infrequently assigned in the United States. Whereas MMI X is allowed, in principle, no recent events have been assigned MMI over IX and only two MMI IX values were assigned for the Loma Prieta and Northridge earthquakes, although shaking was intense (Dewey and others, 1995).
Abridged version of the Modified Mercalli Intensity Scale, as represented in Stover and Coffman (1993).
The USGS has continued to make modifications to MMI assignment procedures to accommodate changing building inventories (refer to Dewey and others, 2002). Nevertheless, seemingly minor changes of important indicators over time warrant reconsideration. For example, old-style unreinforced masonry chimneys are no longer common in highly active regions in the west, because of prior damage and replacement or retrofit, and to improved building practices. Yet damage to masonry chimneys remains a key indicator of MMI VII and VIII in the United States (for example, Dewey and others, 2002). Likewise, the MMI Scale does not explicitly account for damage to prefabricated, elevated mobile homes. Such homes are now a more ubiquitous indicator of damaging levels of shaking.
Until 2002, most USGS macroseismic data were primarily obtained from postal questionnaires and were supplemented by press accounts and engineering reports for important earthquakes. Postal canvassing was discontinued in 2002 and replaced by DYFI. Currently, two types of macroseismic intensities are used in the United States: a traditional MMI, which the USGS has used routinely since 1931, and the Community Internet Intensity (CII), developed for handling observations contributed to DYFI (Dengler and Dewey, 1998; Wald and others,1999; Wald and others, 2011). For practical purposes, such as use in loss or hazard studies, the two types of intensities should be interchangeable. The CII procedure was designed with the intention that CII intensities would agree on average with traditional USGS MMI intensities (Wald and others, 1999), and detailed comparisons between MMI and CII have confirmed that the two are indeed very similar (Dewey and others, 1995, 2002). Nonetheless, we are still concerned about the quality of higher intensity assignments made with the DYFI system for the reasons mentioned earlier in this paper. More critically, traditional macroseismic assignments have not been routinely made for recent events by the USGS since the retirement of M. Hopper and J. Dewey.
The Working Group noted that in the United States, higher intensities are assigned by expert opinion rather than quantitatively as in EMS–98. Thus, a better description of standard practices is warranted, yet a more likely strategy would be to reconstitute intensity assignment practice and policy in the United States by first adopting EMS–98, and then fully documenting (and illustrating) the procedures for the revised scale for use in the United States and New Zealand. As described later, this would likely entail damage data gathering by engineering and loss assessment teams who gather such postearthquake data, but not necessarily for the purpose of assigning intensities.
Thus, in addition to the lack of dedicated macroseismic professionals, an evolving scale, and fewer obvious indicators (for example, chimney damage), new strategies are needed to assign higher (VII and greater) intensities in the United States beyond the traditional approach.
Modified Mercalli Intensity in New Zealand
The strategy for MMI assignments in New Zealand was updated most recently by Dowrick and others (2008), building on earlier revisions by Dowrick (1996). Details of the New Zealand MMI Scale of 2007 are provided in appendix 2 of Dowrick and others (2008). Dowrick and others (2008) accommodate some of the advanced features of EMS–98 for New Zealand, adopting additional structure types (for example, six construction types of varying vulnerability, dominated by masonry). The New Zealand MMI Scale of 2007 adopted other aspects of EMS–98, including adapting “few,” “many,” and “most” ranges for specific damage grades. Vulnerability was mainly linked to building age and code changes: up to the mid-1930s, 1970, and 1980; however, it did not fully approach EMS–98’s vulnerability classes nor damage degrees. The authors also added more quantitative analyses of damage to chimneys as observed during New Zealand earthquakes. However, the New Zealand MMI Scale of 2007 is more detailed and quantitative than that currently used by the USGS in the United States, so it is simpler to use but less sophisticated than EMS–98.
As mentioned earlier, much attention was given to environment damage (ground failure by landslides or liquefaction), and that has been discounted as described by recent authors and varying intensity scales, particularly EMS–98 (Grünthal and others, 1998), Dewey’s descriptions of the use of MMI in the United States (Dewey and others 1995, 2002), and Hough’s many analyses of historical earthquakes (for example, Hough, 2014).
Goded and others (2018) describe New Zealand’s current use of internet questionnaires for macroseismic intensity assignments. In 2004, GeoNet (New Zealand’s national geological hazards monitoring service, https://www.geonet.org.nz/) implemented an internet-based questionnaire (“Felt Classic”) together with an algorithm to automatically assign intensity values on New Zealand’s MMI Scale (to each felt report captured from the questionnaire).
As reported by Goded and others (2018, 2021), their “Felt Classic” and “Felt Detailed” questions are similar to the traditional ones that had been used for the decades prior to 2004. “Felt Detailed” consists of 40 questions divided into 10 sections: (1) general questions on the earthquake, (2) earthquake experience, (3) earthquake effects, (4) building information, (5) building damage effects, (6) neighborhood effects, (7) tsunami evacuation, (8) tsunami information, (9) information about earthquakes, and (10) demographic information (refer to appendix 1 in Goded and others [2021] for the complete “Felt Detailed” questionnaire). Recent updates in “Felt Detailed” include some questions on injuries, deletion of section 9, and a method to skip questions when not relevant (for example, skipping all sections on building damage or tsunami if the respondent indicated there was none of these). The New Zealand method to obtain community intensity values uses an expert-based approach developed by the Italian Istituto Nazionale di Geofisica e Vulcanologia (INGV; Sbarra and others 2010; Tosi and others 2015) and is based on a score distribution for each answer to the questions in the survey fully described by Moratalla and others (2021).
In New Zealand, values assigned as described earlier are limited to intensity VIII. As noted prior, at MMI VII and above, buildings can suffer considerable damage and the assignment of intensity values involves an engineering analysis of the building’s damage grade and building type. Hence, in New Zealand, the same limiting factors for intensity assignments as in the United States also apply: crowdsourced observations are insufficient for intensities that require structural and damage assessment, and the traditional MMI strategy is not only prohibitive in terms of available resources and necessary expertise, but also because the MMI Scale is not as quantitative and rigorous as EMS–98. Yet, many of the buildings in both nations, particularly the wide variety of regionally specific wood, masonry, and reinforced concrete buildings, have not been described in terms of EMS–98 vulnerability classes nor damage grades. Similarly to the United States, traditional macroseismic intensity assignments following field inspections have not been carried out since the retirement of macroseismologists David Dowrick and Gaye Downes from GNS Science, prior to 2010.
As a sidenote, in addition to those traditionally used for MMI assignments, the additional questions above provide demographic and tsunami content that may prove useful. In the United States, the USGS is implementing the Goltz and others (2022) questionnaire following its DYFI system questionnaire to allow users to answer (optional) additional questions concerning demographics, their behavior, and their experience with any Earthquake Early Warning they might have received.
On the Use of Ground Failure for Macroseismic Intensity Assignment
The Powell IMS Working Group concurred that ground failure or other so-called seismogeological effects should not be considered when using EMS–98 in New Zealand and the United States. Avoiding the use of such effects is consistent with the recommendations in EMS–98.
Vogt and others (1994) detailed the considerations made by the 1998 European Seismological Commission Working Group when they began upgrading the MSK Intensity Scale. They concluded that seismogeological observations could not be considered the same as effects on humans, objects, and buildings, and recommended only using them as a consistency check for intensity assessment. They provided a comprehensive table where the experimental relations between seismogeological effects and intensity degrees—assessed by means of other effects—are presented (Vogt and others, 1994).
Following those earlier recommendations, EMS–98 advises that “one should not take into consideration damage caused by earthquake-related phenomena other than the actual strong shaking. Such phenomena include * * * landslides, slope failure, and liquefaction” (Grünthal and others, 1998, p. 24). Detailed justifications regarding the authors’ concerns about considering seismogeological effects are described in EMS–98 Section 7 “Effects on natural surroundings,” for example: “in many cases, seismogeological effects occur in such a way that they cannot easily be quantified to the same degree as other observations can. This means that there is always a problem in estimating intensity in an unpopulated area; at best a range of intensities can be given. This is regrettable, but it is better to admit this restriction than to assign intensities which are too unreliable to be useful” (Grünthal and others, 1998, p. 24).
In EMS–98, “Relations of seismogeological effects to intensity degrees” (table 7-1 of Grünthal and others, 1998, p. 97) shows that the ranges of intensities over which each effect can occur illustrates the problems that arise in dealing with these effects for assigning or even assisting in assigning intensities. In contrast to the EMS–98 avoidance of ground failure and other secondary effects, the Environmental Seismic Intensity Scale (Michetti and others, 2007) uses such observations as a main feature of the scale. Environmental Seismic Intensity was developed to account for hazards because of landsliding and liquefaction, reasoning that seismic hazard assessment, or SHA, would benefit from a comprehensive consideration of all earthquake-related effects. There also is potentially more consistency with the use of such indicators for historical earthquakes (for example, Serva, 2019). However, the use of ground failure complicates the relationship between intensity and shaking parameters because ground failure entails unobserved vulnerability of the ground that fails, precluding such failure as a direct indicator of shaking. So, rather than consistently use historical assignments that included seismogeological effects, many authors avoid earlier assigned intensities that included them and use care in general with historical assignments given the scanty, often unrepresentative data that were typically used (for example, Hough, 2014).
We note that in their revision of the MMI Scale for use in New Zealand, Dowrick and others (2008) gave considerable attention to ground failure, a trend opposite of that in EMS–98 and in the United States (Dewey and others, 1995, 2002). In fact, Dowrick and others (2008, p. 196) noted that “rainfall before an earthquake can substantially increase the number and size of landslides caused by the earthquake. This increases the scatter in the relationship between intensity and landslides which creates a source of variability in intensities assigned from landslides only, a variability that is seldom present in intensity criteria based on damage to the built environment,” yet then proceeded to study and apply a lesson of landslide distributions for use in future MMI assignments. It would be beneficial to swing the pendulum back in the direction of EMS–98 when fully applying EMS–98 strategies in New Zealand. As far as the authors know, no MMI assignments have been carried out using ground failure data since the publication of Dowrick and others (2008). For example, high MMI levels were assigned to the February 22, 2011, moment magnitude (M) 6.2 Christchurch earthquake by Goded and others (2019) only using building damage information, and not ground failure data. The MMI maps were subsequently compared to landslide and liquefaction observations.
Implementation of EMS–98 in the United States and New Zealand
One initial aim of the workshop was to address those missing structures necessary to expand EMS–98 to the United States and New Zealand. This entails identifying them, assigning vulnerability classes, and fully describing (with illustrations) the canonical damage grades. Subsequently, calibration is needed to make sure the class and damage grade assignments are consistent with comparable structures in EMS–98 and the intensity assignments they render.
In parallel to the Powell Center IMS workshop, in fiscal year 2022, the USGS Earthquake Hazards Program funded the ATC (principal investigator Ayse Hortacsu) with an external grant under the auspices of a new ATC project, ATC–158. Typically, USGS Powell Center workshops cover expenses to hold a workshop—primarily travel and facilities—but they do not directly fund research and development. External grants, in contrast, fund such research and development.
Combining United States and New Zealand expertise on this problem is consistent with Foulser-Piggott’s and Spence’s (2013a, b) suggestion to define IMS zones, within which the predominant building types are similar. In the United States and New Zealand, many key building types and vulnerabilities are made similar by factors including socioeconomics, climate, construction practices, and building codes, and can thus be considered collectively (for example, Jaiswal and Wald, 2008). Adding the United States and New Zealand zone to IMS would require expansion of the EMS–98 vulnerability table beyond the 15 separate structural types (of which 7 are masonry and 6 reinforced concrete types with only 1 each for steel and timber; fig. 1A–B), although Spence and Foulser-Piggott (2015) proposed recommendations for expanding existing classes (fig. 5).
Specific tasks aimed at a United States and New Zealand regionalization of EMS–98 discussed at the workshop include the following:
-
• Evaluating proposed vulnerability classes for United States and New Zealand buildings,
-
• evaluating damage grade descriptors for each building vulnerability class,
-
• providing guidance and evaluating the new vulnerability classes and damage descriptors against observed data from past earthquakes in the United States and New Zealand,
-
• providing recommendations toward the development of an IMS that would include missing United States and New Zealand building types and their associated vulnerability classes,
-
• developing criteria for postevent damage collection for macroseismic assessments in the context of the new scale, and
-
• providing uncertainty assignments more generally so these data can be used in ShakeMap and for estimating the ground shaking at each locality.
We first describe the challenges of adding United States and New Zealand structures to EMS–98 protocols. In the subsequent section, we then describe strategies for improving postearthquake building damage assessments in both countries to facilitate more routine and standardized assignment of intensities for damaging levels of shaking. The issue of uncertainty assignment comes up in a later section.
Identifying Common United States and New Zealand Structures Missing in the European Macroseismic Scale of 1998
Spence and Foulser-Piggott (2015) identified several building types as not being adequately represented in EMS–98. They did not specifically address those types missing in the United States and New Zealand, yet their tables support additional focus on timber, reinforced concrete, steel, and masonry structures that are expected to show varying vulnerabilities and thus differing damage characteristics than those in EMS–98. EMS–98 was also limited to single structure types both for all steel and all timber structures without consideration of ERD. Grünthal and others (1998) and Spence and Foulser-Piggott (2014) also noted that steel assignments were very limited at the time of EMS–98 production because of a paucity of available data from European studies. Similarly, wood building types were limited because they are not that common in Europe, yet a large proportion of residential structures are timber in the United States, New Zealand, and Japan.
Assigning Vulnerability Classes and Damage Grades
The group discussed the importance of generating separate diagrams representing damage grades for additional building types found in both the United States and New Zealand. Suitable photographs of each building type and damage grade would need to be acquired using the WHE, ATC–20, EMS–98, and potentially other damage studies. Resources would need to be obtained for new architectural drawings as necessary, and options for internships and contracting to do so were reviewed.
Validation
The need for validating new or modified building type vulnerability classes and damage grades against existing EMS–98 intensities was discussed and deemed to be a challenging endeavor. One strategy discussed using a consistency check that considered assigning EMS–98 intensities for past United States and New Zealand earthquakes in areas where two (or more) building types are collocated and could thus be used to assign intensities independently.
A second strategy for validation would leverage relationships between intensity and ground motion using locations where well-documented juxtapositions between recent building damage surveys and strong ground motion recording are available. With due care, one could examine the performance of existing ground motion to intensity conversion equations for MMI in terms of applicability to new EMS–98 assignments. This would be based on areas with both damage information, which can be used to assign EMS–98 values and ShakeMaps (Wald and others, 1999), or ShakeMapNZ (Horspool and others, 2015), which provide MMI values based on ground motions. The levels of ShakeMap intensities can then be compared to those obtained using the EMS–98 Scale, and the possible relationships between MMI, IMS, and ground motion to intensity conversion equations can be explored to improve internal consistencies.
Using an expert elicitation approach to assigning appropriate vulnerability classes to new structure types also was discussed at the workshop. Several of the participants have had some success using structured expert elicitations for estimating structural collapse fragilities (for example, Jaiswal and others, 2014). In particular, Jaiswal and others (2014) used Cooke’s method (Cooke, 1991), which is based on a performance-based scoring system that reflects the combined measure of an expert’s informativeness about needed parameters in the problem area under consideration, and their ability to provide statistically accurate uncertainties associated with their assessments. However, we recognize that the EMS editors recommend following section “2.5 Remarks on Introducing New Building Types” in EMS–98 (Grünthal and others, 1998) to maintain the foundational ideas leading to the existing vulnerability table.
It will also be valuable to compare any independent, previously assigned EMS–98 intensities to those made considering the additional building types in the United States. Such data may be available from earlier work done by the EMS core group by applying EMS principles to the 1994 Northridge earthquake data, among others.
Available Building Damage Data in the United States and New Zealand
At the October 2022 IMS Workshop, Keith Porter noted the three general desired characteristics of building types of interest for macroseismic observations. They should be plentiful, and neither very fragile nor very rugged.
They are plentiful owing to both knowledge and value. To assign a macroseismic intensity to a place after an earthquake, one must be able to find buildings of the types described here, with whatever damage and whatever attributes matter to assigning a vulnerability class; this is the knowledge reason. Next, the scale should improve people’s lives by helping them to manage the seismic risk to the buildings in which they work, play, learn, and live. The larger a fraction of the building stock this scale applies to, the more it will help improve people’s lives; this is the value reason.
Building types for macroseismic observations should be neither very fragile nor very rugged because building types at either extreme provide little knowledge. At one extreme, a very fragile building type would suffer great damage at very low levels of shaking and only tell scientists that an earthquake has occurred, and that observation would be redundant and uninformative. At the other extreme, a very rugged building type might suffer little if any damage in most earthquakes, which is also uninformative.
These three desired characteristics can be at odds if most of the buildings are very rugged or very fragile. So, the foregoing rules merely help to prioritize which building types are characterized first.
Postevent Damage Assessments in the United States
At the October 2022 IMS Workshop, Keith Porter also discussed the possibility of using existing ATC–20 building tagging as a source of data and a potential choice of building taxonomy for structures in the United States. Most earthquake-damaged buildings in the United States get evaluated for safety using the ATC–20 methodology. The ATC–20 data are either a one-page rapid evaluation form (fig. 10) or a two-page detailed evaluation form (fig. 11A–B). The data contain location, building type, a description including occupancy, five or more evaluation criteria, and a building safety evaluation usually called a tag color: red (unsafe), yellow (limited entry), or green (inspected).

“Applied Technology Council-20-1 (ATC-20-1) Rapid Evaluation Safety Assessment Form” (Copyright by ATC, 2005; used with permission). ID, identification; %, percent.
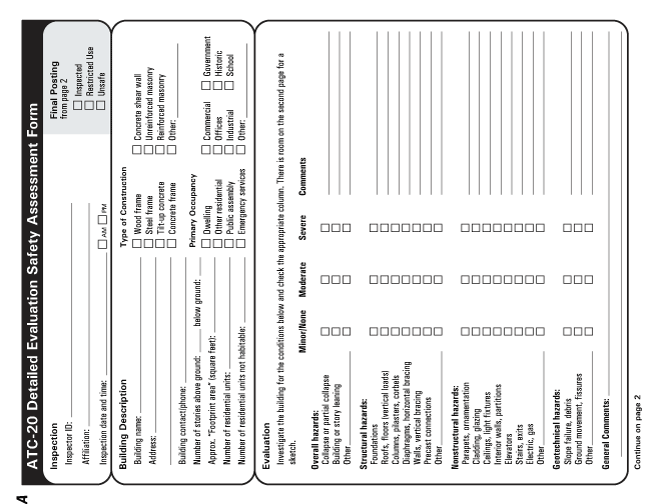
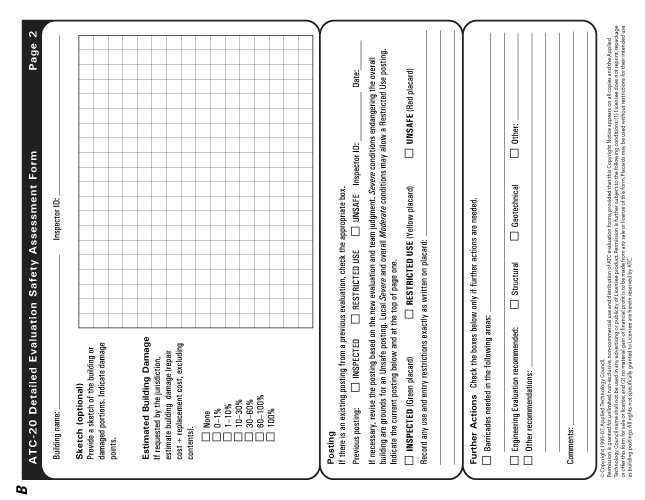
“Applied Technology Council-20 (ATC–20) Detailed Evaluation Safety Assessment Form” (Copyright by ATC, 2005; used with permission). ID, identification; ÷, divided by; %, percent.
If one must choose between the two forms for EMS–98, the rapid form is likely the better choice, owing to the quantity of observations and sampling bias. More data per observation (the detailed form) seems better, but only if one can get the additional data. Approximately 99 percent of buildings evaluated after earthquakes with ATC–20 get rapid evaluations. The 1 percent that get detailed evaluations tend to be mostly critical facilities and a few yellow-tagged buildings with ambiguous damage. Both factors introduce sampling bias.
Eguchi and others (1997) compiled a database of 117,000 buildings that were tagged after the 1994 Northridge earthquake. The authors constructed the database so that the ATC–20 rapid and detailed evaluation forms used to tag those buildings could be transcribed and saved. However, that database suffered from two fatal flaws. First, because it contained personally identifiable information, the California Governor’s Office of Emergency Services repeatedly declined to make it publicly available for analysis, even though the personally identifiable information could be removed.
Second, the effort of manually transcribing paper forms proved too demanding for the cities that were compiling them. They tended to save only the address and the tag color. The crucial data needed here were mostly lost: building type and the evaluation criteria used to assign the tag color. The same proved true 20 years later in the 2014 South Napa, California, earthquake when Keith Porter acquired Napa’s unpublished electronic data, despite the data having the same sort of personally identifiable information. Again, it contained addresses, tag color, and in many cases a single text field describing damage, but no information about building type or record of the evaluation criteria.
Both those databases reflect the loss of valuable, perishable information. Applied Technology Council–20 data can in principle inform EMS–98, but only if the knowledge of building types and evaluation criteria survive the loss of the paper forms.
For instance, “ATC–20-3: Case Studies in Rapid Postearthquake Safety Evaluation of Buildings” (ATC, 2005) addressed in detail the key structures that could constitute the initial list of U.S. structures missing from the EMS–98 vulnerability table. Applied Technology Council–20–3 covers the following:
-
• Wood frame single-family dwellings
-
• Multiunit wood frame dwellings
-
• Unreinforced masonry buildings
-
• Older concrete buildings
-
• Tilt-up buildings
-
• Older steel frame buildings
-
• Modern and difficult-to-classify buildings
Of note, ATC–20-3 also has a chapter “Damage That Is Difficult to Detect” (chap. 14, ATC, 2005), which may be of interest if the application of nonvisible and nonstructural damage is considered as a supplement to standard damage assessments in EMS–98.
The advantage of using ATC–20 is in using the observable damage measures and mapping to damage grades in EMS–98. However, at the workshop, it was noted that whereas the ATC–20 “Detailed Evaluation Safety Assessment Form” (fig. 11A–B) would be potentially adequate for damage grade determination per structure, the summary color-coded tagging results alone were inadequate for such assignments. Some key disconnects between tagging colors and damage include the fact that red tags can be assigned for undamaged structures nearby or in the collapse shadow of nearby damaged structures. Moreover, the three-level system for tagging (green, yellow, red) cannot be easily mapped to standard EMS–98 damage grades, unless they are subdivided in some sensible way, such as dividing red tags into red-tagged buildings with collapse (say, damage grade 5) and those without (damage grade 4), and yellow tags with some greater degree of damage (damage grade 3) or lesser (damage grade 2). Such an approach is proposed here and illustrated for three building types in the United States. The additional information (collapsed or not, degree of damage in the yellow-tagged buildings) requires knowledge of the evaluation criteria.
Another data source, ATC–38 (ATC, 2000) offers a protocol to collect a variety of building attributes and damage observations at all the buildings within a given distance of a strong-motion instrument. It has been applied twice, once after the 1994 Northridge earthquake and once after the 2014 South Napa earthquake. Data from both events have survived: 530 records from the 1994 Northridge earthquake and 73 records from the 2014 South Napa earthquake. The ATC–38 data can provide rich information about building construction, ATC–20 tag color, and several descriptions of the damage. It is costly to apply, however, and is unavailable for most earthquakes.
Postevent Damage Assessments in New Zealand
Data available for EMS–98 assignments and calibration for New Zealand are dominated by the most recent events for which detailed inventories and damage databases were acquired. During the Canterbury earthquake sequence 2010–11 in New Zealand, various government organizations, including the Christchurch City Council (CCC) and the Canterbury Earthquake Recovery Authority (CERA) were involved in evaluating building safety. The purposes and extents of the surveys differed amongst the organizations. For example, rapid building safety assessment information was coordinated by CCC, engineering evaluations were instructed by CERA, and lists of buildings recommended for demolition were compiled and maintained by CERA. The aims and scopes of the surveys carried out are discussed briefly in the following paragraphs (table 7).
Table 7.
2010–11 Canterbury, New Zealand, earthquake sequence building damage data collections.Rapid Building Safety Evaluation
As mentioned above, the CCC completed postearthquake building safety evaluations as per the guidelines developed by the New Zealand Society for Earthquake Engineering and endorsed by the Department of Building and Housing (now the Ministry of Business, Innovation and Employment; New Zealand Society for Earthquake Engineering, 2009). The Christchurch Earthquake “Rapid Assessment Form” (similar to the ATC–20 postearthquake evaluation form; ATC, 2005) was designed and used to evaluate building damage and to guide the allocation of warning placards. The purpose of the rapid inspection was to identify buildings that were unsafe to occupy.
The inspections included initial level 1 rapid assessments and more detailed level 2 assessments. A level 2 assessment was required on all critical facility buildings, large (typically multistory) buildings, and any other buildings where level 1 assessment identified the need for detailed inspection. The full rapid building safety (RBS) evaluation level 1 and level 2 assessment forms can be found in appendix 3.
Level 1 and level 2 assessment forms were designed to capture fundamental building and damage data including location; structural type; use category; overall hazard or damage (possibility of collapse or partial collapse, leaning, structural damage, overhead falling hazard, ground deformation, and hazard from building services); and repair, reconstruction, and (or) demolition recommendations. Structural damage was grouped into damage to foundations, roofs and floors, columns, bracings, connections and beams, and damage to nonstructural elements such as parapets, claddings, ceilings, partitions, elevators, stairs, and utilities. Geotechnical damage or ground deformation was also assessed for slope failure, ground movement, and liquefaction. All damage attributes were captured in a somewhat qualitative manner by ticking “minor,” “moderate,” or “severe.” Based on these damage evaluations, engineers would estimate the building’s overall damage ratio in percentage terms and assign a hazard (placard) rating (green for “inspected,” yellow for “restricted use,” or red for “unsafe”).
Detailed Engineering Evaluation
Following the completion of the rapid assessments, the detailed engineering evaluation (DEE) process was initiated. A “Detailed Engineering Evaluation Summary Data” form, designed by the Department of Building and Housing Engineering Advisory Group (Engineering Advisory Group, 2011) was used to collect information about structures that may have been affected by the earthquakes. Owners of nonresidential and multiunit or multistory residential buildings in the Canterbury area were instructed by CERA to have the DEE completed before being permitted to re-enter their buildings.
The main purpose of the DEE was to support the identification of earthquake damage and the assessment of its effect on the building’s future performance. Hence, in addition to the basic building attributes required in the rapid assessment, such as location, height, age, and use category, the evaluation required descriptions of site conditions and structural characteristics (in other words, construction materials, structural systems, and estimated periods), identification of structural weaknesses, details of earthquake damage (including structural, nonstructural and geotechnical components, and placard tagging), evaluation of building performance before and after earthquakes, likely repairs required, and recommendation. Three placard indicators—green, yellow, and red—were used in the DEE. A percentage of New Building Standard was calculated and used to evaluate the building’s residual capacity. A DEE summary sheet is given in appendix 3. In addition to the above summary sheets (in spreadsheet-based form), other detailed reports related to the inspected buildings were also requested by CERA. Such detailed reports, which could differ in extent and format depending on the building’s complexity, might include structural and (or) geotechnical inspections, building capacity calculations, structural weakness assessments, and so forth.
Demolition List
Buildings in Christchurch, which were first damaged by the September 4, 2010, earthquake, deteriorated further in the ongoing aftershocks. To make Christchurch safe in the immediate aftermath of the February 2011 earthquake, the Ministry of Civil Defense and Emergency Management (New Zealand’s emergency management agency) requested that commercial buildings within the Christchurch central business districts’s red zone be assessed. Dangerous buildings were identified and either fully demolished, partially demolished, or made safe. Following the Ministry of Civil Defense and Emergency Management, CERA continued this building demolition management (from May 1, 2011). Data fields contained in the publicly available demolition list include building location, name, heritage status, and treatment information.
Overview of the Available Building Assessment Data
The original RBS data were in paper-based form and were collected by the CCC. An initial RBS database (in spreadsheet form) containing the rapid inspection data was created after considerable resources and effort were put into digitizing the paper records. Furthermore, photos of building damage that had been taken during the rapid inspections were correlated with individual buildings. A hyperlink was added to each building’s record to allow examination of the observed damage. The final RBS database contained 7,212 unique building assessment entries. The data fields have been discussed previously and are detailed in appendix 3.
As mentioned previously, the submission of spreadsheet-form DEE summaries was mandatory for the inspection engineers. Despite the electronic and standardized format, additional effort was required to compile all CERA-provided DEE summary spreadsheets into a master DEE database that contained all buildings with DEE inspection data. Furthermore, additional effort was conducted to correlate all available detailed assessment reports with individual buildings. A hyperlink was added to each building’s record to allow exploring all available reports and inspection histories. The DEE database contains 3,677 unique building entries. Fields in this database have been discussed previously and are detailed in appendix 3.
Finally, the demolition list is publicly available and can be downloaded in spreadsheet format from the CERA website; hence, only a minor effort, namely assigning each building a unique identifier, was needed to create the demolition list database. The demolition list database contains 1,516 unique building entries.
In addition to the above postevent survey organized by government agencies, two systematic surveys are conducted by nongovernment research agencies, namely the unreinforced masonry (URM) and timber house databases of the University of Auckland (Moon and others, 2014) and the Building Research Association of New Zealand (Beattie and others, 2015) database. In the URM database, more than 600 URM buildings are listed, with attributes (for example, age, materials, location, and so forth) and observed damage during various events (for example, September 2010; February, June, and December 2011). Similarly, in the Building Research Association of New Zealand database, more than 300 houses in the Christchurch area were surveyed. Most of them are timber houses, although age, materials, number of stories, and observed damage were also recorded. All these postevent damage datasets are planned to be compiled and used to assign Macroseismic Intensity for both Darfield (September 2010) and Christchurch (February 2011) events.
When assigning intensities, in addition to the above damage information, we also need to have the building portfolio of the areas (in other words, the undamaged building characteristics, namely vulnerability class). In New Zealand, through the RiskScape programme, there is a national building portfolio database. The 2010 and 2011 Christchurch building portfolio (pre-event) is planned to be prepared and used when conducting macroseismic intensity assignment exercises for Darfield and Christchurch earthquakes.
Improving Damage Data Collection in the United States and New Zealand
During postearthquake evaluations in the United States, neither seismologists nor engineers specifically focus on macroseismic assignments, in part because of the success of DYFI. We envision standards for refining postearthquake macroseismic collection in the United States and in New Zealand by soliciting and utilizing engineering expertise that is already in place for postearthquake building damage assessments. Such postevent macroseismic data collection standards and protocols are planned to be a key focus of the second Powell Center workshop in October 2023.
Postearthquake Field Surveys and Macroseismic Intensity Assignments
We expect that field inspectors—typically either civil engineers, architects, or those trained on the subtleties of ATC–20 (ATC, 2005) or other inspection standards—could contribute their data for automatic intensity assignments consistent with EMS–98. One of our authors, Ayse Hortacsu, with the Applied Technology Council (ATC), has led the development of more than 35 guidelines, tools, and project reports. Ayse Hortacsu served as the project manager for the development of “FEMA P-154” (Federal Emergency Management Agency [FEMA], 2002) “Rapid Visual Screening of Buildings for Potential Seismic Hazards” and the adaptation of the ATC–20-1 “Postearthquake Safety Evaluation Procedures” (ATC, 2005) for the country of Bhutan, and is currently leading the update of the ATC–20-1 “Field Manual” for the United States.
The Powell Center IMS Working group proposes that most aspects of these ongoing inspections, with minor modifications, could be used to help assign EMS–98-like intensities with proper guidance and documentation on vulnerability class, damage grades, and statistical sampling. As mentioned, these need only be done in the more limited high-intensity areas where damage is prevalent and thus where DYFI assignments are not well constrained. As described in the section “Quantifying Uncertainties,” uncertainty assignments of each macroseismic dataset (or observation) would allow the use of DYFI up to MMI VII, and then taper off their influence in ShakeMap by downweighting higher intensity DYFI data in comparison to engineering-based assessments; the latter would get full weighting where and when they are provided, allowing for the best possible quantitative representation of the shaking distribution for any earthquake.
We also plan to engage colleagues at FEMA, for whom multitudes of postearthquake preliminary damage assessments are done for the purpose of loss disbursement, the data from which could readily be utilized for intensity assignments with the right protocol and tools. Necessary protocols include sampling strategies for where to collect building damage data (similar to the approach in ATC–38 to evaluate all buildings within a 1000-foot radius of a seismic sensor) and standardizing which damage characteristics to collect (for example, Loos, Lallemant, and Wald, 2022).
The Powell Center IMS Working Group thus aims for better strategies for such assignments by tapping into existing postearthquake building inspection (tagging) protocols such that engineers could effectively assign intensities as a byproduct of their surveys. As an example to emulate, in Italy, the recent collaboration between the INGV and the National Fire Department facilitated the exchange of macroseismic data in real time. Reports from National Fire Department technicians, who immediately carry out technical inspections of buildings affected by the earthquake, are planned to be integrated with the existing data survey system by the INGV group Quick Earthquake Survey Team, or QUEST. A review of existing approaches to collect macroseismic intensity data on the ground, such as Italy’s example, is beneficial.
As part of this second task, we will also further make the case for expanded data collection protocols, using imagery-based reconnaissance data into an organized standard for automatically assigning intensities. We have experience in this realm, and we have identified that the main barrier to utilizing such remotely sensed data directly is the lack of protocol for turning critical remotely sensed observations into quantifiable and useful data. The protocols for assigning EMS–98 in its revised form (to be developed herein) can anticipate these important uses—working with rapid imagery was not an option when the original developers of EMS–98 developed the scale in the late 1990s.
As is evident through the multiple entities involved in postearthquake damage data collection (emergency managers, engineers, civil protection, and others), several building assessment teams visit affected areas to collect data, sometimes overlapping data or with varying building damage scales (such as ATC–20 or EMS–98). An added benefit of leveraging existing mechanisms for damage data collection for macroseismic intensity assessment is that it could lead to more coordinated and synthesized efforts for building damage data collection, ideally by local inspectors and for official applications (for example, Loos, Lallemant, and Wald, 2022). Although reaching this goal globally is ambitious, developing strategies in the United States and New Zealand to coordinate building damage data collection between reconnaissance, local officials, and organizations like the USGS is a useful step.
A Note on Internet- and Remote Sensing-Based Intensity Assignments
As noted, automatically and rapidly collected macroseismic data are extremely valuable for immediate postearthquake situational awareness, geospatial shaking (for example, ShakeMap), and damage analyses. Although popular systems like USGS “Did You Feel It?” (DYFI) enable community members to contribute abundant observations, the divergence of traditional assignments and automatically contributed reports has resulted in a host of unique challenges. We have described in detail the need for professional intensity assessments for damaging intensity levels. However, other concerns need to be addressed when considering internet- and remote sensing-based intensity assignments in conjunction with a future IMS.
Internet-based access to media, social media, and reconnaissance reports and photos have the potential to document earthquake effects needed for macroseismic analyses from afar (for example, Martin and others, 2015). With care, these reports can be used for rapid assignments needed for ShakeMap and reconnaissance missions and response and recovery. However, such remote assignments can add uncertainty because EMS–98 requires statistical sampling, not just individual building observations (for example, Tertulliani and others, 2016); yet, with sufficient observations, expert assignments can be successfully made (for example, McGowan and others, 2017). Another avenue only recently explored is the strategy for damage detection using remotely sensed imagery. Although early in development, rapidly evolving datasets may allow assigning EMS–98-like vulnerability class and higher damage grades (for example, Hadidian and Schwarz, 2022).
The latest innovation is to supplement internet-based data collection with convenient-to-use cartoons that readily allow cellphone-based users to select their intensity among images, as done by the European-Mediterranean Seismological Centre (EMSC; Bossu and others, 2017) and New Zealand’s GNS Science (Goded and others, 2017a, b). Although this picture-based approach increases access and response rates considerably, these data should not themselves be considered macroseismic data in the traditional sense. Although nearly instantaneous, these selected intensities lack supporting documentation, limiting deeper analysis. Nonetheless, remotely sensed intensity assignments and internet-based LastQuake testimonials (Bossu and others, 2017) have value in their accessibility, abundance, rapidity, and widespread global availability. However, if these data are used quantitatively, their uncertainty would need to be properly characterized and considered (refer to Quitoriano and Wald, 2022).
In terms of data uniformity, another important aim is to help harmonize the use of both internet- and field-based approaches by considering and documenting best practices, while also characterizing uncertainties when used quantitatively. This aim is consistent with the 2021 findings of the “European Seismological Commission Working Group on Harmonizing Internet Macroseismology” (De Rubeis, 2021). The Working Group’s approach focused on statistical and spatial analyses, using data provided by scientific institutions in multiple countries, and international data from the USGS DYFI and EMSC LastQuake systems. Similarly, DYFI (or any macroseismic) assignments can vary at a given locality simply because of differences in the size of the area over which effects are considered or averaged (Quitoriano and Wald, 2020). A proper accounting for uncertainty as a function of resolution and scale is warranted.
Strategy for Moving Forward with an International Macroseismic Scale
It was decided that the United States and New Zealand should initially work separately under the auspices of USGS external funding (now named as project ATC–158), and then report back. This work is planned to continue during the fall of 2022 and winter of 2023 and to be followed by plans for United States and New Zealand implementation of EMS–98 along with larger recommendations for IMS. In addition to the ATC–158 project, we envisioned continuing IMS Working Group efforts with the following meetings.
Subsequent Workshops
A roadblock to the organization of the type of collaborative effort needed to further IMS development has been challenges in gathering important players and setting aside time to conduct the necessary work in an intimate-enough setting that all partners involved can focus on the goals of the project. The Powell Center provided a means for collaborative effort, such that important players could gather and discuss and refine priorities, define action items, and ultimately begin to implement and build a consensus-based IMS.
Agreement of the first workshop participants was to (1) organize the second Powell Center in the fall of 2023 (the IMS working group funded proposal included two international workshops, roughly a year apart) and (2) convene a small Working Group meeting of the primary EMS–98 participants in the interim, in Germany, in the summer of 2023.
EMS–98 Principals, Germany, Summer 2023
The intent of the small Working Group meeting in Germany would be to allow face-to-face time (or facilitating remote attendance, as needed) for Roger Musson, Robin Spence, Jocen Schwarz, Gottfried Grünthal, David Wald, and Thomas Wenk. We anticipate the meeting to be held in Potsdam, Germany, hosted by GeoForschungsZentrum (GFZ). Primarily, this meeting would consider (1) establishment of a permanent IMS Steering Committee, (2) determination of strategies for facilitating new country additions to IMS, both in advising national entities and writing country-specific supplements to the IMS documentation, and (3) development of a framework for providing endorsement and promotion toward the long-term success of an IMS and macroseismology more generally.
The goals of the second Powell Center workshop would be to evaluate any feedback resulting from having presented the recommended United States and New Zealand EMS–98 modifications and to present the proposed modifications to each nation’s scientific, earthquake-engineering, and user communities. This would entail, potentially, developing the communication, outreach, and implementation strategies to inform these communities about the goals and benefits of a switch from MMI to IMS. Recall, new field-based methods would be needed for assigning high intensities (complementing community-based intensities used for lower levels). So, we plan to address issues related to IMS dissemination, outreach, and uptake. Many of our anticipated participants play key roles on these fronts in their respective organizations and nations.
The adoption of a regionalized EMS–98 in the United States and facilitating the assignment of higher intensities by leveraging engineering damage surveys would require comprehensive documentation and community acceptance along the lines of those done for EMS–98. We plan to leverage experience at the Applied Technology Council (ATC), whose earthquake engineering reports become the basis for procedures used in U.S. engineering and reconnaissance practices.
Applied Technology Council–158 Project, Summer 2023
The Applied Technology Council (ATC) is conducting the ATC–158 project with funding by a USGS external grant in fiscal year 2022 with the scope to augment EMS–98 with regional building classes and damage grades for New Zealand. This work is planned to continue during the last quarter of 2022 and first quarter of 2023 and the results will be documented in a final report.
Second International Macroseismic Scale Powell Center Working Group Workshop, October 2023
The goals of the second Powell Center workshop are to discuss communication, outreach, and implementation strategies for IMS with each nation’s scientific, earthquake-engineering, and user communities. A prerequisite for the second workshop is a rough accounting of the regions or nations around the world that have applied EMS–98 for their own macroseismic assignments. Some assessment of the suitability of the mapping of local structures to EMS–98 vulnerability classes may be required. It would also be useful to catalog the nature of the assignments, whether they are done remotely or by field investigations, and the degree of expertise and training supplied. It is anticipated that several regional macroseismic experts will join the second workshop to begin understanding unifying EMS–98 strategies toward a more uniform IMS.
The presentations are planned to also include documented results from the ATC–158 project, findings from the group meeting with EMS–98 principals, and discussions on benefits of switching from MMI to IMS to these communities.
The following topics also are planned to be addressed:
-
• New field-based methods are needed for assigning high intensities (complementing community-based intensities used for lower levels). So, we plan to address issues related to IMS dissemination, outreach, and uptake. Many of our anticipated participants play key roles on these fronts in their respective organizations and nations.
-
• There are international challenges to leveraging (1) crowdsource (citizen science) -based macroseismic data collection (for example, DYFI; LastQuake, Bossu and others, 2017; MyShake, Allen and others, 2020), (2) remotely sensed damage detection assignment to IMS, and (3) engineering building tagging and reconnaissance crews (for example, Earthquake Engineering Field Investigation Team, Earthquake Engineering Research Institute, [EERI], National Science Foundation-funded Structural Extreme Events Reconnaissance [StEER]) and damage assessors (for example, insurers, FEMA Public Assistance inspectors) to participate in standardized, postearthquake damage evaluations with a consistent methodology, goal, and data portal. Our international participants can help attest to the U.S. seismological, response, and engineering communities that adopting IMS is in all our best long-term interest.
Additionally, ongoing efforts by the IMS Powell Center principal investigators to engage the community prior to meeting in the fall of 2023 can help facilitate accomplishing the goals of that workshop. For instance, discussions with StEER—a National Science Foundation-funded network of academic researchers focused on structural extreme events reconnaissance—and the Earthquake Engineering Field Investigation Team of the Institution of Structural Engineers (headquartered in the United Kingdom) indicated that reconnaissance team leaders plan to continue their aim to modify their postevent damage collection protocols to be directly useful for IMS intensity assignments.
In fact, StEER’s rapid response to the M7.2 August 2021 Haiti earthquake provided an example of the potential for field teams who are doing damage assessment to contribute to intensity assignments (Kijewski-Correa and others, 2022). In this case, because of COVID-19 restrictions and serious in-country security concerns, all work was done by local Haitians, so StEER provided an “Assessment Guide for StEER Rapid Response” (StEER, 2021a) and an accompanying slide deck (StEER, 2021b) by Eduardo Miranda (Stanford University) and Tracy Kijewski-Correa (University of Notre Dame). The on-the-ground teams used USGS DYFI forms (in Haitian Creole and French), which the USGS could then add to their online database and use in ShakeMap. They also followed the protocol outlined by StEER (2021b) to collect and assign damage data based on EMS–98 damage grades that could later, in principle, be assigned with EMS–98 intensities with sufficient expertise. However, whereas the predominant Haitian structural types were well described by StEER (2021a, b), they were not assigned EMS–98 vulnerability classes for perhaps the same reasons that EMS–98 vulnerability classes are not directly applicable in the United States and New Zealand. In all, the 2021 Haiti earthquake StEER damage data are of great value (Kijewski-Correa and others, 2022). The DYFI intensities, however, are based on observations submitted using the DYFI online questionnaires, which we have described as being only partly valid at high intensity levels. There is immense opportunity to leverage remote assessments, such as those done through StEER’s rapid response, as an important way to further enable local surveyors to lead their own damage data collection, and then synthesizing and standardizing it for intensity assignment.
The GEM Foundation is another fundamental user and proponent of macroseismic intensity, and an advocate of an IMS more generally (V. Silva, oral commun., December 2022). Efforts of the GEM Macrocseismic Working Group—led by Robin Spence—led to many of the documents described in this document, but reorganization of priorities and funding mechanisms within GEM led to reducing the priority of this group’s efforts.
However, it is anticipated that our IMS efforts can be complemented and done collaboratively with GEM because their global reach and interactions with in-country professionals in many nations often relate to developing building inventories, assigning vulnerability classes or functions, and collecting damage datasets. Often, ground motion data for historical events are lacking, and so the connection between the demand and losses is tied together via reported macroseismic intensities. The ShakeMap strategy for constraining shaking from historical earthquakes allows conditioning of the shaking distribution with intensity observations, yet it suffers from a lack of uniform practices and scales for macroseismic assignments.
The use of historical events for vulnerability class and functions, and calibrating loss models, would be greatly facilitated by systematic approaches to assigning intensities with an IMS. Many nations outside Europe have informally adopted EMS–98 yet would benefit from more standardized strategies along with a mechanism for validation and approval. We expect GEM participation in the second Powell Center IMS workshop in 2023, and via meetings leading up to the early October workshop, would be vital in expanding the implementation and utility of an IMS worldwide.
Unaddressed Issues: Avenues for Related Research and Development
Several potential related research topics and opportunities presented themselves at the workshop, which we have further described in this document. The participants considered that a second workshop would be a suitable opportunity for followup on these topics.
Web-based Assignments of Lower Intensities
From the analysis of numerous “Hai sentito il terremoto?” web-based macroseismic questionnaires, INGV proposed improvements to the EMS Scale for effects on people and objects to better constrain lower intensities, which could be included in the IMS Scale. Recent studies enabled floor and building effects to be quantified, demonstrating that intensities experienced in buildings are affected by the floors (Sbarra and others, 2012; Sbarra and others, 2015). Specifically, the maximum variation in intensity between the highest and lowest floors was determined to be a half degree of the Mercalli-Cancani-Sieberg (MCS) Scale.
This is lower than that expected by Grünthal and others (1998, p. 29), which prescribed “reducing the assigned intensity by one degree for [buildings with] so many floors.” Moreover, Sbarra and others (2014) reported that people’s physical situation (sleeping, at rest, and in motion) has more weight on earthquake perception than observer’s location (higher floors, lower floors, and outdoors). Based on their results, as a first approximation, Sbarra and others (2014) proposed to change the wording “indoors” with “at rest” and the word “outdoors” with “in motion” in the description of the EMS–98 Scale.
The quantification of effects on humans and objects is key to reducing the subjective component in macroseismic intensity assessment (Sbarra and others, 2020) at lower intensities. Analysis of the frequency associated with each diagnostic effect by Tosi and others (2017) also suggests omitting (or at least critically revising) the oscillation of hanging objects and liquids as diagnostics, to ensure a magnitude-independent scale.
Although updating the collection or processing procedures over time can be beneficial as expressed in Tosi and others’ (2015) quotation above, updates over time can lead to a discontinuity in datasets, which presents potential conflicts with one of the benefits of macroseismic data: its long-time window into the world of earthquake occurrence and effects. Some innovative strategies have emerged to provide continuity and modernization, and one example is INGV’s approach of assigning both MCS and EMS–98 values for internet-based assignments (Tosi and others, 2015). The USGS initially correlated DYFI with MMI in its initial development (Dengler and Dewey, 1998; Wald and others, 1999), but a revision of practices regarding an EMS–98 implementation is not planned without due consideration of continuity of assignments.
Quantifying Uncertainties
For real-time ShakeMap operations, dense, low-cost accelerometer deployments are anticipated to continue (the Community Seismic Network, for example; Filippitzis and others, 2021), and such data can be included in ShakeMaps using existing techniques for converting peak ground motion data to instrumentally derived intensities (Worden and others, 2020). As with uncertain macroseismic data, lower quality class C (micro electro-mechanical sensors, or MEMS, for example) could still be utilized in ShakeMap as long as each station is accompanied by uncertainty measures (Worden and others, 2018).
A critical aspect of our overall strategy is our aim to add uncertainty (sigma) assignments to each macroseismic dataset based on its source. For example, DYFI data sigmas are quantitively described by the number of user responses in each area (Worden and others, 2012). The Powell Center Working Group can assign expert-opinion default sigma values to other traditional datasets and establish protocols for assigning them to our new (nontraditional) approaches mentioned above. Why are uncertainties so important? The ShakeMap system, which utilizes both seismic stations and macroseismic data, geospatially interprets these data using a multivariate normal distribution (Worden and others, 2018) that explicitly requires data uncertainty to properly characterize the complex shaking pattern that drives earthquake response and loss estimates. Proper interpolation requires weighting instrumental and macroseismic data appropriately, according to both their relative distance (via spatial semivariograms) and their inherent sigmas in the interpolation algorithm (a nugget effect).
The DYFI procedure has proven fully sufficient for collecting intensity data at low and moderate intensities, but at and above DYFI intensity VII, the DYIF intensities become more uncertain (Quitoriano and Wald, 2022). Although uncertain, in the immediate postevent aftermath, internet intensities can still be valuable if their uncertainties are quantified.
For any data, ShakeMap weighting allows the use of DYFI up to MMI VII, and then taper off their influence in ShakeMap by downweighting DYFI data in comparison to engineering-based assessments; the latter will get full weighting where and when they are provided, allowing for the best possible representation of the shaking distribution for any earthquake.
Combining Datasets for ShakeMap
Combining datasets for ShakeMap (or other quantitative uses) could be accommodated (Wald, Quitoriano, and others, 2022) with the following strategy:
-
• Lower intensities (less than VII) are automatically used by internet-based acquisition with uncertainties assigned as a function of number of responses. Initial quantification for at least DYFI and EMSC felt reports has been reported by Worden and others (2012) and Quitoriano and Wald (2022).
-
• Higher intensities (greater than or equal to VII) collected via citizen science require heteroskedastic uncertainties assigned as a function of intensity, with higher intensities having larger uncertainties.
-
• For higher intensities (greater than or equal to VII), expert assignments are needed. Because these are slower than online collections but have lower uncertainties, when they do become available, their relative contributions to any ShakeMap interpolation will be higher than DYFI or EMSC unless they are very low in number.
-
• Thus, internet intensities up to VII will be important, higher values will be used temporarily, and their influence will taper off in terms of their influence in ShakeMap when expert assignments are acquired.
-
• Engineering-based intensity assignments would get full weighting where and when they are provided, allowing for the best possible quantitative representation of the shaking distribution for any earthquake.
Other Inherent Uncertainties in Assigning Macroseismic Intensities
Another challenging concern is how to assign uncertainties for historical and modern assignments with limited observations and insufficient sampling (for example, photo or media accounts). Specifically, the group acknowledged but deferred addressing the following:
-
1. How to best define the areal extent for modern assignments, where geocoding is ubiquitous
-
2. How to propagate uncertainty because of observers’ concerns of the variability or appropriateness for specific building class assignments
-
3. How to propagate uncertainty because of challenges in assigning a damage grade
-
4. How to systematically assign uncertainties to historical observations in hindsight (for example, concerns discussed by Hough, 2014)
-
5. Quantifying uncertainties based on differing levels of expertise with EMS–98 assignments
Damage Costs and Loss Ratios
To make the IMS Scale applicable for loss and other insurance applications, a valuable yet not-ready-for-use aim with EMS–98 damage grades would be to explicitly quantify loss ratios associated with each damage grade (with commensurate ranges or uncertainties). The workshop participants noted that it would be extremely valuable to review and summarize current practice to define loss ratios and to propose a new set of loss ratios and uncertainties for each damage grade and building type.
Accommodating Damage to Additional or Nontraditional Structures (to EMS–98)
Some discussion ensued at the workshop concerning additional types of structures not considered in EMS–98 and nonstructural damage. We summarize the issues and how these elements might be used and updated in EMS–98.
Nonstructural Damage
One question was if EMS–98 used the best approach for using nonstructural damage by keeping the contents as a reality check, rather than an indicator that is relied on because it is often difficult information to acquire. For example, immediately after earthquakes, particularly in commercial buildings, it is possible to observe a wide range of nonstructural and contents effects. How such observations could be quantified sufficiently to contribute to intensity assignments might require considerable study. Other considerations include the following:
-
• Contents behavior depends on structural types and floor level because the shaking period changes based on structural period, height, and floor level.
-
• Contents effects can be ephemeral because of potential quick cleanup. Photographic evidence would be key.
-
• Nonstructural architectural elements like cladding, ceiling panels, glazing, and other nonstructural elements are indicators of damage; in light timber framing, broken interior or exterior effects, including glazing, would need to be considered.
Manufactured Homes
Damage to residential communities from earthquakes in the United States often entails losses to manufactured homes, also referred to informally as “mobile homes.” Damage to manufactured homes has been well studied (for example, Maison and Eidinger, 2022), yet its use in an IMS would require a vulnerability class, and distinguishing between anchored, foundation or slab, and other commonalities. Such manufactured homes are not as common in New Zealand, and thus, assessing datasets and the establishment of vulnerability classes and damage grades would be contingent to the United States delegation.
Tall Buildings
The treatment of tall buildings would need to be updated to be suitable for high-rise structure types and modern construction practices. However, there were no recommendations on how to proceed on this front.
Earthquake-resistant Design
Substantial efforts to date by Spence and Foulser-Piggott (2015) recommended approaches for the consideration of vulnerability class modifiers for buildings with earthquake-resistant design. Spence and Foulser-Piggott (2015) suggested a conservative approach to the allocation of vulnerability class by allocating a building to the moderate ERD and high ERD category only where there is good evidence (from past earthquakes) of code compliance. The authors provide strategies for ERD vulnerability class modifiers for reinforced concrete frame and wall structures and for steel and timber frame buildings.
Existing Taxonomies
A consideration for broadening and systematizing building vulnerability classes would be to work in parallel with a newer building taxonomy. Nicodemo and others (2020) proposed modeling exposure and vulnerability from postearthquake survey data using a combination of the EMS–98 and GEM taxonomies. Their strategy included a score-based methodology, assigning the most likely EMS–98 building classes based on the observed GEM taxonomy building attributes.
Working Group Concerns
Some concerns noted but not fully addressed at the workshop included items related to authority, authorship, acceptance, adoption, adaptation, and the longevity of an IMS. We leave these concerns in the form of questions to ponder and return to in subsequent workshops.
-
• What is the best choice of publication for an IMS, and under whose auspices would an IMS be approved and endorsed (EERI, ATC, Seismological Society of America, International Association of Earthquake Engineers, International Association of Seismology and Physics of the Earth’s Interior)? These considerations are yet to be determined. There are associated policy issues, and copyright and ownership concerns, for such a global enterprise.
-
• How can we ensure the longevity of an IMS Working Group given retirements of many of the leaders in the field, and how can we engage the next generation of macroseismologists, future leaders, and macroseismology adherents who might fill these roles?
-
• What groups in the United States and New Zealand can best help facilitate macroseismic data collection by adjusting their current postevent protocols?
-
• For damage data collection, how can we find the balance between the need for accurate, detailed descriptions of building damage and the need for private and public entities to restrict personally identifiable information?
-
• What future strategies need to be used to facilitate IMS adoption by countries that have traditionally used other macroseismic scales?
-
• Long-term, it is anticipated that the progress of some developed countries toward safe structures and performance-based engineering may result in more types of buildings practically undamageable, rendering them poor indicators of shaking levels. How will macroseismology accommodate such developments? In the United States and New Zealand, should we even include well-engineered structures, even if at present they are low in number, because in the long run we will only have many more of these kinds of buildings?
Conclusions
Macroseismology plays an integral role in seismology and earthquake engineering as a key component in hazard and damage quantification. Macroseismology also serves as the primary data to tie earthquake occurrence and impact in the past with the present and future as an essential ingredient in hazard and risk analyses. The 2022 U.S. Geological Survey (USGS) Powell Center International Macroseismic Scale (IMS) Working Group identified the limitations of the current macroseismic practices in the United States and New Zealand in the process of noting similar and additional challenges internationally. In short, Modified Mercalli Intensity (MMI) has deficiencies compared to the modern European Macroseismic Scale of 1998 (EMS–98). Integrating crowdsourced and traditional macroseismic intensities has created greatly expanded datasets; however, without increasing the accuracy and utility of intensity data at damaging levels, and like other nations that do not use EMS–98, MMI assignments are not fully consistent with potential global standards (EMS–98).
The group met with an appreciation of the limitation and challenges of the current state of global macroseismology and aimed at addressing the necessary steps to revitalize efforts for a truly globally applicable IMS. Key steps identified in our workshop toward an IMS were as follows: (1) identifying and characterizing buildings in the United States and New Zealand that share similarities yet are missing from the existing EMS–98 vulnerability class tables, (2) assigning vulnerability class and damage grades (with diagrams) to apply the EMS–98 strategy in these countries, and (3) leaving a paper trail documenting the standard procedures needed to add new regional or national implementation of EMS–98 elsewhere to augment EMS–98 toward a true IMS.
As we described, the focus of IMS efforts for this work is on the United States and New Zealand. Naturally, a truly worldwide IMS would require additional regional modifications to EMS–98 and the integration and acceptance of such refinement by participating national representatives. Such efforts could be particularly challenging for revisiting scales in use in countries with less compatibility with EMS–98 than the MMI Scale. Of particular concern are scales in use in Japan, China, and Russia, for example. Such efforts are beyond the scope of this current effort, but we are offering a direction forward for a part of the globe.
A major roadblock to the organization of these types of efforts in the past has been challenges in gathering the important experts at the proper venue and setting aside time to conduct the necessary work in a setting in which all partners involved can focus on the goals of the project. The USGS Powell Center provided an opportunity where attendees could discuss and refine priorities, define action items, and ultimately begin to implement and build a consensus around an IMS. The meeting, the results of which are summarized in this paper, offered an opportunity to participate or provide insights on these and any other relevant macroseismic intensity concerns.
Macroseismic intensity is not going away; in fact, its use is being widely expanded as the hazard layer within key USGS real-time earthquake information products, including Earthquake Early Warning (for example, ShakeAlert), ShakeMap, “Did You Feel It?” (DYFI), Prompt Assessment of Global Earthquakes for Response (PAGER), and even in presenting long-term probabilistic seismic hazard maps in a friendlier format to nontechnical users. With this Powell Center workshop and subsequent activities outlined here, the USGS can be prepared to help develop macroseismic best practices both domestically and abroad. Doing so in a collaborative spirit, drawing experience and expertise from those who have led the field historically, has already been remarkably rewarding and productive.
References Cited
Abrahamczyk, L., Lang, D.H., and Schwarz, J., 2017, WHE-reports as a complementary database towards the development of an International Macroseismic Scale, in 16th World Conference on Earthquake Engineering, Santiago, Chile, January 9–13, 2017, [Proceedings]: World Conference on Earthquake Engineering, paper 3657, 12 p. [Also available at https://www.wcee.nicee.org/wcee/article/16WCEE/WCEE2017-3657.pdf.]
Abrahamczyk, L., Schwarz, J., Langhammer, T., Genes, M.C., Bikçe, M., Kaçin, S., and Gülkan, P., 2013, Seismic Risk Assessment and Mitigation in the Antakya-Maras Region (SERAMAR)—Empirical studies on the basis of EMS-98: Earthquake Spectra, v. 29, no. 3, p. 683–704. [Also available at https://doi.org/10.1193/1.4000163.]
Allen, R.M., Kong, Q., and Martin-Short, R., 2020, The MyShake platform—A global vision for Earthquake Early Warning: Pure and Applied Geophysics, v. 177, p. 1699–1712, accessed January 2021 at https://doi.org/10.1007/s00024-019-02337-7.
Atkinson, G.M., and Wald, D.J., 2007, “Did You Feel It?” intensity data—A surprisingly good measure of earthquake ground motion: Seismological Research Letters, v. 78, p. 362–368. [Also available at https://doi.org/10.1785/gssrl.78.3.362.]
Beattie, G.J., Shelton, R.H., and Thomas, G.C., 2015, Structural performance of houses in the Canterbury earthquake series: Judgeford, New Zealand, BRANZ Study Report SR327, Building Research Association of New Zealand, 37 p., accessed January 2023 at https://www.branz.co.nz/pubs/research-reports/sr327/.
Bossu, R., Landès, M., Roussel, F., Steed, R., Mazet-Roux, G., Martin, S.S., and Hough, S., 2017, Thumbnail-based questionnaires for the rapid and efficient collection of macroseismic data from global earthquakes: Seismological Research Letters, v. 88, no. 1, p. 72–81, accessed February 2021 at https://doi.org/10.1785/0220160120.
Celsi, R., Wolfinbarger, M., and Wald, D.J., 2005, The effects of earthquake measurement concepts and magnitude anchoring on individuals’ perceptions of earthquake risk: Earthquake Spectra, v. 21, no. 4, p. 987–1008. [Also available at https://doi.org/10.1193/1.2099047.]
Collich, G., Rosillo, R., Martínez, J., Wald, D.J., and Durante, J.J., 2020, Financial risk innovation—Development of earthquake parametric triggers for contingent credit instruments, in Durante, J.J., and Rosillo, R., eds., Natural disasters and climate change—Innovative solutions in financial risk management: Cham, Switzerland, Springer, SpringerBriefs in Economics, p. 1–13. [Also available at https://doi.org/10.1007/978-3-030-43708-4_1.]
Cooke, R.M., 1991, Experts in uncertainty—Opinion and subjective probability in science: Oxford, Oxford University Press, 321 p. [Also available at https://doi.org/10.1086/293541.]
De Rubeis, V., 2021, European Seismological Commission Working Group on Harmonizing Internet Microseismology in Europe, Third Year Activity Report (2020–2021), in 37th General Assembly of the European Seismological Commission [virtual event], September 19–24, 2021: European Seismological Commission Working Group on Harmonizing Internet Microseismology in Europe, 23 p.
Dengler, L.A., and Dewey, J.W., 1998, An intensity survey of households affected by the Northridge, California, earthquake of 17 January 1994: Bulletin of the Seismological Society of America, v. 88, no. 2, p. 441–462. [Also available at https://doi.org/10.1785/BSSA0880020441.]
Dewey, J.W., Hopper, M.G., Wald, D.J., Quitoriano, V., and Adams, E.R., 2002, Intensity distribution and isoseismal maps for the Nisqually, Washington, earthquake of 28 February 2001: U.S. Geological Survey Open-File Report 2002–346, 57 p. [Also available at https://doi.org/10.3133/ofr02346.]
Dewey, J.W., Reagor, B.G., Dengler, L.A., and Moley, K., 1995, Intensity distribution and isoseismal maps for the Northridge, California, earthquake of January 17, 1994: U.S. Geological Survey Open-File Report 95–92, 35 p. [Also available at https://doi.org/10.3133/ofr9592.]
Doi, K., 2011, The operation and performance of Earthquake Early Warnings by the Japan Meteorological Agency: Soil Dynamics and Earthquake Engineering, v. 31, no. 2, p. 119–126. [Also available at https://doi.org/10.1016/j.soildyn.2010.06.009.]
Dowrick, D.J., 1996, The Modified Mercalli earthquake intensity scale—Revisions arising from recent studies of New Zealand earthquakes: Bulletin of the New Zealand National Society for Earthquake Engineering, v. 29, no. 2, p. 92–106, accessed December 2022 at https://www.bulletin.nzsee.org.nz/index.php/bnzsee/article/view/603/580.
Dowrick, D.J., Hancox, G.T., Perrin, N.D., and Dellow, G.D., 2008, The Modified Mercalli Intensity Scale—Revisions arising from New Zealand experience: Bulletin of the New Zealand Society for Earthquake Engineering, v. 41, no. 3, p. 193–205, accessed December 2022 at https://doi.org/10.5459/bnzsee.41.3.193-205.
Eguchi, R.T., Goltz, J.D., and Bortugno, E., 1997, Real-time loss estimation as an emergency response decision support system—The Early Post-Earthquake Damage Assessment Tool (EPEDAT): Earthquake Spectra, v. 13, no. 4, accessed August 15, 2023, at https://doi.org/10.1193/1.1585982.
Engineering Advisory Group, 2011, Guidance on detailed engineering evaluation of earthquake affected non-residential buildings in Canterbury—Part 2—Evaluation Procedure, [revision 5]: New Zealand, Engineering Advisory Group, 91 p., accessed December 2022 at https://canterbury.royalcommission.govt.nz/documents-by-key/20111124.1178.
Erdik M., Şeşetyan, K., Demircioğlu, M.B., Zülfikar, C., Hancılar, U., Tüzün, C., and Harmandar, E., 2014, Rapid earthquake loss assessment after damaging earthquakes, chap. 2 of Ansal, A., ed., Perspectives on European earthquake engineering and seismology, v. 34 of Ansal, A., ed., Geotechnical, geological and earthquake engineering: Springer, p. 53–95. [Also available at https://doi.org/10.1007/978-3-319-07118-3_2.]
Federal Emergency Management Agency [FEMA], 2002, Rapid visual screening of buildings for potential seismic hazards—A handbook (2d ed.): Redwood City, Calif., Applied Technology Council, FEMA 154, 164 p., accessed January 2023 at https://www.fema.gov/sites/default/files/2020-07/fema_earthquakes_rapid-visual-screening-of-buildings-for-potential-seismic-hazards-a-handbook-third-e dition-fema-p-154.pdf.
Filippitzis, F., Kohler, M.D., Heaton, T.H., Graves, R.W., Clayton, R.W., Guy, R.G., Bunn, J.J., and Chandy, K.M., 2021, Ground motions in urban Los Angeles from the 2019 Ridgecrest earthquake sequence: Earthquake Spectra, v. 37, no. 4, p. 2493–2522, accessed December 2022 at https://doi.org/10.1177/87552930211003916.
Foulser-Piggott, R., and Spence, R., 2013a, Extending EMS-98 for more convenient application outside Europe I: Review of field experience using EMS-98, in Adam, C., Heuer, R., Lenhardt, W., and Schranz, C., eds., Vienna Congress on Recent Advances in Earthquake Engineering and Structural Dynamics 2013 (VEESD 2013), Vienna, August 28–30, 2013, [Proceedings]: Vienna Congress on Recent Advances in Earthquake Engineering and Structural Dynamics 2013, paper 383, 9 p.
Foulser-Piggott, R., and Spence, R., 2013b, Extending EMS-98 for more convenient application outside Europe II: Development of the International Macroseismic Scale, in Adam, C., Heuer, R., Lenhardt, W., and Schranz, C., eds., Vienna Congress on Recent Advances in Earthquake Engineering and Structural Dynamics 2013 (VEESD 2013), Vienna, August 28–30, 2013, [Proceedings]: Vienna Congress on Recent Advances in Earthquake Engineering and Structural Dynamics 2013, paper 382, 10 p.
Given, D.D., Allen, R.M., Baltay, A.S., Bodin, P., Cochran, E.S., Creager, K., de Groot, R.M., Gee, L.S., Hauksson, E., Heaton, T.H., Hellweg, M., Murray, J.R., Thomas, V.I., Toomey, D., and Yelin, T.S., 2018, Revised technical implementation plan for the ShakeAlert system—An Earthquake Early Warning system for the West Coast of the United States: U.S. Geological Survey Open-File Report 2018–1155, 42 p., accessed January 2022 at https://doi.org/10.3133/ofr20181155.
Goded, T., Gerstenberger, M., Stirling, M., Cousins, R., and Canessa, S., 2019, High-intensity assignments for the 22 February 2011 Mw 6.2 Christchurch, Canterbury, New Zealand, earthquake—A contribution toward understanding the severe damage caused by this event: Seismological Research Letters, v. 90, no. 4, p. 1468–1482, accessed November 2022 at https://doi.org/10.1785/0220180385.
Goded, T., Horspool, N., Canessa, S., and Gerstenberger, M., 2017a, Modified Mercalli Intensities for the M7.8 Kaikoura (New Zealand) 14 November 2016 earthquake derived from ‘felt detailed’ and ‘felt rapid’ online questionnaires: Bulletin of the New Zealand Society for Earthquake Engineering, v. 50, no. 2, p. 352–362, accessed December 2022 at https://doi.org/10.5459/bnzsee.50.2.352-362.
Goded, T., Horspool, N., Canessa, S., Lewis, A., Geraghty, K., Jeffrey, A., and Gerstenberger, M., 2018, New macroseismic intensity assessment method for New Zealand web questionnaires: Seismological Research Letters, v. 89, no. 2A, p. 640–652, accessed November 2022 at https://doi.org/10.1785/0220170163.
Goded, T., Horspool, N., Gerstenberger, M., Canessa, S., and Lewis, A., 2017b, Macroseismic intensity assessment method for online questionnaires in New Zealand, in 16th World Conference on Earthquake Engineering, Santiago, Chile, January 9–13, 2017, [Proceedings]: World Conference on Earthquake Engineering, paper 1109, 12 p. [Also available at https://www.wcee.nicee.org/wcee/article/16WCEE/WCEE2017-1109.pdf.]
Goded, T., Tan, M., Becker, J., Horspool, N., Canessa, S., Huso, R., Hanson, J., and Johnston, D., 2021, Using citizen data to understand earthquake impacts—Aotearoa New Zealand’s earthquake felt reports—Overview and current research: Australasian Journal of Disaster and Trauma Studies, v. 25, no. 3, p. 61–78, accessed January 2021 at https://trauma.massey.ac.nz/issues/2021-3/contents.htm.
Goltz, J.D., Wald, D.J., McBride, S.K., DeGroot, R., Breeden, J.K., and Bostrom, A., 2022, Development of a companion questionnaire for “Did You Feel It?”—Assessing response in earthquakes where an earthquake early warning may have been received: Earthquake Spectra, v. 39, no. 1, p. 434–453, accessed December 2022 at https://doi.org/10.1177/87552930221116133.
Grünthal, G., [2022], The European Macroseismic Scale EMS: GFZ Helmholtz Centre Potsdam web page, accessed October 29, 2022, at https://www.gfz-potsdam.de/en/section/seismic-hazard-and-risk-dynamics/data-products-services/ems-98-european-macroseismic-scale/.
Grünthal, G., Musson, R.M.W., Schwarz, J., and Stucchi, M., eds., 1998, European Macroseismic Scale 1998 EMS-98: Luxembourg, Cahiers du Centre Européen de Géodynamique et de Séismologie, v. 15, 99 p. [Also available at https://eq.gsi.gov.il/docs/EMS-98_Original_englisch.pdf.]
Hadidian, N., and Schwarz, J., 2022, EMS-98 based damage grade assessment using remote sensing images for cascading events, in Arion, C., Scupin, A., and Ţigănescu, A., eds., Proceedings of the Third European Conference on Earthquake Engineering and Seismology—3ECEES, Bucharest, Romania, September 4–9, 2022: Bucharest, Romania, Editura Conspress, p. 4346–4355. [Also available at https://3ecees.ro/wp-content/uploads/2022/08/Proceedings_3ECEES_2022.pdf.]
Horspool, N.A., Chadwick, M., Ristau, J., Salichon, J., and Gerstenberger, M.C., 2015, ShakeMapNZ—Informing post-event decision making, in New Dimensions in Earthquake Resilience—New Zealand Society for Earthquake Engineering Technical Conference and Annual General Meeting (AGM), Rotorua, New Zealand, April 10–12, 2015, [Proceedings]: New Zealand Society for Earthquake Engineering, paper O-40, 8 p. [Also available at http://db.nzsee.org.nz/2015/Papers/O-40_Horspool.pdf.]
Hough, S.E., 2014, Earthquake intensity distributions—A new view: Bulletin of Earthquake Engineering, v. 12, no. 1, p. 135–155. [Also available at https://doi.org/10.1007/s10518-013-9573-x.]
Jaiswal, K., and Wald, D.J., 2008, Creating a global building inventory for earthquake loss assessment and risk management: U.S. Geological Survey Open-File Report 2008–1160, 110 p. [Also available at https://doi.org/10.3133/ofr20081160.]
Jaiswal, K., Wald, D.J., Perkins, D., Aspinall, W.P., and Kiremidjian, A.S., 2014, Estimating structural collapse fragility of generic building typologies using expert judgment, in Deodatis, G., Ellingwood, B.R., and Frangopol, D.M., eds., Safety, reliability, risk and life-cycle performance of structures and infrastructures: CRC Press, p. 879–886. [Also available at https://doi.org/10.1201/b16387.]
Kijewski-Correa, T.L., Rodgers, J., Presuma, L., Dévilmé, G., Lochhead, M., Canales, E., and Mbabazi, A., 2022, Building performance in the Nippes, Haiti earthquake—Lessons learned from a hybrid response model, in Proceedings of the 12th National Conference on Earthquake Engineering, Salt Lake City, Utah, June 27–July 1, 2022: Earthquake Engineering Research Institute, 5 p. [Also available at https://www.eeri.org/what-we-offer/digital-library/?lid=13262.]
Loos, S., Lallemant, D., and Wald, D.J., 2022, Best practices for collecting and using post-earthquake damage data—Lessons from Haiti and other past events, in Proceedings of the 12th National Conference on Earthquake Engineering, Salt Lake City, Utah, June 27–July 1, 2022: Earthquake Engineering Research Institute, 6 p. [Also available at https://www.eeri.org/what-we-offer/digital-library/?lid=13264.]
Maison, B., and Eidinger, J., 2022, Mobile home fragility curves: Earthquake Spectra, v. 38, no. 2, p. 1587–1609, accessed January 2023 at https://doi.org/10.1177/87552930211057583.
Maqsood, S.T., Schwarz, J., and Edwards, M., 2013, Application of the European Macroseismic Scale-1998 in the Asia-Pacific region, in Adam, C., Heuer, R., Lenhardt, W., and Schranz, C., eds., Vienna Congress on Recent Advances in Earthquake Engineering and Structural Dynamics 2013 (VEESD 2013), Vienna, August 28–30, 2013, [Proceedings]: Vienna Congress on Recent Advances in Earthquake Engineering and Structural Dynamics 2013, paper 470, 9 p.
Marano, K.D., Hearne, M., Jaiswal, K., Thompson, E.M., Worden, C.B., and Wald, D.J., 2023, ShakeMap Atlas 4.0 and AtlasCat—An archive of recent and historical earthquake ShakeMaps and impacts for global hazard analyses and loss model calibration: Seismological Research Letters, accessed December 5, 2023, at https://doi.org/10.1785/0220220324.
Martin, S.S., Hough, S.E., and Hung, C., 2015, Ground motions from the 2015 Mw 7.8 Gorkha, Nepal, earthquake constrained by a detailed assessment of macroseismic data: Seismological Research Letters, v. 86, no. 6, p. 1524–1532. [Also available at https://doi.org/10.1785/0220150138.]
McGowan, S., Jaiswal, K., and Wald, D.J., 2017, Using structural damage statistics to derive macroseismic intensity within the Kathmandu Valley for the 2015 M7.8 Gorkha, Nepal earthquake: Tectonophysics, v. 714–715, p. 158–172. [Also available at https://doi.org/10.1016/j.tecto.2016.08.002.]
Michetti, A.M., Esposito, E., Guerrieri, L., Porfido, S., Serva, L., Tatevossian, R., Vittori, E., Audemard, F., Azuma, T., Clague, J., Comerci, V., Gürpinar, A., McCalpin, J., Mohammadioun, B., Mörner, N.A., Ota, Y., and Roghozin, E., 2007, Intensity Scale ESI 2007: Annali d'Italia, v. 74, p. 11–20.
Moon, L., Dizhur, D., Denaldi, H., Derakhshan, H., Griffith, M., Magenes, G., and Ingham, J., 2014, The demise of the URM building stock in Christchurch during the 2010–2011 Canterbury earthquake sequence: Earthquake Spectra, v. 30, no. 1, p. 253–276, accessed January 2022 at https://doi.org/10.1193/022113EQS044M.
Moratalla, J.M., Goded, T., Rhoades, D.A., Canessa, S., and Gerstenberger, M.C., 2021, New ground motion to intensity conversion equations (GMICEs) for New Zealand: Seismological Research Letters, v. 92, no. 1, p. 448–459, accessed February 2022 at https://doi.org/10.1785/0220200156.
Musson, R.M.W., and Cecić, I., 2002, Macroseismology, chap. 49 of Lee, W.H.K., Kanamori, H., Jennings, P.C., and Kisslinger, C., eds., International handbook of earthquake and engineering seismology: San Diego, Academic Press, v. 81A, p. 807–822. [Also available at https://doi.org/10.1016/S0074-6142(02)80256-X.]
Musson, R.M.W., Grünthal, G., and Stucchi, M., 2010, The comparison of macroseismic intensity scales: Journal of Seismology, v. 14, no. 2, p. 413–428. [Also available at https://doi.org/10.1007/s10950-009-9172-0.]
New Zealand Society for Earthquake Engineering, 2009, Building safety evaluation during a state of emergency—Guidelines for territorial authorities (2d ed.): Wellington, New Zealand, New Zealand Society for Earthquake Engineering, 49 p., accessed October 2022 at http://www.nzsee.org.nz/Guidelines/BuildingSafetyEvaluationAug09.pdf.
Nicodemo, G., Pittore, M., Masi, A., and Manfredi, V., 2020, Modelling exposure and vulnerability from post-earthquake survey data with risk-oriented taxonomies—AeDES form, GEM taxonomy and EMS-98 typologies: International Journal of Disaster Risk Reduction, v. 50, article 101894, accessed December 2022 at https://doi.org/10.1016/j.ijdrr.2020.101894.
Philippine Institute of Volcanology and Seismology, [2018], PHIVOLCS Earthquake Intensity Scale (PEIS): Philippine Institute of Volcanology and Seismology web page, accessed December 16, 2022, at https://www.phivolcs.dost.gov.ph/index.php/earthquake/earthquake-intensity-scale.
Quitoriano, V., and Wald, D.J., 2020, USGS “Did You Feel It?”—Science and lessons from 20 years of citizen science-based macroseismology: Frontiers in Earth Science, v. 8, no. 120, 13 p. [Also available at https://doi.org/10.3389/feart.2020.00120.]
Quitoriano, V., and Wald, D.J., 2022, Combining macroseismic intensity felt reports using ShakeMap, in Arion, C., Scupin, A., and Ţigănescu, A., eds., Proceedings of the Third European Conference on Earthquake Engineering and Seismology—3ECEES, Bucharest, Romania, September 4–9, 2022: Bucharest, Romania, Editura Conspress, p. 5017–5027. [Also available at https://3ecees.ro/wp-content/uploads/2022/08/Proceedings_3ECEES_2022.pdf.]
Sbarra, P., Fodarella, A., Tosi, P., De Rubeis, V., and Rovelli, A., 2015, Difference in shaking intensity between short and tall buildings—Known and new findings: Bulletin of the Seismological Society of America, v. 105, no. 3, p. 1803–1809. [Also available at https://doi.org/10.1785/0120140341.]
Sbarra, P., Tosi, P., and De Rubeis, V., 2010, Web-based macroseismic survey in Italy—Method validation and results: Natural Hazards, v. 54, no. 2, p. 563–581. [Also available at https://doi.org/10.1007/s11069-009-9488-7.]
Sbarra, P., Tosi, P., and De Rubeis, V., 2014, How observer conditions impact earthquake perception: Seismological Research Letters, v. 85, no. 2, p. 306–313. [Also available at https://doi.org/10.1785/0220130080.
Sbarra, P., Tosi, P., De Rubeis, V., and Rovelli, A., 2012, Influence of observation floor and building height on macroseismic intensity: Seismological Research Letters, v. 83, no. 2, p. 261–266. [Also available at https://doi.org/10.1785/gssrl.83.2.261.]
Sbarra, P., Tosi, P., De Rubeis, V., and Sorrentino, D., 2020, Quantification of earthquake diagnostic effects to assess low macroseismic intensities: Natural Hazards, v. 104, no. 3, p. 1957–1973, accessed January 2021 at https://doi.org/10.1007/s11069-020-04256-6.
Schwarz, J., 2011, Empirical vulnerability assessment—A review of contributions to the damage description for the European Macroseismic Scale, in Proceedings, Earthquake Engineering and Engineering Seismology—Past Achievements and Future Prospects, Ankara, Turkey, October 14, 2011: Earthquake Engineering and Engineering Seismology.
Schwarz, J., Abrahamczyk, L., Leipold, M. and Wenk, T., 2015, Vulnerability assessment and damage description for R.C. frame structures following the EMS-98 principles: Bulletin of Earthquake Engineering, v. 13, no. 4, p. 1141–1159. [Also available at https://doi.org/10.1007/s10518-014-9694-x.]
Serva, L., 2019, History of the Environmental Seismic Intensity Scale ESI-07: Geosciences, v. 9, no. 5, article 210, 8 p. [Also available at https://doi.org/10.3390/geosciences9050210.]
Spence, R., and Foulser-Piggott, R., 2014, The International Macroseismic Scale—Extending EMS-98 for global application, in Second European Conference on Earthquake Engineering and Seismology, Istanbul, Turkey, August 25–29, 2014 [Proceedings]: The European Association for Earthquake Engineering, paper 835, 12 p. [Also available at http://www.eaee.org/Media/Default/2ECCES/2ecces_eaee/835.pdf.]
Stavrianaki, K., Kouskouna, V., and Rossetto, T., 2013, Intensity EMS-98 for early-mid 20th century damaging earthquakes in Greece, in Adam, C., Heuer, R., Lenhardt, W. and Schranz, C., eds. Vienna Congress on Recent Advances in Earthquake Engineering and Structural Dynamics 2013 (VEESD 2013), Vienna, August 28–30, 2013, [Proceedings]: Vienna Congress on Recent Advances in Earthquake Engineering and Structural Dynamics 2013, paper 263, 9 p. [Also available at https://www.researchgate.net/publication/257527369.]
Structural Extreme Events Reconnaissance [StEER], 2021a, Assessment guide for StEER rapid response (M7.2 Haiti EQ - Aug 2021) (ver. 1.0, released Aug. 28, 2021): Structural Extreme Events Reconnaissance (StEER) web page, accessed September 2022 at https://docs.google.com/document/d/1J6I3I791IgCX-g8bPrH1sPQbp3HAF2rJSK1H7PcNZEg/edit.
Stover, C.W., and Coffman, J.L., 1993, Seismicity of the United States, 1568–1989 (revised): U.S. Geological Survey Professional Paper 1527, 418 p. [Also available at https://doi.org/10.3133/pp1527.]
Tertulliani, A., Graziani, A., Castellano, C., Maramai, A., and Rossi, A., 2016, Comment on “Ground motions from the 2015 Mw 7.8 Gorkha, Nepal, earthquake constrained by a detailed assessment of macroseismic data” by Stacey S. Martin, Susan E. Hough, and Charleen Hung: Seismological Research Letters, v. 87, no. 4, p. 955–956, accessed December 2016 at https://doi.org/10.1785/0220150258.
Tosi, P., De Rubeis, V., and Sbarra, P., 2017, Frequency ranges and attenuation of macroseismic effects: Geophysical Journal International, v. 210, no. 3, p. 1765–1771, accessed January 2019 at https://doi.org/10.1093/gji/ggx201.
Tosi, P., Sbarra, P., De Rubeis, V., and Ferrari, C., 2015, Macroseismic intensity assessment method for web questionnaires: Seismological Research Letters, v. 86, no. 3, p. 985–990. [Also available at https://doi.org/10.1785/0220140229.]
Vogt, J., Musson, R.M.W., and Stucchi, M., 1994, Seismological and hydrological criteria for the new European Macroseismic Scale (MSK-92): Natural Hazards, v. 10, p. 1–6, accessed December 2022 at https://doi.org/10.1007/BF00643437.
Wald, D.J., Earle, P.S., Allen, T.I., Jaiswal, K., Porter, K., and Hearne, M., 2008, Development of the U.S. Geological Survey’s PAGER system (Prompt Assessment of Global Earthquakes for Response), in 14th World Conference on Earthquake Engineering, Beijing, October 12–17, 2008, [Proceedings]: World Conference on Earthquake Engineering, 8 p. [Also available at https://www.iitk.ac.in/nicee/wcee/article/14_10-0008.PDF.]
Wald, D.J., and Franco, G., 2017, Financial decision-making based on near-real-time earthquake information, in 16th World Conference on Earthquake Engineering, Santiago, Chile, January 9–13, 2017, [Proceedings]: World Conference on Earthquake Engineering, paper 3625, 13 p. [Also available at http://wcee.nicee.org/wcee/article/16WCEE/WCEE2017-3625.pdf.]
Wald, D. J., Loos, S., Spence, R., Goded, T., and Hortacsu, A., 2023, A common language for reporting earthquake intensities: Eos Science News, v. 104, p. 29–33. [Also available at https://doi.org/10.1029/2023EO230160.]
Wald, D.J., Quitoriano, V., Dengler, L.A., and Dewey, J.W., 1999, Utilization of the internet for rapid community intensity maps: Seismological Research Letters, v. 70, no. 6, p. 680–697. [Also available at https://doi.org/10.1785/gssrl.70.6.680.]
Wald, D.J., Quitoriano, V., Goded, T., Hortacsu, A., Spence, R., and De Rubeis, V., 2022, Towards developing and implementing an International Macroseismic Scale (IMS) for earthquake engineering, earthquake science, and rapid damage assessment, in Arion, C., Scupin, A., and Ţigănescu, A., eds., Proceedings of the Third European Conference on Earthquake Engineering and Seismology—3ECEES, Bucharest, Romania, September 4–9, 2022: Bucharest, Romania, Editura Conspress, p. 4975–4985. [Also available at https://3ecees.ro/wp-content/uploads/2022/08/Proceedings_3ECEES_2022.pdf.]
Wald, D.J., Quitoriano, V., Worden, C.B., Hopper, M., and Dewey, J.W., 2011, USGS “Did You Feel It?” internet-based macroseismic intensity maps: Annals of Geophysics, v. 54, no. 6, p. 688–707. [Also available at https://doi.org/10.4401/ag-5354.]
Wald, D.J., Worden, C.B., Thompson, E.M., and Hearne, M., 2022, ShakeMap operations, policies, and procedures: Earthquake Spectra, v. 38, no. 1, p. 756–777. [Also available at https://doi.org/10.1177/87552930211030298.]
Wood, H.O., and Neumann, F., 1931, Modified Mercalli Intensity Scale of 1931: Bulletin of the Seismological Society of America, v. 21, no. 4, p. 277–283, accessed January 2021 at https://doi.org/10.1785/BSSA0210040277.
Worden, C.B., Gerstenberger, M., Rhoades, D.A., and Wald, D.J., 2012, Probabilistic relationships between ground-motion parameters and Modified Mercalli Intensity in California: Bulletin of the Seismological Society of America, v. 102, no. 1, p. 204–221. [Also available at https://doi.org/10.1785/0120110156.]
Worden, C.B., Thompson, E.M., Baker, J.W., Bradley, B.M., Luco, N., and Wald, D.J., 2018, Spatial and spectral interpolation of ground‐motion intensity measure observations: Bulletin of the Seismological Society of America, v. 108, no. 2, p. 866–875. [Also available at https://doi.org/10.1785/0120170201.]
Worden, C.B., Thompson, E.M., Hearne, M., and Wald, D.J., 2020, ShakeMap manual online—Technical manual, user’s guide, and software guide: U.S. Geological Survey. [Also available at https://doi.org/10.5066/F7D21VPQ.]
Appendix 1. October 2022 Powell Center International Macroseismic Scale Workshop Agenda
Outcomes
-
1. Provide initial framework for applying the European Macroseismic Scale of 1998 (EMS–98) in the United States and New Zealand EMS. (Day 2)
-
2. Identify missing structures and assign vulnerability classes and damage matrices needed for the United States and New Zealand. (Day 2)
-
3. Provide guidance and a strategy for developing an International Macroseismic Scale (IMS), including the United States and New Zealand. (Day 3)
-
4. Outline plan for a journal article(s) summarizing workshop and recommendations (for example, U.S. Geological Survey Open-File Report, Applied Technology Council [ATC] report). (Days 4 and 5)
-
5. Strategize on approaches to allow field inspectors to contribute their postearthquake field data, for example, ATC–20, for automatic intensity assignments consistent with EMS–98, utilizing existing expertise (to be tackled at second workshop). (Day 4)
-
6. Organize the second workshop. (Days 4 and 5)
Day 1—Monday (October 10)—Core Team, Workshop Final Planning
[To be held at hotel Colorado State University President’s Conference Room because it is a Federal holiday]
-
• Core team only (David Wald, Ayse Hortacsu, Tatiana Goded, Robin Spence, Emily So, Sabine Loos). ATC update. Review and modify agenda as needed. Coordinate presentations, goals, participants, and the rest of the meeting.
-
• Discuss Covid protocols! Welcome to wear a mask.
-
• 9:30—Gather, mingle, and chat.
-
• 10:00—Working meeting begins.
-
• Sabine Loos, David Wald: Clean up agenda and Teams channel, other business.
-
• Note taking, help with talks, logistics, retreat.
Day 2—Tuesday (October 11)—Background on Workshop, United States and New Zealand Building Information
Toward outcomes 1 and 2
8:30 to 10:30 a.m. (3:30 p.m. British Summer Time [BST], 4:30 p.m. Central European Summer Time [CEST], 3:30 a.m. New Zealand Standard Time [NZT])—Introduction to the workshop
-
• Logistics (Powell Center staff, David; 30 minutes)
-
• Intros (9:00 a.m.)
-
• David Wald: Goals, Background, Big picture, “Did You Feel It?” (DYFI), United States and New Zealand Modified Mercalli Intensity (MMI) and Limitations (“My Shot”; 45 minutes with questions and answers [Q/A])
-
• Robin Spence: Where We Left IMS (“The Room Where It Happened”; 30 minutes with Q/A)
-
• Ayse Hortacsu: ATC's Role, ATC–158, ATC–38, and Prior Guidelines (status report; 15 minutes with Q/A)
10:30 to 10:45 a.m. (5:30 p.m. BST, 6:30 p.m. CEST, 5:30 a.m. NZT)—coffee break
10:45 a.m. to 12:15 p.m. (5:45 p.m. BST, 6:45 p.m. CEST, 5:45 a.m. NZT)—United States and New Zealand structural presentations
-
• United States engineering presentations
-
• New Zealand engineering presentations:
-
12:15 to 1:15 p.m. (7:00 p.m. BST, 8:00 p.m. CEST, 7:00 a.m. NZT)—lunch
-
1:15 to 3:15 p.m. (8:00 p.m. BST, 9:00 p.m. CEST, 8:00 a.m. NZT)—continue New Zealand presentations and discussions
-
• United States versus New Zealand buildings: differences and similarities? (all; 30 minutes)
-
• Discussion. United States and New Zealand next steps (30 minutes)
3:15 to 3:40 p.m. (10:15 p.m. BST, 11:15 p.m. CEST, 10:15 a.m. NZT)—coffee break (25 minutes)
3:40 to 4:40 p.m. (10:40 p.m. BST, 11:40 p.m. CEST, 10:40 a.m. NZT)—“parking lot” issues
4:40 to 5:30 p.m. (11:40 p.m. BST, 12:40 a.m. CEST, 11:40 a.m. NZT)—core team strategy meeting
7:00 p.m. (2:00 a.m. BST, 3:00 a.m. CEST, 2:00 p.m. NZT)—group dinner
Day 3—Wednesday (October 12)—Background on the European Macroseismic Scale of 1998 to Move Toward an International Macroseismic Scale
Toward outcomes 1, 2, and 3
8:30 to 8:40 a.m. (3:30 p.m. BST, 4:30 p.m. CEST, 3:30 a.m. NZT)
8:40 to 10:30 a.m. (3:40 p.m. BST, 4:40 p.m. CEST, 3:40 a.m. NZT)—EMS–98 experts, “The World Was Wide Enough”
Toward outcome 3
-
• Thoughts from Schwarz, Wenk, Musson, Grünthal, Pomonis (15 minutes each, 90 minutes total)
-
• Thoughts on EMS–98 status and past and present IMS activities
-
• Q/A
10:30 to 11:00 a.m. (5:30 p.m. BST, 6:30 p.m. CEST, 5:30 a.m. NZT)—coffee break
11:00 a.m. to 12:00 p.m. (6:00 p.m. BST, 7:00 p.m. CEST, 6:00 a.m. NZT)—questions and follow-on with EMS–98 experts
Toward outcomes 1, 2, and 3
-
• Vulnerability classes and building classes—table commentary
-
• Challenges to and opportunities for a future IMS (uncertainties, modifiers, areal extent, countries, and so forth)
12:00–12:15 p.m. (7:00 p.m. BST, 8:00 p.m. CEST, 7:00 a.m. NZT)—“parking lot” issues
12:15 to 1:15 p.m. (7:00 p.m. BST, 8:00 p.m. CEST, 7:00 a.m. NZT)—lunch
1:15 to 3:00 p.m. (8:00 p.m. BST, 9:00 p.m. CEST, 8:00 a.m. NZT)—group discussion on big questions; these items will spill over to the next session
Toward outcomes 1, 2, and 3
-
• United States and New Zealand damage probability matrix, building classes (Ayse, Tatiana, Andrew, Keith)
-
• Additional structures (mobile homes; Maison and Eidinger, 2022; mobile home fragilities), modern structures, and nonstructural considerations (Ayse, Keith, Andrew, all)
-
• Damage descriptions and drawings (Emily So, Robin Spence)
3:00 to 3:30 p.m. (10:00 p.m. BST, 11:00 p.m. CEST, 10:00 a.m. NZT)—coffee break
3:30 to 5:00 p.m. (10:30 p.m. BST, 11:30 p.m. CEST, 10:30 a.m. NZT)—continued discussion and summarize the day
-
• Reset agenda (finish previous topics, reorder Thursday and Friday)
-
• Work on consensus summary of progress
7:30 p.m.—(2:30 a.m. BST, 3:30 a.m. CEST, 2:30 p.m. NZT)—small group dinner (break into multiple groups)
Day 4—Thursday (October 13)—Next Steps and Group Activities
Toward outcomes 3, 4, 5, and 6
Start time? (to be determined)
-
• Consolidate plans for writeup (90 minutes)—break out into groups, write things down
-
• Next steps (“That Would Be Enough”)
-
• Global Earthquake Model (GEM), European Seismological Commission (ESC), Latin America and the Caribbean
-
• U.S. Agency for International Development’s Bureau of Humanitarian Assistance, United Nations, and World Bank Global Facility for Disaster Risk Reduction
-
• Next meeting: priorities, goals (“You'll Be Back”)
-
• Half day social event: Hiking, biking, and (or) brewery tour
7:00 p.m.—(2:00 a.m. BST, 3:00 a.m. CEST, 2:00 p.m. NZT)—small group dinner (break into multiple groups)
Day 5—Friday (October 14)—Work Sessions and Planning for the Future
Toward outcomes 3, 4, 5, and 6
9:00 a.m. (4:00 p.m. BST, 5:00 p.m. CEST, 4:00 a.m. NZT)—(Some participants will depart Thursday evening or Friday morning)
-
• Specific details of vulnerability table, classes, sketches, forms
-
• Core participants remain, begin writing, planning for next workshop (“Who Lives, Who Dies, Who Tells Your Story”)
End time? (to be determined)
Notes
-
• Contacts:
-
• gs_powell_center_travel@usgs.gov
-
• More logistics information will be provided by Powell Center staff ahead of the meeting, but a few items are here.
-
• Suggest local travelers bring their own bike, headlamp, and lock. Others will receive one at the meeting for local dinners and hotel access (though it is in walking distance).
Microsoft Teams Channel “International Macroseismic Scale Group”
Literature Collection—in Teams under “Papers”
Please put datasets into Teams documents folder “Datasets”:
Appendix 2. October 2022 Powell Center International Macroseismic Scale Workshop List of Presentations
Day 2
-
• Goals, Background, Big Picture, “Did You Feel It?” (DYFI), United States and New Zealand Modified Mercalli Intensity (MMI) and Limitations, David Wald, USGS
-
• The International Macroseismic Intensity Scale—Where We Left it in 2014, Robin Spence, Cambridge Architectural Research
-
• Applied Technology Council (ATC) ATC–158 project and Preearthquake and Postearthquake Safety Evaluations, Ayse Hortacsu, ATC
-
• United States Task 2—Lit Review, Typology and Type Options, Select Types, and Assign Vulnerability Classes, Keith Porter, Institute for Catastrophic Loss Reduction
-
• Thoughts from the Trenches, John Osteraas, Exponent
-
• Incorporating United States and New Zealand Requirements in an IMS—Thoughts and Questions from a New Zealand Perspective, Andrew Charleson, Victoria University of Wellington
-
• Past Intensity Assignments from United States and New Zealand Earthquakes, Sheng-lin Lin, Tatiana Goded, GNS Science
-
• Timber Houses and Buildings in New Zealand, Graeme Beattie, EDC Engineering Design Consultants
-
• Forecasting and Reducing the Earthquake Risk for Precincts of URM Buildings, Jason Ingham, University of Auckland
Appendix 3. New Zealand Rapid Damage Assessment Forms
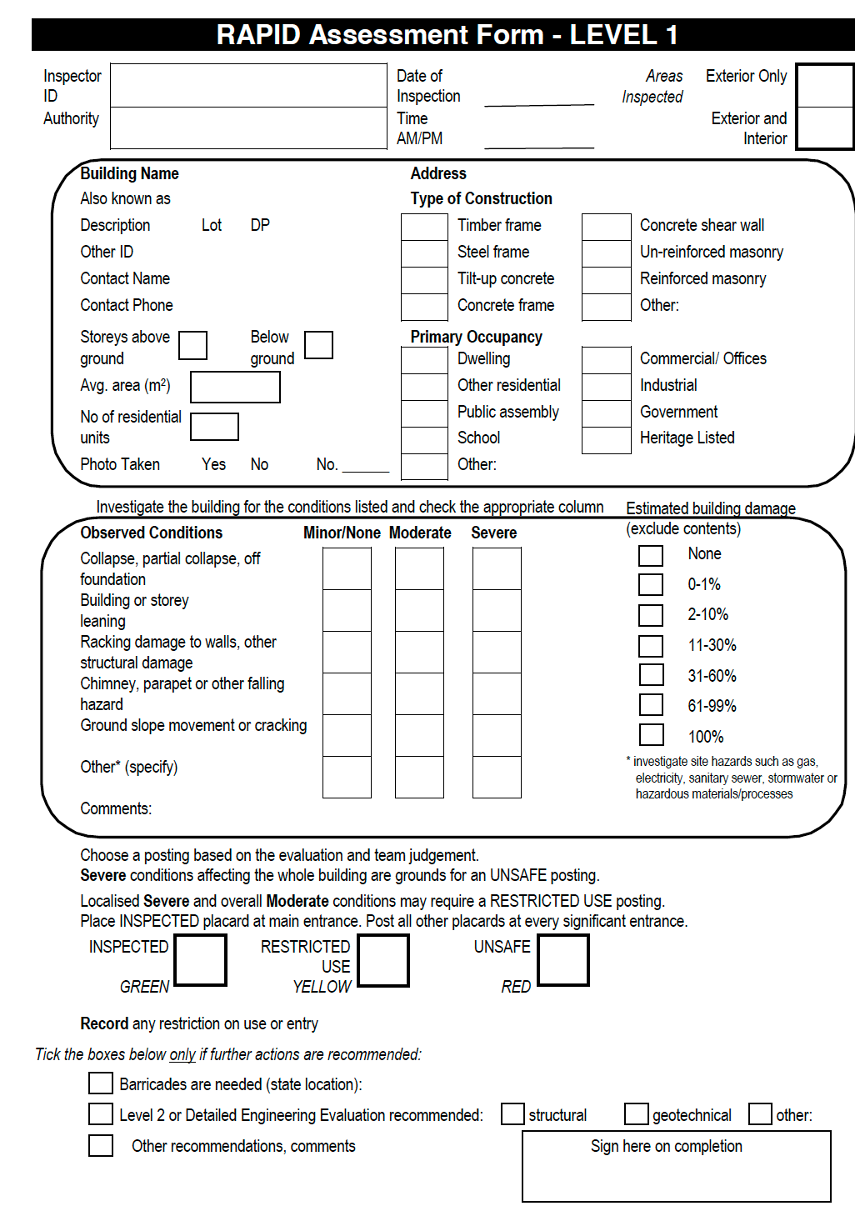
New Zealand Rapid Assessment Form—level 1. ID, identification; DP, damage percentage; m2, meter squared; No., number; %, percent.
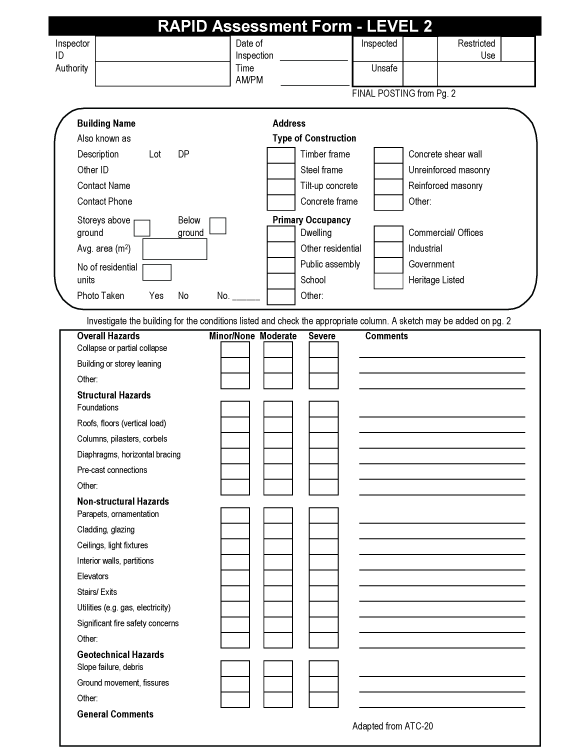
New Zealand Rapid Assessment Form—level 2, page 1, from “Guidelines for Building Safety Evaluation During a State of Emergency.” ID, identification; Pg., page; DP, damage percentage; m2, meter squared; No., number; e.g., for example; ATC, Applied Technology Council.
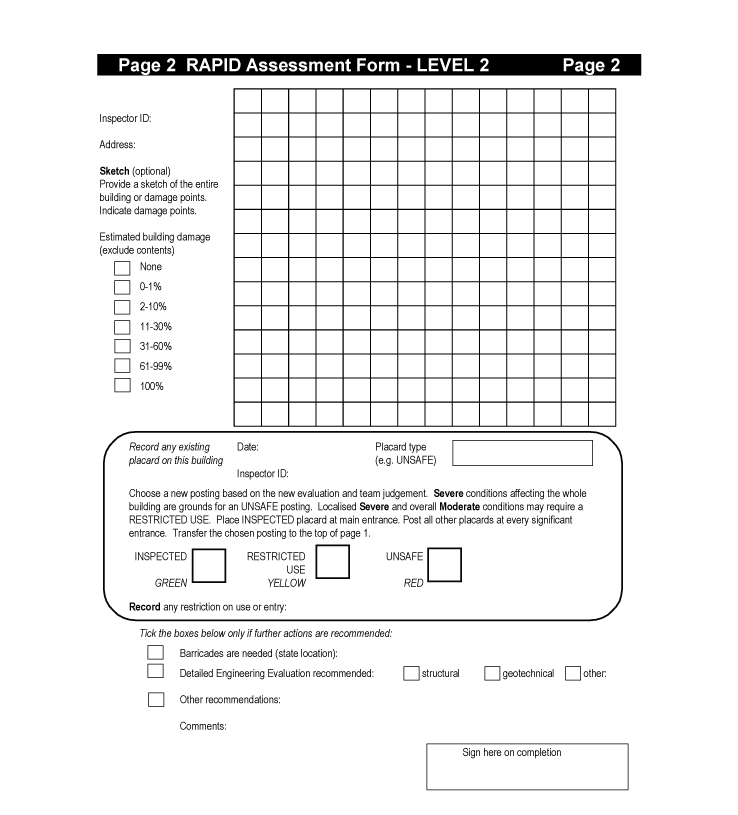
New Zealand Rapid Assessment Form—level 2, page 2, from “Guidelines for Building Safety Evaluation During a State of Emergency.” ID, identification; %, percent; e.g., for example.
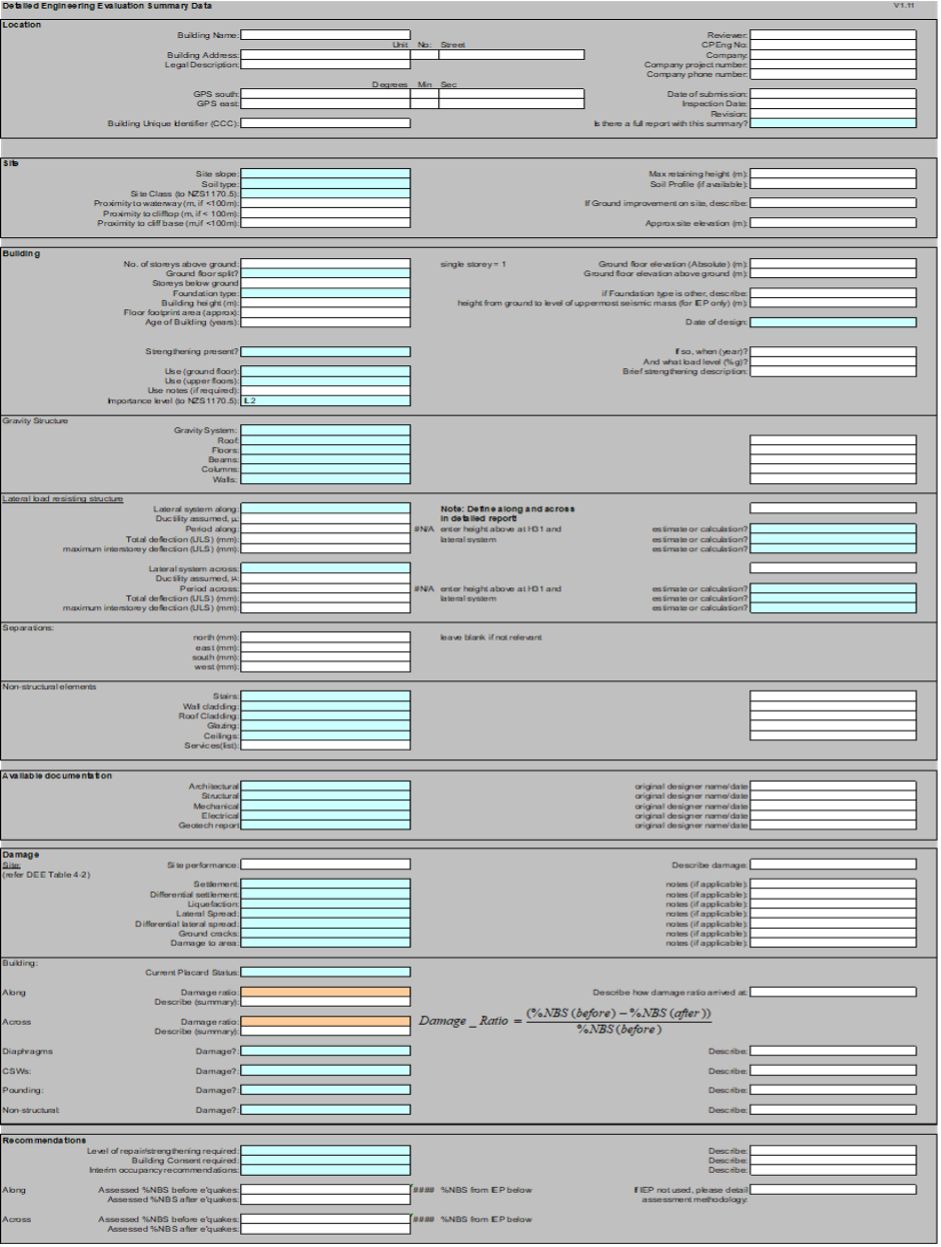
“Detailed Engineering Evaluation Summary Data,” page 1. No., number; CPEng, Chartered Professional Engineer; GPS, global positioning system; min, minutes; sec, seconds; CCC, Christchurch City Council; m, meters; NZS, New Zealand Standard; <, less than; IEP, initial evaluation procedure; %g, percentage of acceleration due to gravity; mm, millimeters; x, multiplied by; μ, Structural Ductility Factor; ULS, ultimate limit state; DEE, detailed engineering evaluation; =, equals; %, percent; NBS, New Building Standard; CSW, critical structural weakness; e'quakes, earthquakes.
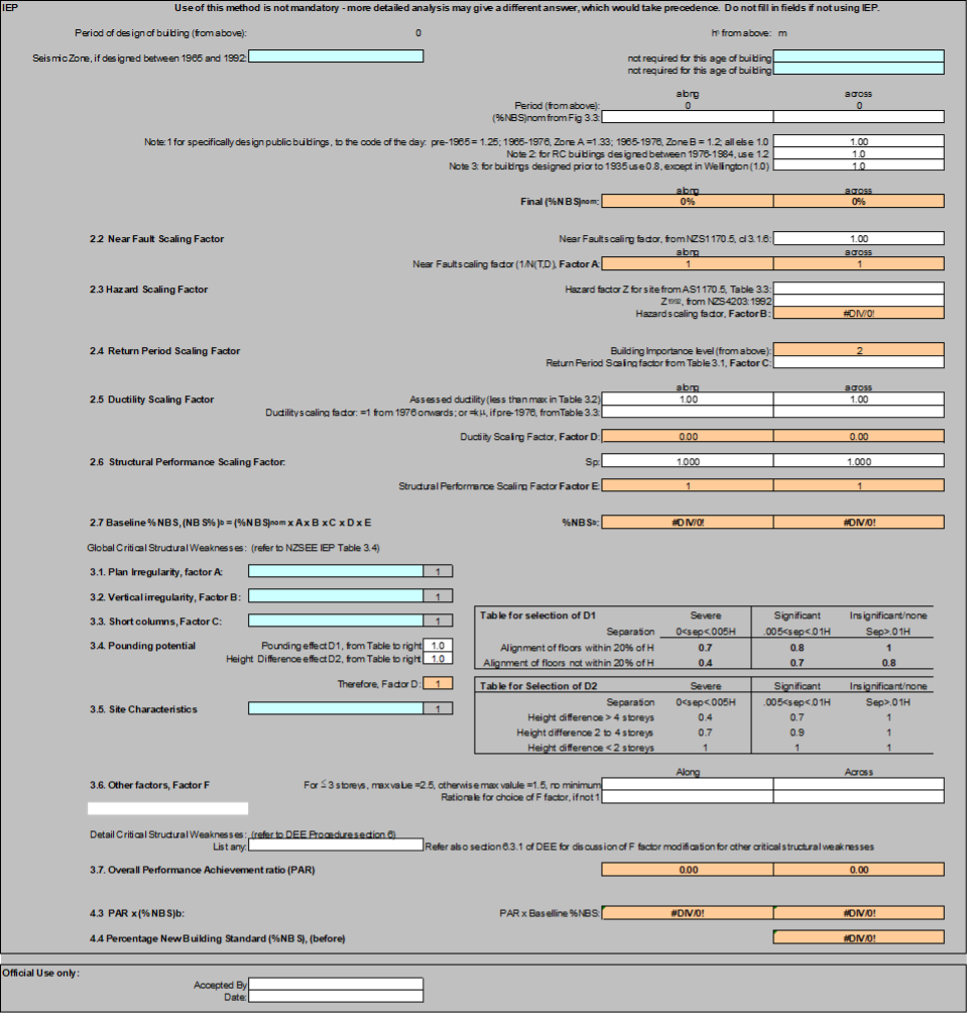
“Detailed Engineering Evaluation Summary Data,” page 2. IEP, initial evaluation procedure; hn, height in m from the base of the structure to the uppermost seismic weight or mass; m, meter; %, percent; NBS, New Building Standard; nom, nominal; =, equals; RC, reinforced concrete; NZS, New Zealand Standard; cl, clause; (N(T,D), Near Fault Factor; AS1170.5, Australia and New Zealand structural design code; Z1992, Zone Factor from NZS 4203:1992; kμ, Structural Ductility Scaling Factor; Sp, Structural Performance Factor; x, multiplied by; %NBSb; Baseline Percentage of New Building Standard; NZSEE, New Zealand Society for Earthquake Engineering; D1, Pounding Potential factor; D2, Height Difference Effect factor; sep, separation; <, less than; >, greater than; ≤ less than or equal to; DEE, detailed engineering evaluation; max, maximum; F factor, other factors (for example, vulnerable chimneys).
Conversion Factors
International System of Units to U.S. customary units
Abbreviations
16WCEE
16th World Conference on Earthquake Engineering
ATC
Applied Technology Council
CERA
Canterbury Earthquake Recovery Authority
CII
Community Internet Intensity
DEE
detailed engineering evaluation
DYFI
“Did You Feel It?”
EERI
Earthquake Engineering Research Institute
EMS–98
European Macroseismic Scale of 1998
EMSC
European-Mediterranean Seismological Centre
ERD
earthquake-resistant design
ESC
European Seismological Commission
FEMA
Federal Emergency Management Agency
GEM
Global Earthquake Model
GFZ
GeoForschungsZentrum
GIS
geographical information system
GNS
New Zealand Institute of Geological and Nuclear Sciences Limited
IMS
International Macroseismic Scale
INGV
Istituto Nazionale di Geofisica e Vulcanologia (National Institute of Geophysics and Volcanology, Italy)
JMA
Japan Meteorological Agency
M
moment magnitude
MCS
Mercalli-Cancani-Sieberg Scale
MMI
Modified Mercalli Intensity
MSK
Medvedev-Sponheuer-Karnik Scale
PAGER
Prompt Assessment of Global Earthquakes for Response
PGA
peak ground accelerations
RBS
rapid building safety
StEER
Structural Extreme Events Reconnaissance
URM
unreinforced masonry
USGS
U.S. Geological Survey
WHE
World Housing Encyclopedia
Publishing support provided by the Science Publishing Network,
Denver Publishing Service Center
For more information concerning the research in this report, contact the
Center Director, USGS Geologic Hazards Science Center
Box 25046, Mail Stop 966
Denver, CO 80225
(303) 273-8579
Or visit Geologic Hazards Science Center website at
Disclaimers
Any use of trade, firm, or product names is for descriptive purposes only and does not imply endorsement by the U.S. Government.
Although this information product, for the most part, is in the public domain, it also may contain copyrighted materials as noted in the text. Permission to reproduce copyrighted items must be secured from the copyright owner.
Suggested Citation
Wald, D.J., Goded, T., Hortacsu, A., and Loos, S.C., 2024, Developing and implementing an International Macroseismic Scale (IMS) for earthquake engineering, earthquake science, and rapid damage assessment: U.S. Geological Survey Open-File Report 2023–1098, 55 p., https://doi.org/10.3133/ofr20231098.
ISSN: 2331-1258 (online)
| Publication type | Report |
|---|---|
| Publication Subtype | USGS Numbered Series |
| Title | Developing and implementing an International Macroseismic Scale (IMS) for earthquake engineering, earthquake science, and rapid damage assessment |
| Series title | Open-File Report |
| Series number | 2023-1098 |
| DOI | 10.3133/ofr20231098 |
| Publication Date | January 08, 2024 |
| Year Published | 2024 |
| Language | English |
| Publisher | U.S. Geological Survey |
| Publisher location | Reston VA |
| Contributing office(s) | Geologic Hazards Science Center - Seismology / Geomagnetism |
| Description | viii, 55 p. |
| Online Only (Y/N) | Y |