

Distribution, Abundance, and Breeding Activities of the Least Bell's Vireo at Marine Corps Base Camp Pendleton, California—2022 Annual Report
Links
- Document: Report (16 MB) , HTML , XML
- Download citation as: RIS | Dublin Core
Acknowledgments
This work was funded by the Environmental Security Department, Resources Management Division, Marine Corps Base Camp Pendleton, California. All data used in this report, including unpublished data, either are not available or have limited availability owing to restrictions of the funding entity (U.S. Marine Corps). Contact Ryan Besser, ryan.besser@usmc.mil, for more information. The authors thank the biologists who assisted in data collection for this project: Lisa Allen, Rafal Banas, Annabelle Bernabe, Ynez Diaz, Aaron Gallagher, Alexandra Houston, Scarlett Howell, Jessica Medina, Shannon Mendia, Ryan Pottinger, Devin Taylor, and Stéphane Vernhet.
Executive Summary
The purpose of this report is to provide the Marine Corps with an annual summary of abundance, breeding activity, demography, and habitat use of endangered Least Bell’s Vireos (Vireo bellii pusillus) at Marine Corps Base Camp Pendleton (MCBCP or “Base”). Surveys for the Least Bell's Vireo were completed at MCBCP, California, between April 4 and July 12, 2022. Core survey areas and a subset of non-core areas in drainages containing riparian habitat suitable for vireos were surveyed two to four times. We detected 571 territorial male vireos and 14 transient vireos in core survey areas. An additional 90 territorial male vireos and 2 transients were detected in non-core survey areas. Transient vireos were detected on 7 of the 11 drainages/sites surveyed (core and non-core areas). Of the vireo territories in core areas, 90 percent were on the four most populated drainages, with the Santa Margarita River containing 73 percent of all territories in areas surveyed on Base. In core areas, 81 percent of male vireos were confirmed as paired; 61 percent of male vireos in non-core areas were confirmed as paired.
The number of documented Least Bell’s Vireo territories in core survey areas on MCBCP increased 4 percent from 2021 to 2022. In three core survey area drainages, the number of territories increased by at least two, and in five core survey area drainages, the number of vireo territories decreased by at least two between 2021 and 2022. The increase in the number of vireo territories on MCBCP was consistent with population changes at the lower San Luis Rey River (7-percent increase), but not with Marine Corps Air Station, Camp Pendleton (10-percent decrease).
A wildfire in July 2021 burned approximately 22 hectares of vireo habitat on the Santa Margarita River. There was no difference in the number of vireo territories within the fire perimeter before the fire (three territories in 2021) and after the fire (three territories in 2022).
Most core-area vireos (52 percent, including transients) used mixed willow (Salix spp.) riparian habitat. An additional 8 percent of birds occupied willow habitat co-dominated by Western sycamores (Platanus racemosa) or Fremont cottonwoods (Populus fremontii). Riparian scrub composed of mule fat (Baccharis salicifolia), sandbar willow (S. exigua), or blue elderberry (Sambucus mexicana) was used at 37 percent of vireo territories. Upland scrub was used by 2 percent of the vireos, and 1 percent of vireo territories were in drier habitats co-dominated by coast live oak (Quercus agrifolia) and sycamore.
In 2019, MCBCP began operating an artificial seep along the Santa Margarita River; then, in 2021, two additional artificial seeps became operational. The artificial seeps pumped water to the surface starting in March and ending in August each year during daylight hours and were designed to increase the amount of surface water to enhance Southwestern Willow Flycatcher (Empidonax traillii extimus) breeding habitat. Although this enhancement was designed to benefit flycatchers, few flycatchers have inhabited the seep areas within the past several years; therefore, vireos were selected as a surrogate species to determine effects of the habitat enhancement. This report presents the third year of analyses of vireo and vegetation response to the artificial seeps.
We sampled vegetation in two Seep sites and two Reference sites to determine the effects of surface water enhancement by seep pumps installed along the Santa Margarita River. Total vegetation cover below 2 meters (m) was greater at Seep sites than at Reference sites. Conversely, there was more non-native vegetation cover above 2 m (from 2 to 4 m) at Reference sites than at Seep sites. Soil moisture was greater at Seep sites than at Reference sites and decreased with increasing distance from the seep outlets. Soil moisture was positively correlated with total foliage cover and woody cover at most height categories. Soil moisture was not correlated with total herbaceous cover at any height category, although it was positively correlated with native herbaceous cover from 1 to 2 m and negatively correlated with non-native cover from 2 to 4 m. The number of vireo fledglings produced per egg was positively correlated with woody cover from 0 to 2 m but negatively correlated with herbaceous cover from 0 to 2 m. The number of fledglings produced per pair was negatively correlated with herbaceous and non-native vegetation cover below 2 m.
The U.S. Geological Survey has been color banding Least Bell’s Vireos on Marine Corps Base Camp Pendleton since 1995. By the end of 2021, 978 Least Bell’s Vireos had been color banded on Base. In 2022, we continued to color band and resight color banded Least Bell’s Vireos to evaluate adult site fidelity, between-year movement, and the effect of surface-water enhancement on vireo site fidelity and between-year movement. We banded 135 Least Bell's Vireos for the first time during the 2022 season. Birds banded included 4 adult vireos and 131 juveniles. All adult vireos were banded with unique color combinations. The juvenile vireos (all nestlings) were banded with a single gold numbered federal band on the left leg.
There were 43 Least Bell's Vireos banded before the 2022 breeding season that were resighted and identified on Base in 2022. Of these vireos, 39 were banded on Base, 3 were originally banded on the San Luis Rey River, and 1 was banded at Marine Corps Air Station, Camp Pendleton. Adult birds of known age ranged from 1 to at least 7 years old.
Base-wide survival of vireos was affected by sex, age, and year. Males had a significantly higher survival rate than females. Adults had a higher survival rate than first-year vireos. Survival for adults and first-year birds was lowest from 2020 to 2021 and highest from 2012 to 2013. The return rate of adult vireos to Seep or Reference sites was not affected by whether they were originally banded at a Seep versus Reference site.
Most of the returning adult vireos showed strong between-year site fidelity. Of the adults detected in 2021 and 2022, 89 percent (92 percent of males; 67 percent of females) returned to within 100 m of their previous territory. The average between-year movement for returning adult vireos was 0.1±0.2 kilometers (km). The average movement of first-year vireos detected in 2022 that fledged from a known nest on MCBCP in 2021 was 1.6±1.8 km.
Vireo territory density at the Seep and Reference sites was similar before the seep pumps were installed. Although vireo territory density at Seep sites appeared greater than at Reference sites after the seep pumps were installed, the difference was not significant.
We monitored Least Bell’s Vireo pairs to evaluate the effects of surface-water enhancement on nest success and breeding productivity. We monitored vireo nesting activity at 25 territories in 2 Seep sites and 25 territories in 2 Reference sites between March 31 and July 28. All territories except one were occupied by pairs, and all were “fully monitored,” meaning all nesting attempts were monitored at these territories. During the monitoring period, 97 nests (49 in Seep sites and 48 in Reference sites) were monitored.
Breeding productivity was similar at the Seep and Reference sites (2.7 and 3.3 young fledged per pair, respectively), although more pairs at Reference sites than Seep sites fledged at least one young (96 versus 76 percent, respectively). There were no other differences in breeding productivity between Seep site pairs and Reference site pairs. According to the best model, daily nest survival in 2022 was not related to whether the territory was in a Seep versus a Reference site. Completed nests at the Seep sites had similar fledging success as nests at Reference sites in 2022. At Seep sites, 56 percent of nests fledged young whereas 67 percent of Reference nests successfully fledged young. Predation was believed to be the primary source of nest failure at both sites. Predation accounted for 80 percent and 73 percent of nest failures at Seep and Reference sites, respectively. Failure of the remaining nests was attributed to infertile eggs and other unknown causes.
Vireos placed their nests in 12 plant species in 2022. We detected no differences in nest placement between successful and unsuccessful vireo nests or between Seep and Reference sites.
Precipitation appeared to play a role in fluctuations in the vireo population on MCBCP; however, it could not be directly linked to annual vireo breeding productivity. One possible factor that may be confounding the relationship between vireo breeding productivity and precipitation may be nest parasitism by Brown-headed Cowbirds (Molothrus ater) in the region, especially on the nearby San Luis Rey River.
Introduction
The purpose of this report is to provide the Marine Corps with an annual summary of abundance, breeding activity, demography, and habitat use of endangered Least Bell’s Vireos (Vireo bellii pusillus) at Marine Corps Base Camp Pendleton (MCBCP or “Base”). The results are intended to provide the Base with biological information during each year to assist with appropriate management of the federally listed Least Bell’s Vireo and to maintain compliant actions supporting military training on MCBCP in accordance with the Base Integrated Natural Resources Management Plan and U.S. Fish and Wildlife Service Programmatic Biological Opinion (U.S. Fish and Wildlife Service, 1995).
The Least Bell's Vireo (hereafter “vireo”) is a small, migratory songbird that breeds in southern California and northwestern Baja California, Mexico, from April through July. Historically abundant within lowland riparian ecosystems, vireo populations began declining in the late 1900s because of habitat loss and alteration associated with urbanization and conversion of land adjacent to rivers to agriculture (Franzreb, 1989; U.S. Fish and Wildlife Service, 1998; Riparian Habitat Joint Venture, 2004). Additional factors that contributed to the vireo's decline were (1) the expansion in range of the Brown-headed Cowbird (Molothrus ater), a brood parasite, to include the Pacific coast (U.S. Fish and Wildlife Service, 1986; Franzreb, 1989; Kus, 1998, 1999; Kus and others, 2020) and (2) the introduction of invasive non-native plant species, such as giant reed (Arundo donax), into riparian systems. By 1986, the vireo population in California numbered just 300 territorial males (U.S. Fish and Wildlife Service, 1986).
In response to the dramatic reduction in the number of Least Bell's Vireos in California, the California Fish and Game Commission listed the species as endangered in 1980, and the U.S. Fish and Wildlife Service followed suit in 1986. Since listing, the vireo population in southern California has rebounded, largely in response to cowbird control and habitat restoration and preservation (Kus and Whitfield, 2005). As of 2006, the statewide vireo population was estimated to be approximately 2,500 territories (U.S. Fish and Wildlife Service, 2006), roughly a third of which were on Marine Corps Base Camp Pendleton (MCBCP or Base).
Male Least Bell's Vireos arrive on breeding grounds in southern California in mid-March. Male vireos are conspicuous and frequently sing their diagnostic primary song from exposed perches throughout the breeding season (Kus and others, 2020). Females arrive approximately 1–2 weeks after males and are more secretive. Females often are seen early in the season traveling through habitat with males. The female, with the male's help, builds an open cup nest in dense vegetation approximately 1 meter (m) above the ground. Clutch size for Least Bell's Vireos averages three to four eggs. Typically, the female and male incubate the eggs for 14 days, and young fledge from the nest at 11–12 days of age. It is not unusual for vireos to renest after a failed attempt, provided ample time remains within the breeding season (Kus and others, 2020). Vireos rarely fledge more than one brood in a season, although double-brooding can be more common during some years when breeding conditions are favorable (early nest initiation, high early fledging success; Lynn and Kus, 2009, 2010a). Nesting lasts from early April through July, but adults and juvenile birds remain on the breeding grounds into late September or early October before migrating to their wintering grounds in southern Baja California, Mexico.
Vireo pairs hold territories of approximately 0.5–1.0 hectares (ha) and maintain territory boundaries through vocal interactions with neighboring pairs. Territories remain stable throughout the breeding season, although silent males occasionally venture beyond their territory boundaries. Females sometimes leave their original territory to begin a new breeding attempt with a different male after completing an earlier nesting attempt (either successful or failed). Territory boundaries relax near the end of the breeding season as fledglings explore surrounding habitat. Territory fidelity between years is high for males, with typically 70–90 percent of males returning to within 100 m of their previous breeding territory (Rourke and Kus, 2006, 2007, 2008; Lynn and Kus, 2009, 2010a, b, 2011, 2012, 2013; Lynn and others, 2014, 2015, 2016, 2017, 2018, 2020, 2024a, b).
In 2019, MCBCP began operating an artificial seep along the Santa Margarita River as part of a Conjunctive Use Project. Two additional seeps were installed and activated in early 2021. The artificial seeps pump water to the surface starting in March and ending in August each year during daylight hours and were designed to increase the amount of surface water to enhance Southwestern Willow Flycatcher (Empidonax traillii extimus) breeding habitat. Although these enhancements were designed to benefit Southwestern Willow Flycatchers, few flycatchers have inhabited the seep areas within the past several years (Howell and Kus, 2015, 2016, 2017, 2024a, b, c; Howell and others, 2018, 2020). However, Least Bell’s Vireos are abundant in the enhancement areas and were selected as a surrogate species to determine the effects of the habitat enhancement. Vireos frequently co-occur with flycatchers in riparian habitat and they have similar habitat requirements, such as the presence of riparian obligate trees (typically willows and cottonwoods) with a brushy understory. Vireos and flycatchers have similar territory size, similar territorial behavior (singing from high perches to advertise territory boundaries), and share some similarities in nest placement (nests are placed in the understory vegetation). Although there are some differences in habitat requirements between these two species (flycatchers prefer more mesic conditions that include surface water or elevated soil moisture during at least part of the breeding season; vireos are more tolerant of drier, brushier vegetation sometimes lacking an overstory), vireos were considered sufficiently similar to flycatchers to serve as a surrogate species to evaluate the response of habitat to surface water enhancement and the effect of these habitat changes on vireo breeding productivity. This report presents preliminary analyses of vireo and vegetation response to the artificial seeps.
Specific goals of this study were to (1) determine the size and composition of the vireo population at the Base; (2) characterize habitat used by vireos; (3) band a subset of vireos to facilitate the estimation of vireo annual survival and movement; (4) document the vegetation structure and plant composition within the areas affected by artificial seeps (Seep sites) compared to similar areas without artificial seeps (Reference sites); and (5) assess the effects of the artificial seeps on vireos by measuring annual survival, inter-annual movement, nest success, and breeding productivity of vireos in sites surrounding artificial seeps compared to Reference sites in which no artificial surface water was provided.
Data collected from this study are critical to inform natural resource managers about the status of this endangered species at MCBCP and guide modification of land use and management practices as appropriate to ensure the species’ continued existence. This work was funded by and performed in cooperation with the Assistant Chief of Staff, Environmental Security Resources Management Division, Marine Corps Base Camp Pendleton, California. All activities were covered under 10(a)1(A) Recovery Permit #ESPER0004080-0.1.
Study Areas and Methods
Population Size and Distribution
Most of the MCBCP’s primary drainages, and several minor ones supporting riparian habitat (fig. 1), were surveyed for vireos between April 4 and July 12, 2022. Field work was completed by U.S. Geological Survey biologists Lisa Allen, Rafal Banas, Annabelle Bernabe, Ynez Diaz, Aaron Gallagher, Alexandra Houston, Scarlett Howell, Suellen Lynn, Jessica Medina, Shannon Mendia, Ryan Pottinger, Devin Taylor, Michelle Treadwell, and Stéphane Vernhet.
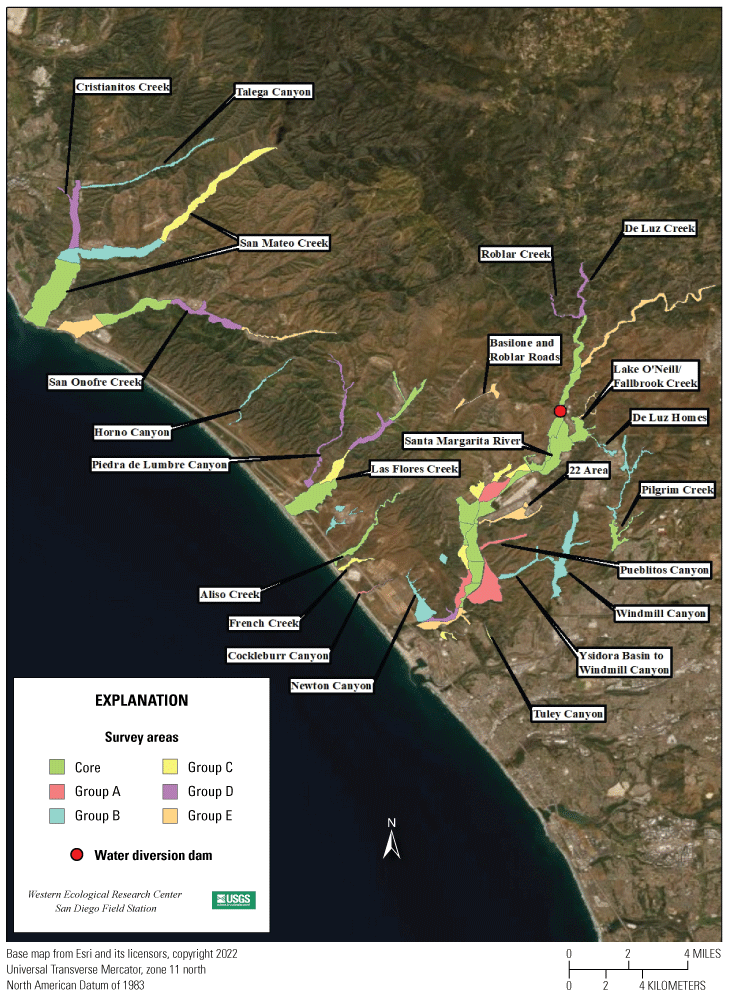
Least Bell's Vireo survey areas at Marine Corps Base Camp Pendleton, 2022.
In 2020, we began a new program for surveying for vireos on MCBCP. The new survey program involved surveying a core area plus a rotating subset of non-core riparian habitat each year rather than surveying the entire Base every year. Selection criteria for surveys within the core area included (1) primary drainages (Santa Margarita River, Las Flores Creek, San Onofre Creek, and San Mateo Creek), (2) historic Southwestern Willow Flycatcher territories, (3) vireo nest monitoring areas from a previous post-fire study (Lynn and others, 2014, 2015, 2016, 2017, 2018, 2020), and (4) the survey unit with the highest average count of flycatchers from 2005 to 2014 in drainages where no historic flycatcher breeding or nest monitoring has occurred (Lee, 2019). Core survey areas were surveyed four times per year at least 10 days apart, every year. Non-core areas were divided into five groups (A–E; fig. 1), each to be surveyed on a rotational schedule once every 5 years. Group D non-core areas were surveyed in 2022. The number of surveys per year in non-core areas varied depending on the amount of suitable habitat, the likelihood of vireo occurrence in the area, and logistical restrictions (for example, denial of range access). All non-core areas were surveyed four times in 2022, except the western section of the south fork of San Onofre Creek, which was surveyed three times, and Roblar Creek and Piedra de Lumbre Canyon, each of which was surveyed twice. The specific areas surveyed are shown in the “Core Areas” and the “Rotating Non-Core Survey Areas: Group D” sections.
Core Areas
-
1. De Luz Creek South, between the confluence of the Santa Margarita River and the confluence with Roblar Creek (appendix 1, fig. 1.1).
-
2. Santa Margarita River:
-
(a) Air Station East, Effluent Seep, Bell North, Bell South: from Basilone Road to a point approximately 8.5 kilometers (km) downstream on the east side of the Santa Margarita River (appendix 1, figs. 1.1, 1.2).
-
(b) Rifle Range, Pump Road (excluding Pump Road Monitoring Area): from the Rifle Range along Stagecoach Road to a point approximately 2.5 km downstream on the west side of the Santa Margarita River (appendix 1, figs. 1.1, 1.2).
-
(c) Above Hospital, Below Hospital East, Below Hospital West: from the confluence with De Luz Creek to Basilone Road (appendix 1, fig. 1.1).
-
-
3. Lake O’Neill section of Fallbrook Creek, all riparian habitat surrounding Lake O’Neill (appendix 1, fig. 1.1).
-
4. Aliso Creek, between the Pacific Ocean and 0.5 km upstream from the electrical transmission lines (appendix 1, fig. 1.2).
-
5. Las Flores Creek (within Las Pulgas Canyon):
-
(a) Lower Las Flores South: between the Pacific Ocean and a point approximately 2 km upstream from Stuart Mesa Road (appendix 1, fig. 1.3).
-
(b) Upper Las Flores North: between a point 1.6 km downstream from Basilone Road to the Zulu Impact Area, approximately 0.75 km upstream from Basilone Road (appendix 1, fig. 1.3).
-
-
6. San Mateo Creek, Lower San Mateo Bottom: from the Pacific Ocean to a point 3.7 km upstream, including habitat south and east of the abandoned agricultural fields (appendix 1, figs. 1.4, 1.5).
-
7. San Onofre Creek, Lower San Onofre East: from a point 1.5 km upstream from the Pacific Ocean to a point approximately 5 km upstream from the Pacific Ocean (appendix 1, figs. 1.3, 1.4).
-
8. Pilgrim Creek, Pilgrim South: between the southern Base boundary and Vandegrift Boulevard, including the two side drainages east of Pilgrim Creek (appendix 1, fig. 1.6).
Rotating Non-Core Survey Areas: Group D
-
1. De Luz Creek North, between the confluence of De Luz Creek and Roblar Creek upstream to the Base boundary (appendix 1, fig. 1.1).
-
2. Roblar Creek, approximately 1.6 km of stream beginning approximately 1 km upstream from the confluence with De Luz Creek and ending at the gate to 409 Impact Area (appendix 1, fig. 1.1).
-
3. Las Flores Creek (within Las Pulgas Canyon), Upper Las Flores South: from 3.8 km upstream from Stuart Mesa Road to 6.3 km upstream from Stuart Mesa Road (appendix 1, fig. 1.3).
-
4. Piedra de Lumbre Canyon, between the confluence with Las Flores Creek and the upstream limit of riparian habitat, approximately 2.7 km upstream from Las Pulgas Lake (appendix 1, fig. 1.3).
-
5. Santa Margarita River, Stuart Mesa West: All riparian habitat northwest of the Santa Margarita River from approximately 0.5 km west of Stuart Mesa Road to approximately 1.7 km upstream from Stuart Mesa Road (appendix 1, fig. 1.2).
-
6. Cristianitos Creek, between the confluence with San Mateo Creek and the Base boundary (appendix 1, fig. 1.4).
-
7. San Onofre Creek, South Fork San Onofre West: from a point approximately 5 km upstream from the Pacific Ocean to a point approximately 8.5 km upstream from the Pacific Ocean (appendix 1, figs. 1.3, 1.4).
Biologists followed standard survey techniques described in the U.S. Fish and Wildlife Service Least Bell's Vireo survey guidelines (U.S. Fish and Wildlife Service, 2001). Observers moved slowly (1–2 km per hour) through riparian habitat while searching and listening for vireos. Observers walked along the edge(s) of the riparian corridor on the upland or river side where habitat was narrow enough to detect a bird on the opposite edge. In wider stands, observers traversed the habitat to detect all birds throughout its extent. Surveys typically began at sunrise and were completed by early afternoon, avoiding conditions of high winds and extreme heat that can reduce bird activity and detectability.
All male Least Bell’s Vireos were detected and confirmed audibly by hearing their diagnostic song. Attempts were made to observe males visually to note banding status but direct observation was not required to confirm the identity of the species, because the song was considered the most diagnostic field characteristic. The presence of a female vireo within a territory was confirmed audibly through the detection of the “pair call,” a unique call elicited between mated birds, or visually when observed traveling quietly with the male. Alternatively, female presence was inferred by observing a nest, the presence of dependent fledglings, or breeding behavior such as a food-carry. For each bird detected, investigators recorded age (adult or juvenile), sex, breeding status (paired, unpaired, undetermined, or transient), and whether the bird was banded. Birds were only considered unpaired if their territories were visited weekly, and no female was ever detected (for example, territories in nest monitoring plots). Birds were considered transients if they were detected only once, or if detected more than once, all detections were within short period of time (maximum of 2 weeks). Vireo locations were mapped using Esri Field Maps (Environmental Systems Research Institute, 2022) on Samsung Galaxy S7 and S8 and LG G5 mobile phones that use Android operating systems with a built-in Global Positioning System to determine geographic coordinates (World Geodetic System of 1984 [WGS 84]).
Habitat Characteristics
Dominant native and non-native plants were recorded, and percent cover of non-native vegetation was estimated using cover categories of less than 5, 5–50, 51–95, and greater than 95 percent within the area used by each vireo detected. The overall habitat type within the territory was specified according to the following categories:
-
Mixed willow riparian: Habitat dominated by one or more willow species, including black willow (Salix gooddingii), arroyo willow (S. lasiolepis), and red willow (S. laevigata), with mule fat (Baccharis salicifolia) as a frequent co-dominant.
-
Willow-cottonwood: Willow riparian habitat in which Fremont cottonwood (Populus fremontii) is a co-dominant.
-
Willow-sycamore: Willow riparian habitat in which Western sycamore (Platanus racemosa) is a co-dominant.
-
Sycamore-oak: Woodlands in which sycamore and coast live oak (Quercus agrifolia) occur as co-dominants.
-
Riparian scrub: Dry or sandy habitat dominated by sandbar willow (S. exigua) or mule fat, with few other woody species.
-
Upland scrub: Coastal sage scrub adjacent to riparian habitat.
-
Non-native: Sites vegetated exclusively with non-native species, such as giant reed and salt cedar (Tamarix ramosissima).
Artificial Seep Study
In April 2019, MCBCP completed construction of a weir system designed to divert water from the Santa Margarita River to Lake O’Neill and several recharging ponds for the Conjunctive Use Project (Vernadero Group, unpub. data, 2018). The purpose of the Conjunctive Use Project is to provide additional water for MCBCP and the Fallbrook Public Utility District (Vernadero Group, unpub. data, 2018). In January 2019, MCBCP began operating an artificial seep along the Santa Margarita River to compensate for groundwater withdrawal upstream (fig. 2; U.S. Fish and Wildlife Service, 2016). Two more artificial seeps were installed in early 2021. A low-volume (20‒40 liters per minute), shallow groundwater irrigation pumping well was installed at each artificial seep location to draw water to the surface. The solar-powered pumps directed water to as many as six outlet pipes at each seep arranged within an area of approximately 1,500 square meters (m2). Water was pumped to the surface during daylight hours starting in March and ending in August each year. Shallow pools created by the seep pumps were small (8–44 m2) and limited to the immediate vicinity of the outlet pipes. The purpose of our study was to measure the effects of the artificial seeps on vegetation and vireo breeding, movements, and survival rates compared to areas where seeps were not operating, beginning in 2020, the first breeding season after the Conjunctive Use Project was implemented. Although the intent was to enhance historic Willow Flycatcher breeding habitat, few Willow Flycatchers have occupied these areas during the past 7 years (Howell and Kus, 2015, 2016, 2017, 2024a, b; Howell and others, 2018, 2020). Least Bell’s Vireos were selected as surrogates for Willow Flycatchers because they were well represented in the areas and their habitat affinities are similar to those of Willow Flycatchers.
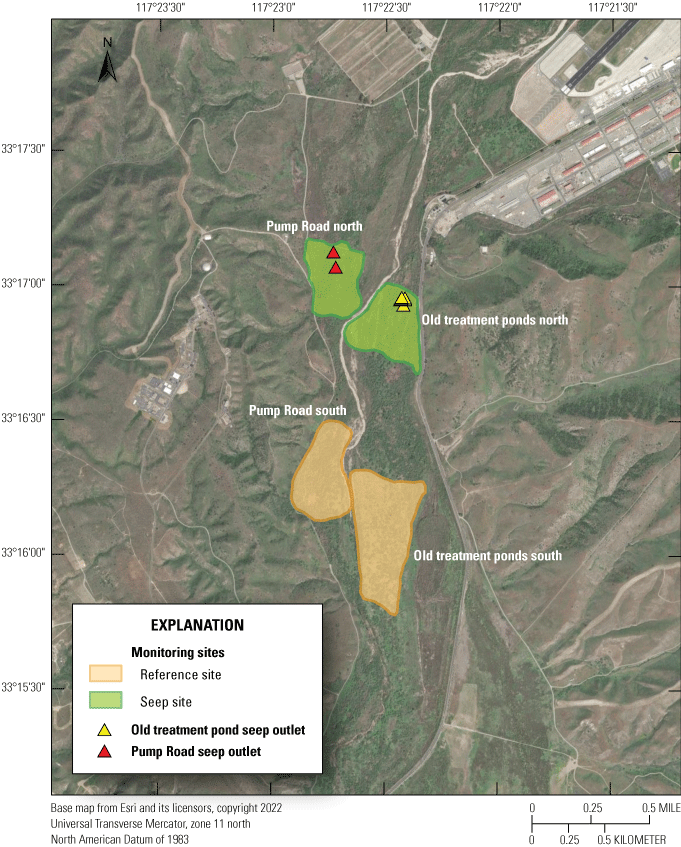
Location of Least Bell's Vireo Seep and Reference sites at Marine Corps Base Camp Pendleton, 2022.
We established two types of study plots: Seep and Reference sites (fig. 2). Two Seep sites were selected to surround and extend downstream from (1) the seep installed in 2019 (northwest of the Old Treatment Ponds area) and (2) one of the seeps installed in 2021 (in the Pump Road area). A Reference site was selected 0.5–0.8 km from each Seep site. Reference sites were on the same side of the Santa Margarita River as their corresponding Seep sites and encompassed similar vegetation as the corresponding Seep site. We anticipate that the Reference sites will become drier relative to the Seep sites as the upstream water diversion effects are manifested.
Vegetation Structure and Plant Composition
We sampled vegetation at two Reference sites and two Seep sites (fig. 2) to examine the response of riparian habitat to locally augmented surface water. We collected vegetation data at 23 territories at Reference sites and 24 territories at Seep sites, centered on the nest closest to the center of each vireo territory, for a total of 47 vegetation sampling locations (appendix 2). Vegetation data were collected using a protocol that combined aspects of flycatcher vegetation sampling in 2001 and 2002 (Rourke and others, 2004) and the “stacked cube” method developed to characterize canopy architecture in structurally diverse riparian habitat for vireos (Kus, 1998). Each sampling location consisted of a center plot (nest location) and 3 satellite plots (fig. 3), totaling 188 sampling plots. Satellite plots were 15 m from the center plot, at 0, 120, and 240 degrees. We collected a Global Positioning System point at the center of each plot.
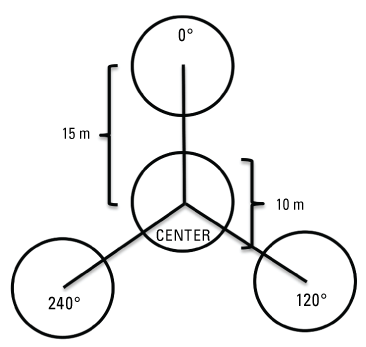
Vegetation sampling plot configuration. Abbreviations: °, degrees; m, meter.
Vegetation cover within 5 m of the center of the plot was visually estimated at seven height intervals: 0–1 m, 1–2 m, 2–3 m, 3–4 m, 4–5 m, 5–6 m, and greater than 6 m. A 7.5-m tall fiberglass telescoping pole (Hastings non-conductive fiberglass telescoping measuring rod, model M-25), demarcated in 1-m intervals, was used to determine height class and canopy height. Overall (or total) foliage cover was recorded as the percent of volume (percent cover) occupied by all foliage in the plot at each height interval, lumping all species together. Overall non-native foliage cover was measured as the percent cover of all non-native species (herbaceous and woody) within the plot at each height interval. Overall foliage and non-native cover were estimated using a modified Daubenmire (1959) scale with cover classes: less than 1, 1–10, 11–25, 26–50, 51–75, 76–90, and greater than 90 percent. Cover classes were further refined using “+” and “−” to indicate whether the estimate was in the upper or lower range of the cover class. We described the composition of vegetation at each height by recording the percentage of the overall foliage cover made up by each of the three species (species 1, 2, and 3) contributing the most cover, and a fourth category of “All Other” species, with the four cover estimates summing to 100 percent. We also measured canopy height (estimated if above 7.5 m) and recorded soil moisture (percentage of relative saturation) at the center of each plot using a Kelway model HB-2 soil pH and moisture meter (kelinstruments.com/kelway-hb-2, Teaneck, New Jersey).
Vireo Survival, Site Fidelity, and Movements
We began color banding Least Bell’s Vireos on MCBCP in 1995, and by the end of 2021, almost 1,000 vireos had been color banded. The primary goals of banding vireos were to (1) evaluate adult and first-year annual survival; (2) evaluate vireo site fidelity within a potential source population; (3) investigate natal dispersal on Base and the role MCBCP young play in potentially supporting vireo populations off Base and starting in 2020; (4) evaluate how artificial seeps affected vireo site fidelity, dispersal, and annual survival. The regional Least Bell’s Vireo color banding convention designates orange or gold as the color representing MCBCP. Therefore, nestlings from monitored nests were banded with a single anodized gold numbered federal band on the left leg at 6–7 days of age. When identification of neighboring territories was in question, adult vireos within Seep and Reference sites were captured in mist nets and banded with a unique combination of colored plastic and anodized metal bands, including either an anodized gold or orange plastic band or both, depending on the available color combinations, to designate MCBCP as the bird’s site of origin. Returning adults previously banded as nestlings with a single numbered federal band were target netted to determine their identity, and their original band was supplemented with other bands to generate unique color combinations.
Survival Estimates
During surveys and nest monitoring activities, we attempted to resight all vireos to determine if they were banded, and if so, to confirm their identity by reading their unique color band combination or by recapturing birds with single federal bands. We used resighting and recapture data from core survey areas and nest monitoring areas to calculate annual survival rates.
Annual survival was calculated for (1) adults Base-wide; (2) first-year vireos that were banded as nestlings or juveniles Base-wide (in other words, first-year survival); (3) adults that were initially detected at Seep or Reference sites and returned to Seep or Reference sits; and (4) first-year vireos that were banded as nestlings or juveniles at Seep or Reference site. We examined the effects of precipitation, sex, age, and year on annual survival. Precipitation data were collected from Lake O’Neill on MCBCP (Office of Water Resources, 2022) and were grouped into bio-year (July 1 through June 30). Most of the annual precipitation accumulates during the winter months in southern California (fig. 4). Using bio-year to group annual precipitation allows us to examine the effects of the entire wet season, rather than breaking up the wet months into separate periods.
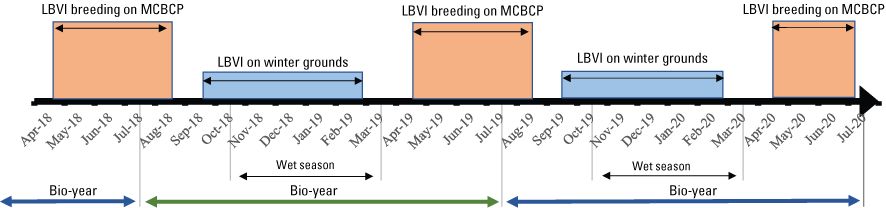
Timeline relating Least Bell’s Vireo (LBVI) life cycle stages, bio-year, and seasonality of annual precipitation (wet season), represented for April 2018 through July 2020. Abbreviation: MCBCP, Marine Corps Base Camp Pendleton.
Imperfect detectability of banded individuals is typical of mark-recapture studies and happens for various reasons (for example, females are more cryptic and may be missed on surveys; birds are detected as banded, but their full color combinations [and thus identities] are not obtained; birds with single federal bands are not recaptured, and thus, their identities are not determined). To account for individuals that were present but not detected, we used RMark (White and Burnham, 1999; Laake, 2013) to model survival and detection probability of vireos from 2005 to 2022 (see the “Annual Survival” section).
Site Fidelity and Movement
Site fidelity and movement of vireos were determined by measuring the distance between the center of a vireo’s breeding or natal territory in 2021 and the center of the same vireo’s breeding territory in 2022. Vireos demonstrated site fidelity if they returned to within 100 m of their 2021 territory (Kus and others, 2020).
Site fidelity and movement were calculated for the same four categories analyzed for annual survival (see the “Survival Estimates” section), except we excluded individuals that did not have a known territory location before 2022. For example, juveniles banded after fledging were excluded because their natal territories could not be confirmed because of their capacity for substantial movement. Vireos captured at the Monitoring Avian Productivity and Survivorship (MAPS) stations on Base were excluded unless their territory locations were known from surveys.
Nest Success and Breeding Productivity
Our purposes for monitoring Least Bell’s Vireo nests were to evaluate how vireo nest success and productivity were affected by alteration of vireo habitat by the artificial seeps compared to reference sites with no augmented surface water. We monitored vireo nests at two Seep sites and two Reference sites to compare differences between the two groups. Nesting activity was monitored at 25 territories in Seep sites and 25 territories in Reference sites between March 31 and July 28, 2022. Territories were chosen in order of the vireos’ arrival, with priority given to territories occupied by banded vireos or territories that had been monitored in previous years. Vireos were observed for evidence of nesting, and their nests were located. Nests were visited as infrequently as possible to minimize the chances of leading predators or Brown-headed Cowbirds to nest sites; typically, there were three to five visits per nest. The first visit was timed to determine the number of eggs laid, the next few visits were used to determine hatching and age of young, and the last visit was used to band nestlings. Fledging was confirmed through detection of young outside the nest, or rarely, the presence of feather dust in the nest. Unsuccessful nests were placed into one of four nest fate categories: (1) “Depredated,” nests that were empty or destroyed before the estimated fledge date and the adult vireos were not seen tending fledgling(s); (2) “Parasitized,” previously active nests that were subsequently abandoned by adult vireos after one or more Brown-headed Cowbird eggs were laid in the nest or any nests that fledged cowbird young without fledging vireo young; (3) “Other,” nests that failed for other reasons, such as poor nest construction, the collapse of a host plant that caused a nest’s contents to be dumped onto the ground, the presence of a clutch of infertile eggs, or other causes that were known; and (4) “Unknown,” nests that appeared intact and undisturbed but were abandoned with vireo eggs or nestlings. Characteristics of nests were recorded after abandonment or fledging of young from nests. These records included nest height, host species, host height, the distance nests were placed from the edge of the host plant, and distance of the nest to the edge of the vegetation clump in which they were placed.
To determine if the artificial seeps affected vireo productivity, we compared vireo breeding productivity between Seep and Reference sites in 2022 using several metrics. We examined nest success and the proportion of nests that were depredated or parasitized by cowbirds, and the likelihood of renesting after a first nesting attempt (successful or failed), to associate the effects altered habitat may have on the vulnerability of vireo nests to predators and brood parasites. We also examined clutch size (the maximum number of vireo eggs known to be laid in the nest), the proportion of eggs that hatched, the proportion of nestlings that fledged, the proportion of eggs that produced fledglings, the proportion of nests that successfully fledged young, the total number of fledglings per pair, and the proportion of pairs that had at least one successful nest. We examined vireo nest placement to explore vireo response to potential differences in vegetation structure between Seep and Reference sites.
Marine Corps Base Camp Pendleton implements an intensive annual cowbird control program on Base, and parasitism of Least Bell’s Vireo nests is extremely rare. Nevertheless, when necessary, we followed our standard protocol for manipulating nest contents in the event cowbird eggs or nestlings were detected in vireo nests. In nests with fewer than three vireo eggs, cowbird eggs were removed no sooner than the seventh day of incubation to minimize the possibility of nest abandonment in response to the removal. Cowbird eggs were removed from nests containing three or more vireo eggs as they were detected. Cowbird nestlings were removed immediately from nests.
Data Analyses
Population Size and Distribution
Because we began a core plus rotating non-core survey design in 2020, we limited our examination of annual differences to vireo territories that were within the core survey areas. We present summaries of vireo territories in non-core survey areas without annual comparisons. Non-core survey results will be summarized every fifth year (for example, in 2024, 2029, and so on) when a round of non-core surveys has been completed. We examined annual differences in the dates vireos arrived and established breeding territories by compiling the total number of vireo territories established by the end of each month (April, May, June, and July) within core survey areas, all of which were surveyed at least four times annually for the past 18 years. We also calculated the projected Base-wide vireo population size in 2022 based on the proportion of all vireo territories that were counted within core survey areas from 2005 to 2019. First, for each year from 2005 to 2019, we calculated the proportion of all vireo territories on Base that were counted within the core survey areas (core/total); then, we multiplied these proportions by the number of vireo territories that were counted within core survey areas in 2022 to arrive at a range of projected number of vireo territories Base-wide in 2022.
Vegetation Structure and Plant Composition
At each height category, the estimates of the top three species contributing the most cover and the fourth category representing “All Other” were converted to percent cover values of the sampling plot area (n=188) by dividing the estimate by the overall cover at that height. We then calculated the average percent cover of each plant species, percent overall cover, percent cover of non-native plant species, canopy height, and soil moisture across the center and three satellite plots at each sampling location to obtain means for each territory (n=48). For the three top species, we further classified plant species into native herbaceous vegetation, woody vegetation (including native and non-native species), and all herbaceous vegetation to calculate percent cover of each of these three groups at each height category and sampling location. We also identified the maximum canopy height among the center and three satellite plots at each sampling location. We used Student’s t-tests to determine if there were differences between Seep and Reference sites in (1) average canopy height, (2) maximum canopy height, (3) soil moisture, (4) vegetation volume (percent cover) of all plant species (overall cover), (5) vegetation volume of non-native species (including herbaceous and woody species), (6) vegetation volume of native herbaceous species, and (7) vegetation volume of woody species at each height category. We used Pearson’s correlation to examine the relationship between soil moisture at Seep site plots and the distance of the plot from the seep outlets at the sampling plot scale. We also used Pearson’s correlation to examine the relationship between soil moisture at all locations and (1) canopy height, (2) percentage overall foliage cover at each height category, and (3) percentage of herbaceous cover (including non-native herbaceous species) at all height categories at the sampling location scale.
Annual Survival
Base-Wide Survival
We analyzed annual survival of banded vireos on MCBCP in Program MARK version 8.2 (White and Burnham, 1999) using the RMark package (Laake, 2013) in R (R Core Team, 2022). Survival analysis in Program MARK accounts for individuals that were present but not “captured” (detected) by modeling survival and detection probabilities. Annual survival models were built for 2005–22 by creating an encounter history matrix of all individual vireos ever detected in MCBCP core survey areas, as well as the Pump Road Monitoring Area, to record if they were observed in each year from 2005 to 2022. In the encounter history, a 1 is used if the bird was detected and a 0 if the bird was not detected. We included the Pump Road Monitoring Area because, although it is not a core survey area, we resight for banded birds there every year during our demographic monitoring activities. Although nest monitoring sites were visited more frequently than core survey areas, we assumed detectability was the same between these two areas because we used broadcasted songs to enhance detectability of vireos. We rarely detected banded birds for the first time after the second survey, indicating that we were able to resight and identify almost all vireos by the end of May, regardless of their location.
Vireos were grouped by sex (female and male) and age: "first-year" indicates birds that were first detected and banded as nestlings or juveniles, and "adult" indicates birds were first detected and banded as adults and any first-year bird that survived to adulthood. Survival rate was assumed to be constant for adults once they survived their first year. We created two sets of models. In the first set, which included only survival of adults past their first year (n=858), we instructed MARK to use the encounter history containing all birds but excluded the first-year interval for any bird first detected as a juvenile (in other words, we removed the juvenile-to-adult time interval). For this adults-only set, we modeled the effect of sex, year, and precipitation during the bio-year preceding the survival year. For instance, precipitation data from July 1, 2004, to June 30, 2005, were used for the 2005–06 survival year (Office of Water Resources, 2022). We allowed detection probability to vary by sex and year. Detection probability accounted for sex because of sex-related behaviors (males are more obvious than females) and year because of annual differences in observers, number of surveys, and survey conditions (for example, surveys started late in 2011). When allowing detection probability to vary by year, any model that also includes year as a survival parameter cannot separate the estimate of survival rate from detection probability for the last time interval (2021–22; Cooch and White, 2022). Therefore, to provide a conservative estimate of survival for the last time interval, we fixed the detection probability for 2021‒22 equal to 1. The survival estimate for this time interval will likely increase in the future with subsequent opportunities to recapture and resight birds. We created six adults-only models: (1) the constant model (no covariates, describing survival when none of our covariates was allowed to account for variability); (2) sex (describing the effect of sex on survival); (3) precipitation (describing the effect of precipitation on survival); (4) year (describing annual differences in survival); (5) sex + precipitation (describing the additive effects of sex and precipitation); and (6) sex + year (describing the additive effects of year and sex). The second set of models included adults and first-year birds (n=2,790) and examined the effect of age, year, and bio-year precipitation on survival. We allowed detection probability to be affected by year to account for annual differences as described in the first set of models. This model set did not include sex because we were unable to determine sex of vireos banded as nestlings unless they returned and were recaptured and identified as adults. Therefore, only the nestlings that survived their first winter could be classified retroactively as male or female, which severely biases the estimate of sex-related survival of first-year vireos. As with the adults-only models, we fixed detection probability for 2021–22 equal to 1. We created six age-related models: (1) the constant model (no covariates, describing survival when none of our covariates was allowed to account for variability); (2) age (describing the effect of age on survival); (3) precipitation (describing the effect of precipitation on survival); (4) year (describing annual differences in survival); (5) age + precipitation (describing the additive effects of precipitation and age group); and (6) age + year (describing the additive effects of year and age group). Survival estimates were derived from the top model. Models created for survival in RMark only included detections from sites at which survey effort has been consistent from 2005 to 2022 (including MCBCP core survey areas, artificial seep study nest monitoring areas, the lower San Luis Rey River, and the middle San Luis Rey River). Incidental resights outside of these survey sites were excluded from analysis. Additionally, we did not include detections from MAPS captures because MAPS effort was considered different from survey effort. We excluded adults with unknown sex from our first model set analysis because we were not interested in defining characteristics of this group.
Vireo Survival and Return Rates at Seep and Reference Sites
We used RMark (White and Burnham, 1999; Laake, 2013) to model the return rate of banded adult vireos to Seep or Reference sites between 2020 and 2022. RMark uses program MARK to create models with or without covariates (user-designated) and produces metrics for evaluating the validity of each model or how well the model fits the data relative to the other models. For the adults-only set of models, we were most interested in potential differences in return rates to Seep versus Reference sites rather than annual survival rates, so we excluded all detections outside of Seep and Reference sites. We grouped adult vireos by sex and treatment (whether they were originally detected at a Seep site or a Reference site) and created a set of models similar to the Base-wide analysis for adults. We held detectability constant because all monitored birds at these sites were identified each year so there was no sex-related or year-related difference in detectability.
We did not have enough data to use RMark to model first-year survival for vireos that had been banded as nestlings at either a Seep or Reference site (only three vireos banded as nestlings survived more than 1 year to contribute to adult survival rate). Instead, we present rough redetection rates (apparent survival, the number of first-year vireos detected in 2022 divided by the number of nestlings banded in 2021) for first-year vireos. For first-year vireos, we were interested in survival within and beyond monitoring sites, so calculations included all nestlings from successful nests that were banded in 2021 and were redetected anywhere in monitoring areas, core survey areas, and in nearby regularly surveyed areas on the San Luis Rey River in 2022.
Model Evaluation
We used an information-theoretic approach (Akaike’s Information Criterion for small sample sizes [AICc]; Burnham and Anderson, 2002) to evaluate support for models regarding the effects of sex, age, year, precipitation, and original location at a Seep or a Reference site (treatment) on vireo survival. For the adults-only model sets, we hypothesized that females would have a lower return rate than males and that the return rate would be higher for Seep sites than for Reference sites, although this difference might not be apparent within the first few years after seep installation. We used logistic regression with a logit link to build and rank the constant model plus five models (for Base-wide, adults-only survival) and eight models (for Seep and Reference sites, adults-only return rate) by AICc, where the model with the lowest AICc in each model set was the highest ranked model. Models were considered well supported if they were within 2 AICc of the highest-ranked (top) model (difference in AICc [ΔAICc] less than 2). We examined the contributions that covariates made to the well supported models by calculating the odds ratio for each covariate in the model (the odds that the covariate affected survival such that no effect equaled 1, negative effect was less than 1, and positive effect was greater than 1) and then examining the 95-percent confidence interval of the odds ratio. For example, if the 95-percent confidence interval of the odds ratio was greater than 1 (and did not include 1), we had 95-percent confidence that the covariate had a positive effect on survival relative to the reference, and therefore, we considered that the covariate significantly contributed to the model. We used the top model to obtain estimates of annual survival for adult females and adult males for Base-wide survival.
For the model set that included first-year vireos, we hypothesized that first-year survival would be lower than adult survival. We used logistic regression with a logit link to build and rank the constant model plus five models with combinations of age, year, and bio-year precipitation before ranking these models from lowest to highest AICc. We used the top model to obtain estimates of survival for adults and first-year birds.
Vireo Territory Density at Seep and Reference Sites
To determine if vireo territory density changed after seep pumps were installed at the Seep sites, we counted the total number of vireo territories detected within each monitoring site from 2015 to 2022. We chose this time span because it encompasses the expected project length (5 years) before and after the first seep was installed. We divided the number of territories by the area (ha) within the boundaries of each of the four monitoring sites, then took the average of the two Seep sites and the two Reference sites. We used paired Student’s t-tests (paired by year) to compare the vireo territory density at Seep sites with the territory density at Reference sites in the 3 years preceding seep pump installation (2017–19) and the 2 years after seep pumps were installed at both sites (2021–22).
Nest Success and Breeding Productivity
We used chi-square or Fisher’s exact tests to determine if there were differences between Seep and Reference sites in (1) the likelihood of vireos renesting after a first nesting attempt, (2) the likelihood of renesting if the first nesting attempt failed or was successful, (3) the proportion of nests that successfully fledged young, (4) the proportion of nests that were depredated, (5) whether or not the first nest attempt was successful, (6) the proportion of eggs that hatched, (7) the proportion of nestlings that fledged, (8) the proportion of eggs that produced fledglings, (9) the proportion of nests that produced fledglings, and (10) the number of pairs that had at least one successful nest. Chi-square tests were used when sample sizes were sufficient; Fisher’s exact tests were used when one or more categories contained fewer than five samples.
We used Student’s t-tests to determine if there were differences between Seep and Reference sites in (1) the number of nesting attempts, (2) clutch size, and (3) number of fledglings per pair. For nest success and breeding productivity analyses, bio-year precipitation was calculated from July 1 of the year before breeding to June 30 of the breeding season year (for example, precipitation from July 1, 2021, to June 30, 2022, was related to breeding parameters in 2022). We used Pearson’s correlation to determine if there was a relationship between precipitation during the bio-year immediately preceding the breeding season and (1) the number of fledglings produced per pair, (2) the number of fledglings produced per egg, and (3) the proportion of all nests that successfully fledged young by year from 2005 to 2022. If nests were parasitized by Brown-headed Cowbirds, rescued by removing the cowbird egg(s) or nestling(s), and subsequently fledged vireo young, all success and productivity calculations were rerun treating successful rescued nests as failed nests to estimate the potential impact(s) of cowbird parasitism on the Pendleton vireo population.
Data were analyzed using Program R (R Core Team, 2022). Two-tailed tests were considered significant if P≤0.10. Means are presented with standard deviations. All data from the MCBCP from 2005 to 2021 used in comparisons with data collected for this report are in Rourke and Kus, 2006, 2007, 2008; Lynn and Kus, 2009, 2010a, b, 2011, 2012, 2013; Lynn and others, 2014, 2015, 2016, 2017, 2018, 2020, 2024a, b. Data from before 2005 was extracted from unpublished reports by Griffith Wildlife Biology (unpub. data, 2004).
Daily Nest Survival
We used RMark (White and Burnham, 1999; Laake, 2013) in program MARK to calculate daily survival rate (DSR) of vireo nests, which accounts for the variability in exposure days across nests documented at different stages of the nesting cycle and allows for the analysis of the effects of covariates on DSR (Dinsmore and others, 2002). Using RMark, we modelled the effects of the Seeps on DSR. Nest survival was calculated across a 32-day cycle length: 2 days for the last day of nest construction and a day of rest before the first egg is laid, 4 days for egg-laying, 14 days for incubation, and 12 days for the nestling period. Age of nests at the time they were discovered was calculated in days by forward- or backward-dating of nests in relation to known dates of nest-building, egg-laying, or hatching. Data compiled for each nest included (1) the Julian dates for when the nest was first found, last active, and last checked; (2) the nest fate (successful or unsuccessful); (3) the age of the nest (in days) when it was initiated, relative to the first nest found that year; (4) if the nest was in a Seep site or a Reference site; and (5) the year. We used AICc (see the “Annual Survival” section) to evaluate support for nest survival models reflecting a priori hypotheses regarding the effect of Seeps on DSR. We hypothesized that DSR would be higher in Seep sites than in Reference sites and that DSR would decrease annually in Reference sites as the habitat became drier relative to the Seep sites. We used logistic regression with a logit link to build models. First, we generated a constant survival model to serve as a reference for the effect of treatment (Seep versus Reference) on DSR. We then created models with treatment, year, the combined effect of treatment and year (treatment + year), and the interaction of treatment and year (treatment * year) and evaluated support for the models in relation to the constant survival model. We examined the well supported models further by calculating the odds ratio for each covariate in the model (see the “Annual Survival” section).
Nest Characteristics
We summarized the total number of nests that were placed in each host plant species by site type (Seep versus Reference). We used Student’s t-tests to determine if there were differences in (1) nest height, (2) host plant height, (3) diameter of the host plant canopy at nest height, (4) distance to the edge of the host plant, and (5) distance to the edge of the vegetation clump in which the nest was between Seep and Reference sites. We also used Student’s t-tests to determine if there were differences in nest placement characteristics between successful and failed nests within Seep and Reference sites.
Results
Population Size and Distribution
Core Survey Areas
We detected 585 male Least Bell's Vireos in core survey areas during Base-wide surveys (fig. 5; appendix 3). Of these vireos, 571 were territorial males, 81 percent of which were confirmed as paired, and 14 were transients (table 1). This total represents a 4-percent increase in territorial males from the same areas surveyed in 2021 (551; table 2). Transient vireos were observed on six of the eight (75 percent) drainages and sites surveyed. Most vireos (90 percent) were on the four most populated drainages/sites (Santa Margarita River, Las Flores Creek, San Mateo Creek, and Pilgrim Creek), and 73 percent were along the Santa Margarita River, which is the largest expanse of riparian vegetation on Base (tables 1, 2). The remaining 4 drainages and sites each contained fewer than 20 territories.
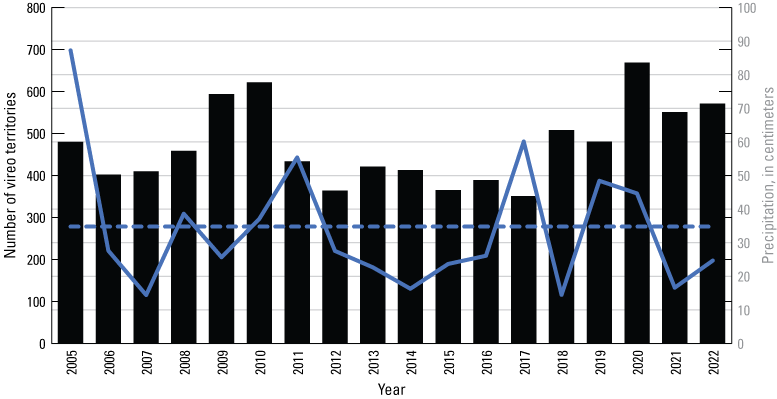
Number of Least Bell’s Vireo territories in core survey areas (black bars) and bio-year precipitation (July 1–June 30, ending in the survey year; solid blue line; Office of Water Resources, 2022) at Marine Corps Base Camp Pendleton, 2005–22. Dotted blue line is average bio-year precipitation from 1950 to 2000 at Lake O’Neill.
Table 1.
Number and distribution of Least Bell's Vireos in core survey areas at Marine Corps Base Camp Pendleton, 2022.[ha, hectare]
Table 2.
Number of territorial male Least Bell’s Vireos in core survey areas at Marine Corps Base Camp Pendleton, by drainage, 2005–22.[Number includes only singing males determined to hold territories. Numeric change is the positive or negative change in the number of vireo territories between 2021 and 2022. Percent change is the positive or negative percent change in vireo territories within that drainage from 2021 to 2022]
From 2005 to 2019, 55–62 percent of resident males detected on MCBCP were within the core areas (average 57±2 percent). Assuming the vireo population on the rest of MCBCP in 2022 did not vary from the 2005 to 2019 distribution, we estimated between 918 and 1,047 resident vireos on MCBCP in 2022.
The distribution of Least Bell's Vireo territories documented on Base in 2022 was similar to 2021 across all core survey areas (table 2; appendix 4). From 2021 to 2022, the percentage of vireo territories in each drainage (number of vireo territories detected in the drainage/total number of vireo territories in core survey areas) changed by 1 percent or less in every drainage except at the Santa Margarita River (increased by 4 percent). The number of vireo territories increased in three drainages and decreased in the remaining five drainages. The Santa Margarita River continued to support the most vireo territories, increasing by 9 percent (36 territories; table 2). Fallbrook Creek and Pilgrim Creek increased by 25 and 11 percent, respectively (3 territories and 2 territories, respectively). Las Flores Creek, the second most populated drainage, decreased by 6 percent (3 territories). De Luz Creek decreased by 41 percent (7 territories), San Onofre Creek decreased by 22 percent (5 territories), Aliso Creek decreased by 14 percent (2 territories), and San Mateo Creek decreased by 11 percent (4 territories).
In July 2021, the Sierra wildfire burned approximately 420 ha along Basilone Road northwest of the Santa Margarita River (fig. 6). Approximately 22 ha of vireo habitat was burned, skirting the edge of the riparian habitat along the Santa Margarita River. In 2022, after the fire, the centers of three vireo territories fell within the fire perimeter. In 2020 and 2021, before the fire, the centers of eight vireo territories and three vireo territories, respectively, were within the same fire perimeter.
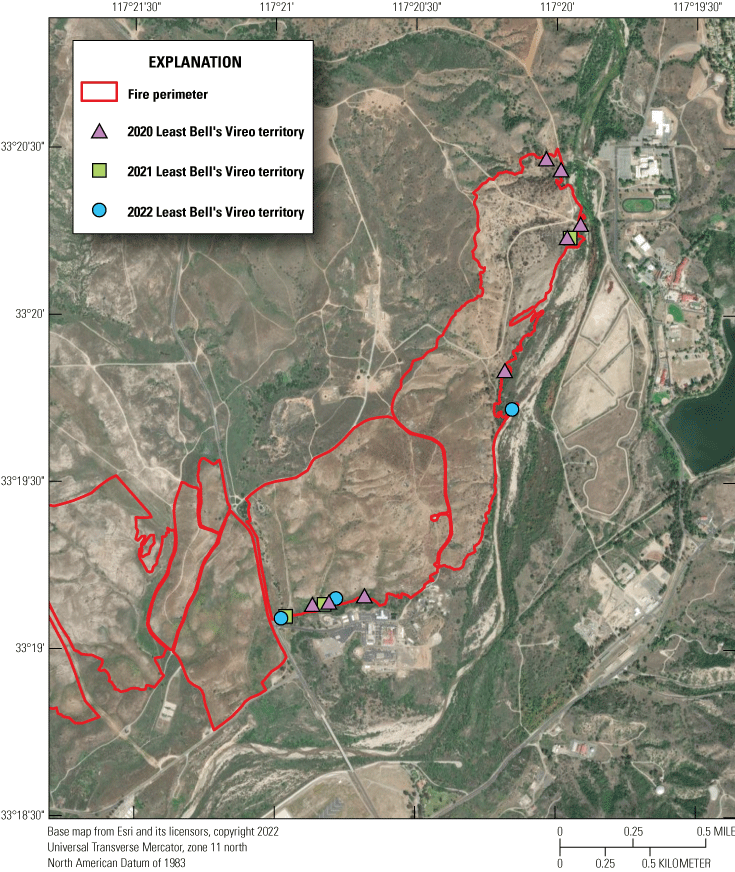
Perimeter of Sierra Fire that burned on Marine Corps Base Camp Pendleton in July 2021 and locations of Least Bell’s Vireo territories in relation to the fire footprint.
In 2022, the proportion of surveys during which Brown-headed Cowbirds were detected (0.45) was the highest documented since 2005 (table 3). The second highest proportion of surveys where cowbirds were detected was in 2010 (0.37), followed by 2005 (0.23). During 2022, cowbirds were detected during every month (April through July) at De Luz Creek, Las Flores Creek, and the Santa Margarita River, and during April, June, and July at Pilgrim Creek.
Table 3.
Proportion of all surveys during which Brown-headed Cowbirds (Molothrus ater) were detected in core survey areas at Marine Corps Base Camp Pendleton, by drainage, 2005–22.[Number of survey areas is the number of distinct survey units that were surveyed multiple times per year within the drainage. Abbreviation: —, no data]
Non-Core Survey Areas
A total of 92 male vireos, including 90 territorial males and two transients, were detected in non-core survey areas in 2022 (table 4). Most of the territorial males (61 percent) were confirmed as paired.
Table 4.
Number and distribution of Least Bell's Vireos in non-core survey areas at Marine Corps Base Camp Pendleton, 2022.[ha, hectare]
Habitat Characteristics
Core Survey Areas
Vireos used several habitat types ranging from willow-dominated thickets along stream courses to upland scrub (table 5). Most vireo locations in core survey areas were in habitat characterized as mixed willow riparian, with 52 percent of males in the study area present in this habitat. An additional 8 percent of birds occupied willow habitat co-dominated by cottonwoods or sycamores. Riparian scrub, dominated by mule fat, sandbar willow, or blue elderberry (Sambucus mexicana) was prevalent at 37 percent of vireo territories. Two percent of vireos occupied upland scrub, and 1 percent occupied drier habitat characterized by a mix of sycamore and oak.
Table 5.
Habitat types used by Least Bell's Vireos in core survey areas at Marine Corps Base Camp Pendleton, 2022.[Habitat types are included for resident and transient Least Bell’s Vireo locations. Abbreviations: >, greater than; <, less than]
The proportion of vireos documented in non-native vegetation in core survey areas increased slightly from 2021 to 2022 (table 6; appendix 5); 11 percent (63/585) of vireos in 2022 were in areas where non-native species comprised at least 50 percent of the habitat. Of the territories dominated by non-native vegetation, 65 percent contained predominantly poison hemlock (Conium maculatum), 33 percent contained predominantly black mustard (Brassica nigra), and 2 percent contained predominantly pepperweed (Lepidium latifolium). Six of the eight drainages in 2022 contained territories dominated by non-native vegetation. Two of these drainages (the Santa Margarita River and Las Flores Creek) also contained territories dominated by non-native vegetation every year since 2015. Overall, 2005 remained the year with the highest number of territories dominated or co-dominated by non-native vegetation.
Table 6.
Proportion of Least Bell’s Vireo territories, including areas occupied by transients, dominated, or co-dominated by non-native vegetation, by drainage, 2005–22.Non-Core Survey Areas
Most vireo locations in non-core survey areas were in habitat characterized as mixed willow riparian, with 50 percent of males in the study area using this habitat (table 7). An additional 10 percent of birds occupied willow habitat co-dominated by cottonwoods (2 percent) or sycamores (8 percent). The second most represented habitat type was riparian scrub (33 percent of territories), and 1 percent of vireos occupied upland scrub.
Vegetation at Artificial Seep and Reference Sites
Generally, Seep sites had more cover in the understory than Reference sites. Total cover was significantly greater at Seep sites than at Reference sites below 2 m (fig. 7). Woody cover was greater at Seep sites than at Reference sites between 1 and 2 m. Native herbaceous cover was greater at Seep sites than at Reference sites between 1 and 4 m, although there was little native herbaceous cover at either site above 2 m. Non-native cover was greater at Reference sites than at Seep sites above 2 m. Total herbaceous cover (native and non-native combined) was significantly greater at Seep sites than at Reference sites below 4 m. The average canopy height at plots in Seep sites was lower than at Reference sites (8.1±1.8 m versus 9.0±1.7 m, respectively; t=−1.8, P=0.08). There was no significant difference in maximum canopy height between plots at Seep and Reference sites (Seep: 11.4±3.0 m; Reference: 11.7±2.6 m; t=−0.4, P=0.67).
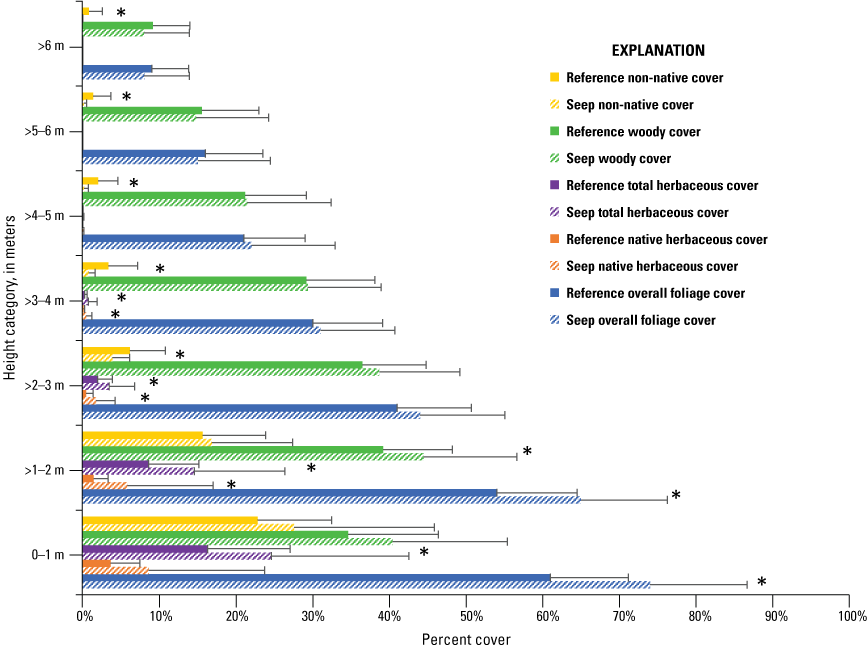
Average total percent cover by height class and plant type at Seep and Reference sites, Santa Margarita River, Marine Corps Base Camp Pendleton, 2022. Error bars represent 1 standard deviation. Asterisk (*) indicates a significant difference (P≤0.10). Abbreviations: >, greater than; %, percent.
Soil moisture was significantly greater at Seep sites (57±33 percent) than at Reference sites (24±26 percent; t=3.8, P<0.01). Similarly, soil moisture decreased significantly with increasing distance from the nearest seep outlet (r=−0.37, P<0.01). There was also a significant positive correlation between soil moisture and total foliage cover and woody cover at most height categories (table 8). There was a significant positive correlation between soil moisture and native herbaceous cover at 2–3 m, and negative correlations between soil moisture and non-native foliage cover from 2 to 6 m. There were no significant correlations between soil moisture and total herbaceous cover at any height class (r=−0.01–0.23, P=0.38–0.97) or between soil moisture and canopy height (r=0.11, P=0.46).
Table 8.
Pearson’s correlations between soil moisture and vegetation cover by height category.[r, correlation coefficient; P, probability that the statistical test result was false; m, meter; <, less than; —, no data; >, greater than]
Measures of vireo nest productivity were correlated with cover of different foliage types at the lowest height categories. The number of fledglings produced per egg was positively correlated with woody cover below 2 m (table 9). Conversely, the number of fledglings produced per egg and the number of fledglings produced per pair were both negatively correlated with total herbaceous cover below 2 m. The number of fledglings produced per pair was negatively correlated with non-native cover below 2 m and the number of fledglings produced per egg was negatively correlated with native herbaceous cover from 1 to 2 m.
Table 9.
Pearson’s correlations between two measures of Least Bell’s Vireo nest productivity and percent foliage cover at height categories below 2 meters.[r, correlation coefficient; P, probability that the statistical test result was false; m, meter]
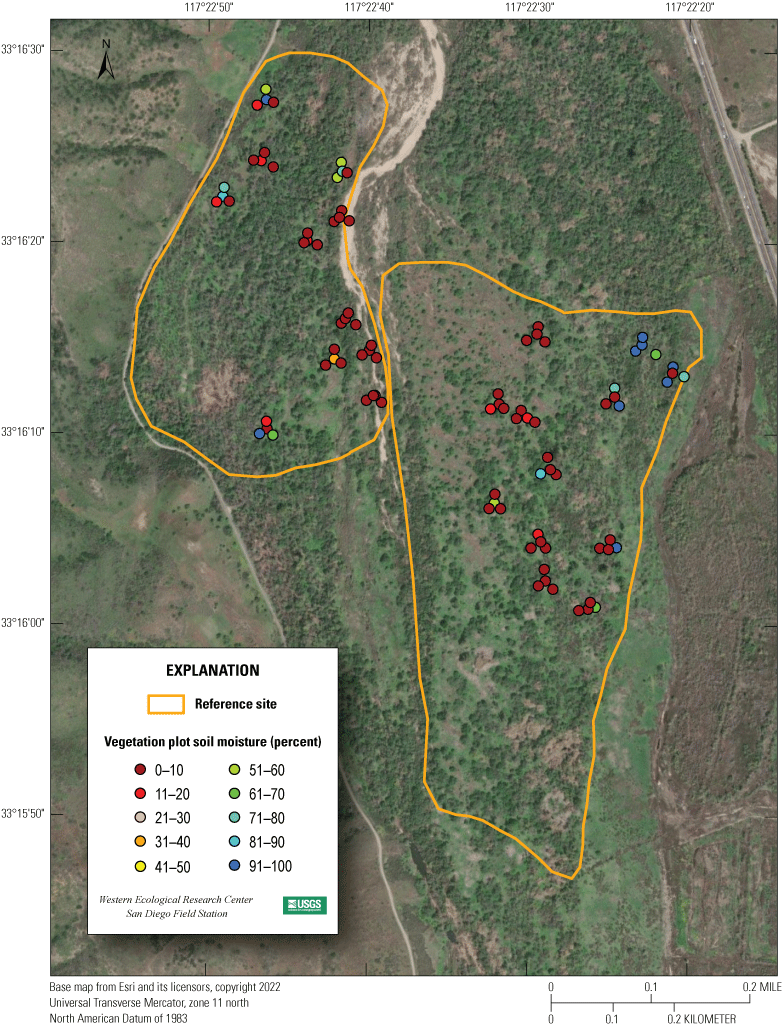
Soil moisture varied geographically across all four monitoring sites. Plots near the western edge of the Seep site in the Old Treatment Pond area were dry, with few exceptions, despite being close to the main river channel (fig. 8). The highest soil moisture in the Old Treatment Ponds Seep site was mostly concentrated in the southeastern plots, with some wetter plots occurring closer to the seep pump outlet. Similar to the Old Treatment Ponds Seep site, plots closest to the main river channel on the eastern side of the Pump Road Seep site were also dry. Conversely, most of the remaining plots at the Pump Road Seep site contained a high concentration of wet plots. A cluster of wet plots was in the northeastern corner of the Old Treatment Ponds Reference site, whereas the remainder of the site was dry, including plots closest to the main river channel (fig. 9). Similarly, the Pump Road Reference site was almost uniformly dry, with only four plots with soil moisture higher than 60 percent. The dirt road that defines the western border of both Pump Road sites had some surface water in early April but, unlike in previous years, was dry by the beginning of May.
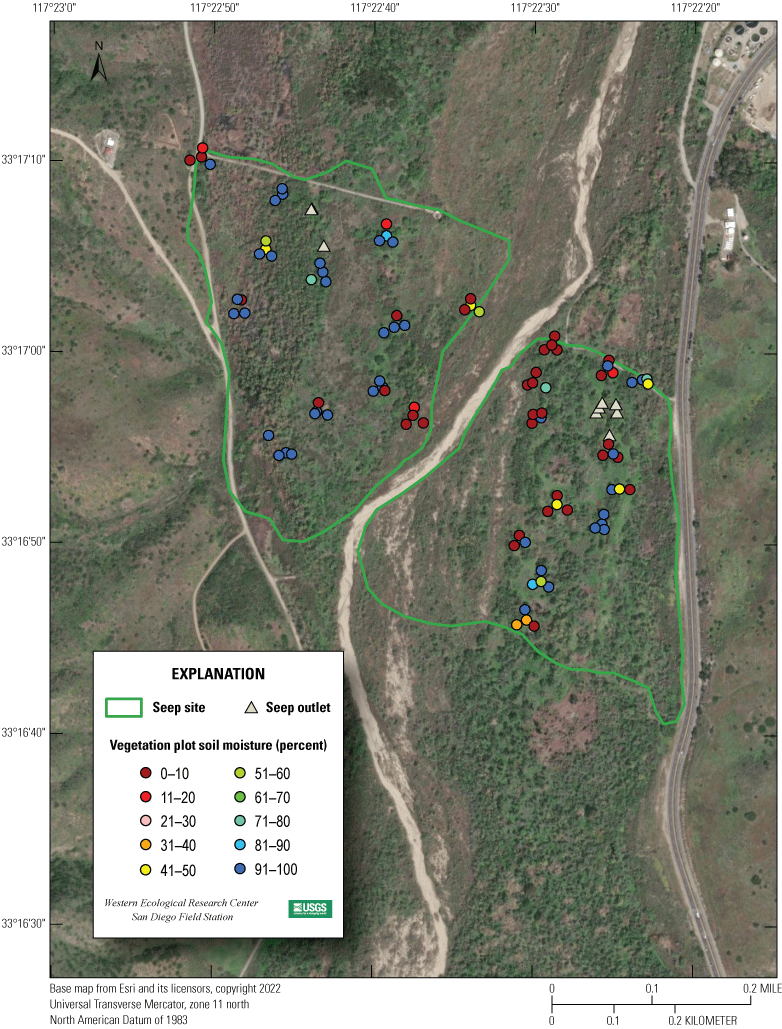
Percentage of soil moisture at Seep site vegetation sampling plots, Marine Corps Base Camp Pendleton, 2022. See figure 2 for overview map.
Percent soil moisture at Reference site vegetation sampling plots, Marine Corps Base Camp Pendleton, 2022. See figure 2 for overview map.
Vireo Survival, Site Fidelity, and Movements
Returning Banded Birds
We were able to observe 1,082 adult Least Bell’s Vireos (males: 694/707, 98 percent of all males; females: 388/541, 72 percent of all females) on Base well enough to determine banding status in 2022, although not all banded vireos were observed well enough to conclusively identify the individual. Of the 1,082 vireos, 62 had been banded before the 2022 breeding season and 19 other vireos could not be identified because they were banded with a single numbered silver metal federal band. Birds with a single silver band were either banded at local MAPS stations within the past 3 years or were nestlings banded at Marine Corps Air Station, Camp Pendleton (MCAS) in 2018–22 (Ferree and Clark, 2018, 2019, 2020, 2021; K. Ferree, San Diego Natural History Museum, written commun., 2022). We were not able to determine the year or location where these 19 birds were banded. In total, we were able to identify 43 vireos that had unique color band combinations on Base in 2022 (table 10; appendix 6). Of the 43 identified banded vireos, 39 vireos had been banded on Base, and 4 vireos were originally banded off Base (3 on the San Luis Rey River and 1 at MCAS; appendix 6, tables 10, 11; B. Kus, U.S. Geological Survey, unpub. data, 2015, 2018, 2019). Adult birds of known age ranged from 1 to 7 years old. Twenty-one percent of known-age adult banded birds were 1 year old in 2022.
Table 10.
Banding status of Least Bell’s Vireos detected on Marine Corps Base Camp Pendleton (MCBCP) and those that emigrated off Base in 2022.[Birds detected on MCBCP include immigrants; natal vireos were originally banded as nestlings with a single numbered federal band. Abbreviation: —, no data]
One vireo was originally banded at Marine Corps Air Station, Camp Pendleton, in 2015 and was first detected on MCBCP in 2016.
One vireo was originally banded on the San Luis Rey River in 2019 and was first detected on MCBCP in 2021.
Two vireos were originally banded on the San Luis Rey River in 2018 and 2019, and were first detected on MCBCP in 2022.
Found on the San Luis Rey River in 2022 (Houston and others, 2023).
Table 11.
Number of banded adult Least Bell’s Vireos by original year banded, age, original banding location, and sex at Marine Corps Base Camp Pendleton (MCBCP) in 2022.[Year originally banded unknown: Vireos banded with single numbered silver metal federal band so original year banded (and therefore age) and location was not known. Abbreviations: SLR, San Luis Rey River; MCAS, Marine Corps Air Station, Camp Pendleton; yr(s), year(s); ≥, greater than or equal to; —, no data]
All 14 natal vireos that were resighted on MCBCP in 2022 were captured and given a complete color combination (table 10). Two female vireos that were banded as nestlings on MCBCP before 2022 or at Marine Corps Air Station, Camp Pendleton before 2016 were detected off Base on the lower San Luis Rey River in 2022 (table 10). Neither of these females were recaptured to determine original banding year or location.
New Banded Birds
A total of 135 Least Bell's Vireos were captured and banded for the first time during 2022. These newly banded birds included 4 adult vireos that were caught for the first time and banded with a unique color combination and 131 juvenile birds that were banded as nestlings with a single gold numbered federal band.
Adult Survival
The most important variables for predicting adult survival were sex and year. The top model including sex and year had more support than any other model (weight=0.96), and no other models had AICc within 2 of the top model (table 12). Sex and year (in particular, the 2012‒13 time interval) significantly contributed to the model (table 13). Although the second-ranked model included precipitation, this model was not strongly supported (AICc weight=0.03), and therefore, precipitation did not appear to be a significant predictor of adult survival. In the top model, male annual survival (61±10 percent) was higher than female annual survival (47±10 percent), and adult vireo survival was higher from 2012 to 2013 than other years (tables 13, 14).
Table 12.
Logistic regression models for the effect of sex (male versus female), year, and bio-year precipitation on survival of adult Least Bell’s Vireos on Marine Corps Base Camp Pendleton, 2005–22.[Bio-year precipitation was calculated from July 1 to June 30 of the year preceding the survival year. The effect of sex and year on detection probability was included in all models. Detection probability for 2021‒22 was fixed equal to 1. Models are ranked from best to worst based on Akaike’s Information Criterion for small samples (AICc), the difference in AICc between this model and the top model (ΔAICc), and AICc weights. AICc is based on −2×loge likelihood and the number of parameters in the model. Abbreviations: +, plus; <, less than]
Table 13.
Parameter estimate (β), standard error (SE), odds ratios, and 95-percent confidence intervals (CI) of the odds ratios for the top model explaining annual survival of adult Least Bell’s Vireos on Marine Corps Base Camp Pendleton, 2005–22.[Reference represents female survival, 2005–06. All other effects values are the difference between that parameter and the reference. Abbreviation: +, plus]
Table 14.
Annual survival rates for male and female Least Bell’s Vireos on Marine Corps Base Camp Pendleton, 2005–22.[Estimates were calculated from the top model. Abbreviations: ±, plus or minus; SD, standard deviation]
Adult versus First-Year Vireo Survival
Of the six models we created to examine the effects of age, year, and precipitation on vireo survival, the model that included age and year ranked highest (table 15). The top model with age plus year had an AICc weight greater than 0.99, which is well above any other model in the model set. No other models had measurable weight. Age, survival from 2007 to 2008, and survival from 2012 to 2013 significantly contributed to the top model (table 16).
Table 15.
Logistic regression models for the effect of age (first-year versus adult), year, and bio-year precipitation on survival of Least Bell’s Vireos on Marine Corps Base Camp Pendleton, 2005–22.[Bio-year precipitation was calculated from July 1 to June 30 of the year preceding the survival year. The effect of year on detection probability was included in all models. Detection probability for 2021‒22 was fixed equal to 1. Models are ranked from best to worst based on Akaike’s Information Criterion for small samples (AICc), the difference in AICc between this model and the top model (ΔAICc), and AICc weights. AICc is based on −2×loge likelihood and the number of parameters in the model. Abbreviations: +, plus, >, greater than; <, less than]
Table 16.
Parameter estimates (β), standard errors (SE), odds ratios, and 95-percent confidence intervals (CI) of the odds ratios for the top model explaining annual survival of Least Bell’s Vireos on Marine Corps Base Camp Pendleton, 2005–22.[Reference represents first-year vireos, 2005–06. All other effects values are the difference between that parameter and the reference. Abbreviation: +, plus]
According to the top model, adults had higher survival rates than first-year birds during the entire time span (2005‒22) and average survival of all birds from 2007 to 2008 and from 2012 to 2013 was higher than other years (table 16). Annual survival of adult vireos averaged 62±12 percent (range: 39–78 percent) with highest survival from 2012 to 2013 and lowest survival from 2020 to 2021 (table 17). Annual survival of first-year vireos averaged 16±6 percent (range: 6–27 percent) with highest survival from 2012 to 2013 and lowest survival from 2020 to 2021.
Table 17.
Annual survival rates for adult and first-year Least Bell’s Vireos on Marine Corps Base Camp Pendleton, 2005–22.[Estimates were calculated from the top model. Abbreviations: ±, plus or minus; SD, standard deviation]
Vireo Survival and Return Rates at Seep and Reference Sites
Treatment (Seep versus Reference site) did not appear in the well supported models; therefore, if an adult vireo was originally banded in a Seep versus Reference site did not appear to affect their return rate to either Seep or Reference sites (table 18). At the Seep and Reference sites, the most important factors affecting return rate for adult vireos were sex and year, as previously represented in the Base-wide survival models (see the “Adult Survival” section). The top two models were well supported, with weights of 0.36 and 0.18, respectively, and no other models were within 2 AICc of the top model.
Table 18.
Logistic regression models for the effect of sex (male versus female), year, and treatment (Seep versus Reference site) on return rate of Least Bell’s Vireos on Marine Corps Base Camp Pendleton, 2020–22.[Models are ranked from best to worst based on Akaike’s Information Criterion for small samples (AICc), the difference in AICc between this model and the top model (ΔAICc), and AICc weights. AICc is based on −2×loge likelihood and the number of parameters in the model. Abbreviations: +, plus; *, interacting with]
In 2021, 134 banded nestlings fledged from Seep or Reference site nests. One of the 72 fledglings from Seep sites was redetected in 2022 (1 percent). Eight of 63 fledglings from Reference sites were redetected in 2022 (13 percent).
Base-Wide Site Fidelity and Movement
Resighting banded birds allowed us to identify individuals that either returned to the same territory they used in a previous year (within 100 m) or moved to a different location (appendix 7). There were 28 adult vireos (25 males and 3 females) identified at MCBCP in 2021 that were resighted in 2022, all of which occupied known territories both years. Most of the returning adult vireos showed strong between-year site fidelity. Of the 28 returning territorial adults, 25 (89 percent of territorial adults: 23 males, 92 percent of males; 2 females, 67 percent of females) occupied a breeding site in 2022 that they had defended in 2021. Two additional vireos (7 percent of all vireos: both males, 8 percent of males) returned to sites adjacent to their previous territories (within 300 m). The average distance moved by returning adult vireos was 0.1±0.2 km (range: 0.0–1.1 km; males: 0.1±0.1 km, range: 0.0–0.2 km; females: 0.4±0.6 km, range: 0.0–1.1 km).
All nine of the first-year vireos that were banded as nestlings in 2021 on MCBCP and resighted in 2022 occupied known territories (eight males and one female; appendix 7). The average distance that first-year vireos moved from their natal territories to their breeding territories was 1.6±1.8 km (range: 0.4–6.2 km; males moved 1.6±1.9 km, range: 0.4–6.2 km; the female moved 1.7 km). No first-year vireos that were banded as nestlings in 2021 on MCBCP were resighted off Base, and no first-year vireos from off Base were resighted on MCBCP in 2022.
Site Fidelity and Movement at Seep and Reference Sites
Adult fidelity to Seep and Reference sites was high. Of adult vireos detected in 2021 and 2022, eight vireos that held territories at the Seep site in 2021 returned to the Seep site in 2022 (100 percent). Five of the 7 vireos that held territories at Reference sites in 2021 returned to Reference sites in 2022 (71 percent). One first-year vireo that fledged from a Seep site in 2021 returned to an area outside of our monitoring sites in 2022. Eight first-year vireos that fledged from Reference sites in 2021 were redetected in 2022: three at Reference sites, one at a Seep site, and four outside of the monitoring sites.
Vireo Territory Density at Seep and Reference Sites
For the 5 years before seep pumps were installed at Seep sites, vireo territory density varied among Seep and Reference sites with density slightly higher at Reference sites in 2015 and slightly higher at Seep sites in 2016 and 2017 (fig. 10). Territory density remained slightly higher at Seep sites than at Reference sites through 2022. The differences in territory density between Seep sites and Reference sites were not significant for the 3 years before seep pumps were installed and for the 2 years after seep pumps were installed at both Seep sites (2017–19: t=2.26, P=0.15; 2021–22: t=3.92, P=0.16).
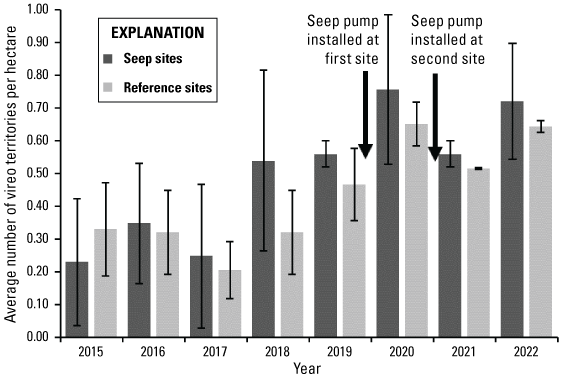
Least Bell’s Vireo territory density (average number of territories per hectare) at Seep and Reference sites before and after seep pumps were installed at Seep sites, 2015–22. Vertical lines represent 1 standard deviation.
Nest Success and Breeding Productivity
Nesting activity was monitored at 25 territories in Seep sites and 25 territories in Reference sites (table 19; figs. 11–14; appendix 8). All 50 territories were considered fully monitored, meaning that all nests within the territory were found and documented during the breeding season. One territory at a Reference site was occupied by a single male and another territory at a Reference site was occupied by a pair that disappeared within 2 weeks. These territories were not included in productivity analyses. The remaining 48 pairs built 97 nests; seven of these were not completed (“INC” in appendix 8) and have been excluded from calculations of nest success and productivity.
Table 19.
Number of Least Bell’s Vireo territories and nests monitored at Seep and Reference sites on Marine Corps Base Camp Pendleton, 2022.[±, plus or minus]
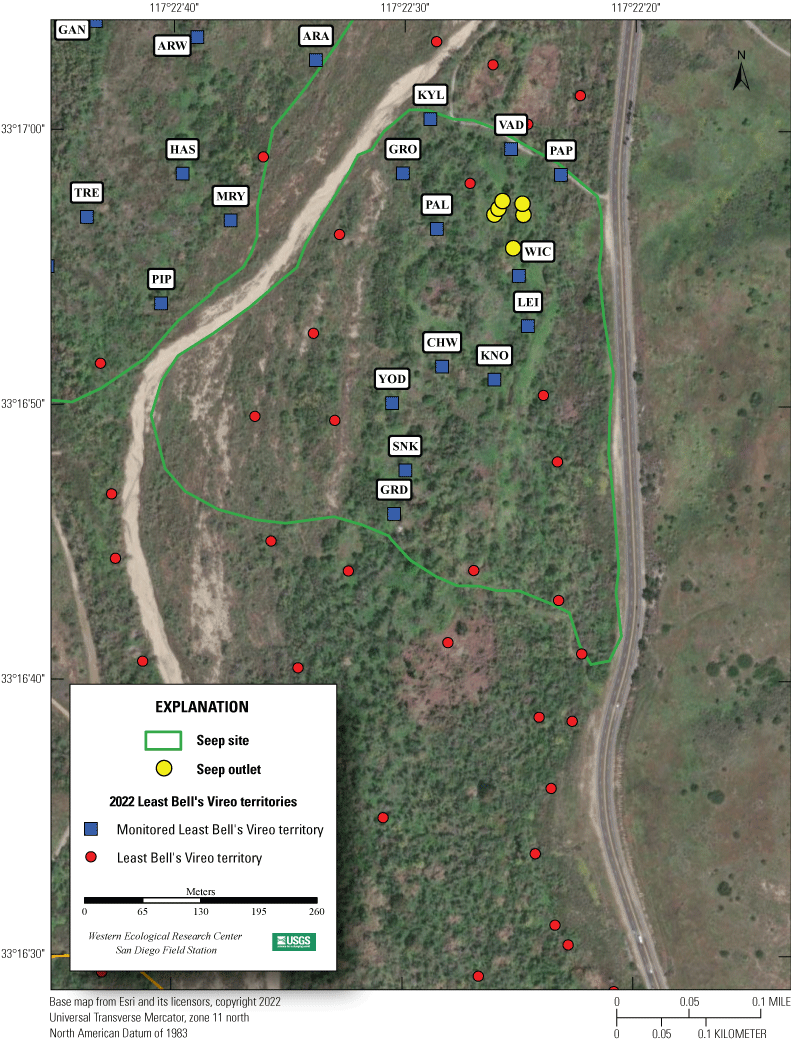
Locations of monitored Least Bell’s Vireo territories at the Old Treatment Pond Seep site, Marine Corps Base Camp Pendleton, 2022.
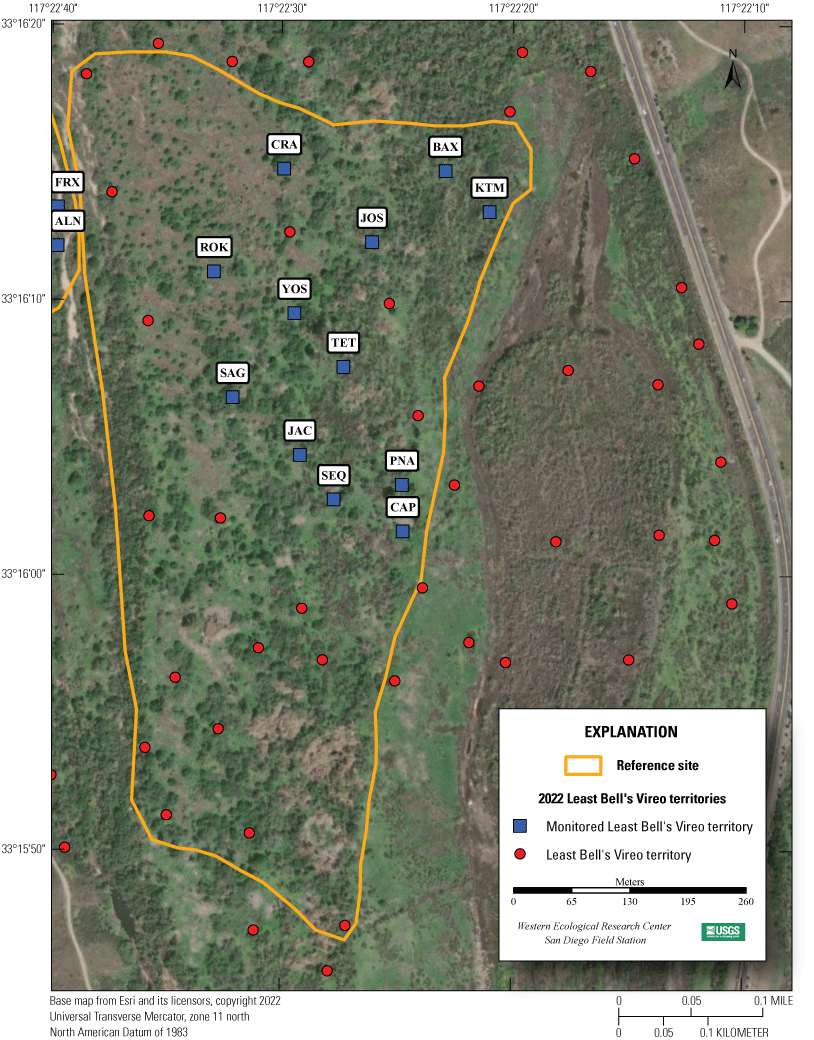
Locations of monitored Least Bell’s Vireo territories at the Old Treatment Pond Reference site, Marine Corps Base Camp Pendleton, 2022.
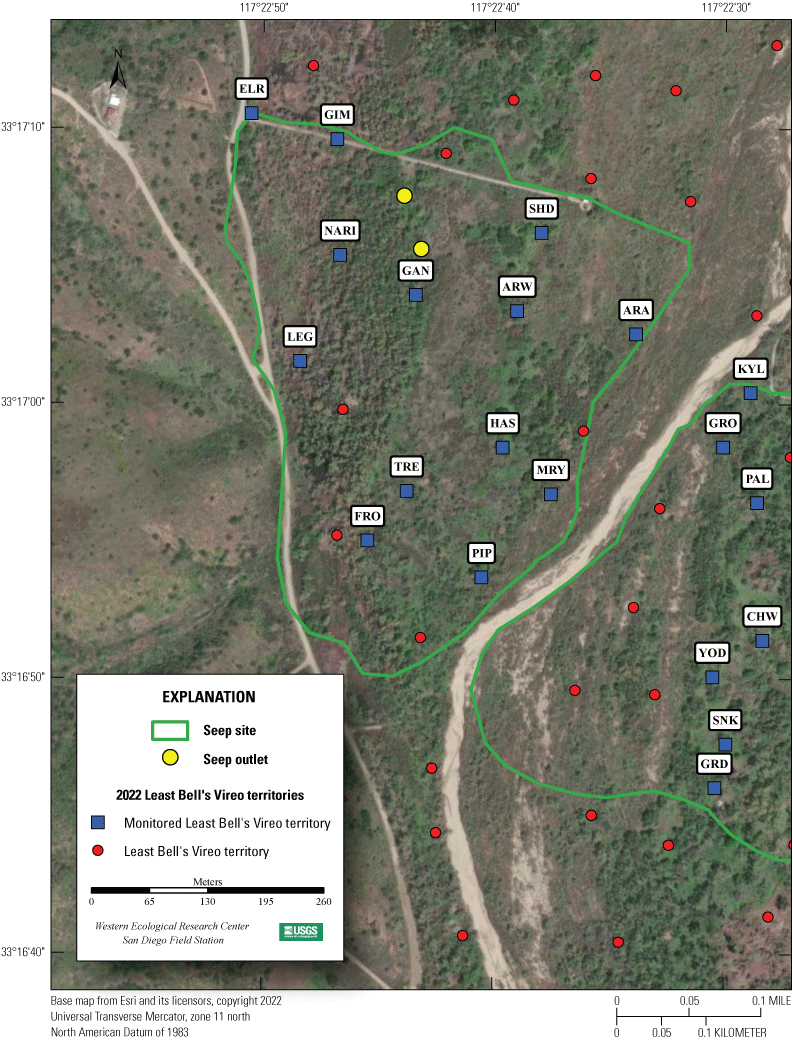
Locations of monitored Least Bell’s Vireo territories at the Pump Road Seep site, Marine Corps Base Camp Pendleton, 2022.
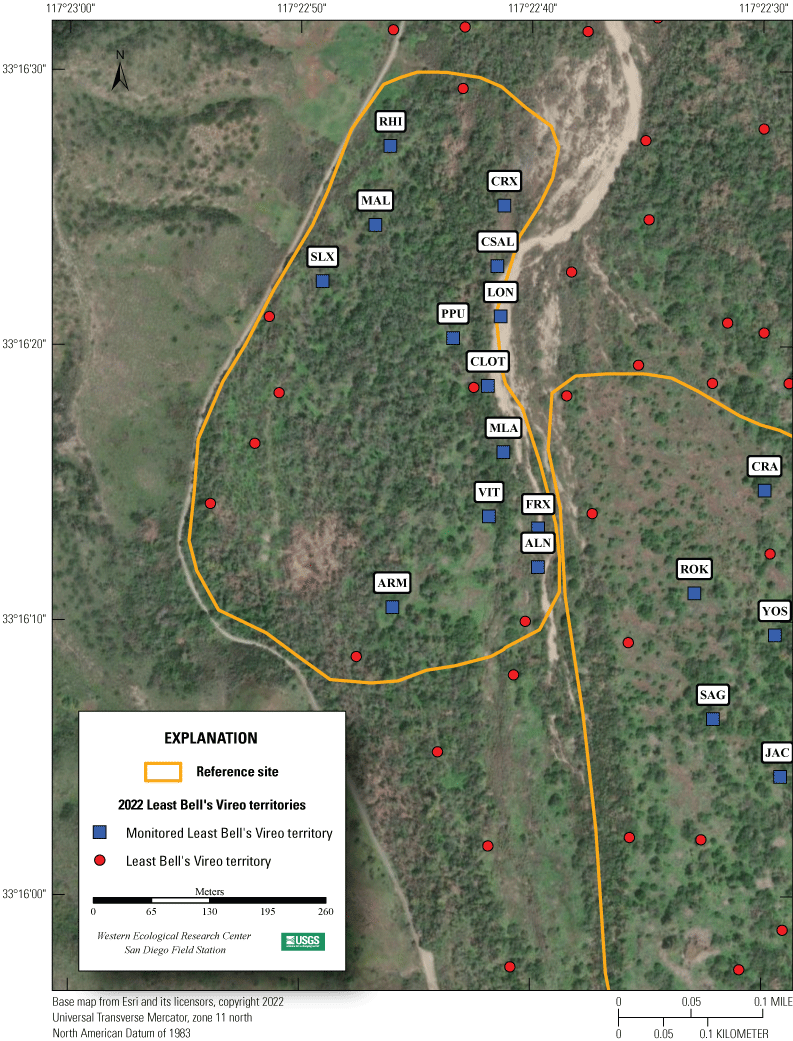
Locations of monitored Least Bell’s Vireo territories at the Pump Road Reference site, Marine Corps Base Camp Pendleton, 2022.
Nesting Attempts
Pairs at Seep and Reference sites built a similar number of nests (including incomplete nests) during the 2022 breeding season (t=−0.6, P=0.57; table 19). Pairs at Seep sites (19/25; 76 percent) and Reference sites (18/23; 78 percent) were equally as likely to renest after an initial nesting attempt (Fisher’s exact test P>0.99). The number of renests after a failed first nesting attempt did not differ between Seep pairs (13/16; 81 percent) and Reference pairs (9/10; 90 percent; Fisher’s exact test P>0.99). Similarly, pairs at Seep sites (6/9; 67 percent) and Reference sites (9/13; 69 percent) were equally likely to renest after a successful first nesting attempt (Fisher’s exact test P>0.99). Pairs at Reference sites and Seep sites were as likely to renest after a failed first nesting attempt as after a successful first nesting attempt in 2022 (Fisher’s exact test P=0.34 and P=0.63, respectively). When both monitoring site types were combined, pairs were equally likely to renest after a failed nesting attempt as they were to renest after a successful nesting attempt in 2022 (Fisher’s exact test P=0.30). Overall, 85 percent (22/26) of vireo pairs attempted to renest after a failed first nesting attempt, and 68 percent (15/22) of pairs attempted to renest after a successful first nesting attempt in 2022. Five pairs at Seep sites and three pairs at Reference sites attempted to nest three times, and two pairs at Reference sites attempted to nest four times in 2022.
Nest Success
Completed nests in the Seep and Reference sites had similar fledging success (chi-square=1.17, P=0.28), because 56 percent (25/45) of nests in Seep sites successfully fledged young, and 67 percent (30/45) of those in Reference sites successfully fledged young (table 20). Fewer first nesting attempts at Seep sites were successful (39 percent) than first nesting attempts at Reference sites (62 percent), a difference that was not quite statistically significant (chi-square=2.28, P=0.13; appendix 8). Overall, 61 percent of all nesting attempts were successful, and 50 percent of first nesting attempts were successful in 2022.
Table 20.
Fate of completed Least Bell’s Vireo nests in fully monitored territories at Seep and Reference sites, Marine Corps Base Camp Pendleton, 2022.[Numbers in parentheses are proportions of total nests]
Causes of failure were similar at Seep and Reference sites. Most nest failures at Seep and Reference sites were caused by predation (table 20), although confirmed predation events were not witnessed. Predation accounted for 80 percent (16/20) of nest failures at the Seep sites and 73 percent (11/15) of nest failures at Reference sites. We documented four nests at Seep sites and four nests at Reference sites that failed for other reasons, known and unknown (appendix 8). Three nests were abandoned with no eggs ever confirmed, two nests contained eggs that never developed and were likely infertile, two nests were abandoned with nestlings, and one nest was abandoned with eggs. Overall, 44 percent and 33 percent of completed vireo nests at Seep and Reference sites were lost to predation or other causes, respectively.
Cowbird Parasitism
None of the monitored Least Bell’s Vireo nests were parasitized by Brown-headed Cowbirds in 2022. One male vireo was observed feeding a cowbird fledgling outside of the monitoring sites.
Productivity
Clutch size did not differ between Seep and Reference sites (table 21). Seep and Reference sites also had similar percentages of eggs that hatched and nests with hatchlings. The percentage of hatchlings that fledged, the percentage of nests with hatchlings that ultimately fledged young, and the proportion of eggs that produced fledglings did not differ between Seep and Reference sites. Seep and Reference pairs fledged similar numbers of young; however, more pairs at Reference sites fledged young than pairs at Seep sites. Four pairs at Seep sites (16 percent) and 8 pairs at Reference sites (35 percent) each successfully fledged 2 broods in 2022, and 1 pair at a Seep site successfully fledged 3 broods (appendix 8). Vireo pairs at Seep and Reference sites combined fledged 3 vireo young per pair, and 85 percent of monitored pairs were successful in fledging at least 1 young in 2022.
Table 21.
Reproductive success and productivity of nesting Least Bell’s Vireos at Seep and Reference sites, Marine Corps Base Camp Pendleton, 2022.[P, significance of statistical test, —, no data; ±, plus or minus, %, percent]
Vireo productivity did not appear to be linked with precipitation in 2022. We did not find a significant relationship between precipitation and the number of fledglings produced per pair (Pearson’s r=0.12, P=0.63), the number of fledglings produced per egg (Pearson’s r=−0.06, P=0.87), or the proportion of nests that were successful (Pearson’s r=0.22, P=0.41).
Daily Nest Survival
Using treatment (Seep versus Reference site) and year as covariates, we built five models with potential to predict the probability that a nest would survive from 1 day to the next (table 22). The constant model was generated first and remained the best supported model. Adding treatment, year, and the interaction of treatment and year did not improve upon the constant model. The second-ranked model, which included treatment, was within 2 AICc of the top model and therefore may be supported; however, the treatment variable did not significantly contribute to the model (table 23).
Table 22.
Logistic regression models for the effect of year and treatment (if a nest was in a Seep or Reference site) on Least Bell’s Vireo nest survival on Marine Corps Base Camp Pendleton, 2022.[Models are ranked from best to worst based on Akaike’s Information Criterion for small samples (AICc), the difference in AICc between this model and the top model (ΔAICc), and AICc weights. AICc is based on −2×loge likelihood and the number of parameters in the model. Abbreviations: *, interacting with; +, plus]
Table 23.
Parameter estimates (β), standard errors (SE), odds ratios, and 95-percent confidence intervals (CI) of the odds ratios for models explaining daily survival rate of Least Bell’s Vireo nests at Seep and Reference sites across years on Marine Corps Base Camp Pendleton, 2022.[Models are in order of best-supported to least-supported. In models with variables, bold indicates that the 95-percent confidence interval does not include 1, which we consider significant results]
Nest Characteristics
Least Bell’s Vireos used 12 plant species for nesting at Seep and Reference sites in 2022, although not all plant species were used within each treatment (table 24). Vireos used 11 species at the Seep site and 9 species at Reference sites. Vireos placed 59 percent of all nests in arroyo or red willow, sandbar willow, or black willow (47 percent at the Seep site and 71 percent at Reference sites). At Seep sites, 46 vireo nests (94 percent) were placed in woody vegetation, and 3 nests (6 percent) were placed in herbaceous vegetation. At Reference sites, 46 vireo nests (96 percent) were placed in woody vegetation, and 2 nests (4 percent) were placed in herbaceous vegetation. Three of the five vireo nests that were placed in herbaceous vegetation were built in non-native plant species (poison hemlock).
Table 24.
Host plant species used by Least Bell’s Vireos at Seep and Reference sites, Marine Corps Base Camp Pendleton, 2022.[Numbers in parentheses are proportions of total nests within treatment types. Abbreviation: —, no data]
In 2022, we did not find differences in nest-site characteristics between successful and failed nests at Seep sites or at Reference sites (table 25). Nest host plants at Seep sites were almost significantly taller than host plants at Reference sites, but we did not find differences in any other nest site characteristics between Seep and Reference sites (table 26).
Table 25.
Least Bell’s Vireo nest characteristics and results of Student’s t-tests of successful versus unsuccessful nesting attempts at Seep and Reference sites, Marine Corps Base Camp Pendleton, 2022.[n, number of nests in sample (successful, unsuccessful); t, Student’s t statistic; P, probability that the difference was not significant; m, meter]
Table 26.
Least Bell’s Vireo nest characteristics and results of Student’s t-tests of all nesting attempts at Seep and Reference sites, Marine Corps Base Camp Pendleton, 2022.[n, number of nests in sample (Seep, Reference); t, Student’s t statistic; P, probability that the difference was not significant; m, meter]
Discussion
Least Bell’s Vireo numbers have fluctuated throughout the past several years, manifested relatively consistently across several study areas in San Diego County, including MCBCP, the San Luis Rey River, the San Diego River, MCAS, and the Sweetwater Reservoir. The range-wide vireo population gradually increased through the 1980s and 1990s, reaching a peak in 2009–10 before declining to between 50 and 60 percent of this peak by 2017, then increasing in 2018, and again in 2020 to a new peak (B. Jones, Sweetwater Environmental Biologists, Inc., unpub. data, 1985; Kus, 1989a, b, 1991a, b, 1993, 1995; Kus and Beck, 1998; B. Kus, U.S. Geological Survey, unpub. data, 2007–22; Allen and others, 2017, 2018; Ferree and Clark, 2018, 2019, 2020, 2021; Allen and Kus, 2019, 2020, 2021, 2022; Houston and others, 2021, 2022).
Between 2016 and 2018, the population trends at different study areas within the vireo’s range diverged, with vireos increasing on MCBCP from 2015 to 2016 but decreasing on MCAS (B. Kus, U.S. Geological Survey, unpub. data, 2016) and on the lower San Luis Rey River (Houston and others, 2022) while remaining stable on the middle San Luis Rey River (Allen and others, 2017). In 2017, there also was a discrepancy between sites, although in the opposite direction. By 2018, trends in vireo populations on MCBCP, the lower San Luis Rey River, the middle San Luis Rey (in areas not burned during a December 2017 fire), and at MCAS reconverged with a slight drop in 2019 and then an increase in 2020. From 2020 to 2021, vireo populations in these sites decreased again by 18 percent (MCBCP), 24 percent (lower San Luis Rey River; Houston and others, 2022), 6 percent (middle San Luis Rey River; Allen and Kus, 2022), and 44 percent (MCAS, although this decrease followed removal of about half of the vireo habitat in the MCAS study area between 2020 and 2021; Ferree and Clark, 2021). From 2021 to 2022, the regional vireo population rebounded slightly, increasing by 4 percent on MCBCP and 9 percent on the lower San Luis Rey River, although there was a 10-percent decrease at MCAS (K. Ferree, San Diego Natural History Museum, written commun., 2022; Houston and others, 2023).
There was a general decrease in vireo numbers region-wide from 2010 to 2017 that can largely be attributed to drought conditions on the breeding grounds before and during that timeframe. Average bio-year precipitation from 1990 to 1999 at Lake O’Neill was 43 centimeters (cm), the highest 10-year average since measurement began in 1887 (Office of Water Resources, 2022). From 2000 to 2009, the average precipitation dropped to 34 cm, and from 2010 to 2019 average precipitation dropped again to 33 cm. Several years of low precipitation likely compromised primary productivity, resulting in decreased annual plant and foliage growth. Consequently, foraging substrate and nesting cover for vireos likely decreased in extent and quality, affecting arthropod abundance and ultimately higher trophic level wildlife (vireos) that depend on these resources. Although precipitation during 3 of the 6 bio-years since 2016 was 30–75 percent greater than the 2000–09 average, likely positively affecting breeding productivity in 2017, 2019, and 2020 and driving an increase in the vireo population in 2018 and 2020, breeding productivity in other years did not closely track annual fluctuations in precipitation.
The link between bio-year precipitation, vireo productivity and survival, and trends in vireo numbers seems to have faltered between 2020 and 2021. We expected that high breeding productivity in 2020 resulting from higher-than-average precipitation that year would lead to an increase in the number of vireo territories region-wide in 2021; however, this did not occur. Instead, the vireo population on Base dropped from 2020 to 2021, although the decrease was less than expected given the low adult and first-year survival (38 percent and 7 percent, respectively), both of which were well below the average survival rate since 2005. Precipitation preceding the 2021 breeding season was just 48 percent of the 2000–09 average, yet vireo productivity in 2021 was at its highest since 2013, exceeding peaks in 2017, 2019, and 2020. Adult survival from 2021 to 2022 was also higher than 2020–21, leading to a slight increase in the vireo population on Base in 2022. Although adult and first-year vireo survival varied by year, we did not find that bio-year precipitation on the breeding grounds affected survival. Other factors that may have affected survival inconsistently across years include habitat degradation and rehabilitation, wildfire, flooding, or other habitat disturbance on breeding, migratory stop-over, and wintering grounds, weather events such as excessive rainfall or temperature extremes, disease, parasites, or myriad other factors outside of our knowledge.
This disconnect between precipitation on the breeding grounds, vireo productivity, survival, and population trends from 2020 to 2021 indicates that additional factors were replacing or confounding the effect of precipitation on vireo demographics. One potential confounding factor was the effect of parasitism by Brown-headed Cowbirds outside of our monitoring plots and in nearby riparian areas. Cowbird traps on MCBCP were opened later than recommended in 2020 and 2022 (B. Leatherman, Leatherman BioConsulting, Inc., written commun., 2022) and on the lower San Luis Rey River near the southern border of MCBCP in 2021 (Houston and others, 2022). Although no cowbird parasitism was documented during these years at our nest monitoring plots on MCBCP, in 2022, a male vireo was observed feeding a cowbird fledgling during a survey outside of the nest monitoring plots. In 2022, cowbirds were detected during the highest proportion of surveys since 2005 on MCBCP. Cowbird parasitism on the lower San Luis Rey River jumped from 0 to 2 nests between 2015 and 2019 to 7 nests (5 percent of completed nests) in 2020, and then increased to 35 nests (24 percent of completed nests) in 2021, remaining high in 2022 (Houston and others, 2021, 2022, 2023; B. Kus, U.S. Geological Survey, unpub. data, 2015–19). Almost half of parasitized nests on the San Luis Rey River successfully fledged vireo young after cowbird eggs were removed and the remaining nests failed to produce any young, contributing to a decrease in breeding productivity at this site. Approximately 30–40 percent of vireo territories along the lower San Luis Rey River were not monitored in 2020 and 2021. Nests at unmonitored vireo territories on the San Luis Rey and in nearby drainages on and off Base were also susceptible to cowbird parasitism and did not have the benefit of nest monitors to “rescue” them. Consequently, it is likely that substantial cowbird parasitism occurred in vireo nests, as well as other species’ nests, that contributed to an increase in the cowbird population and the threat of more cowbird parasitism in future years.
Low adult vireo survival from 2020 to 2021 may have resulted from factors affecting vireos on the wintering grounds at migratory stop-over locations. High breeding productivity in 2021 may have been affected by a variety of factors, including but not limited to, the amount and timing of precipitation, fluctuating prey arthropod abundance at critical times, predator abundance, and the amount and quality of foliage cover protecting nests against depredation and other disturbance. Although there are likely many other factors affecting breeding productivity on Base, the interplay of these factors and their relative effects are unclear at this time and can only be determined with continued monitoring and sampling of these sites.
Similar to 2021, precipitation in the 2021–22 bio-year was lower than average, and much of the natural surface water at monitoring sites dried up early in the breeding season. The seep pumps were intended to provide supplemental surface water to compensate for dry conditions, such as those during the 2021 and 2022 breeding seasons, and therefore, we expected that soil moisture at the Seep sites would be higher than at the Reference sites, which have not received surface water augmentation. In 2021, we did not find a difference in soil moisture between Seep and Reference sites; however, in 2022, we documented significantly higher soil moisture levels at Seep sites. This change from 2021 to 2022 was likely a result of the additive effect of multiple consecutive dry years. In wet years or single, isolated dry years, the seep pumps may not produce enough to substantially change the naturally occurring surface and sub-surface water. However, consistent supplementation of surface water at the Seep sites after two dry winters seems to have maintained moist conditions at these sites that were not maintained at the Reference sites, thereby manifesting as higher soil moisture at Seep sites in 2022 and a gradient of decreasing moisture with increasing distance from the seep pump outlets. If climate conditions continue to trend toward warmer and drier, the seep pumps likely will continue to maintain the desired conditions at these sites.
We expected higher soil moisture at Seep sites to translate into higher foliage cover at Seep sites than at Reference sites, and there was evidence to support this expectation, particularly cover in the lower canopy. Seep sites had greater total foliage cover than Reference sites below 2 m. Also, there was higher cover of woody vegetation, native herbaceous vegetation, and total herbaceous vegetation at lower height categories at Seep sites. Considering that we also documented a positive relationship between soil moisture and total cover below 2 m, the significantly wetter conditions at Seep sites likely lead to more low-canopy foliage cover than at Reference sites. Woody species were the primary contributor to total foliage below 2 m. For Seep and Reference sites, 4 of the top 5 species with the highest cover below 2 m were woody species.
Soil moisture was also positively correlated with total cover between 4 and 6 m. This finding corresponds with aspects of Willow Flycatcher habitat models developed on MCBCP from vegetation data collected in 2001 and 2002 (Howell and others, 2018). These habitat models predict that flycatchers would occupy areas with high total vegetation cover between 3 and 6 m and high poison hemlock and black willow cover below 3 m. Stinging nettle below 3 m and black willow above 6 m were also considered important, although less compelling, components of the habitat models (Howell and others, 2018). Poison hemlock and stinging nettle are structurally similar and likely provide similar ecological roles for flycatchers; therefore, it is likely that the higher importance of poison hemlock in flycatcher habitat models was a result of the predominance of hemlock among herbaceous vegetation in the area. A more in-depth comparison of vegetation structure and composition associated with seep pumps and the Willow Flycatcher habitat model warrants further analysis and will be presented in the 5-year synthesis report.
Average canopy height was lower at Seep sites than at Reference sites in 2021 and 2022 but not in 2020. Conversely, average canopy height was significantly related to soil moisture in 2021 but not in 2020 or 2022. These inconsistencies can be attributed to annual differences in vegetation plot locations and the legacy effect of vegetation and soil moisture conditions at the study sites before the installation of seep pumps. Vegetation sampling plots were centered on vireo nests each year rather than distributed evenly throughout the monitoring plots, and locations changed each year depending on where vireos placed their nests; therefore, some sampling variability is expected. We anticipate clarification with a more robust dataset provided by continued sampling throughout more years.
Aside from greater foliage cover at lower height categories at Seep sites, there were only a few differences between Seep and Reference sites in 2022. Survival of adults and first-year vireos and adult site fidelity were similar between Seep and Reference sites. Pairs at Seep and Reference sites had similar numbers of nests, hatching success, and fledging success, and fledged similar numbers of young per pair. However, more pairs at Reference sites fledged young than pairs at Seep sites. We did not find any differences between Seep and Reference sites in nest placement characteristics.
Wildfires continue to affect vireo habitat almost annually (Lynn and others, 2014, 2015, 2016, 2017, 2018, 2020). The wildfire that burned in the Sierra training area in July 2021 only affected approximately 22 ha of vireo habitat, mostly skirting the riparian vegetation, and did not appear to adversely affect vireos in those areas likely because the vireo territories were close to the edge of the fire. There was no difference in the number of vireo territory locations within the fire perimeter in 2021 (before the fire) versus 2022 (after the fire). Vireo territory points mark the average center of activity for each vireo territory and may fall within the fire perimeter even though the territory included burned and unburned habitat. Similarly, vireo territories with center points adjacent to the fire perimeter may include some burned habitat. In 2022, surveyors observed vireos using live woody plants that had not burned and non-native herbaceous plants that grew within the burned areas (primarily mustard; A. Bernabe, U.S. Geological Survey, written commun., 2022).
In 2022, we continued to find vireos that originated outside of MCBCP moving onto Base and holding territories. Two adult vireos were detected on MCBCP in 2022 for the first time after they were banded as nestlings on the San Luis Rey River in 2018 and 2019. Conversely, two vireos that hatched on MCBCP or at MCAS were detected off Base, although we don’t know what year they hatched. On the other hand, for the first time since 2011, we did not find any first-year birds that had immigrated to MCBCP from the San Luis Rey River in 2022. Lower productivity in surrounding vireo populations, regardless of the cause, is likely to affect the entire regional population because of the interconnected nature of local populations. Incidental observations of vireos in areas that typically have not been thoroughly surveyed help to enhance our understanding of movements of adult and dispersing first-year vireos. Banding and resighting of vireos within southern California and Baja California Sur continues to increase our understanding of the extent of movement between populations and during migration and the role such movements play in maintaining genetic diversity and persistence in these populations. Continued monitoring of cohorts banded as nestlings provides the opportunity to collect lifetime reproductive data for a segment of the population, facilitating identification of age- and possibly sex-related patterns in life history characteristics that affect population size, productivity, and genetic structure.
Conclusions
Until 2011, the vireo population on Marine Corps Base Camp Pendleton (MCBCP) tracked the overall increase in Least Bell’s Vireos in southern California since the late 1970s (U.S. Fish and Wildlife Service, 2006). Since its peak in 2010, the vireo population on MCBCP reached a 21-year low in 2015 and then rebounded in 2018 to the fifth highest count recorded. Extrapolating the number of vireos counted in core areas on MCBCP in 2020 to the entire Base, the Base-wide vireo population in 2020 was likely the highest on record. In 2021, the vireo population on base dropped again, although it rebounded again in 2022 to become the fourth highest population since 2005.
The increasing trend in the vireo population in the 1980s and 1990s can largely be attributed to management actions, including control of Brown-headed Cowbirds and protection and restoration of riparian habitat (Kus and Whitfield, 2005). On MCBCP, Brown-headed Cowbird control has reduced cowbird parasitism to a negligible level since the mid-1990s, releasing a major limit on vireo breeding productivity. Although two nests were parasitized by cowbirds in 2018, and a male vireo was observed feeding a cowbird fledging in 2022, no cowbird parasitism was recorded on MCBCP from 2019 to 2021. In 2021, cowbird parasitism on the lower San Luis Rey River increased 400 percent from the parasitism rate in 2020 (Houston and others, 2022), most likely because cowbird traps were not opened until April 28, 4 weeks after the traps were typically opened in the past (J. Sexton, T.W. Biological Services, written commun., 2021). In 2020 and 2022, cowbird traps were not opened on Base until late April (B. Leatherman, Leatherman BioConsulting, Inc., written commun., 2022). Only one cowbird parasitism event was detected on Base in 2022, indicating that long-term, annual cowbird control has had a lasting effect even in occasional years when applied imperfectly. However, the proximity of the increasing cowbird threat on the San Luis Rey River should not be dismissed at MCBCP. Cowbird control has a demonstrably positive effect on vireo productivity (Kus, 1999; Kus and Whitfield, 2005) but must be consistently practiced to maintain the desired reduction in parasitism.
The recent fluctuations in the vireo population may be a consequence of a variety of interacting factors, including wildfire (affecting apparent population size, distribution, and habitat-related nesting productivity and predation), drought (affecting breeding productivity and survival), high floodwaters, anthropogenic changes in surface water, and the inherent carrying capacity of habitat during different life stages (breeding, migratory, or wintering). These factors are difficult to parse and are subject to change because of natural (for example, weather) and anthropogenic (for example, habitat alteration or restoration) processes, which makes future population trends difficult to predict.
The artificial seep pumps at the Old Treatment Ponds and at Pump Road had a noticeable effect on soil moisture in 2022, although soil moisture was also high at Reference sites. Breeding productivity (the number of fledglings produced per pair) has been higher than average during the past 4 years, beginning in 2019 after 2 years of above average precipitation and seep pump installation. Although the most recent 2 years of precipitation were below average, vireo breeding productivity remained high at Seep and Reference sites. This relationship between soil moisture and breeding productivity is tentative and will be tested in future years of low precipitation.
Although we did not document catastrophic wildfires on Base in 2022, a fire in 2021 affected some vireo habitat along the Santa Margarita River. This fire did not appear to have a significant effect on vireo territories within the perimeter because the vireo territories were close to the edge of the fire and included sufficient live woody vegetation and primary herbaceous growth in the burn footprint for vireo persistence. However, it is worth continued vigilance surrounding military and civilian activities on Base to avoid causing wildfires that may affect larger sections of vireo habitat during the frequent high wildfire risk conditions in southern California. The wildfires that have burned on MCBCP were sparked by a combination of circumstances, including the ongoing drought, strong east winds that carried dry, hot air from the deserts, human activity, and electrical infrastructure failure because of strong winds. Other smaller fires on Base also have been ignited by military training involving the use of materials that can ignite fires (gunfire, vehicles with hot engines parked on dry grass). Although most of these circumstances were beyond immediate human control, catastrophic events like wildfires highlight the delicate tipping point that can easily be upset by normally innocuous human actions. These effects can adversely affect vireo populations in the short-term and potentially long-term, causing direct mortality during the breeding season, destroying habitat during any time of the year, and possibly causing long-term changes in vegetation structure and composition and consequently a reduction in high quality breeding habitat for vireos.
Direct human impacts on vireo habitat were not documented in 2022, although continued attention to other potential activities (weed control, off-road vehicle traffic) would provide documentation to assist in developing management actions to preserve and enhance vireo habitat. Closing high-speed roads in vireo habitat during vireo breeding season, and prohibiting the use of firearms during dry, windy weather could minimize the chances of human-caused wildfires that damage and destroy vireo breeding habitat. Communication among personnel may reduce human-related impacts to vireos and occupied vireo habitat by allowing all participants to understand needs and flexibilities and adjust their activities accordingly. For instance, negative effects to vireos and vireo habitat can be minimized when military training exercises and maintenance activities, such as clearing vegetation, are limited to outside the vireo breeding season or to areas not occupied by vireos. Improved understanding of factors influencing vireos and vireo habitat will provide managers with improved scientific knowledge necessary to maintain a balance between the sometimes-competing land uses on Base, including military activities, recreation, habitat protection, and endangered species management.
References Cited
Allen, L.D., Howell, S.L., and Kus, B.E., 2017, Distribution and abundance of Least Bell’s Vireos (Vireo bellii pusillus) and Southwestern Willow Flycatchers (Empidonax traillii extimus) on the Middle San Luis Rey River, San Diego, southern California—2016 data summary: U.S. Geological Survey Data Series 1065, 11 p. [Available at https://doi.org/10.3133/ds1065.]
Allen, L.D., Howell, S.L., and Kus, B.E., 2018, Distribution and abundance of Least Bell’s Vireos (Vireo bellii pusillus) and Southwestern Willow Flycatchers (Empidonax traillii extimus) on the Middle San Luis Rey River, San Diego, southern California—2017 data summary: U.S. Geological Survey Data Series 1082, 12 p. [Available at https://doi.org/10.3133/ds1082.]
Allen, L.D., and Kus, B.E., 2019, Distribution and abundance of Least Bell’s Vireos (Vireo bellii pusillus) and Southwestern Willow Flycatchers (Empidonax traillii extimus) on the Middle San Luis Rey River, San Diego, southern California—2018 data summary: U.S. Geological Survey Data Series 1109, 12 p. [Available at https://doi.org/10.3133/ds1109.]
Allen, L.D., and Kus, B.E., 2020, Distribution and abundance of Least Bell’s Vireos (Vireo bellii pusillus) and Southwestern Willow Flycatchers (Empidonax traillii extimus) on the Middle San Luis Rey River, San Diego, southern California—2019 data summary: U.S. Geological Survey Data Series 1122, 11 p. [Available at https://doi.org/10.3133/ds1122.]
Allen, L.D., and Kus, B.E., 2021, Distribution and abundance of Least Bell’s Vireos (Vireo bellii pusillus) and Southwestern Willow Flycatchers (Empidonax traillii extimus) on the Middle San Luis Rey River, San Diego, southern California—2020 data summary: U.S. Geological Survey Data Series 1134, 11 p. [Available at https://doi.org/10.3133/ds1134.]
Allen, L.D., and Kus, B.E., 2022, Distribution and abundance of Least Bell’s Vireos (Vireo bellii pusillus) and Southwestern Willow Flycatchers (Empidonax traillii extimus) on the Middle San Luis Rey River, San Diego, southern California—2021 data summary: U.S. Geological Survey Data Report 1147, 12 p. [Available at https://doi.org/10.3133/dr1147.]
Burnham, K.P., and Anderson, D.R., eds., 2002, Model selection and multimodel inference—A practical information-theoretic approach (2d ed.): New York, N.Y., Springer-Verlag, 488 p. [Available at https://doi.org/10.1007/b97636.]
Cooch, E.G., and White, G.C., eds., 2022, Program MARK—A gentle introduction (22d ed.): accessed February 9, 2023, at http://www.phidot.org/software/mark/docs/book/.
Dinsmore, S.J., White, G.C., and Knopf, F.L., 2002, Advanced techniques for modeling avian nest survival: Ecology, v. 83, no. 12, p. 3476–3488, accessed August 31, 2023, at https://doi.org/10.1890/0012-9658(2002)083[3476:ATFMAN]2.0.CO;2.
Environmental Systems Research Institute, 2022, Field maps release 22.3.1: Redlands, Calif., Environmental Systems Research Institute, accessed November 14, 2023, at https://community.esri.com/t5/arcgis-field-maps-blog/arcgis-field-maps-22-3-1-is-now-available/ba-p/1205947.
Franzreb, K.E., 1989, Ecology and conservation of the endangered Least Bell’s Vireo: U.S. Fish and Wildlife Service, Department of the Interior Biological Report, v. 89, no. 1, 17 p. [Available at https://apps.dtic.mil/sti/tr/pdf/ADA322886.pdf.]
Houston, A., Allen, L.D., Pottinger, R.E., and Kus, B.E., 2021, Least Bell’s Vireos and Southwestern Willow Flycatchers at the San Luis Rey flood risk management project area in San Diego County, California—Breeding activities and habitat use—2020 annual report: U.S. Geological Survey Open-File Report 2021–1053, 67 p. [Available at https://doi.org/10.3133/ofr20211053.]
Houston, A., Allen, L.D., Pottinger, R.E., and Kus, B.E., 2022, Least Bell’s Vireos and Southwestern Willow Flycatchers at the San Luis Rey flood risk management project area in San Diego County, California—Breeding activities and habitat use—2021 annual report: U.S. Geological Survey Open-File Report 2022–1012, 79 p. [Available at https://doi.org/10.3133/ofr20221012.]
Houston, A., Allen, L.D., Mendia, S.M., and Kus, B.E., 2023, Least Bell's Vireos and Southwestern Willow Flycatchers at the San Luis Rey Flood Risk Management Project Area in San Diego County, California—Breeding activities and habitat use—2022 annual report: U.S. Geological Survey Open-File Report 2023–1040, 74 p. [Available at https://doi.org/10.3133/ofr20231040.]
Howell, S.L., and Kus, B.E., 2015, Distribution, abundance, and breeding activities of the Southwestern Willow Flycatcher at Marine Corps Base Camp Pendleton, California—2015 annual data summary: Prepared for Assistant Chief of Staff, Environmental Security, U.S. Marine Corps Base Camp Pendleton, 89 p. [Available at https://sdmmp.com/view_article.php?cid=SDMMP_CID_187_659c377866e97.]
Howell, S.L., and Kus, B.E., 2016, Distribution, abundance, and breeding activities of the Southwestern Willow Flycatcher at Marine Corps Base Camp Pendleton, California—2016 Annual data summary: Prepared for Assistant Chief of Staff, Environmental Security, U.S. Marine Corps Base Camp Pendleton, 87 p. [Available at https://sdmmp.com/view_article.php?cid=SDMMP_CID_187_659c42972d23a.]
Howell, S.L., and Kus, B.E., 2017, Distribution, abundance, and breeding activities of the Southwestern Willow Flycatcher at Marine Corps Base Camp Pendleton, California—2017 Annual data summary: Prepared for Assistant Chief of Staff, Environmental Security, U.S. Marine Corps Base Camp Pendleton, 73 p. [Available at https://sdmmp.com/view_article.php?cid=SDMMP_CID_187_659c45704d6fb.]
Howell, S.L., and Kus, B.E., 2024a, Distribution, abundance, and breeding activities of the Southwestern Willow Flycatcher at Marine Corps Base Camp Pendleton, California—2020 annual report: U.S. Geological Survey Open-File Report 2024–1005, 35 p. [Available at https://doi.org/10.3133/ofr20241005.]
Howell, S.L., and Kus, B.E., 2024b, Distribution, abundance, and breeding activities of the Southwestern Willow Flycatcher at Marine Corps Base Camp Pendleton, California—2021 annual report: U.S. Geological Survey Open-File Report 2024–1039, 35 p. [Available at https://doi.org/10.3133/ofr20241039.]
Howell, S.L., and Kus, B.E., 2024c, Distribution, abundance, and breeding activities of the Southwestern Willow Flycatcher at Marine Corps Base Camp Pendleton, California—2022 annual report: U.S. Geological Survey Open-File Report 2023–1080, 27 p. [Available at https://doi.org/10.3133/ofr20231080.]
Howell, S.L., Lynn, S., and Kus, B.E., 2018, Distribution, abundance, and breeding activities of the Southwestern Willow Flycatcher at Marine Corps Base Camp Pendleton, California—2018 annual data summary: Restricted-File Federal Interagency Report, Prepared for Assistant Chief of Staff, Environmental Security, U.S. Marine Corps Base Camp Pendleton.
Howell, S.L., Lynn, S., and Kus, B.E., 2020, Distribution, abundance, and breeding activities of the Southwestern Willow Flycatcher at Marine Corps Base Camp Pendleton, California—2019 annual data summary: Restricted-File Federal Interagency Report, Prepared for Assistant Chief of Staff, Environmental Security, U.S. Marine Corps Base Camp Pendleton.
Kus, B.E., 1989a, Status and management of the Least Bell’s Vireo at the San Luis Rey River, San Diego County, California, 1988: Prepared for the State of California Department of Transportation, District 11, U.S. Geological Survey report, 32 p. [Available at https://pubs.usgs.gov/publication/96319.]
Kus, B.E., 1989b, Status of the Least Bell’s Vireo at the San Luis Rey River, San Diego County, California, 1989: Prepared for the State of California Department of Transportation, District 11, U.S. Geological Survey report, 15 p. [Available at https://pubs.usgs.gov/publication/96327.]
Kus, B.E., 1991a, Status of the Least Bell’s Vireo at the San Luis Rey River, San Diego County, California, 1990: Prepared for the State of California Department of Transportation, District 11, U.S. Geological Survey report, 10 p. [Available at https://pubs.usgs.gov/publication/96803.]
Kus, B.E., 1991b, Distribution and breeding status of the Least Bell’s Vireo at the San Luis Rey River, San Diego County, California, 1991: Prepared for the State of California Department of Transportation, District 11, U.S. Geological Survey report, 15 p. [Available at https://pubs.usgs.gov/publication/96802.]
Kus, B.E., 1993, Distribution and breeding status of the Least Bell’s Vireo at the San Luis Rey River, San Diego County, California, 1992–1993: Prepared for the State of California Department of Transportation, District 11, U.S. Geological Survey report, 29 p. [Available at https://pubs.usgs.gov/publication/96644.]
Kus, B.E., 1995, Distribution and breeding status of the Least Bell’s Vireo at the San Luis Rey River, San Diego County, California, 1994: Prepared for the State of California Department of Transportation, District 11, U.S. Geological Survey report, 25 p. [Available at https://pubs.usgs.gov/publication/96591.]
Kus, B.E., 1998, Use of restored riparian habitat by the endangered Least Bell’s Vireo (Vireo bellii pusillus): Restoration Ecology, v. 6, no. 1, p. 75–82, accessed August 31, 2023, at https://doi.org/10.1046/j.1526-100x.1998.06110.x.
Kus, B.E., 1999, Impacts of Brown-headed Cowbird parasitism on productivity of the endangered Least Bell’s Vireo: Studies in Avian Biology, no. 18, p. 160–166. [Available at https://www.researchgate.net/publication/260363840_Impacts_of_Brown-headed_Cowbird_parasitism_on_productivity_of_the_endangered_Least_Bell's_Vireo.]
Kus, B.E., and Beck, P.P., 1998, Distribution and abundance of the Least Bell’s Vireo (Vireo bellii pusillus) and the Southwestern Willow Flycatchers (Empidonax traillii extimus) at selected Southern California sites in 1997: Sacramento, Calif., California Department of Fish and Game, 76 p. [Available at https://www.researchgate.net/publication/260364086.]
Kus, B.E., and Whitfield, M.J., 2005, Parasitism, productivity, and population growth—Response of Least Bell’s Vireos (Vireo bellii pusillus) and Southwestern Willow Flycatchers (Empidonax traillii extimus) to cowbird (Molothrus spp.) control, chap. 2 of Ortega, C.P., Chace, J.F., and Peer, B.D., eds., Ornithological Monographs—Management of cowbirds and their hosts—Balancing science, ethics, and mandates: American Ornithologists’ Union, no. 57, p. 16–27. [Available at https://doi.org/10.2307/40166811.]
Kus, B.E., Hopp, S.L., Johnson, R.R., and Brown, B.T., 2020, Bell’s Vireo (Vireo bellii), version 1.0, in Poole, A.F., ed., Birds of the world: Ithaca, N.Y., Cornell Lab of Ornithology, accessed August 31, 2023, at https://doi.org/10.2173/bow.belvir.01.
Laake, J.L., 2013, RMark—An R interface for analysis of capture-recapture data with MARK: Seattle, Wash., National Oceanic and Atmospheric Administration, Alaska Fisheries Science Center, National Marine Fisheries Service, Processed Report 2013−01, 25 p. [Available at https://www.researchgate.net/publication/267509042_RMark_an_R_Interface_for_analysis_of_capture-recapture_data_with_MARK.]
Lynn, S., Allen, L.D., and Kus, B.E., 2014, Distribution, abundance, and breeding activities of the Least Bell’s Vireo at Marine Corps Base Camp Pendleton, California—2014 annual data summary: Prepared for Assistant Chief of Staff, Environmental Security, Marine Corps Base Camp Pendleton, 118 p. [Available at https://sdmmp.com/view_article.php?cid=SDMMP_CID_187_659c77c0ba635.]
Lynn, S., Allen, L.D., and Kus, B.E., 2015, Distribution, abundance, and breeding activities of the Least Bell’s Vireo at Marine Corps Base Camp Pendleton, California—2015 annual data summary: Prepared for Assistant Chief of Staff, Environmental Security, Marine Corps Base Camp Pendleton, 105 p. [Available at https://sdmmp.com/view_article.php?cid=SDMMP_CID_187_659c7a6f10976.]
Lynn, S., Allen, L.D., and Kus, B.E., 2016, Distribution, abundance, and breeding activities of the Least Bell’s Vireo at Marine Corps Base Camp Pendleton, California—2016 annual data summary: Prepared for Assistant Chief of Staff, Environmental Security, Marine Corps Base Camp Pendleton, 107 p. [Available at https://sdmmp.com/view_article.php?cid=SDMMP_CID_187_659c7c771dd08.]
Lynn, S., Allen, L.D., and Kus, B.E., 2017, Distribution, abundance, and breeding activities of the Least Bell’s Vireo at Marine Corps Base Camp Pendleton, California—2017 annual data summary: Prepared for Assistant Chief of Staff, Environmental Security, Marine Corps Base Camp Pendleton, 110 p. [Available at https://sdmmp.com/view_article.php?cid=SDMMP_CID_187_659c7fc35fb5d.]
Lynn, S., Allen, L.D., and Kus, B.E., 2018, Distribution, abundance, and breeding activities of the Least Bell’s Vireo at Marine Corps Base Camp Pendleton, California—2018 annual data summary: Restricted-File Federal Interagency Report, Prepared for Assistant Chief of Staff, Environmental Security, Marine Corps Base Camp Pendleton.
Lynn, S., Allen, L.D., and Kus, B.E., 2020, Distribution, abundance, and breeding activities of the Least Bell’s Vireo at Marine Corps Base Camp Pendleton, California—2019 annual data summary: Restricted-File Federal Interagency Report, Prepared for Assistant Chief of Staff, Environmental Security, Marine Corps Base Camp Pendleton.
Lynn, S., and Kus, B.E., 2010b, Distribution, abundance, and breeding activities of the Least Bell’s Vireo at Marine Corps Base Camp Pendleton, California—2010 annual data summary: Prepared for Assistant Chief of Staff, Environmental Security, Marine Corps Base Camp Pendleton, 100 p. [Available at https://sdmmp.com/view_article.php?cid=SDMMP_CID_187_659c64ceb460c.]
Lynn, S., and Kus, B.E., 2011, Distribution, abundance, and breeding activities of the Least Bell’s Vireo at Marine Corps Base Camp Pendleton, California—2011 annual data summary: Prepared for Assistant Chief of Staff, Environmental Security, Marine Corps Base Camp Pendleton, 78 p. [Available at https://sdmmp.com/view_article.php?cid=SDMMP_CID_187_659c66c5958a6.]
Lynn, S., and Kus, B.E., 2012, Distribution, abundance, and breeding activities of the Least Bell’s Vireo at Marine Corps Base Camp Pendleton, California—2012 annual data summary: Prepared for Assistant Chief of Staff, Environmental Security, Marine Corps Base Camp Pendleton, 84 p. [Available at https://sdmmp.com/view_article.php?cid=SDMMP_CID_187_659c693778eeb.]
Lynn, S., and Kus, B.E., 2013, Distribution, abundance, and breeding activities of the Least Bell’s Vireo at Marine Corps Base Camp Pendleton, California—2013 annual data summary: Prepared for Assistant Chief of Staff, Environmental Security, Marine Corps Base Camp Pendleton, 88 p. [Available at https://sdmmp.com/view_article.php?cid=SDMMP_CID_187_659c6d80ea94f.]
Lynn, S., Treadwell, M., and Kus, B.E., 2024a, Distribution, abundance, and breeding activities of the Least Bell’s Vireo at Marine Corps Base Camp Pendleton, California—2020 annual report: U.S. Geological Survey Open-File Report 2024–1009, 66 p. [Available at https://doi.org/10.3133/ofr20241009.]
Lynn, S., Treadwell, M., and Kus, B.E., 2024b, Distribution, abundance, and breeding activities of the Least Bell’s Vireo at Marine Corps Base Camp Pendleton, California—2021 annual report: U.S. Geological Survey Open-File Report 2023–1096, 68 p. [Available at https://doi.org/10.3133/ofr20231096.]
R Core Team, 2022, R—A language and environment for statistical computing: Vienna, Austria, R Foundation for Statistical Computing, accessed August 31, 2023, at http://www.R-project.org.
Riparian Habitat Joint Venture, 2004, The riparian bird conservation plan—A strategy for reversing the decline of riparian associated birds in California (ver. 2): California Partners in Flight, 156 p., accessed August 31, 2023, at http://www.elkhornsloughctp.org/uploads/files/1381276129Riparain%20Joint%20Venture%202004%20Riparian_Bird_Conservation_Plan.pdf.
Rourke, J.W., and Kus, B.E., 2006, Distribution, abundance, and breeding activities of the Least Bell’s Vireo at Marine Corps Base Camp Pendleton, California—2005 annual report: Prepared for Assistant Chief of Staff, Environmental Security, Marine Corps Base Camp Pendleton, U.S. Geological Survey 2005 Annual Report, 50 p.
Rourke, J.W., and Kus, B.E., 2008, Distribution, abundance, and breeding activities of the Least Bell’s Vireo at Marine Corps Base Camp Pendleton, California—2007 annual data summary: Prepared for Assistant Chief of Staff, Environmental Security, Marine Corps Base Camp Pendleton, U.S. Geological Survey Annual Data Summary, 68 p. [Available at https://sdmmp.com/view_article.php?cid=CID_ctamanah%40usgs.gov_5751c384040a9.]
Rourke, J.W., Kus, B.E., and Whitfield, M.J., 2004, Distribution and abundance of the Southwestern Willow Flycatcher at selected southern California sites in 2001: Prepared for the California Department of Fish and Game, Species Conservation and Recovery Program Report 2004–05, U.S. Geological Survey Final Report, 60 p. [Available at https://www.researchgate.net/publication/311067108.]
U.S. Fish and Wildlife Service, 2001, Least Bell’s Vireo survey guidelines: Carlsbad, Calif., U.S. Fish and Wildlife Service, Internal memorandum, 3 p., accessed November 8, 2022, at https://www.fws.gov/media/survey-guidelines-least-bells-vireo.
White, G.C., and Burnham, K.P., 1999, Program MARK—Survival estimation from populations of marked animals: Bird Study, v. 46, no. S1, p. S120–S139, accessed August 31, 2023, at https://doi.org/10.1080/00063659909477239.
Appendix 1. Least Bell’s Vireo Survey Areas at Marine Corps Base Camp Pendleton, 2022. Core Areas and Group D Areas Were Surveyed in 2022
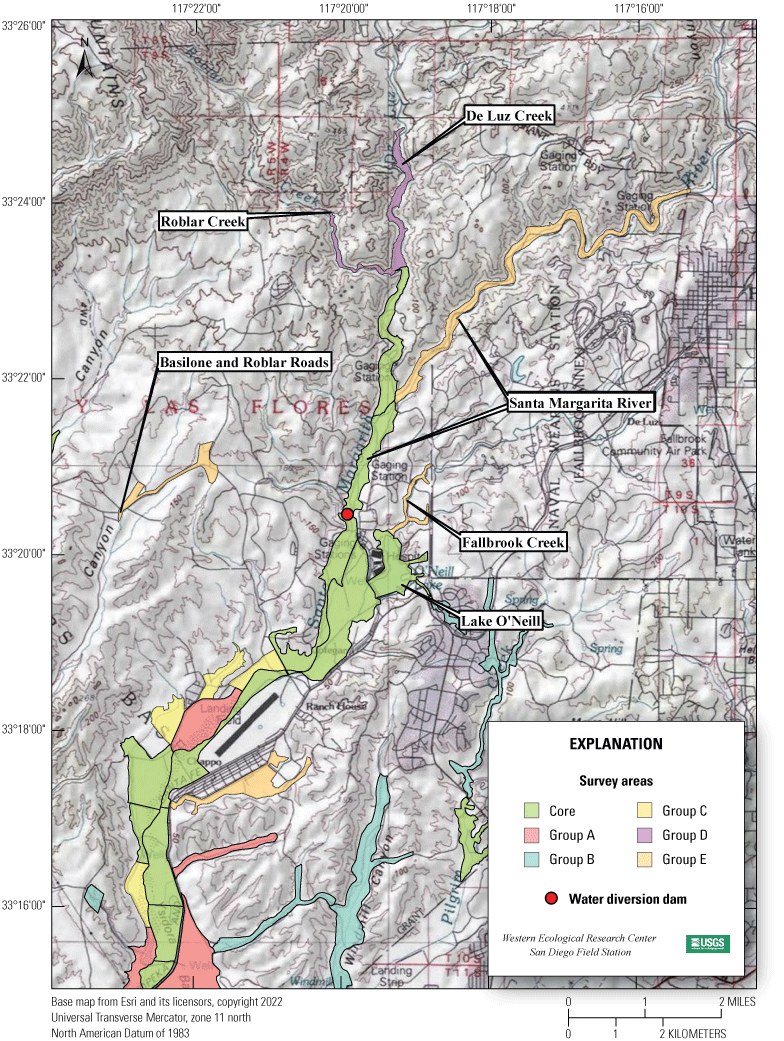
Least Bell’s Vireo survey areas at Marine Corps Base Camp Pendleton, 2022: Upper Santa Margarita River, Fallbrook Creek, Lake O’Neill, De Luz Creek, Roblar Creek, and Basilone and Roblar Roads.
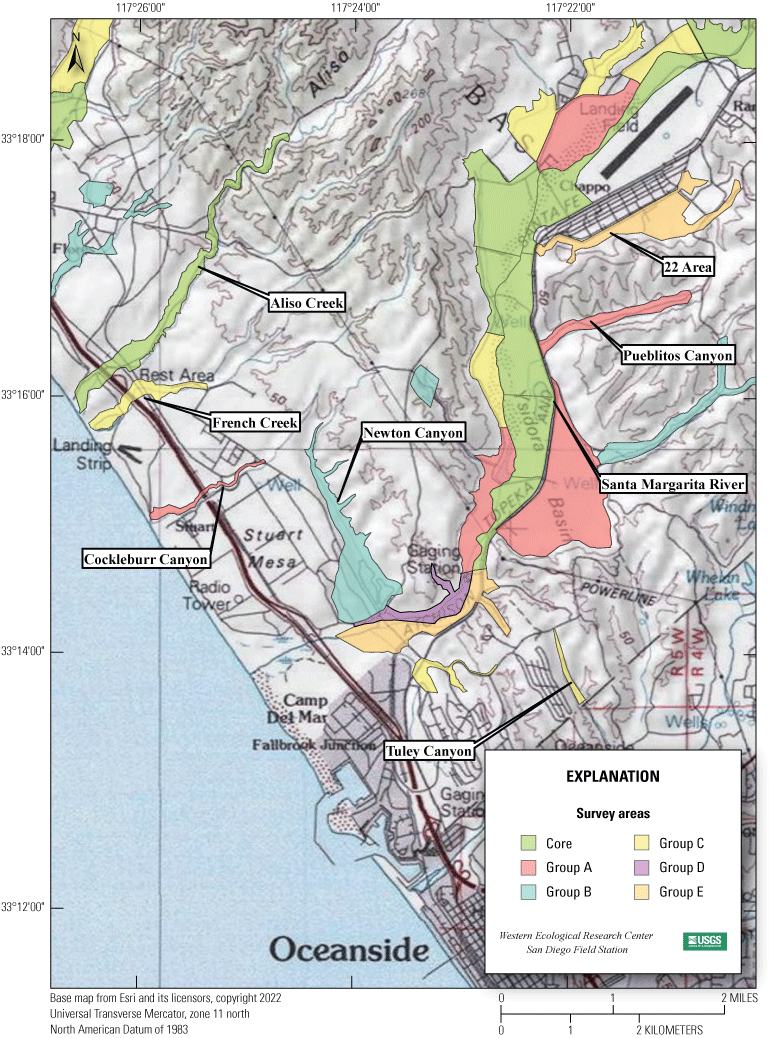
Least Bell’s Vireo survey areas at Marine Corps Base Camp Pendleton, 2022: Lower Santa Margarita River, 22 Area, Pueblitos Canyon, Tuley Canyon, Newton Canyon, Cockleburr Canyon, French Creek, and Aliso Creek.
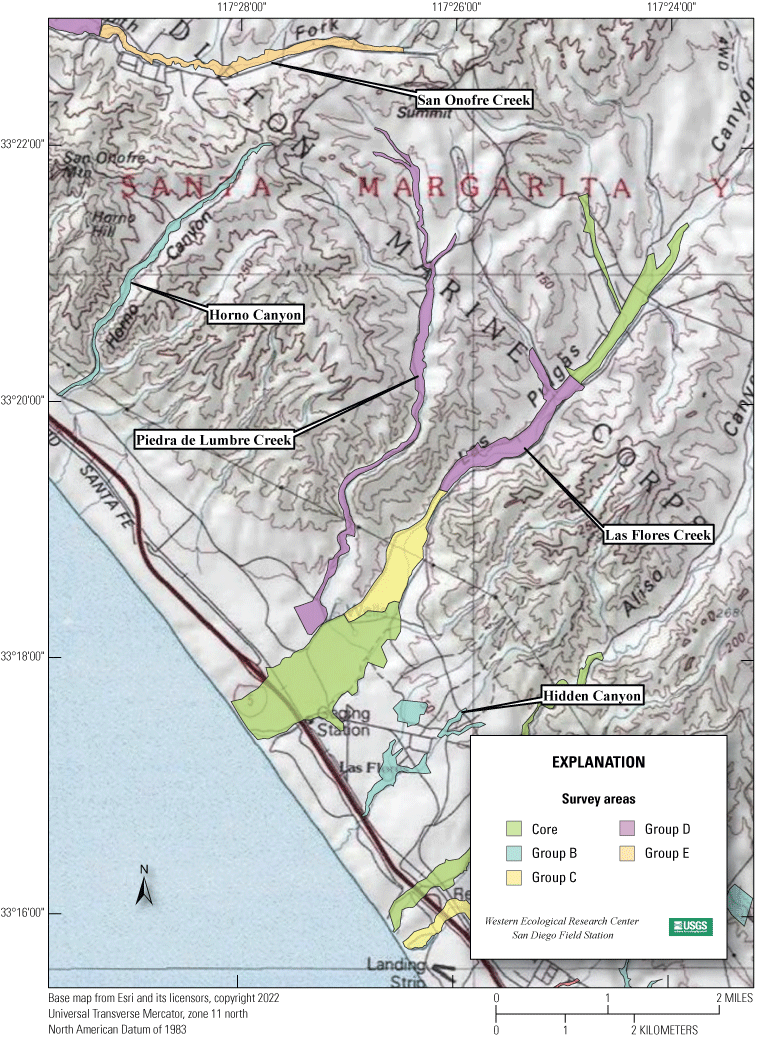
Least Bell’s Vireo survey areas at Marine Corps Base Camp Pendleton, 2022: San Onofre Creek South Fork, Horno Canyon, Piedra de Lumbre Creek, Las Flores Creek, and Hidden Canyon.
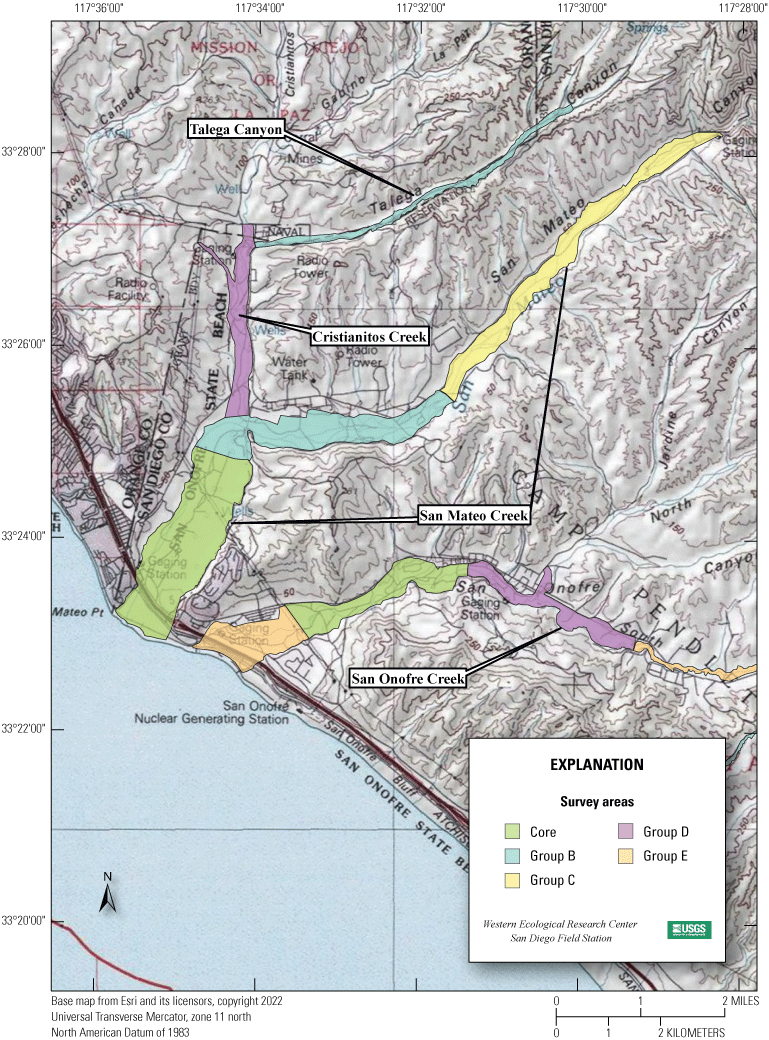
Least Bell’s Vireo survey areas at Marine Corps Base Camp Pendleton, 2022: Talega Canyon, Cristianitos Creek, San Mateo Creek, and San Onofre Creek.
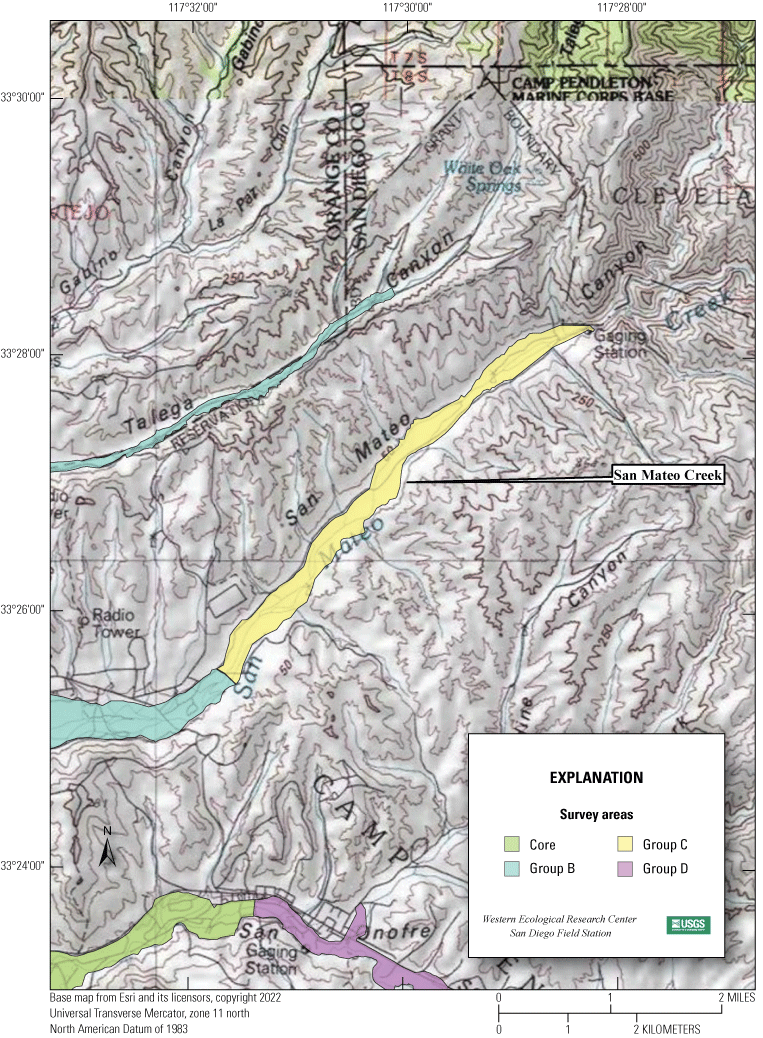
Least Bell’s Vireo survey areas at Marine Corps Base Camp Pendleton, 2022: Upper San Mateo Creek.
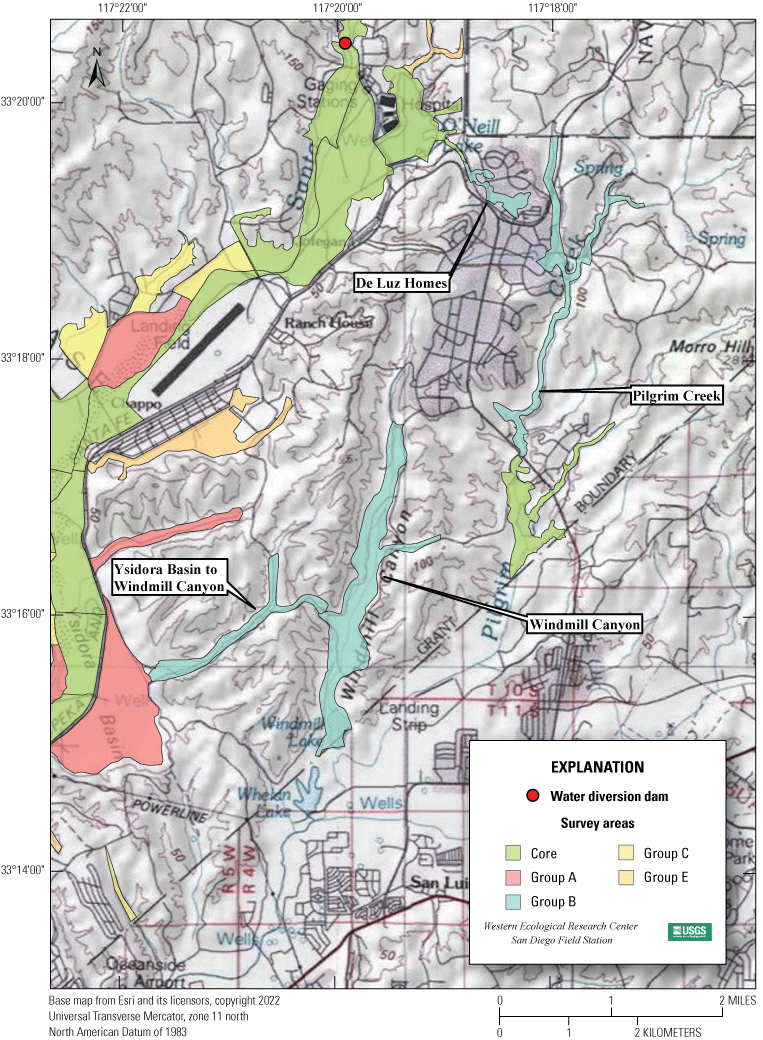
Least Bell’s Vireo survey areas at Marine Corps Base Camp Pendleton, 2022: Windmill Canyon, Ysidora Basin to Windmill Canyon, Pilgrim Creek, and De Luz Homes Habitat.
Appendix 2. Vegetation Sampling Locations and Vegetation Sampling Data Sheet, Marine Corps Base Camp Pendleton, 2022
Table 2.1.
Vegetation sampling locations, Marine Corps Base Camp Pendleton, 2022.[WGS 84, World Geodetic System of 1984]
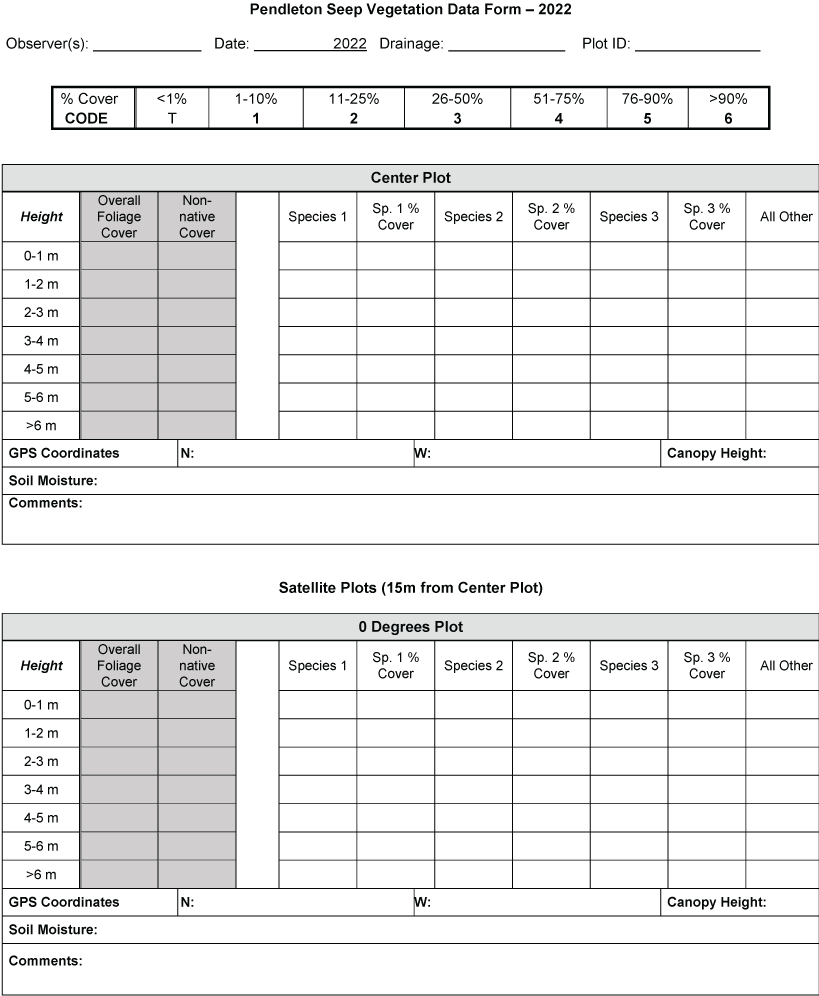
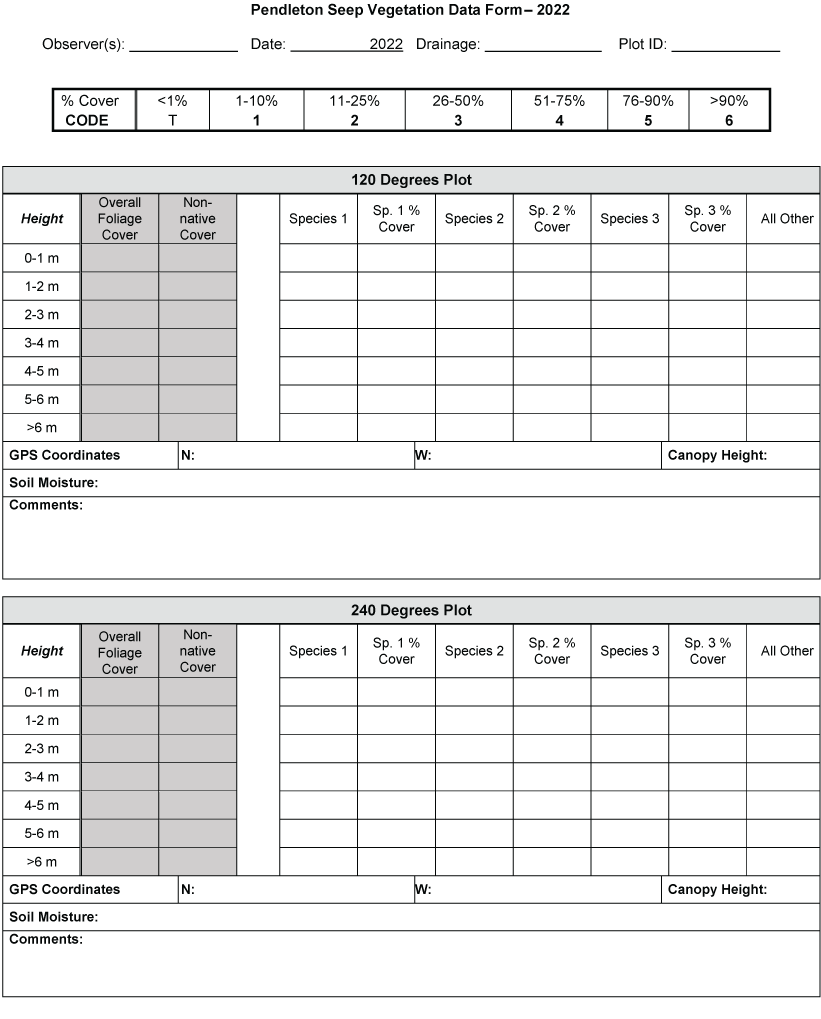
Pendleton seep vegetation data form—2022. A, page 1; B, page 2.
Appendix 3. Locations of Least Bell’s Vireos at Marine Corps Base Camp Pendleton, 2022
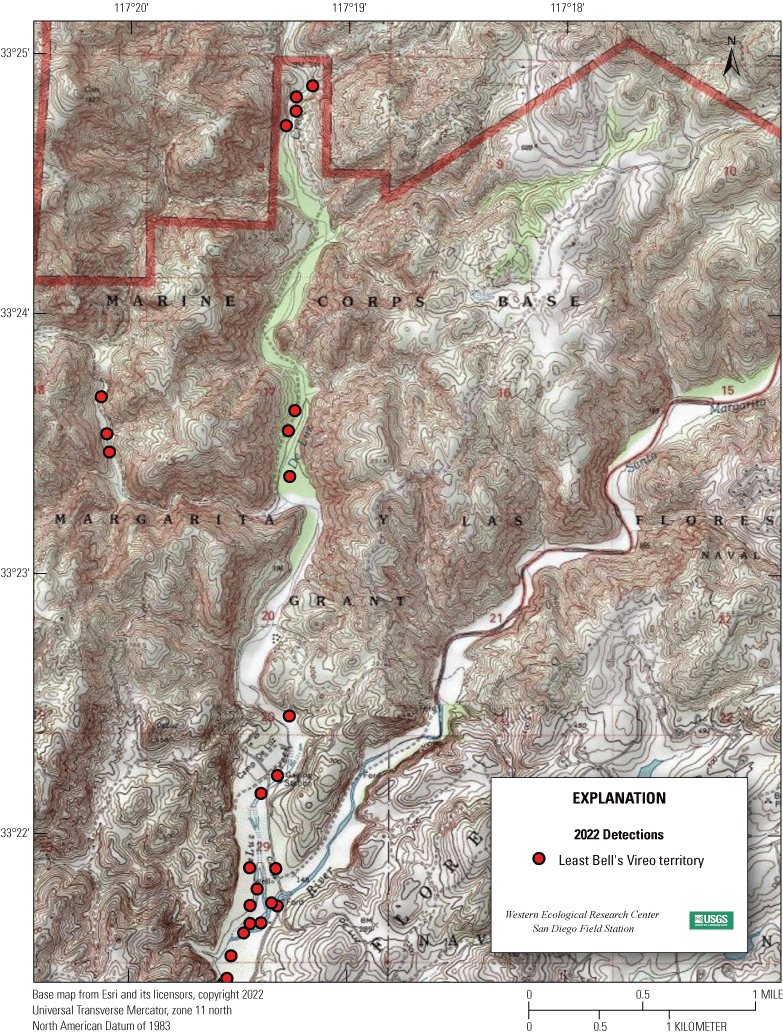
Locations of Least Bell’s Vireos at Marine Corps Base Camp Pendleton, 2022—De Luz Creek.
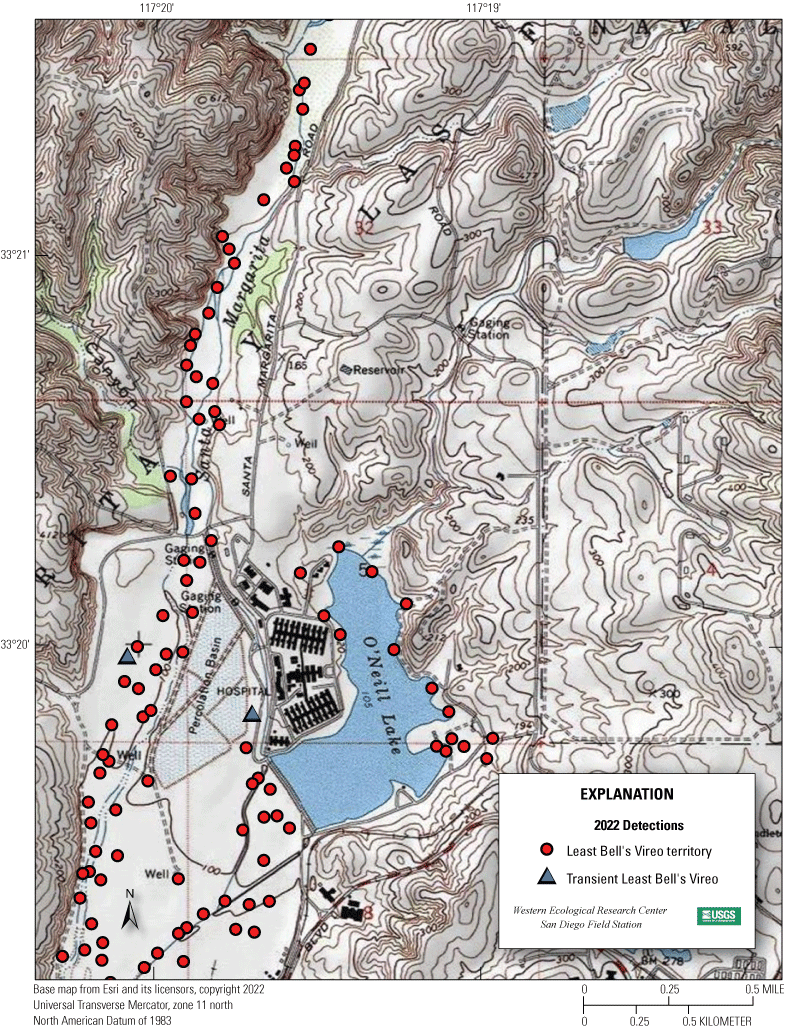
Locations of Least Bell’s Vireos at Marine Corps Base Camp Pendleton, 2022—Santa Margarita River and Lake O’Neill.
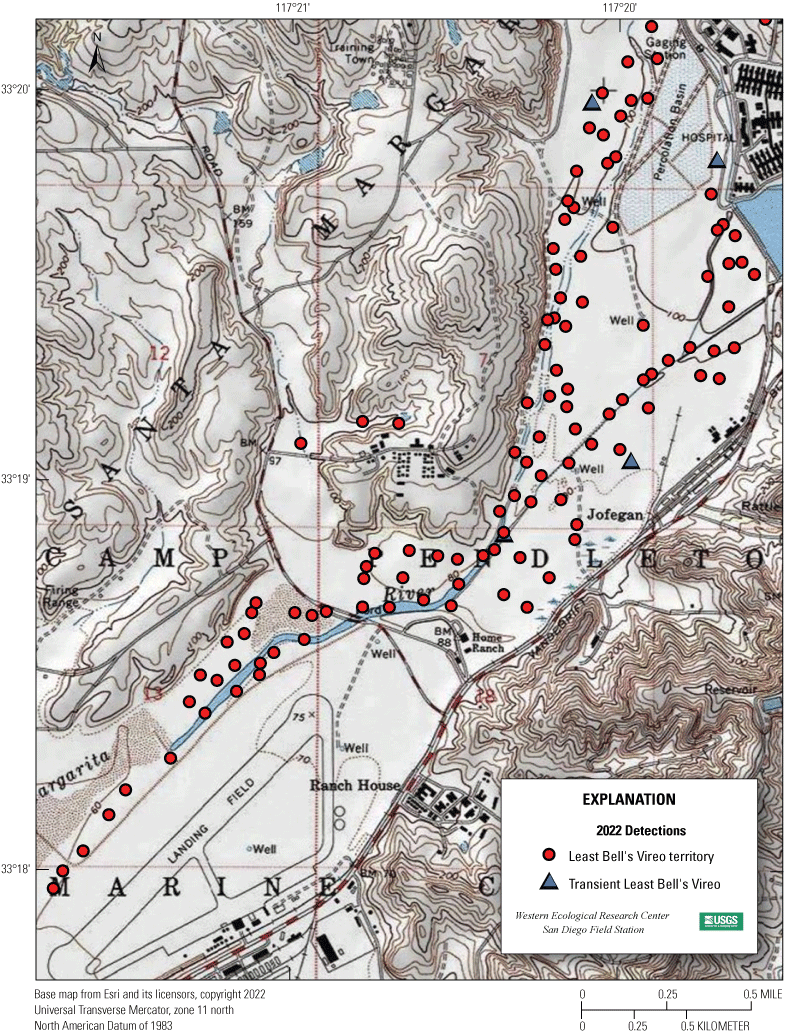
Locations of Least Bell’s Vireos at Marine Corps Base Camp Pendleton, 2022—Santa Margarita River.
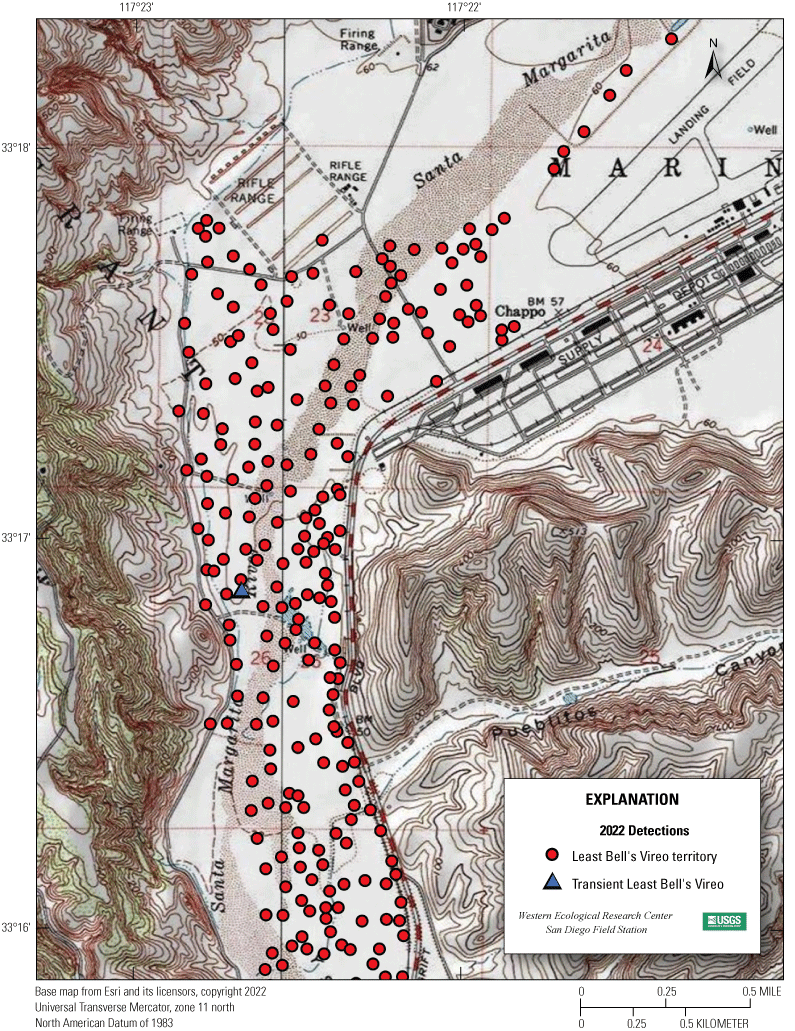
Locations of Least Bell’s Vireos at Marine Corps Base Camp Pendleton, 2022—Santa Margarita River.
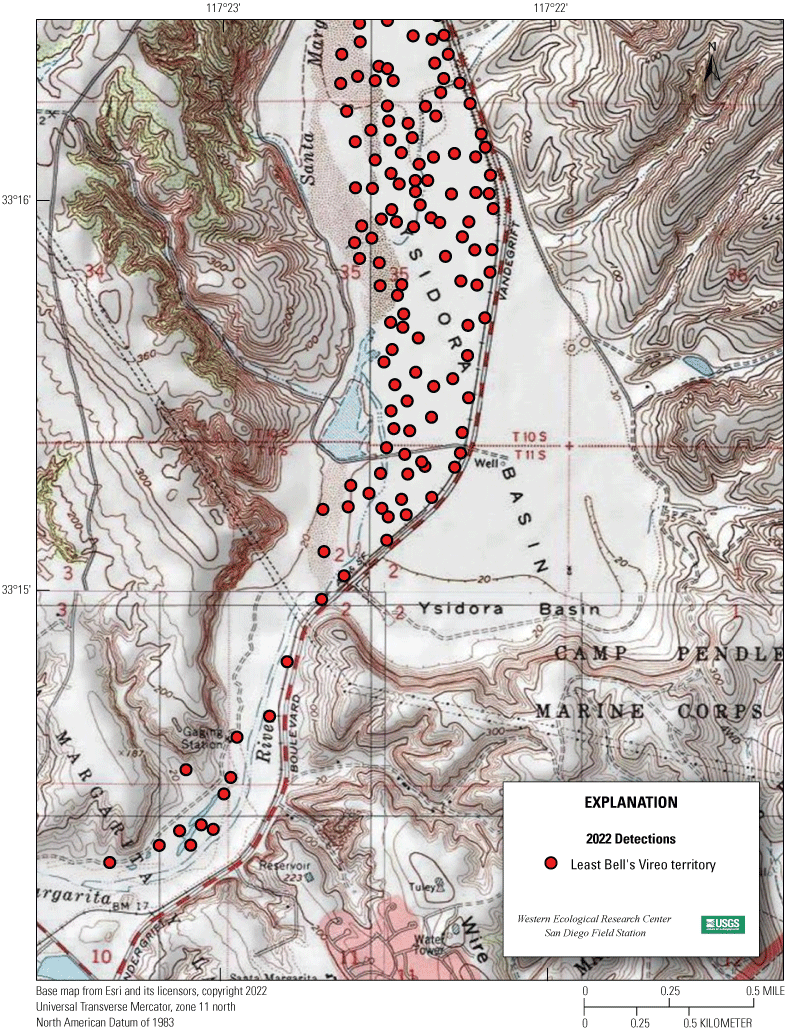
Locations of Least Bell’s Vireos at Marine Corps Base Camp Pendleton, 2022—Santa Margarita River and Tuley Canyon.
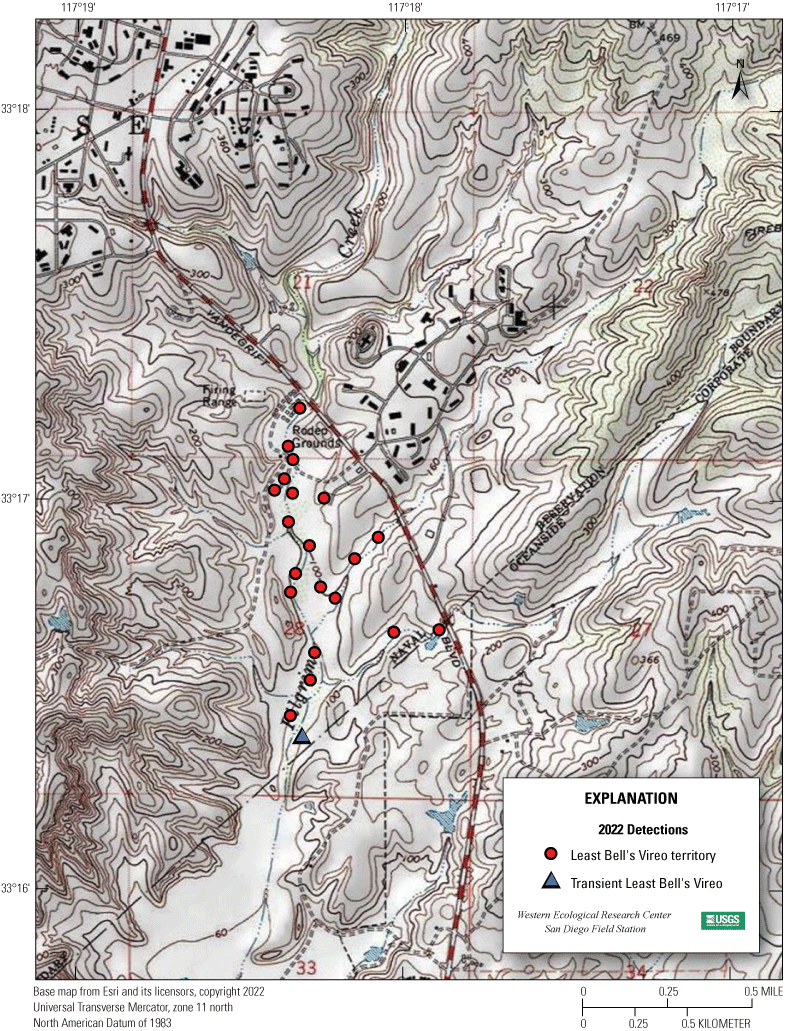
Locations of Least Bell’s Vireos at Marine Corps Base Camp Pendleton, 2022—Lower Pilgrim Creek.
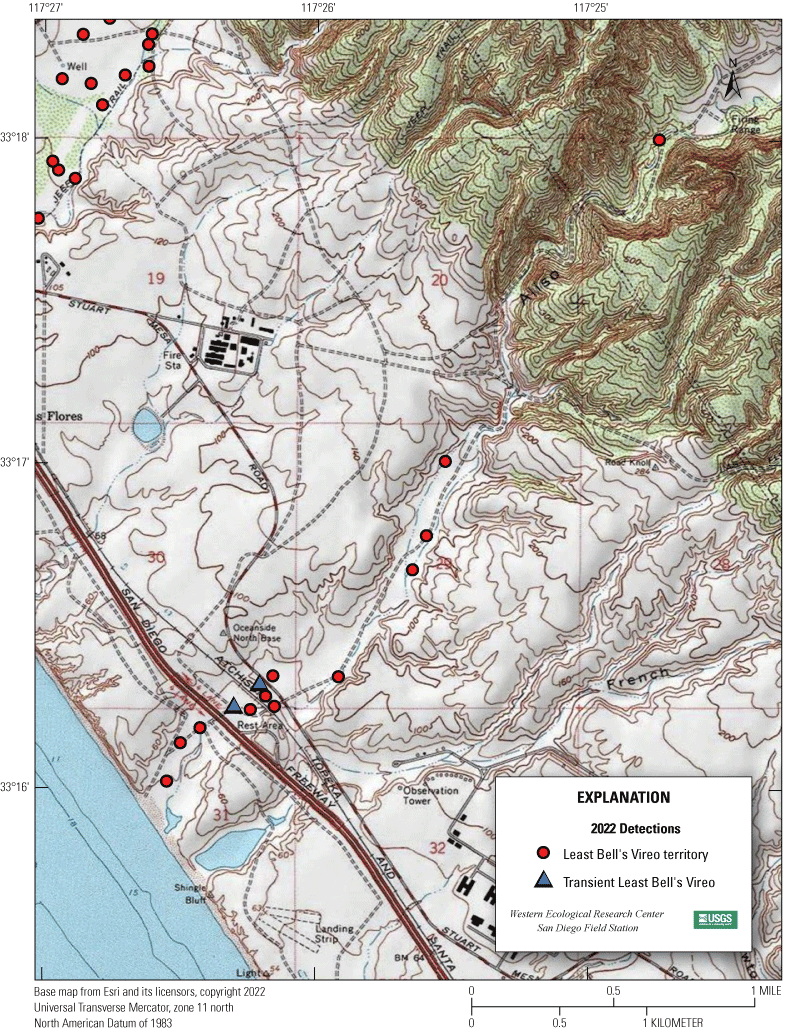
Locations of Least Bell’s Vireos at Marine Corps Base Camp Pendleton, 2022—Aliso Creek.
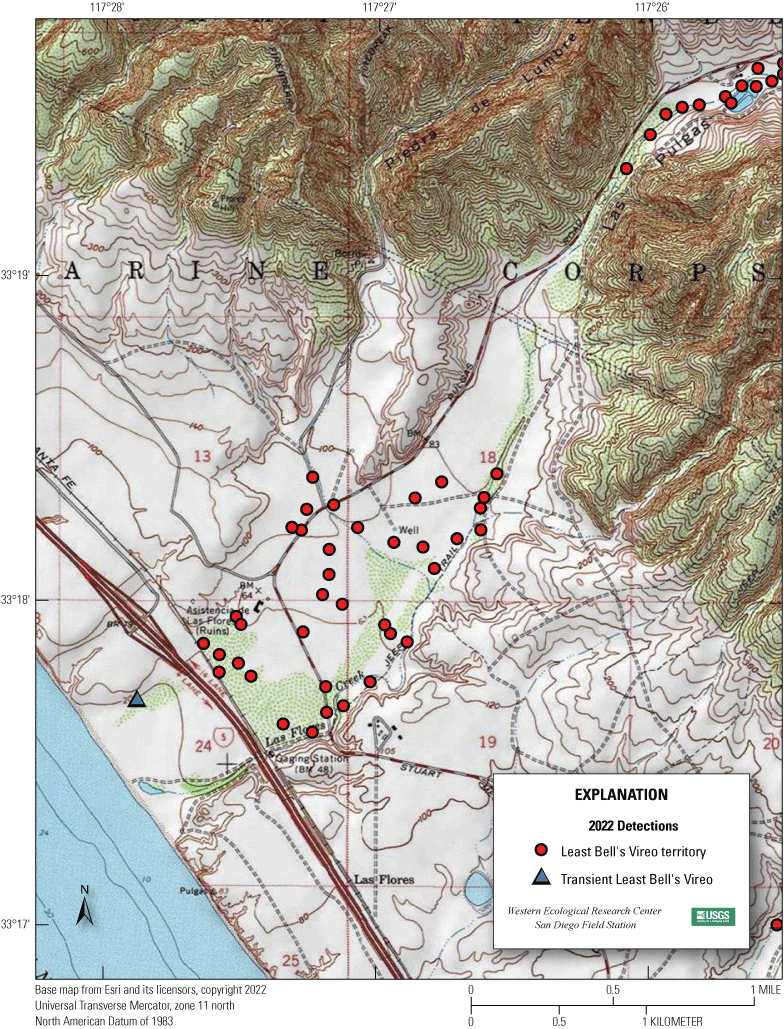
Locations of Least Bell’s Vireos at Marine Corps Base Camp Pendleton, 2022—Lower Las Flores Creek and lower Piedra de Lumbre Canyon.
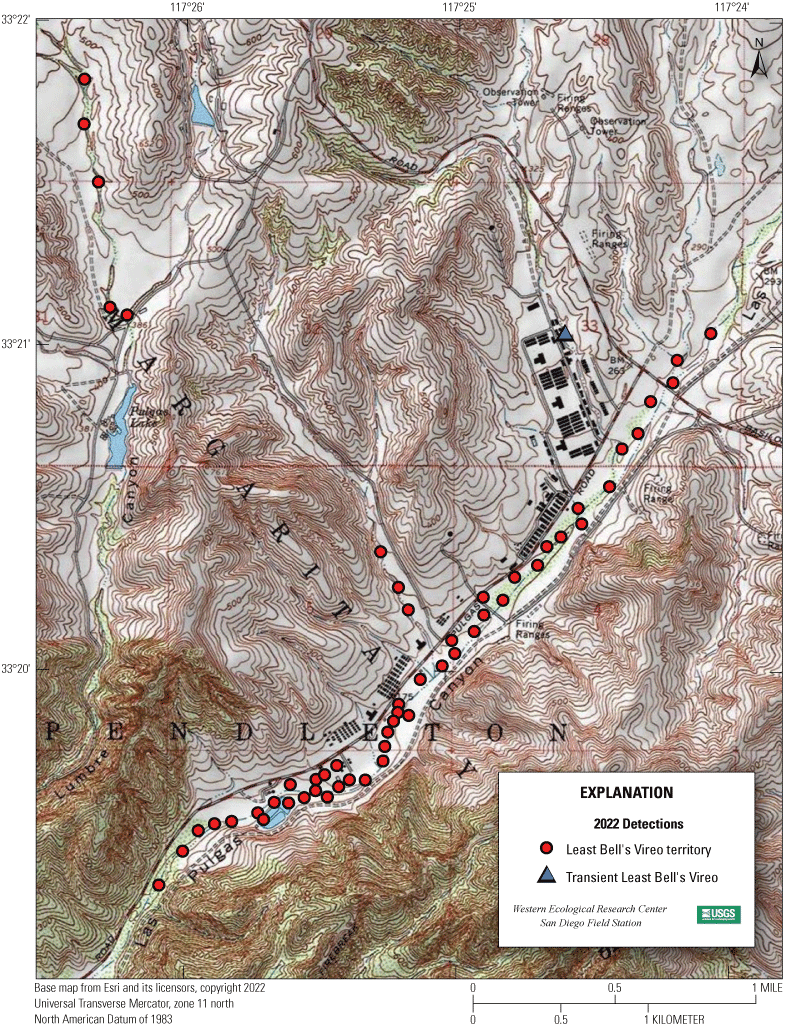
Locations of Least Bell’s Vireos at Marine Corps Base Camp Pendleton, 2022—Upper Las Flores Creek and upper Piedra de Lumbre Canyon.
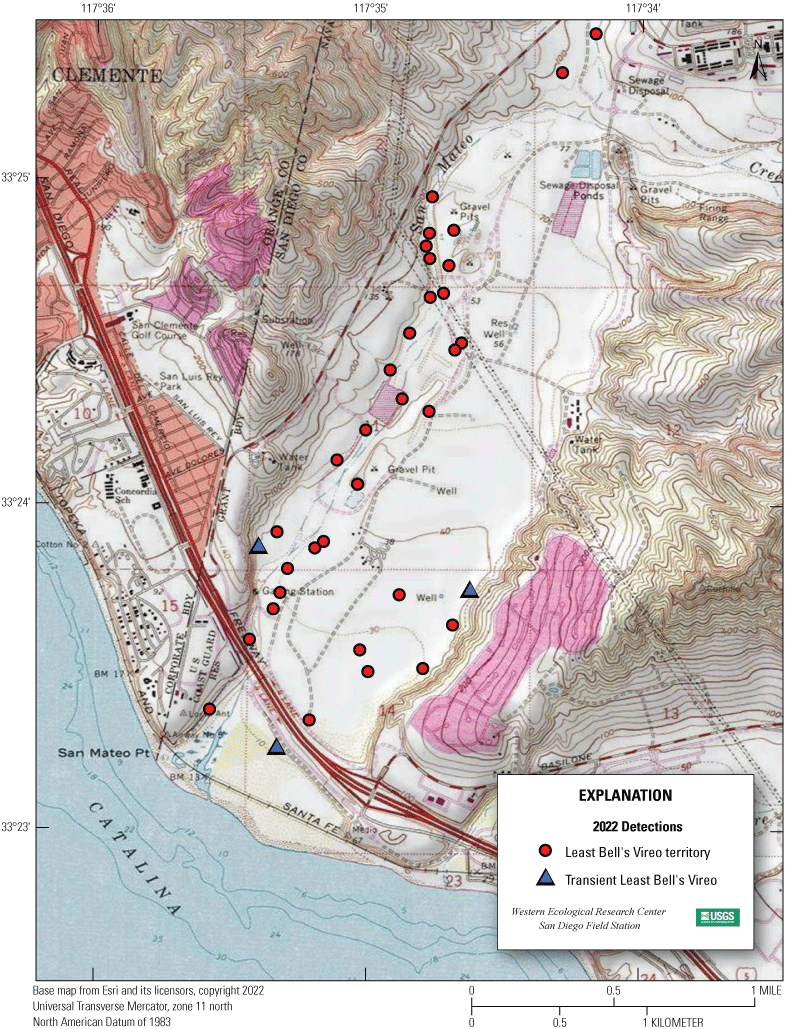
Locations of Least Bell’s Vireos at Marine Corps Base Camp Pendleton, 2022—Lower San Mateo Creek and Lower San Onofre Creek.
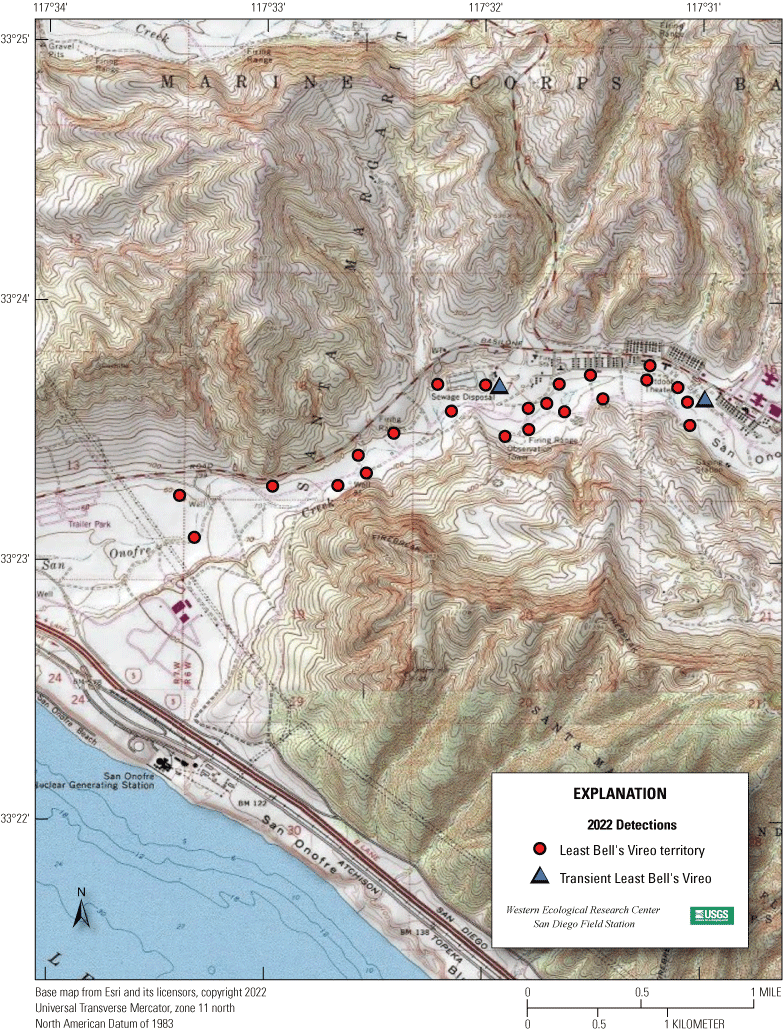
Locations of Least Bell’s Vireos at Marine Corps Base Camp Pendleton, 2022—San Onofre Creek (West).
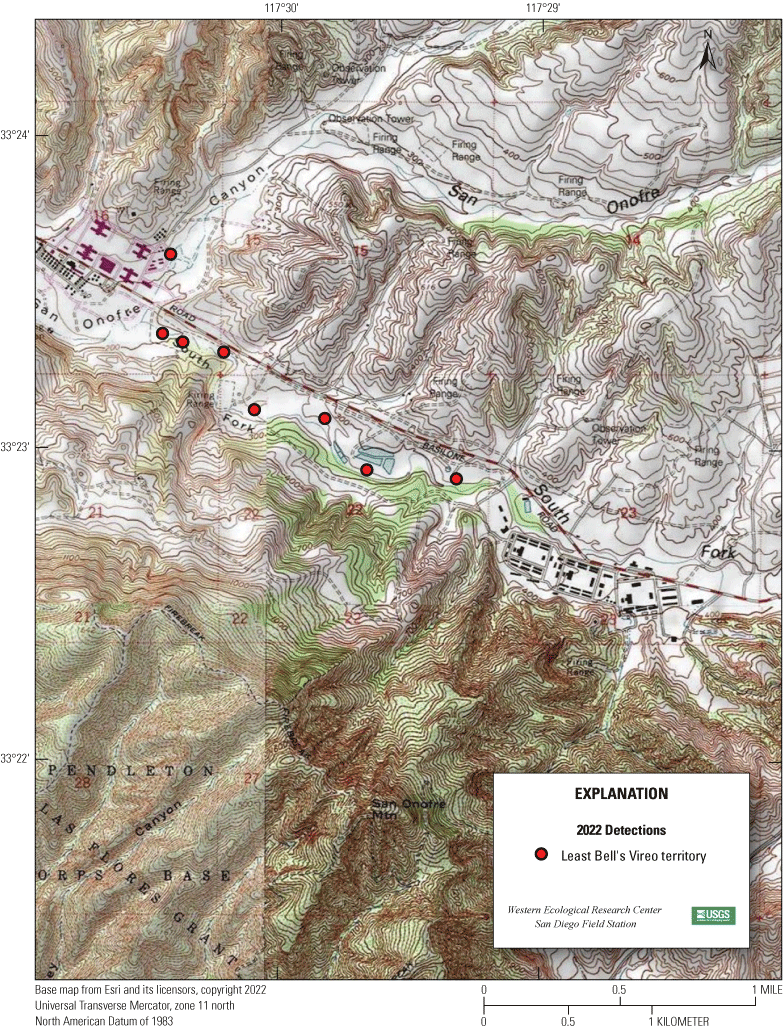
Locations of Least Bell’s Vireos at Marine Corps Base Camp Pendleton, 2022—San Onofre Creek (Middle).
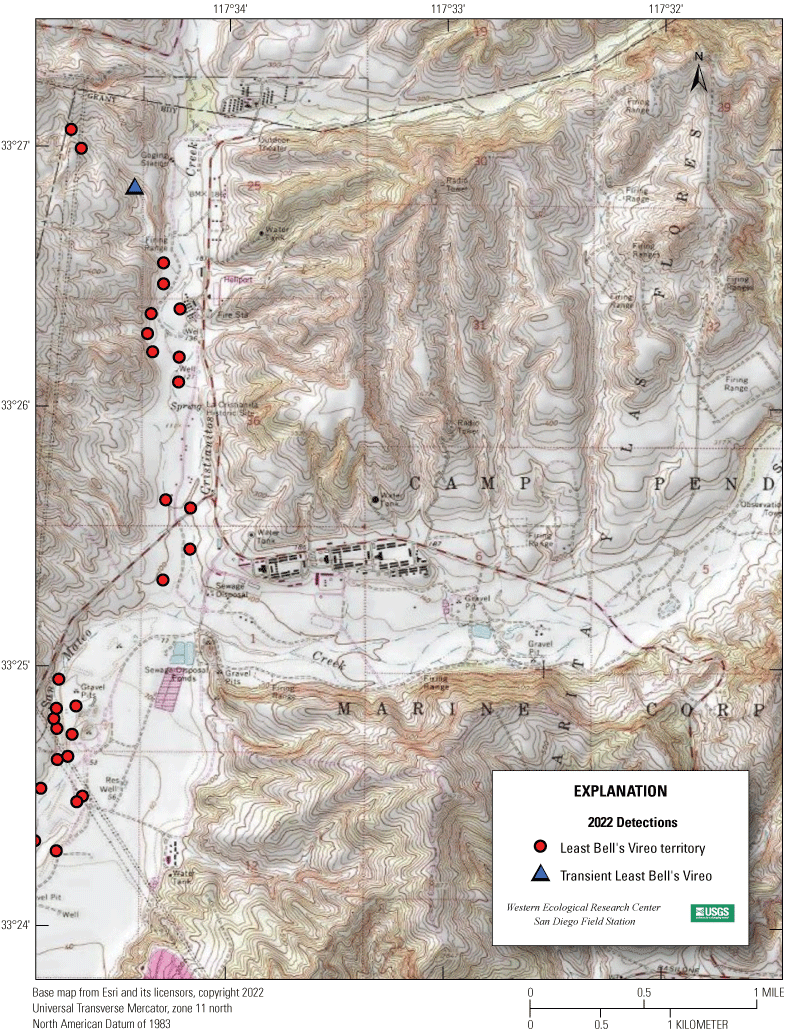
Locations of Least Bell’s Vireos at Marine Corps Base Camp Pendleton, 2022—Cristianitos Creek.
Appendix 4. Number of Least Bell’s Vireo Territories Detected in Each Drainage in Core Areas on Marine Corps Base Camp Pendleton, by Year, 2005–22
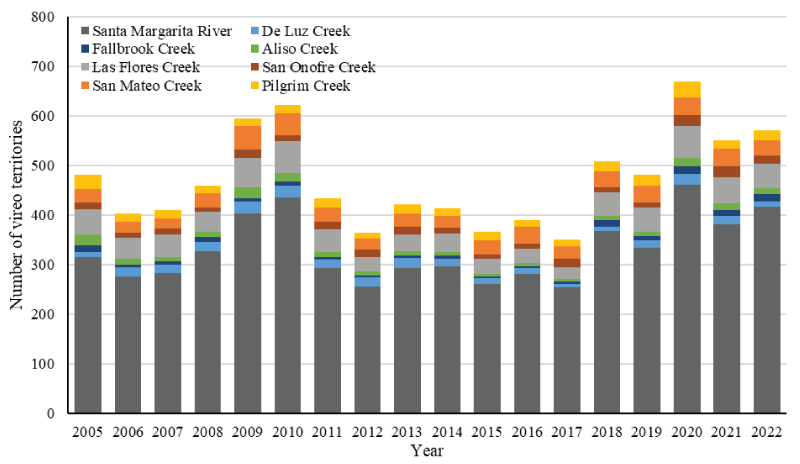
Number of Least Bell’s Vireo territories detected in each drainage in core areas on Marine Corps Base Camp Pendleton, by year, 2005–22.
Appendix 5. Proportion of Least Bell’s Vireo Territories, Including Areas Occupied by Transients, Dominated or Co-dominated by Non-native Vegetation, by Drainage, 2005–22
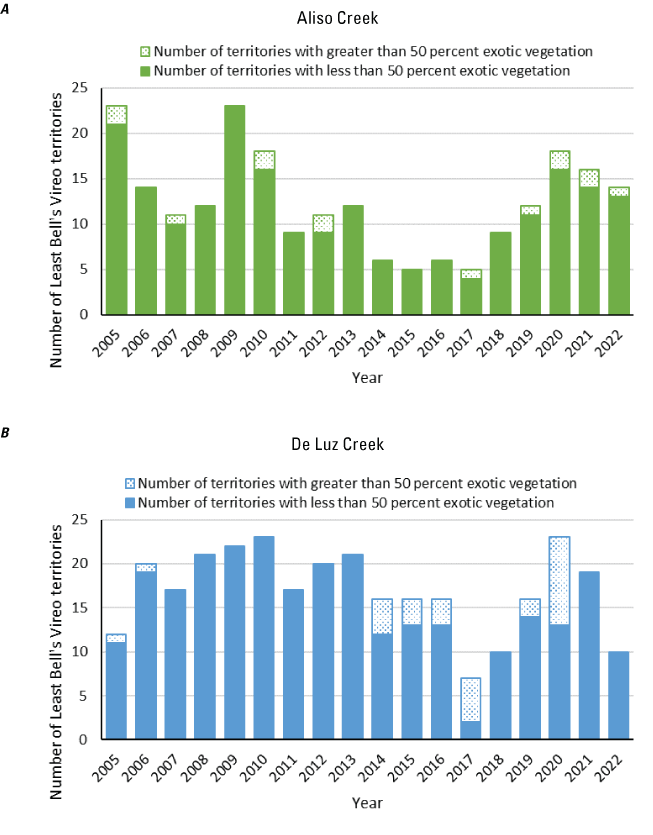
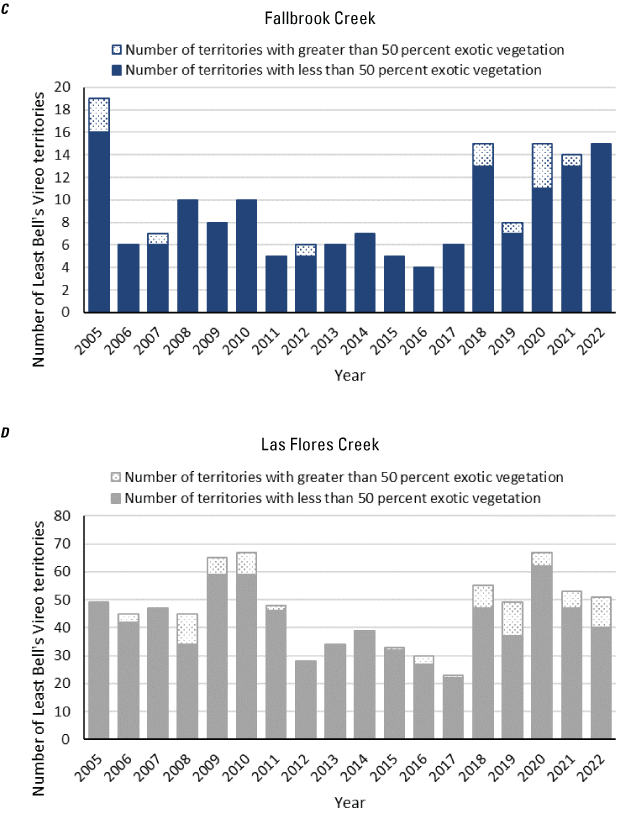
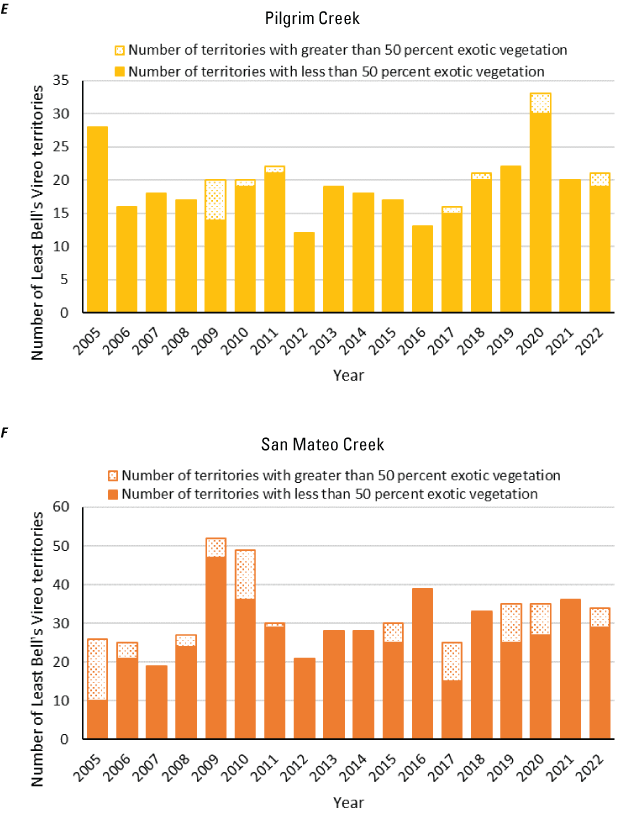
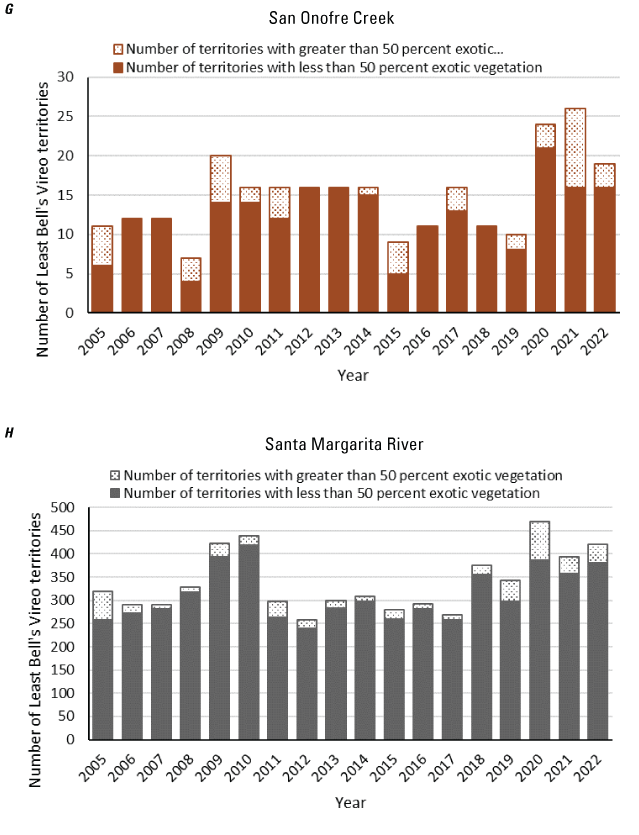
Proportion of Least Bell’s Vireo territories, including areas occupied by transients, dominated or co-dominated by non-native vegetation, by drainage, 2005–22. A, Aliso Creek; B, De Luz Creek; C, Fallbrook Creek; D, Las Flores Creek; E, Pilgrim Creek; F, San Mateo Creek; G, San Onofre Creek; and H, Santa Margarita River.
Appendix 6. Banded Least Bell’s Vireos at Marine Corps Base Camp Pendleton, 2022
Table 6.1.
Banded Least Bell’s Vireos at Marine Corps Base Camp Pendleton, 2022.[Band colors: Mdb, dark blue numbered federal band; Mgo, gold numbered federal band; Msi, silver numbered federal band; gogo, metal gold; pupu, metal purple; BKBK, plastic black; BKYE, plastic black-yellow split; BPST, plastic black-pink striped; BYST, plastic black-yellow striped; DGOR, plastic dark green-orange split; DPDP, plastic dark pink; DPWH, plastic dark pink-white split; ORDG, plastic orange-dark green split; OROR, plastic orange; ORPU, plastic orange-purple split; PUOR, plastic purple-orange split; PUPU, plastic purple; PUWH, plastic purple-white split; PUYE, plastic purple-yellow split; WHDP, plastic white-dark pink split; WHPU, plastic white-purple split; WHWH, plastic white; YEBK, plastic yellow-black split; YEPU, plastic yellow-purple split; YEYE, plastic yellow. Location codes in comments: MAPS, De Luz or Santa Margarita MAPS station; MCAS, Marine Corps Air Station, Camp Pendleton; MCBCP, Marine Corps Base Camp Pendleton; SLR, San Luis Rey River; SMR, Santa Margarita River. All other 3-letter codes are territory designations. Abbreviations: ≥, greater than or equal to; —, no bands]
Appendix 7. Between-year Movement of Adult and Juvenile Least Bell’s Vireos Detected at Marine Corps Base Camp Pendleton in 2022
Table 7.1.
Between-year movement of adult and juvenile Least Bell’s Vireos detected at Marine Corps Base Camp Pendleton in 2022.[Drainage codes: SMR, Santa Margarita River; DL, De Luz Creek; LF, Las Flores Creek; AL, Aliso Canyon; SLR, San Luis Rey River. Abbreviations: km, kilometer; ≥, greater than or equal to]
Appendix 8. Status and Nesting Activities of Least Bell's Vireos at Marine Corps Base Camp Pendleton, 2022
Table 8.1.
Status and nesting activities of Least Bell's Vireos at Marine Corps Base Camp Pendleton, 2022.[Monitoring: Full, fully monitored territory. Nest fate: SUC, fledged at least one Least Bell’s Vireo young; PRE, nest failure caused by predation; OTH, nest failed with known cause other than predation or parasitism; INC, nest not completed; UNK, reason for nest failure/abandonment unknown. Abbreviation: —, no data]
Datum
Horizontal coordinate information in text is referenced to the World Geodetic System of 1984 (WGS 84).
Horizontal coordinate information in mapped figures is referenced to the North American Datum of 1983 (NAD 83).
For more information concerning the research in this report, contact the
Director, Western Ecological Research Center
U.S. Geological Survey
3020 State University Drive East
Sacramento, California 95819
https://www.usgs.gov/centers/werc
Publishing support provided by the Science Publishing Network,
Sacramento Publishing Service Center
Disclaimers
Any use of trade, firm, or product names is for descriptive purposes only and does not imply endorsement by the U.S. Government.
Although this information product, for the most part, is in the public domain, it also may contain copyrighted materials as noted in the text. Permission to reproduce copyrighted items must be secured from the copyright owner.
Suggested Citation
Lynn, S., Treadwell, M., and Kus, B.E., 2024, Distribution, abundance, and breeding activities of the Least Bell's Vireo at Marine Corps Base Camp Pendleton, California—2022 annual report: U.S. Geological Survey Open-File Report 2024–1006, 82 p., https://doi.org/10.3133/ofr20241006.
ISSN: 2331-1258 (online)
Study Area
| Publication type | Report |
|---|---|
| Publication Subtype | USGS Numbered Series |
| Title | Distribution, abundance, and breeding activities of the Least Bell's Vireo at Marine Corps Base Camp Pendleton, California—2022 annual report |
| Series title | Open-File Report |
| Series number | 2024-1006 |
| DOI | 10.3133/ofr20241006 |
| Publication Date | August 23, 2024 |
| Year Published | 2024 |
| Language | English |
| Publisher | U.S. Geological Survey |
| Publisher location | Reston, VA |
| Contributing office(s) | Western Ecological Research Center |
| Description | x, 82 p. |
| Country | United States |
| State | California |
| Other Geospatial | Marine Corps Base Camp Pendleton |
| Online Only (Y/N) | Y |