

Results of 2018–19 Water-Quality and Hydraulic Characterization of Aquifer Intervals Using Packer Tests and Preliminary Geophysical-Log Correlations for Selected Boreholes At and Near the Former Naval Air Warfare Center Warminster, Bucks County, Pennsylvania
Links
- Document: Report (9.26 MB pdf) , HTML , XML
- Plate: Plates 1–5 (921 KB pdf)
- Data Release: USGS data release - Water-level data and selected field notes for aquifer-interval-isolation tests at and near the former Naval Air Warfare Center Warminster, Bucks County, Pennsylvania, 2018–19 (ver. 2.0, January 2024)
- Version History: Version History (949 B txt)
- Download citation as: RIS | Dublin Core
Acknowledgments
The support of U.S. Navy personnel and their contractors, Battelle Memorial Institute (Battelle) and Tetra Tech Incorporated, is gratefully acknowledged. Data and other technical support, as well as permission to access wells from the Warminster Township Municipal Authority, Warwick Township Water and Sewer Authority, Northampton Bucks County Municipal Authority, and Ivyland Borough is appreciated.
Many U.S. Geological Survey colleagues assisted with the project, including J. Alton Anderson, Philip Bird, Patrick Bowen, Robert Rosman, and Leif Olson who collected field data and William Kappel and Daniel Goode who completed the colleague technical reviews.
Abstract
The U.S. Geological Survey (USGS) collected data on the vertical distribution of hydraulic head, specific capacity, and water quality using aquifer-interval-isolation tests and other vertical profiling methods in 15 boreholes completed in fractured sedimentary bedrock in Northampton, Warminster, and Warwick Townships, Bucks County, Pennsylvania during 2018–19. This work was done, in cooperation with the U.S. Navy, to support detailed investigations at and near the former Naval Air Warfare Center (NAWC) Warminster, where groundwater contamination with per- and polyfluoroalkyl substances (PFAS) had become a concern since 2014. Two PFAS compounds, perfluorooctanesulfonic acid (PFOS) and perfluorooctanoic acid (PFOA), have been measured in groundwater samples from supply and monitoring wells at or near NAWC Warminster in concentrations above U.S. Environmental Protection Agency health advisory levels for drinking water. The area is underlain by the Triassic Stockton Formation, which predominantly consists of sandstone interbedded with shale and siltstone beds and forms a layered fractured-rock aquifer used for private, industrial, and public drinking water supply.
The vertical distribution of aquifer properties and water quality was assessed through hydraulic tests and sampling of aquifer intervals using a straddle-packer system (13 boreholes) or depth-discrete point sampling under known borehole-flow conditions (2 boreholes). Geophysical and video logs collected by USGS during 2017–19 were used to identify potential water-bearing fractures in 15 boreholes, which ranged in depth from 210 to 604 feet (ft) and included 6 boreholes drilled in 2018 and 9 existing wells on or near the former NAWC Warminster. Measured borehole flow was predominantly downward in most of the deepest boreholes (greater than 400 ft), which were commonly located at the highest land-surface elevations, with inflow from fractures at relatively shallow depths and outflow through fractures near or below depths of 500 ft below land surface. Hydraulic head differences measured during packer tests were up to about 60 ft between shallow and deep intervals. Borehole flow was predominantly upward in most boreholes less than 400 ft in depth and farther from, and at lower land-surface elevations than, the former NAWC Warminster. Total borehole specific capacity ranged from about 0.07 to 41 gallons per minute per foot [(gal/min)/ft]. Specific-capacity values for individual intervals ranged from 0.02 to 40.0 (gal/min)/ft, with a median of 1.14 (gal/min)/ft and a large range in values at most depths.
Differences in water quality of samples as indicated by field properties (pH, dissolved oxygen, and specific conductance) and concentrations of dissolved major ions, PFOA, and PFOS were apparent among isolated intervals in the boreholes. Summed concentrations of PFOA and PFOS ranged from about 11 to 10,780 nanograms per liter (ng/L) and were greater than the 2016 U.S. Environmental Protection Agency health advisory of 70 ng/L for summed PFOA and PFOS concentrations in 62 of 104 intervals and discrete depths tested. The mass ratio of PFOS to PFOA was generally higher than 1.0 in samples with summed PFOA and PFOS concentrations greater than 70 ng/L, with ratio values as high as 8.7. In many boreholes, summed concentrations of PFOA and PFOS were positively related to chloride concentrations, which were elevated above natural-background values [less than 10 milligrams per liter] in most samples and as high as 717 milligrams per liter. Sources of the elevated chloride other than, or in addition to, common rock salt (sodium chloride) were indicated by chloride to sodium molar ratios greater than 1.0. Water-quality data indicated that sampled water from some intervals with lower hydraulic heads may be affected by water from intervals with higher hydraulic heads because of vertical flow in open boreholes; samples from these intervals with lower hydraulic heads may not be fully representative due to some component of cross contamination and should be interpreted with caution.
Through a preliminary correlation of natural gamma and resistivity logs of boreholes drilled at and near the former NAWC Warminster, 11 lithologic units were identified and interpreted to strike northeast and dip to the northwest. Hydraulic heads were generally highest in isolated intervals that intercepted beds which, when projected up dip, crop out at the highest land-surface elevation on the former NAWC Warminster, indicating that the dipping-bed structure and topography are factors affecting the distribution of hydraulic head in the aquifer. The hydrogeologic framework in conjunction with the vertical distribution of hydraulic heads and water quality may assist in evaluating the locations of various PFAS sources and potential migration pathways of PFAS in groundwater at and near NAWC Warminster.
Introduction
Groundwater is a substantial source of public, domestic, and industrial water supply in areas underlain by the Stockton Formation, a fractured predominantly sandstone and siltstone aquifer, in southern Montgomery and Bucks Counties, Pennsylvania, where two formerly active military bases, Naval Air Warfare Center (NAWC) Warminster and Naval Air Station Joint Reserve Base (NASJRB) Willow Grove, are located, as described by Senior and others (2021). NAWC Warminster and NASJRB Willow Grove were active for 50 or more years from the 1940s until they were closed at the recommendation of the Base Realignment and Closure Commission. NAWC Warminster (formerly the Naval Air Development Center, Johnsville) in Warminster and Northampton Townships, Bucks County, Pennsylvania (fig. 1) was active during 1944–96. Since 1996, all but about 4 acres of the NAWC Warminster 824-acre property have been transferred from the U.S. Navy (Navy) to local municipalities, Bucks County, or private owners. NASJRB Willow Grove in Horsham Township, Montgomery County, Pennsylvania, operated by the Navy from 1942 until September 2011, and adjacent currently (2023) active Biddle Air National Guard Station (ANG), are located about 3 miles (mi) west of NAWC Warminster (fig. 1).
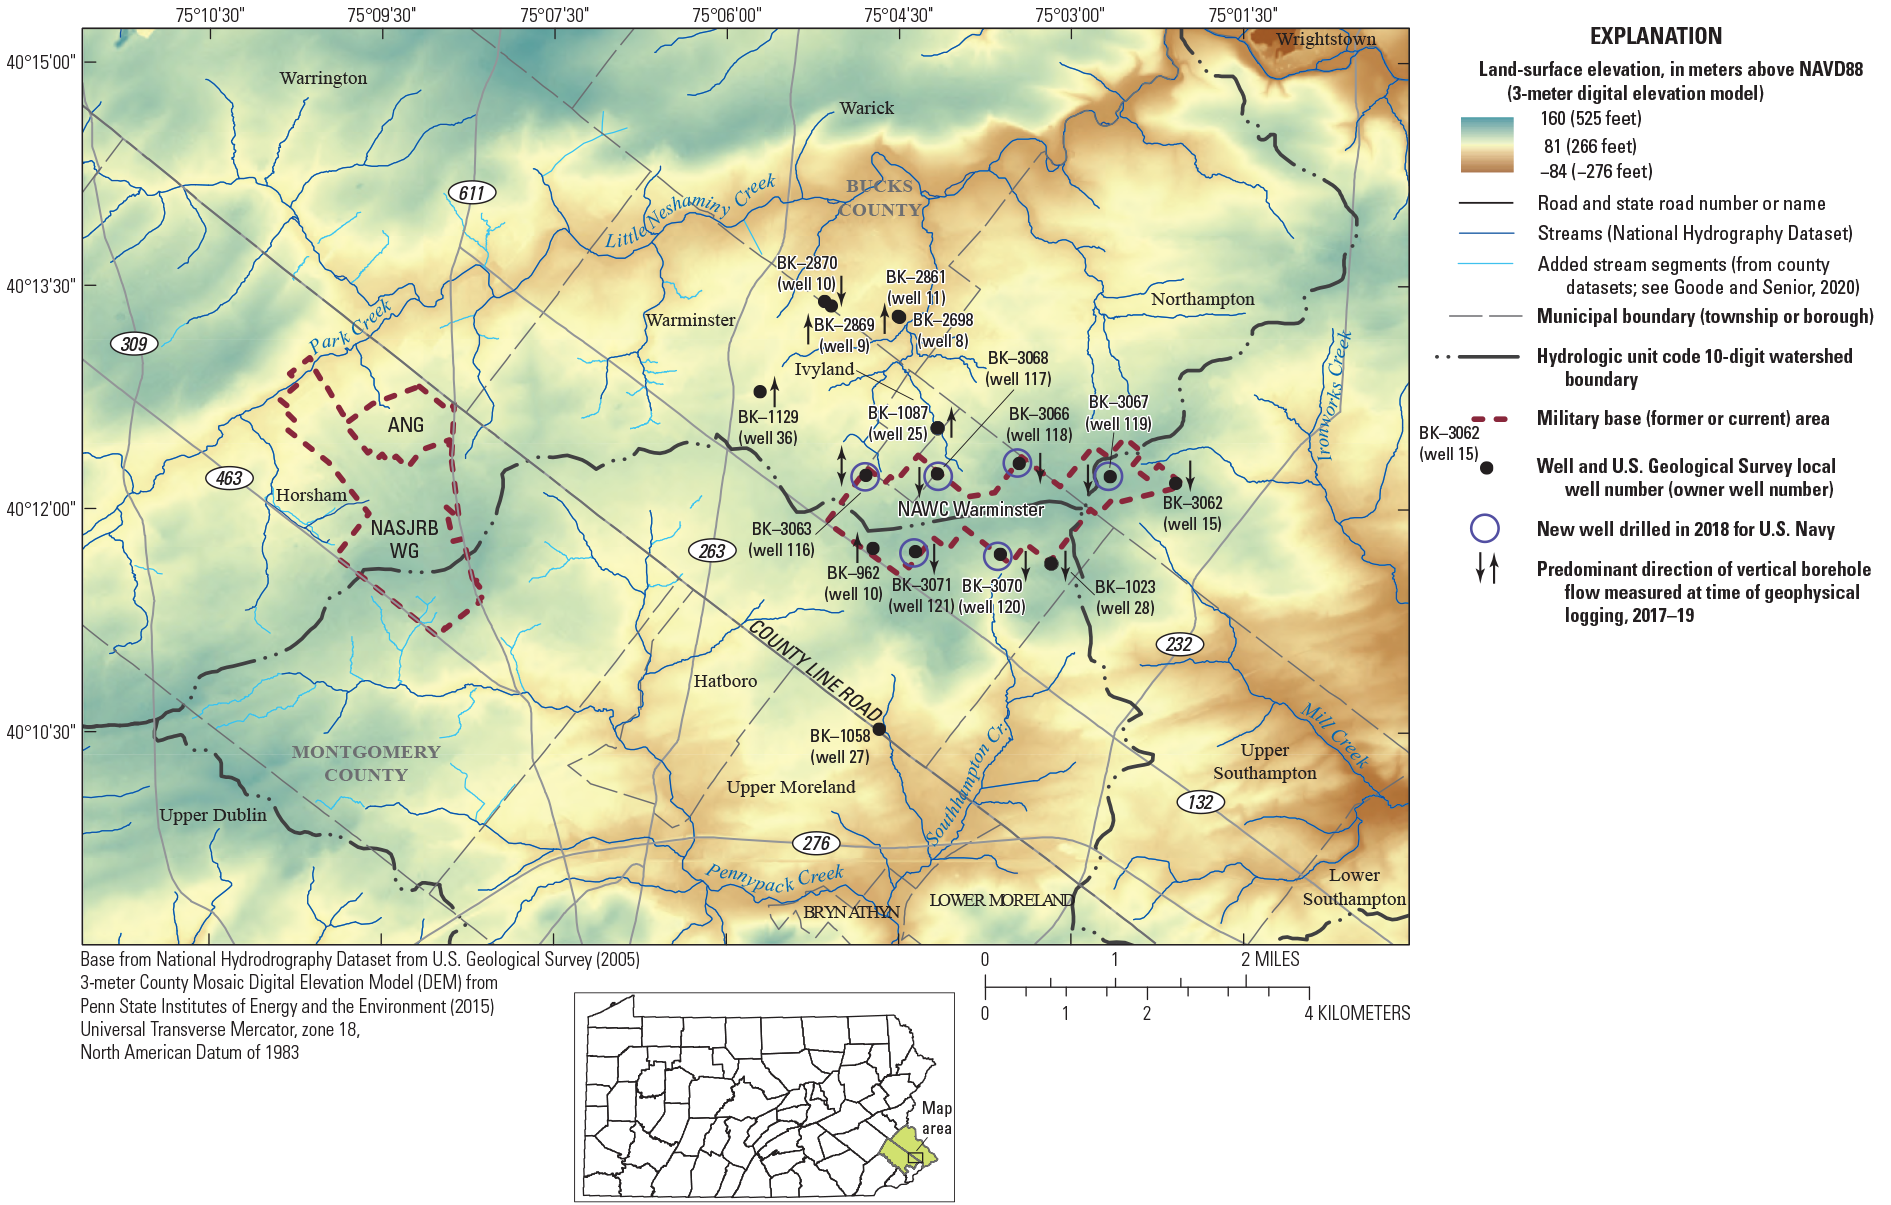
Map showing the location of former Naval Air Warfare Center (NAWC) Warminster, former Naval Air Station Joint Reserve Base (NASJRB) Willow Grove, and active Biddle Air National Guard Station (ANG), land-surface elevations, streams, and location of wells with geophysical and video logs collected by U.S. Geological Survey near NAWC Warminster during 2017–19, Bucks and Montgomery Counties, Pennsylvania. Figure modified from Senior and others (2021).
Groundwater at NAWC Warminster is affected by the presence of man-made organic compounds such as volatile organic compounds (VOCs) and per- and polyfluoroalkyl substances (PFAS), including the specific PFAS compounds perfluorooctanesulfonic acid (PFOS) and perfluorooctanoic acid (PFOA) (Tetra Tech, 2021). PFAS were first identified as an issue in summer 2014 in the study area, when groundwater at and near both NAWC Warminster and NASJRB Willow Grove was found to be contaminated with PFOS and PFOA in concentrations greater than the respective provisional health advisory (PHA) levels in drinking water (Tetra Tech, 2021) through sampling of public supply wells under the third Unregulated Contaminant Monitoring Rule (U.S. Environmental Protection Agency, 2012). In 2014, the PHA levels established by the U.S. Environmental Protection Agency (EPA) were 0.2 micrograms per liter (µg/L) for PFOS and 0.4 ug/L for PFOA (U.S. Environmental Protection Agency, 2014). Potential sources of PFOS and PFOA, part of a group of compounds more broadly classified as PFAS, include fire-suppressant compounds (fluorinated surfactants in aqueous film forming foams used on and near these facilities when the former NAWC Warminster and NASJRB Willow Grove were operating)(Tetra Tech, 2014; Resolution Consultants, 2019), as described by Senior and others (2021). In May 2016, the EPA revised the PFOS and PFOA health advisories to lower concentration levels and established a lifetime health advisory (LHA) not to exceed 70 nanograms per liter (ng/L) or 70 parts per trillion (ppt; equivalent to 0.07 µg/L) for summed concentrations of PFOS and PFOA (U.S. Environmental Protection Agency, 2016).
In 2014, production wells near the former NAWC Warminster and NASJRB Willow Grove were the primary source of public water supply for surrounding communities, whereas private domestic wells supplied many nearby residences. After PFAS were discovered in goundwater in the area in 2014, several public supply wells near the two bases in Horsham, Warrington, and Warminster Townships were shut down as a result of PFOA and PFOS concentrations above PHA levels (Resolution Consultants, 2019; Battelle, 2023). Subsequently, additional public supply wells in these townships were shut down in 2016 due to the presence of PFOS and PFOA in concentrations above the lower LHA levels of 70 ng/L for PFOA and PFOS (Leidos, 2018; Battelle, 2023). Since 2016, some supply wells have remained active, or have resumed active status, with treatment that was installed to remove PFOS and PFOA from pumped groundwater, as needed, and for some wells, with support from the Navy or ANG (U.S. Navy, 2022a; U.S. Navy, 2022b). Additionally, the Navy and the ANG have offered to connect nearby residences having private domestic wells that yielded water with PFOS and PFOA concentrations greater than the relevant HA to public drinking water supplies (Leidos, 2018; Tetra Tech, 2021), as described by Senior and others (2021). The Navy and ANG have also established a program to monitor PFOS and PFOA concentrations in drinking water from nearby private domestic wells for residences that have not been connected to public supply; near the former NAWC Warminster, these monitored wells include those for which summed PFOS plus PFOA concentrations were detectable but less than the LHA of 0.07 µg/L (Tetra Tech, 2021; Tetra Tech, 2022).
Management and mitigation of groundwater that is contaminated with PFOS and PFOA at and near the former NAWC Warminster requires assessment of the sources and spatial distribution of the contaminants. In 2014, the Navy and its contractors began sampling soils, streams, and groundwater through preliminary remedial investigations. Since 2014, the existing groundwater extraction and treatment system implemented to control and remediate volatile organic compounds (VOCs), consisting mostly of trichloroethylene and tetrachloroethylene, in groundwater at the former NAWC Warminster was modified to remove PFAS (Battelle, 2016; Tetra Tech, 2021), as described by Senior and others (2021). The Navy drilled new boreholes in 2018 to be reconstructed as monitoring wells after characterization to depths of 600 ft bls on the former NAWC Warminster to provide information about PFAS at aquifer depths at which nearby production wells were completed (Goode and Senior, 2020), and where monitoring data at depths greater than 300 ft bls were lacking. The Navy requested technical support from the USGS in performing geophysical logging and aquifer-interval-isolation (packer) testing of the new boreholes and existing wells as part of investigations to characterize PFAS distribution in groundwater. The packer tests, which involve isolating intervals with discrete water-bearing openings in fractured-rock aquifers, provide data on the vertical distribution of hydraulic properties of, and chemical characteristics of water from, the isolated intervals and were completed in 2018–19.
Revised regulatory or advisory levels of PFAS in drinking water to protect human health have been proposed or released since 2019. In November 2021, the Pennsylvania Department of Environmental Protection (PADEP) announced proposed maximum contaminant levels (MCLs) of 14 ppt (ng/L) for PFOA and 18 ppt (ng/L) for PFOS in drinking water (Pennsylvania Department of Environmental Protection, 2021) and finalized those MCLs in January 2023 (Pennsylvania Department of Environmental Protection, 2023). In June 2022, the EPA released interim updated drinking-water LHA’s of 0.004 ppt (ng/L) for PFOA and 0.02 ppt (ng/L) for PFOS (U.S. Environmental Protection Agency, 2022). In March 2023, the EPA proposed a National Primary Drinking Water Regulation to establish legally enforceable MCLs for six PFAS in drinking water, including a proposed MCL of 4 ppt (ng/L) for PFOA and 4 ppt (ng/L) for PFOS as individual contaminants and a proposed MCL for four other compounds as a PFAS mixture (U.S. Environmental Protection Agency, 2023).
Previous Investigations
Before 2014, as described by Senior and others (2021), in studies related to remedial investigations of VOCs in groundwater by the Navy and their contractors at and near the former NAWC Warminster, the U.S. Geological Survey (USGS) collected geophysical logs, performed aquifer-interval-isolation (packer) tests of wells and other hydrologic investigations, and prepared a water-table map (Conger, 1998; Conger and Bird, 1999; Sloto and Grazul, 1995; Sloto, 199740; Sloto and others, 1998; Sloto, 200841)). Sloto and others (1995) and Sloto (2010) investigated groundwater flow and VOC contaminant migration at a Superfund site near NAWC Warminster. The USGS also completed townshipwide hydrogeologic studies for Warminster Township (Sloto and Davis, 1983) and Warwick Township (Bird, 1998; Rowland, 199733). Sloto and others (1996) described the hydrogeology of the Stockton Formation in the Borough of Hatboro and Warminster Township.
Since 2014, when PFAS was detected in groundwater at or near the former NAWC Warminster and NASJRB Willow Grove, remedial investigations by the Navy, ANG, and their contractors have been completed to describe PFAS concentrations in soils, groundwater, and streams (Battelle, 2016; Battelle, 2019; Leidos, 2022; Resolution Consultants, 2019). USGS developed a regional groundwater flow model that simulated groundwater-flow path lines from possible PFAS source areas at the former NAWC Warminster and NASJRB Willow Grove (Goode and Senior, 2020). Borehole geophysical and video logs collected by USGS during 2017–19 in boreholes at and near the former NAWC Warminster are described by Senior and others (2021).
As noted in Senior and others (2021), the hydrogeology of the Stockton Formation and other geologic units of the study area have been described in more detail by Rima and others (1962), Longwill and Wood (1965), Greenman (1955), Newport (1971), and Sloto and others (1996). Low and others (2002) provide an overview of geohydrologic properties of the Stockton Formation and other geologic units from well records and previous investigations in southeastern Pennsylvania. Additional investigations have been completed by local water suppliers, by regulatory agencies, and by parties responsible for contamination of groundwater in the area. Many of these investigations are described in documents available in public record depositories. Specific investigations that provided data for this study are cited throughout this report.
Purpose and Scope
This report documents results of aquifer-interval-isolation tests (commonly known as packer tests) and discrete-point sampling at selected depths as an alternative vertical profiling method done during 2018–19 by the USGS in 15 open boreholes. Preliminary lithologic correlations among boreholes developed using natural gamma and electric (single-point resistance and resistivity) geophysical logs collected by USGS for this investigation and previous studies are presented for selected boreholes. Lithologic correlations are considered preliminary because of uncertainty related to lateral lithologic variability of the underlying Stockton Formation and relatively sparse spatial distribution of geophysical logs.
Data on hydraulic head, specific capacity, and water quality are presented for intervals isolated using straddle packers in tests done by USGS in 13 open boreholes, including 6 boreholes drilled by the Navy in 2018 for the investigation and 7 existing former production or test wells at and near the former NAWC Warminster. Only water-quality data are presented for two other existing open boreholes that were sampled by an alternate vertical profiling method using a discrete-point sampler to collect water samples at selected depths. Water-quality data include field measurements of selected characteristics (pH, temperature, specific conductance, and dissolved oxygen concentration) of water being pumped from the isolated interval at the time of sample collection, and results of laboratory analysis for major ions and stable isotopes (USGS laboratories) and PFAS (Battelle laboratory) in the water samples collected from the isolated intervals during packer tests or using the discrete-point sampler.
The preliminary lithologic correlations as developed using available natural gamma and electric (resistivity and single-point resistance) geophysical logs for selected boreholes drilled at and near the former NAWC boreholes are presented on cross sections with 2018–19 data for isolated intervals, including static hydraulic head and range of PFAS concentrations in water samples. Results of the packer testing, vertical profiling, and the lithologic correlations are intended to help determine the vertical distribution of PFAS in the aquifer and better describe the local hydrogeologic setting as part of information needed to manage the groundwater contamination at and near NAWC Warminster. These data may assist in identification of potential groundwater pathways for PFAS transport and possible data gaps.
Hydrogeologic Setting
The study area lies within the Gettysburg-Newark Lowlands section of the Piedmont province physiographic region (fig. 2). The Gettysburg-Newark Lowland section is principally underlain by Triassic to Jurassic sedimentary rocks of the Mesozoic Newark Basin, a rift basin; these deposits were later intruded by Jurassic diabase and faulted and folded in places (Lyttle and Epstein, 1987). The Piedmont Upland and Lowland sections south of, and adjacent to, the study area are underlain by Paleozoic metasedimentary rocks and older (Proterozoic) metamorphic rocks (Sevon, 2000).
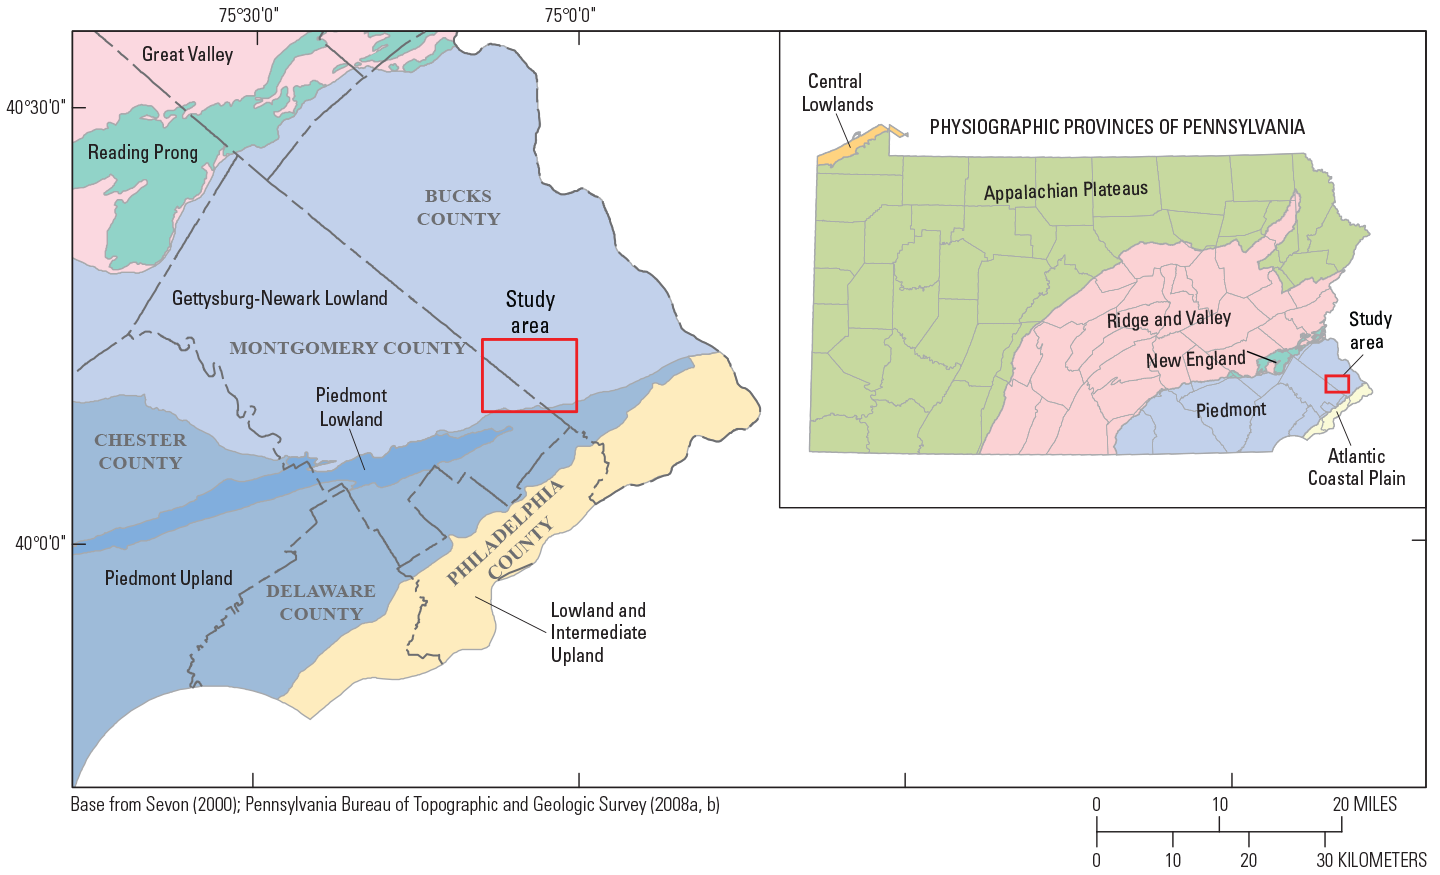
Map showing physiographic provinces of Pennsylvania (inset) and sections in study area in southeastern Pennsylvania. Physiographic provinces from Sevon (2000).
The central part of the study area is underlain by the Triassic Stockton Formation (fig. 3), which consists of gray to reddish brown sandstones and conglomerates, with siltstone and shale (Rima and others, 1962). The Stockton Formation, the oldest of sedimentary units in the Newark Basin, was deposited unconformably on folded and faulted metamorphic rocks of Paleozoic and Proterozoic age, which crop out along the southern border of the Stockton Formation (fig. 3), as described by Senior and others (2021). The Stockton Formation has been divided into three members in Montgomery County, Pennsylvania that are present in a generally fining upward sequence with the lower arkose member having coarsest deposits (conglomerates and sandstones), middle arkose member having fine- to medium-grained sandstones, and the upper shale member having the finest deposits (shales, siltstones, and fine-grained sandstones) (Rima and others, 1962). Mapping of these members recently (2023) was extended from Montgomery County into Bucks County, and identifies that the former NAWC Warminster is principally underlain by the middle member of the Stockton Formation (Bierly and Oest, 2023). Locally, lithologies may interfinger in the Stockton Formation and beds may pinch out (Rima and others, 1962) or be laterally discontinuous, likely as a result of the fluvial or deltaic origin of some deposits within the Stockton Formation (Turner-Peterson and Smoot, 1985). Diabase dikes have been mapped as intruding the Stockton Formation about 3 mi west and northwest of the former NAWC Warminster, near the former NASJRB Willow Grove (fig. 3) (Rima and others, 1962; Lyttle and Epstein, 1987), and other smaller dikes may be present but not mapped in the area.
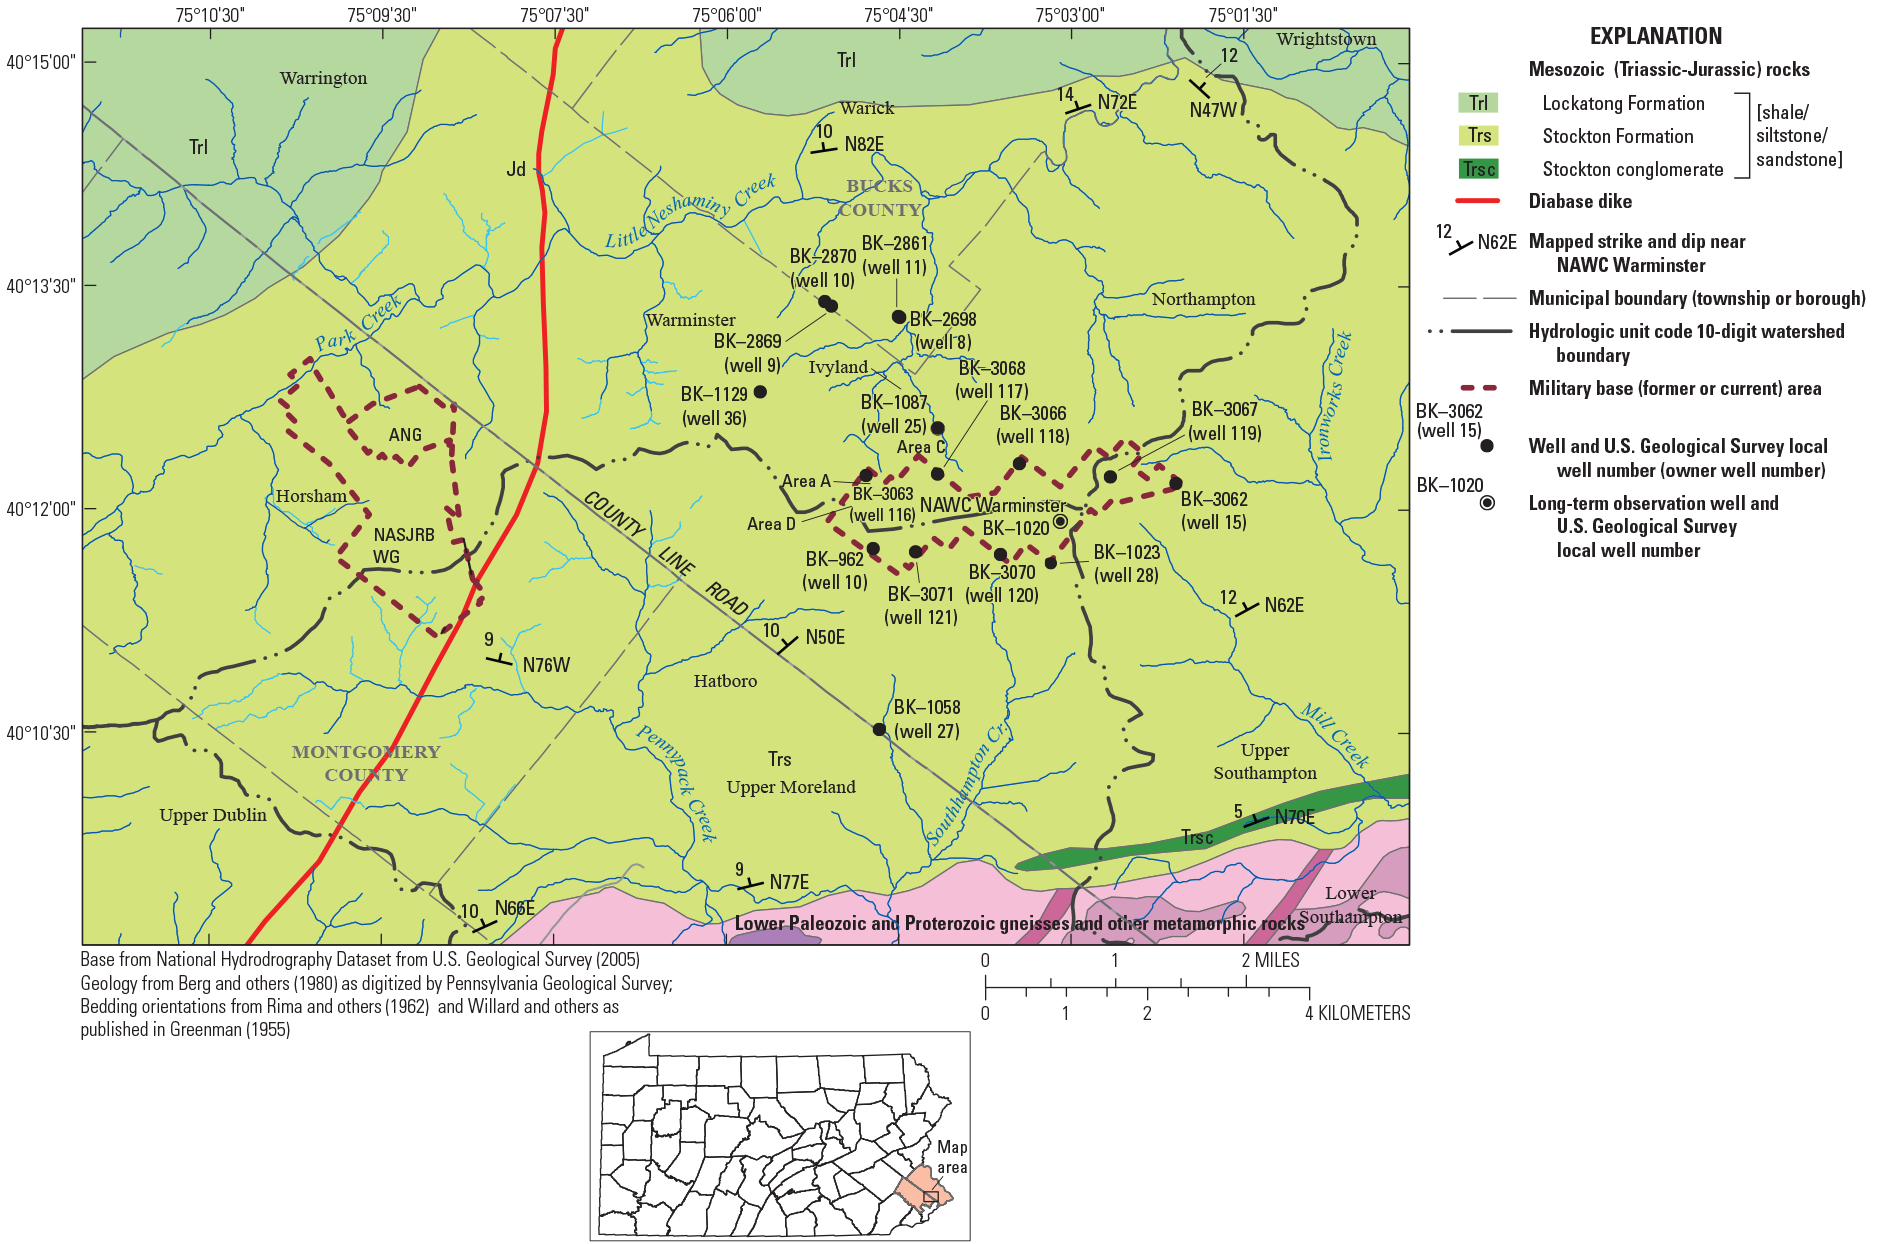
Map showing geology, including bedrock geologic units underlying study area and bedding orientations in the Stockton Formation, streams, location of wells with geophysical and video logs collected by U.S. Geological Survey near Naval Air Warfare Center (NAWC) Warminster during 2017–19, and selected U.S. Geological Survey observation wells, Bucks and Montgomery Counties, Pennsylvania. Geology from Berg and others (1980); bedding orientations from Rima and others (1962) and Willard and others and published in Greenman (1955).
Bedding within the Stockton Formation in southeastern Montgomery and Bucks Counties generally strikes northeast or east-northeast and tilts to the northwest, dipping from about 5 to 18 degrees to the northwest or north-northwest in this region, with an average dip of about 12 degrees (Rima and others, 1962) as described by Senior and others (2021). Although bedding in the Stockton Formation may be laterally discontinuous in places due to interbedding of lithologies, the beds have been mapped as oriented with the overall general northwest-dipping structure. Nearest NAWC Warminster, the mapped strike of bedding in the Stockton Formation ranges from N. 50° E. to N. 62° E. but varies away from the former base, ranging from about N. 66° E. to N. 77° E. south of NAWC Warminster close to the contact with older Paleozoic rocks and from about N. 72° E. to N. 82° E. north of NAWC Warminster near Little Neshaminy Creek (fig. 3); northwest trending strikes have been mapped in a few locations in the area, suggesting possible displacement by faults (Rima and others, 1962; Bierly and Oest, 2023). Both major and minor faults are present in the area, including the major regional Chalfont Fault about 3 mi north of NAWC Warminster (Lyttle and Epstein, 1987; Schlische, 1992), and bedding orientations in the Stockton Formation and other Triassic rocks near the study area may differ locally from regional trends where interrupted by faulting. Other bedding orientations of the Stockton Formation at and near the former NAWC Warminster as summarized by Senior and others (2021) are reported as having approximate strike ranging from N. 65° E. to N. 78° E. and dip ranging from 5 to 9° NW (Conger and Bird, 1999; Sloto and others, 1995; Sloto and others, 1998).
The Triassic sedimentary geologic units underlying the study area form leaky layered fractured-rock aquifers, with groundwater-flow pathways affected by the dipping-bed structure of the geologic units (Rima and others, 1962; Sloto and others, 1996; Risser and Bird, 2003; Senior and Goode, 1999). Depth to competent bedrock in the Stockton Formation is generally about 40 ft or less but varies depending on lithology and topographic setting (Low and others, 2002). Recharge to the fractured-rock aquifers occurs from precipitation through the overlying soil and weathered rock and groundwater flows through a network of fractures both parallel and orthogonal or at high angles to bedding, commonly resulting in apparent preferential flow and permeability in the strike direction (parallel to bedding). The high-angle fractures do not typically extend across principal lithologic contacts. Lateral and vertical changes in lithology in the Stockton Formation affect aquifer water-bearing properties, as finer-grained deposits (shales, siltstones) commonly have lower permeability than coarser-grained deposits (sandstones and conglomerates) in the formation (Rima and others, 1962; Sloto and others, 1996). In the study area, fracture openings in the Stockton Formation are partly controlled by lithology, with bedding-plane openings common at lithologic contacts between coarser and finer-grained beds and high-angle openings common in relatively massive sandstone.
Although precipitation is commonly distributed relatively evenly throughout the year, groundwater recharge varies seasonally, resulting in seasonal changes in groundwater levels and groundwater discharge to streams. Typically, lowest recharge rates occur when evapotranspiration rates are highest in late summer to fall, and highest recharge rates occur in winter to spring. For example, seasonal fluctuations in groundwater levels of about 8 ft are common in the USGS observation well BK–1020, located in the study area on NAWC Warminster (fig. 3) and in which long-term (1975–2019) daily mean depth to water is greatest in the fall months and least in the spring months (Goode and Senior, 2020). In the study area, groundwater discharges locally to pumping wells or to streams, which include the Little Neshaminy Creek, Neshaminy Creek, Pennypack Creek, and their tributaries (figs. 1 and 3). Both the former NAWC Warminster and NASJRB Willow Grove bases lie on high ground (fig. 1) that forms topographic divides between stream basins.
Methods
Methods used to characterize the vertical distribution of hydraulic properties, water quality, and PFAS concentrations in water from specific water-bearing openings in the fractured-rock aquifer included aquifer-interval-isolation tests (13 boreholes) and discrete-point sampling at selected depths (2 boreholes). For the aquifer-interval-isolation tests, herein referred to as “packer tests,” water was pumped from intervals isolated by packers and spanning one or more water-bearing openings for determination of hydraulic properties and water quality through field measurements and laboratory analyses. Hydraulic properties that can be assessed from the packer tests include hydraulic head and specific capacity of the isolated interval and information about the extent of vertical hydraulic connection among isolated intervals in the aquifer. At the two boreholes where packer tests were not done, borehole flow logging and water-quality sample collection at several depths within the open borehole were used as an alternate method to characterize the vertical variability in water quality.
Geophysical and video log data for 15 boreholes collected by USGS (Senior and others, 2021) were used to identify water-bearing fractures or openings for assessment of the vertical distribution of hydraulic properties and water quality in the aquifer, including dissolved PFAS and major ion concentrations. The log data were further used to select intervals to be tested using straddle packers (13 boreholes) or depths for collection of water samples at discrete points (2 boreholes). Additionally, selected geophysical logs commonly used to identify lithology were spatially correlated to develop hydrogeologic sections that show vertical distributions of lithologic units, hydraulic heads, and concentrations of PFAS in water samples from aquifer-interval-isolation tests.
In this report, boreholes are primarily identified using the USGS local well name, which consists of a two-character county code prefix “BK–,” followed by a sequentially assigned number, and secondarily by the owner well number (table 1). In the USGS National Water Information System database (U.S. Geological Survey, 2023), the format of the USGS site identifier (local well name) is an 8-character string (two-character county code prefix followed by two spaces followed by a right-justified sequentially assigned number); however, for simplification, the USGS local-well-name format used in this report is the two-character county code, followed by an en-dash and the sequentially assigned number.
Table 1.
Boreholes investigated by U.S. Geological Survey (USGS) using aquifer-interval-isolation (packer) tests and other vertical profiling methods and types of laboratory analyses completed on water samples collected by USGS from isolated intervals or vertical profiling of boreholes at and near the former Naval Air Warfare Center Warminster (NAWC), Bucks County, Pennsylvania, 2018–19.[Data from Senior and others (2020). Dates shown as month/date/year. USGS, U.S. Geological Survey; Br, bromide; Fe, iron; Mn, manganese; TOC, total organic carbon; PFAS, per- and polyfluoroalkyl substances; X, measured; --, no data]
Aquifer-Interval-Isolation (Packer) Tests
A pair of inflatable packers (straddle packers) were set at various depths in open boreholes to isolate selected intervals that had at least one, and commonly more than one, water-bearing fractures or openings identified from interpretation of the borehole geophysical and video logs. As noted in the “Methods” section, these aquifer-interval-isolation tests are referred to using common informal terminology as “packer tests” in this report. The number and depths of intervals tested in each open borehole were determined through an analysis of these logs to isolate main water-bearing zones using a fixed packer spacing for each borehole, and the likelihood of obtaining a seal by the packers was considered in selecting intervals. The seal of the packer against the borehole wall is critical for isolating the interval and can be affected by borehole-wall roughness or changes in borehole diameter related to presence of fractures, lithology, or drilling methods. Water-level (or hydraulic head) monitoring during packer inflation and pumping provides data on the efficacy of packer seals in isolating water-bearing intervals, vertical head gradients within the aquifer, and productivity of the isolated intervals.
Straddle-Packer Configuration and Packer-Test Interval Labeling
A set of straddle packers was used to isolate intervals in the open boreholes. Two sizes of packers were used, depending on borehole diameter. Tests of boreholes smaller than 8 inches (in.) in diameter used packers with 4.16-ft-long reinforced rubber bladders that, when inflated, each bladder is estimated to seal off about 3 to 4 ft of the borehole wall. Each packer bladder had a fixed and sliding head, with the top of the bladder being fixed. Tests of boreholes with diameters of 8 in. or larger used packers with 5.88-ft-long reinforced rubber bladders that, when inflated, each bladder is estimated to seal off about 4 to 5 ft of the borehole wall. The actual length of borehole wall sealed by a packer is largely dependent on actual borehole diameter, borehole-wall condition (roughness), and packer-inflation pressure. Because the effect of these factors on the length of bladder seal is not known for packer tests completed during the study, it was assumed that the bladders of the upper and lower packers seal completely along their length. A schematic of the straddle-packer configuration is shown in appendix 1 (fig. 1.1A), with examples of test configurations when water is pumped from above the upper packer, between the two packers, or below the upper packer (single packer inflation only) to the bottom of the borehole (fig. 1.1B).
A customized fixed packer spacing was determined for each borehole from review of geophysical and video logs to optimize isolation of important water-bearing features in a given borehole using one configuration for efficiency. The straddle packers were configured at the land surface by installing various lengths of perforated and straight 2-in. diameter steel pipe between the upper and lower packers to achieve desired spacing. The sections of perforated pipe between packers allow water from the isolated interval to be pumped up to land surface through the 2-in. steel pipe string used to suspend the straddle-packer assembly. The spacing between packers was measured from the top of the upper packer bladder to the top of the lower packer bladder at the time of straddle-packer configuration at land surface and ranged from about 21 to 37 ft. The tested open interval between packers after packer inflation in the borehole is smaller in length than the straddle-packer spacing measured during configuration at the land surface and can be estimated by assuming complete seals of the packer bladders. The estimated length of the tested interval would thus be measured from the bottom of the uninflated upper packer bladder to the top of the uninflated lower packer bladder at the time of configuration at the land surface and represents a minimum value; these estimated test-interval lengths ranged from about 16 to 33 ft, with most common lengths ranging from about 18 to 22 ft for the 2018–19 tests. The set of straddle packers was attached to, and lowered into the borehole, on the 2-in. diameter steel pipe string consisting mostly of 10-ft lengths. The depth of the packer string was determined using a measuring tape attached to the top of the upper packer (with 0 ft at the top of the upper packer bladder), and the reference measuring point for packer depths was land surface. Schedule 40 steel pipe was used for depths to about 400 ft below land surface (bls) and schedule 80 steel pipe was added to top of the pipe string for depths greater than 400 ft bls.
To obtain water levels below the lower packer during tests, 0.25 to 0.375 in. diameter nylon tubing was passed from below the lower packer to the top of the upper packer, where the tubing was connected to 1-in. diameter plastic (type was schedule-40 polyvinyl chloride [PVC]) pipe (appendix 1, fig. 1.1A). As the packer string was lowered into the borehole, additional 10-ft lengths of threaded PVC pipe were added to the PVC pipe connected to tubing from below the lower packer. After the straddle-packer assembly was lowered to the desired depths, a variable speed pump attached to 0.5-in. diameter low-density polyethylene tubing was placed in the 2-in. diameter central drop pipe to depths of about 100 ft below the static water level. Additionally, vented pressure transducers with automatic atmospheric pressure compensation were installed on cables in the borehole annulus, central 2-in. steel pipe, and 1-in. PVC pipe to measure water levels above, within, and below the isolated interval by packers, respectively, as discussed in the “Groundwater Levels and Pumping Rates” section of this report. Upper and lower packers were inflated separately through nylon tubing using compressed industrial nitrogen gas to pressures calculated for specific packers to account for packer depths and ambient water levels; packer-inflation pressures were adjusted as needed to provide adequate seals of each packer.
Tests of isolated intervals within a borehole were identified using a field name that included the range in depths of the straddle packer spacing (referenced to tops of the upper and lower packer bladders) measured during configuration at the land surface and were assigned a zone number, with zone 1 being the shallowest interval tested and the zone number increasing in magnitude with depth. Depth to the tops of the packer bladders could be directly known or measured as the bladders are fixed at the top, whereas depths to the bottom of bladders can only be estimated as the bottom of bladders have sliding heads and change (decrease) as packers are inflated. The field nomenclature for depths of packer spacing is retained for names of the tests throughout this report, including appendix 1, to provide a cross reference that is consistent with previously published data for the packer tests (Senior and others, 2020). Test names are noted by quotation marks (such as “80–100 ft”) to differentiate from test-interval depths that assume complete bladder seals and account for bladder lengths. Tabulated results for tested isolated intervals include the depths of tested interval (adjusted for bladder seals) in addition to the depths of packer spacing used in test names.
For tests that involve packer inflation of both packer bladders, the depths to the top and bottom of the tested interval are given as depths to the bottom of the uninflated upper packer bladder and top of the uninflated lower packer bladder, respectively. The depths of the actual tested interval between inflated packers may differ slightly from values computed from top or bottom of uninflated bladders because packers may not seal completely along their length and the bottom of each packer has a sliding head. In tests of shallowest intervals (commonly zone 1), for which only the upper packer is inflated and water is pumped from the borehole annulus above the upper packer, the depth to the interval top is given as depth to bottom of casing or, if water level is below the bottom of casing, depth to the static water level in an open borehole and the depth to the interval bottom is given as the top of the upper packer bladder. In tests of deepest intervals, for which only the upper packer is inflated, and water is pumped from below the upper packer, depths in the test name refer to depths to top of upper packer bladder and bottom of the borehole, respectively; the top and bottom depths of the actual tested interval can be estimated as the depths of the bottom of upper packer bladder and bottom of the borehole, respectively.
For some wells, some intervals identified for testing from a preliminary review of logs and assigned a zone number were not tested after further review indicated low probability of productive water-bearing fractures in the interval, and therefore these zones are not included in summary tables of aquifer-interval-isolation tests for wells. In a few wells, additional intervals were selected for testing after preliminary review of logs and numbering, and these additional intervals are identified by a number of the next shallower zone followed by the suffix “A” (for example, zone 6A is deeper than zone 6 but shallower than zone 7).
Groundwater Levels and Pumping Rates
Water levels above, within, and below the tested isolated interval were measured before packer inflation using calibrated electric tapes from measuring points established to determine water levels below land surface as a common reference. Pressure transducers were installed to measure water levels above, within, and below the tested isolated interval referenced as depths below land surface, with initial values determined by electric tape measurement. A data logger was used to continuously record water levels measured by pressure transducers (with automatic atmospheric pressure compensation) above, within, and below the isolated interval during the tests, which included periods before and after packer inflation as well as before, during, and after pumping. Typically, the data logger was programmed to measure water levels every 12 seconds in the tested interval but only to record water levels measured by all transducers when water levels within the tested isolated interval changed by at least 0.02 ft, or if that water-level change was less than 0.02 ft, at a fixed time interval of 1 to 5 minutes. Water levels were measured using calibrated electric tapes from established measuring points after packer inflation and periodically throughout the test to verify water levels measured by transducers.
The packer seal and hydraulic connections between isolated intervals were evaluated following packer inflation. Hydraulic head separation (difference in water levels) after packer inflation indicated little or no hydraulic connection between isolated intervals and the presence of vertical gradients. Conversely, little or no head separation after packer inflation indicated a hydraulic connection between isolated intervals that may be caused by an incomplete packer seal, hydraulic connection through fractures outside the borehole, and (or) absence of substantial ambient vertical gradients at the time of the test. Typically, water levels stabilized more rapidly in intervals that were more productive (had higher specific capacity) than in intervals that were less productive (had lower specific capacity).
Pumping was started when water levels stabilized after packer inflation, indicated by water level changes of less than 0.02 ft in the isolated interval over 5 to 10 minutes and commonly about 10 to 20 minutes after the second packer was inflated. Pumping rates greater than about 0.5 gallons per minute (gal/min) were measured using a plumbed in-line flow meter with the discharge pipe. Pumping rates less than the flow meter’s lowest range of about 0.5 gal/min were measured manually by determining the time to fill a fixed volume (stopwatch and calibrated bucket). The variable speed pump used for the tests had a pumping range from about 0.5 to about 5 gal/min. Pumping rate and duration were dependent on aquifer properties. For each test, attempts were made to maintain a constant pumping rate that would result in a steady drawdown of the water level in the isolated interval. Pumping duration was typically 1 to 2 hours for each test to withdraw at least three volumes of water from the isolated interval. The duration of pumping and amount of water withdrawn from isolated intervals before sample collection is listed by borehole in appendix 1. All water-level data collected during the packer tests are available from Senior and others (2020).
The extent of hydraulic connection between the tested isolated interval and the adjacent sections of the borehole above and below the straddle packer is further indicated by the extent of head separation and response to pumping. Changes in water levels measured above, between, and below the straddle packer after packer inflation but before pumping reflect differences in head in those strata of the aquifer; the magnitude of these vertical gradients may be partly related to the extent of vertical hydraulic connections. A noted water level decline in adjacent sections of the borehole in response to pumping stress in the tested isolated interval generally indicated a hydraulic connection between the isolated and adjacent borehole intervals, and no changes in response to pumping stress indicated low, or no, hydraulic connection between the isolated and adjacent borehole intervals.
Specific capacity for the isolated interval was calculated as the average pumping rate divided by the drawdown, where drawdown was determined by subtracting water levels measured during pumping just before sample collection from stabilized water levels after packer inflation. For pumping tests of isolated intervals that had drawdown in adjacent borehole intervals, drawdown is less (and apparent specific capacity is higher) in the tested interval due to hydraulic connections with adjacent parts of the borehole; for these tests, the resulting specific capacity should be interpreted with caution because the value represents productivity from parts of the borehole and (or) aquifer other than the isolated interval.
Field Water Quality, Water Sample Collection, and Laboratory Analysis of Water Samples
USGS collected water samples for laboratory analysis and measured field water quality following standard procedures (U.S. Geological Survey, 2008; U.S. Geological Survey, 2018). The temperature and chemical properties (pH, specific conductance, dissolved oxygen concentration) of borehole discharge were measured periodically during pumping using a temperature-compensated multi-parameter water-quality sonde. The sonde was immersed in an overflowing vessel, continuously supplied by pumped water to serve as a flow-through cell. After a minimum of three test-interval volumes of borehole water were pumped and the water temperature and chemical properties stabilized, water samples were collected for PFAS and other water quality (major ions) analyses. Field measurements of pH, specific conductance, temperature, and dissolved oxygen concentration were recorded just before sample collection. Less than three volumes were pumped for a few intervals before sampling (app. 1) because of low yields, large volumes, and (or) time constraints.
The water samples for laboratory analysis (table 1) were collected from a sampling port and silicone tubing connected to the pump discharge line and metal plumbing. Battelle, the Navy’s groundwater remediation contractor, provided two 125-milliliter high-density polyethylene bottles to collect unfiltered samples from each isolated interval for PFAS analysis. Filtered (0.45 micron in-line filter) water samples for dissolved major ion and nutrient analysis were collected in high-density polyethylene bottles, and unfiltered samples for total organic carbon and stable isotopes of water analysis were collected in glass bottles. All samples, except stable isotope samples, were kept chilled after sample collection and during shipment to laboratories.
PFAS were analyzed by Battelle, using EPA method 537 for samples collected in 2018 (U.S. Department of Defense and U.S. Department of Energy, 2017) and using Department of Defense and Department of Energy Quality Systems Manual Section 5.3, table B-15 method (U.S. Department of Defense and U.S. Department of Energy, 2018) for samples collected in 2019 (Battelle Memorial Institute, written commun., 2021). Major ions, nutrients, and total organic carbon were analyzed at the USGS National Water Quality Laboratory (NWQL) in Lakewood, Colorado. Stable isotopes of water (hydrogen and oxygen) were analyzed at the USGS Stable Isotope Laboratory in Reston, Virginia. The isotopic composition of water is reported in terms of the difference or delta(δ) of the ratio of hydrogen-2 (2H) to hydrogen-1 (1H) (difference in ratio abbreviated as δ 2H) and of the ratio of oxygen-18 (18O) to oxygen-16 (16O) (difference in ratio abbreviated as δ 18O) relative to isotopic composition of Vienna Standard Mean Ocean Water (VSMOW).
Evaluation of analytical accuracy for PFAS was based on results for field duplicates and spiked field duplicates, which indicated percent differences of less than 20 percent for concentrations in field duplicates relative to mean of duplicate values (Battelle Memorial Institute, written commun., 2023). Comparison of the sum of cations computed as milliequivalents per liter (meq/L) to the sum of anions computed in meq/L (charge balance) can be used to determine accuracy and completeness of analyses for major ions. Overall, the difference in cation-anion balance for 88 of 97 samples (90 percent) was less than 6 percent (positive or negative), an indicator of accuracy of the major ion analyses; the difference in cation-anion balance for 2 of 97 samples was greater than 10 percent (11.3 and 13.2, respectively), and these samples did not have analyses for nitrate, which may have increased the computed positive cation bias (sum of cations in meq/L is greater than sum of anions in meq/L). Complete results of laboratory analysis and field water quality, including computed cation-anion balance, for water samples are listed in appendix 2 of the packer-test data release (Senior and others, 2021).
After each interval test, the pump was cleaned by pumping at least 3 liters (L) of soapy tap water through the pump, followed by pumping at least 3 L of tap water and then by pumping another 3 L of deionized PFAS-free water from the local USGS laboratory in Downingtown, Pennsylvania to rinse the pump. Equipment-blank quality-control samples were collected periodically after pump cleaning by pumping laboratory-certified PFAS-free water into sample bottles for analysis. A few PFAS compounds were detected at low concentrations in one equipment blank (Battelle Memorial Institute, written commun., 2023). New pump tubing was used for each test. Downhole equipment, including the straddle-packer assembly, 2-in. diameter steel drop pipe, and 1-in. diameter PVC pipe was cleaned with dilute soapy water, followed by tap water rinses between tests of each borehole.
Alternate Vertical Profiling using Discrete-Point Sampling at Selected Depths
An alternate vertical profiling approach was used in two boreholes to characterize water quality of water-producing features (fractures or other discrete openings) because of restrictive well conditions and (or) access issues. Discrete-point samples were collected at selected depths between water-producing features under ambient conditions (non-pumping) or pumping conditions, with known (measured) vertical borehole flow. The concentrations of dissolved constituents in the point samples collected in the open borehole can be used, with measured borehole flow rates, to estimate the contribution of constituents (such as contaminants of concern) from individual water-bearing zones. The general approach or principles of this method, although modified for this study to sample under ambient borehole flow conditions, is briefly described by Izbicki (2004) and Izbicki and others (1999). Using the relation for conservation of vertical mass flux of dissolved constituents,
where Ci is concentration and Vi is volumetric water flux at depth i, and both concentrations and volumetric flux are measured at point depths 1 and 2 with the direction of increasing volumetric flux (vertical borehole flow) from point 1 to point 2.
Assuming vertical conservative transport of the dissolved chemical constituent of interest in the borehole, the unknown volume-weighted mean concentrations (Cu2-1) in inflow water from fractures between point depths 1 and 2 is thus calculated as follows,
For the alternate vertical profiling, a two-liter stainless-steel discrete-point sampler was lowered to the point depth of interest, activated to open, allowed to fill, closed, and then raised to the surface for subsequent transfer of water sample into bottles for laboratory analysis. The specific conductance and pH of this grab sample were also measured at the time of sample collection. The discrete-point-depth samples were analyzed for selected constituents (table 1) by methods and laboratories described in the “Field Water Quality, Water Sample Collection, and Laboratory Analysis of Water Samples” section of this report. The discrete-point sampler was cleaned between collection of different discrete-point-depth samples using sequential rinses with soapy tap water, tap water, and lastly, with deionized PFAS-free water from the local USGS laboratory in Downingtown, Pennsylvania.
Interpretation of Water Quality
Major ion concentrations were used to characterize water quality of samples from isolated intervals and discrete depths by type. In the trilinear Piper diagrams (Piper, 1944) for samples from these intervals or discrete depths, the water composition or type is characterized by the relative contribution of the cations, including calcium (Ca2+), magnesium (Mg2+), sodium (Na+), and potassium (K+); and the anions, including bicarbonate (HCO3-), chloride (Cl-), and sulfate (SO42-). However, at the pH values measured in water samples (pH ranged from 5.4 to 8.1 and was less than 8.0 in 97 percent or 102 of 105 sample values [Senior and others, 2020]), carbonate (CO32-) concentrations were considered negligible and were assumed to be zero in plotting the water compositions. Therefore, the piper diagrams for water samples collected as part of this investigation do not include the carbonate ion (CO32-). The compositional fields for four main types of water defined by ions representing more than 50 percent of the cations or anions present (expressed as milliequivalents) include calcium magnesium bicarbonate, sodium bicarbonate, sodium chloride sulfate, and calcium magnesium chloride sulfate (fig. 4). Although nitrate may be an important anion in some waters, nitrate concentrations were relatively low compared to concentrations of other anions in samples with nitrate analyses, representing less than 2 percent of anion milliequivalents, and were not included in compositions shown on the Piper diagrams for water samples from isolated intervals or discrete depths.
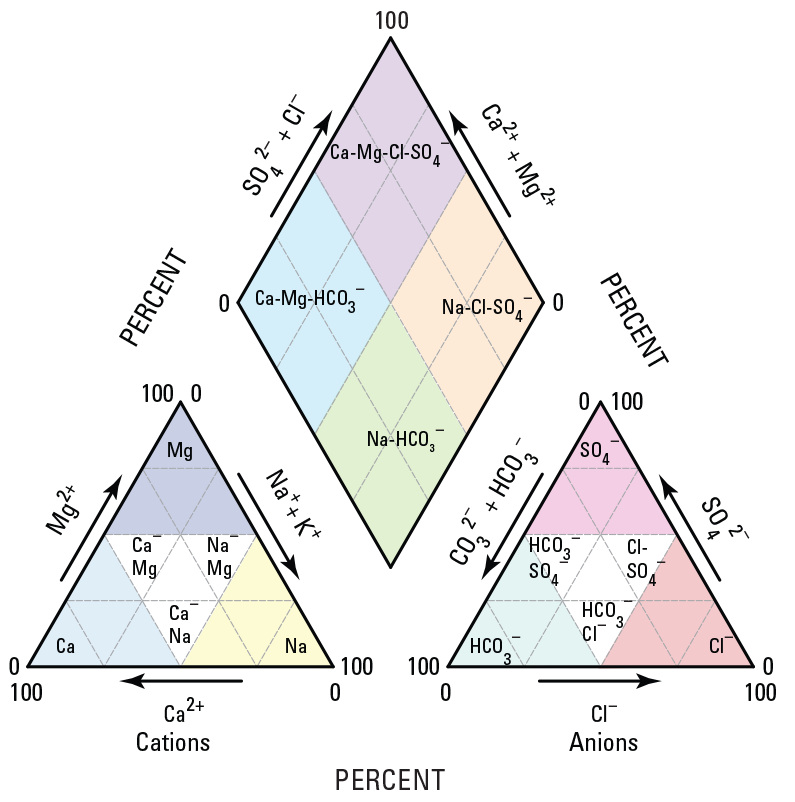
Piper diagram showing generalized water compositions or types defined by ions, representing more than 50 percent of the cations or anions (in milliequivalents) present in shaded areas and water compositions with no predominant ions in unshaded areas. Cations include calcium (Ca2+), magnesium (Mg2+), and sodium (Na+) plus potassium (K+), and anions include bicarbonate (HCO3-), chloride (Cl-), and sulfate (SO42-). Carbonate (CO32-), was assumed to be negligible (zero) for this investigation, given that pH values of water samples were less than 8.1 (Senior and others, 2020).
Geophysical Logs Used for Interval Selection and Lithologic Correlation
Geophysical and borehole video logs collected and evaluated by USGS during 2017–19 to identify probable water-bearing fractures (Senior and others, 2021) for packer tests, lithologic correlations, and other borehole characteristics include those listed in table 2. Selected results of packer tests in this report are depicted on borehole geophysical log figures from Senior and others (2021), which use borehole geophysical log abbreviations listed in table 2. The orientations of selected features interpreted as water-bearing fractures are depicted as tadpole plots on the log figures, where the tadpole head (dot) indicates magnitude of dip and tail indicates direction (azimuth) of dip. For lithologic log correlation at and near the former NAWC Warminster, borehole geophysical logs collected by USGS during 2017–19 (Senior and others, 2021) to support the current investigation of PFAS and previously during 1994–98 for selected boreholes were compiled. Geophysical logs used for lithologic correlation include natural gamma, single-point resistance and normal and induction electric logs. Some of the logs collected by USGS during 1994–98 were described in previous reports (Sloto, 1997; Sloto and Grazul, 1998; Sloto, 2008). Archived digital data for geophysical logs collected by USGS presented in this report are available from the USGS Geolog Locator (U.S. Geological Survey, 2020).
Table 2.
Geophysical logs, reporting units, and abbreviations or symbols for logs collected by U.S. Geological Survey at and near the former Naval Air Warfare Center Warminster, Bucks County, Pennsylvania, 2017–19.[Modified from Senior and others (2021); EM, electromagnetic; N, normal; --, no data or none]
Results of Aquifer-Interval-Isolation Tests and Alternate Vertical Profiling
The objectives of the packer tests in boreholes at and near the former NAWC Warminster were to (1) provide information on hydraulic heads and specific capacities of discrete vertical intervals, as well as the hydraulic connections between intervals, and (2) provide water samples from water-bearing features within those intervals to characterize the vertical extent of PFAS contamination and possible relation of PFAS concentrations to water quality, such as concentrations of major ions. The objectives of the alternate vertical profiling in wells that could not be tested using packers because of site conditions were to (1) identify major water-bearing intervals and (2) determine PFAS concentrations in water from the producing fractures within those intervals.
Packer tests or alternate vertical profiling methods (discrete-point-depth sampling) were performed in 15 boreholes located near suspected sources of PFAS or in areas where transport of contamination potentially affected groundwater during 2018–19 (fig. 1; table 3). Water-bearing features suitable for packer testing or alternate vertical profiling were identified using geophysical logs of the boreholes (Senior and others, 2020). Six of the 15 boreholes were drilled to depths of 400 to 600 ft below land surface (bls) during 2018 by Navy contractors for subsequent use as monitor wells on the former NAWC Warminster and identified by the Navy with the prefix “HN–” followed by a sequentially assigned number. The other boreholes were unused former production or unused test wells ranging in depth from 160 to 604 ft bls at or near the base (fig. 1; table 3). The six boreholes drilled in 2018 were drilled to depths in the aquifer where the vertical extent of contamination was unknown and to depths similar to those of nearby public supply wells. Because open boreholes can act as vertical conduits between discrete water-bearing zones, the extent of flow from one water-bearing zone to another may be partly related to the duration of open-borehole conditions and should be considered in the interpretation of packer-test results. The six wells drilled in 2018 were generally logged and packer tested within weeks of drilling, whereas the other nine wells (table 3) were open for years before logging and packer testing or alternate vertical profiling.
Table 3.
Identifiers, location, and selected physical characteristics of boreholes investigated by the U.S. Geological Survey (USGS) to determine hydraulic properties and water quality at and near the former Naval Air Warfare Center Warminster, Bucks County, Pennsylvania, 2018–19.[Data from Senior and others (2021) and Battelle (2023). U.S. Geological Survey (USGS) collected data on the vertical distribution of hydraulic properties and water quality using aquifer-interval-isolation (packer) tests or alternate vertical profiling methods in boreholes. Latitudes and longitudes of U.S. Geological Survey (USGS) wells are listed in decimal degrees, minutes, and seconds. USGS, U.S. Geological Survey; ddmmss.s, degrees minutes seconds; NAVD 88, North American Vertical Datum of 1988; ft, foot; bls, below land surface; in., inch; --, no data]
Hydraulic and Chemical Results for Isolated Intervals in Individual Boreholes
The USGS performed a total of 109 packer tests and collected 98 samples from isolated intervals in 13 boreholes and collected 9 discrete-point samples at selected depths for alternate vertical profiling in 2 open boreholes (table 4) during 2018–19. Eleven of the 109 tested isolated intervals were very low yielding and were not sampled. The number of tested intervals isolated by packers in each borehole was commonly related to borehole depth, ranging from 3 intervals within a 160-ft well to 14 intervals within a 600-ft borehole. The straddle-packer spacing (top of upper packer to top of lower packer) ranged from about 21 to 37 ft, and the length of tested intervals between packers after inflation (estimated by assuming complete seals along inflated packer bladders) ranged from about 16 to 33 ft (table 4). Each tested interval isolated by packers includes one or more discrete water-bearing fractures. Hydraulic head, specific capacity, and water-quality data for each isolated interval are presented in the following sections for individual boreholes.
The test name of each isolated interval discussed for individual boreholes includes a zone number starting at the shallowest interval tested and is referenced to depths to top of upper and lower packer bladders, except for tests of the shallowest and deepest intervals for which only one packer bladder is inflated. The reference in test names to depths to top of upper and lower packer bladders was a convention used for field configurations of packer spacing and in the data release (Senior and others, 2020), which documents water levels and pumping rates of the 2018–19 packer tests. The actual length and depths of the tested interval differs from the field packer spacing used in test names because inflation of the upper-packer bladder seals about 4 to 6 ft of the borehole. Additional description of how test-interval lengths and depths were estimated to account for bladder seals after inflation is provided in the “Methods” section. Tabulated results for the packer tests include the depths of estimated actual tested interval (adjusted for bladder seals after packer inflation) in addition to the depths of packer spacing used in test names.
Table 4.
Dates and other characteristics of geophysical logs and packer tests and total specific capacity of boreholes investigated by the U.S. Geological Survey (USGS) to determine hydraulic properties and water quality at and near the former Naval Air Warfare Center Warminster, Bucks County, Pennsylvania, 2018–19.[Logging data, including ambient depth to water in open hole, from Senior and others (2021). U.S. Geological Survey (USGS) collected data on the vertical distribution of hydraulic properties and water quality using aquifer-interval-isolation (packer) tests or alternate vertical profiling methods in boreholes. Straddle-packer spacing refers to distance between top of bladders of upper and lower packer, respectively, and the estimated length of tested interval between packers refers to distance from the bottom of the upper packer bladder to the top of the lower packer bladder. Dates shown as month/date/year. USGS, U.S. Geological Survey; ft, foot; NAVD 88, North American Vertical Datum of 1988; bls, below land surface; in., inch; gpm/ft, gallons per minute per foot; <, less than; --, no data]
The hydraulic heads in isolated intervals are inferred from water levels that had stabilized (changing less than 0.2 ft in 5 minutes) after packer inflation. Typically, water levels in relatively productive intervals stabilized more quickly than in less productive intervals, and in some tests, water levels in the isolated zone had not fully stabilized. Detailed information about water levels above, within, and below the interval isolated by straddle packers during the tests (including periods before and after packer inflation, before start of pumping, from start to end of pumping through recovery, and after packer deflation) are provided in tables for packer tests of each borehole with brief discussion in appendix 1 and are available as published data, plots, and summary tables for all tests in a USGS data release (Senior and others, 2020).
Water levels for most tests indicate good packer seals and little to no hydraulic connection between the isolated and adjacent intervals of the borehole, with drawdown in adjacent intervals typically less than about 1 to 5 percent of drawdown in the pumped isolated interval. However, water levels for some tests indicate hydraulic connection between the tested isolated interval, when pumped, and one or more adjacent intervals (above or below); for these tested intervals, hydraulic connection may be outside of, or inside, the borehole, and estimates of specific capacity will be higher, and represent water-bearing properties of aquifer intervals greater in length than that of the isolated interval between packers. The extent of hydraulic connection between the isolated and vertically adjacent intervals should be considered in the interpretation of both hydraulic properties and chemical characteristics. Hydraulic connections between parts of the borehole separated by packers that likely resulted in reduced drawdown in the pumped isolated interval were indicated by measured water levels in packer tests of some intervals in several boreholes (including tests of boreholes BK–962 [NAWC 10; zones 3, 4, and 5], BK–2861 [well 11; zones 1, 2, and 3], BK–2869 [well 9; zone 4)], BK–3062 [well 15; zones 1 and 2], BK–3068 [HN–117; zone 2], and BK–3070 [HN–120D; zone 1]) as shown in appendix 1 and the data release by Senior and others (2020).
The relative productivity of each borehole, as estimated by specific capacity calculated from drawdown and pumping-rate data collected during geophysical logging or packer testing, ranged widely from less than 0.01 to 40 (gal/min)/ft for individual intervals (fig. 5; appendix 1) and from 0.07 to 41.9 (gal/min)/ft for sum of interval values within a given borehole (table 4). For most boreholes, the sum of specific-capacity values estimated from tests of isolated intervals in each borehole was similar in magnitude to, or slightly greater than, the specific capacity estimated from pumping that open borehole at low rates (commonly about 1 to 2 gal/min) during geophysical logging (table 4), indicating that most productive intervals of each borehole were included in the packer tests. Of the six boreholes drilled in 2018, summed specific capacities were greatest for BK–3071 (HN–121) and BK–3063 (HN–116) and least for BK–3067 (HN–119) and BK–3066 (HN–118) (table 4). Of the existing former production or test wells included in packer testing, summed specific capacities were greatest for BK–962 (NAWC 10) and least for BK–1023 (well 28) and BK–1087 (well 25) (table 4), both of which were test wells never put into production.
The vertical distribution of specific capacity as depicted in a plot of specific capacity in relation to the mid-point depth of isolated intervals shows relatively high values (greater than 1 [gal/min]/ft) were measured both in shallow (less than 200 ft bls) and deep (400–600 ft bls) aquifer intervals (fig. 5). The highest [up to 40 (gal/min)/ft], and largest range of (more than 4 orders of magnitude), specific-capacity values were measured in tested intervals at depths less than 200 ft bls. For tested intervals deeper than 200 ft bls, intervals from 400 to 600 ft bls had higher, and a larger range of, specific-capacity values compared to intervals from 200 to 400 ft bls, which had mostly specific-capacity values less than 0.1 (gal/min)/ft (fig. 5). These data indicate a heterogeneous distribution of aquifer hydraulic conductivity with depth, with specific capacity values in the deepest intervals of 400 to 600 ft bls similar to all but the highest values in the shallowest intervals of less than 200 ft bls. These relatively high specific capacity values at depths of 400 to 600 ft bls in the boreholes characterized for this study are consistent with some reported water-bearing fractures at similar depths and the occurrence of production wells drilled to depths of 500 to 600 ft bls in the area (Sloto and others, 1995; Sloto and others, 1996; Sloto, 1997; Bird, 1998).
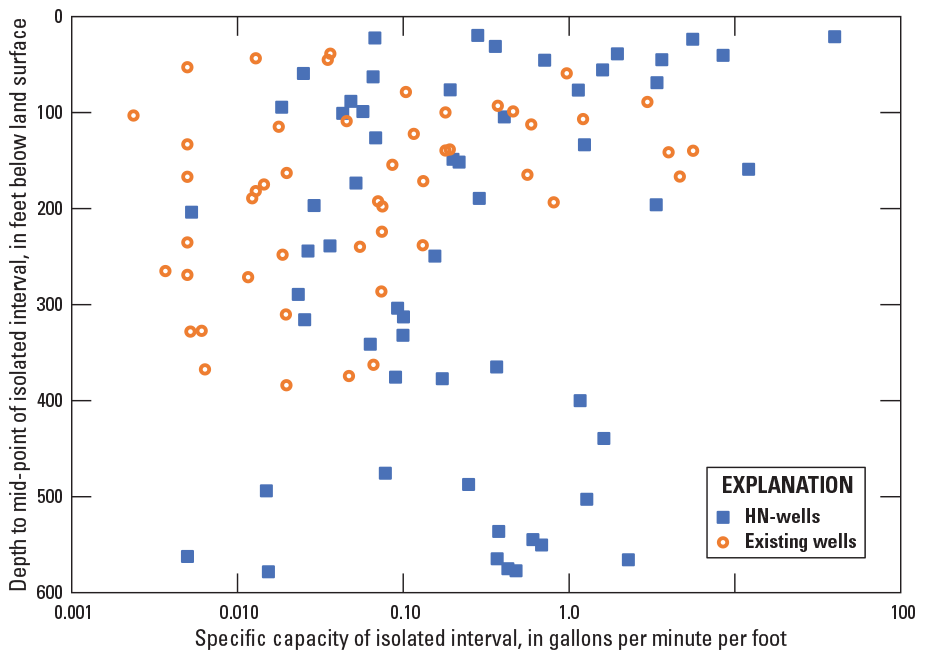
Scatterplot showing specific capacity determined from packer tests of 106 isolated intervals in relation to interval mid-point depth in 6 deep boreholes drilled in 2018 and 7 existing boreholes at and near the former Naval Air Warfare Center Warminster, Bucks County, Pennsylvania, 2018–19.
Summary statistics for chemical constituents measured in the field and laboratory for water samples from isolated intervals show that many (80 percent) samples had pH near neutral (6.5–7.7), about half had low dissolved oxygen concentrations (less than 1 milligrams per liter [mg/L]) and low dissolved nitrate concentrations (less than 1.4 mg/L as nitrogen [N]), and most (more than 90 percent) samples had chloride concentrations greater than 10 mg/L, which is about, or somewhat above, the natural background chloride level in groundwater as estimated from nearby studies (Sloto and Davis, 1983; Senior, 1996) (table 5). If precipitation were the primary source of chloride, and net recharge concentrations were about twice that in precipitation (National Atmospheric Deposition Program, 2023) due to evaporation, natural background chloride concentrations in groundwater could be as low as about 1 mg/L. The types of laboratory analyses completed on water samples slightly varied by borehole, with samples from all boreholes being analyzed for PFAS and stable isotopes of water, samples from most of the boreholes (13 of 15) being analyzed for major ions, and samples from about half of the boreholes (8 of 15) being analyzed for nutrients.
Table 5.
Summary statistics for water-quality field measurements and results of laboratory analyses of water samples collected from isolated intervals or at discrete depths in 15 boreholes at and near the former Naval Air Warfare Center Warminster, Bucks County, Pennsylvania, 2018–19.[Perfluorooctanesulfonic acid (PFOS) and perfluorooctanoic acid (PFOA) data from Battelle (2021). Types of laboratory analyses completed for samples from boreholes summarized in table 1. USGS collected data of water-quality measurements, and performed laboratory analyses of water samples, from isolated intervals or at discrete depths in 15 boreholes. Type: U, unfiltered; F filtered. mg/L, milligrams per liter; <, less than; std., standard; µS/cm, microsiemens per centimeter; °C, degree Celsius; CaCO3, calcium carbonate; SiO2, silicon dioxide; N, nitrogen; P, phosphorus; µg/L, micrograms per liter; δ 2H, delta of hydrogen-2 to hydrogen-1 ratio relative to Vienna Standard Mean Ocean Water standard; δ 18O, delta of oxygen-18 to oxygen-16 ratio relative to Vienna Standard Mean Ocean Water standard; per mil, parts per thousand; ng/L, nanograms per liter; PFOS, perfluorooctanesulfonic acid; PFOA, perfluorooctanoic acid; --, dimensionless; meq/L, milliequivalents per liter; (gal/min)/ft, gallons per minute per foot]
Chloride concentrations above the estimated upper natural background concentration of about 10 mg/L in groundwater in the study area indicate some type of anthropogenic source of chloride, possibly including deicing salt (sodium or calcium chloride) or a degradation by-product of a halogenated VOC, such as TCE. The observed molar ratios of chloride to sodium, which can be used to assess if sodium chloride (common rock salt, typically used for road deicing) with a chloride (Cl) to sodium (Na) molar ratio of 1.0 is a predominant source of chloride, were greater than 1 in more than half of the samples (table 5), indicating that some chloride is likely derived from sources other than sodium chloride.
Nitrate concentrations above about 1.0 mg/L as N (estimated natural background levels estimated in the study area from precipitation data [National Atmospheric Deposition Program, 2023]) can indicate anthropogenic sources of nitrogen, including fertilizer and residential wastewater. Some constituents may be partly or wholly derived from dissolution of minerals within the aquifer, such as calcite (CaCO3), dolomite [CaMg(CO3)2], orthoclase or potassium feldspar (KAlSi3O8), albite or sodium feldspar (NaAlSi3O8), and quartz (SiO2), all of which are reported to be present in the Stockton Formation (Sloto and others, 1996; El Tabakh and Schreiber, 1998). Although these minerals may be present in the Stockton Formation, detailed discussion of geochemical reactions in the aquifer is beyond the scope of this report. Complete results of USGS laboratory analysis and field water quality for water samples are included in the USGS data release by Senior and others (2020) and are stored in the publicly available USGS National Water Information System database (U.S. Geological Survey, 2023).
The major ion composition of water samples from isolated intervals is presented in Piper diagrams in the following sections for each borehole as described in the “Methods” section of this report, with different symbols for various ranges of summed PFOS and PFOA concentrations. The Piper diagrams, in conjunction with observed concentrations, can be used to evaluate similarities and differences in water composition, reflecting constituents from natural sources (such as mineral dissolution) and anthropogenic sources (such as contaminants entering recharge from the land surface), and show any relation between summed PFOS and PFOA concentrations and water types (fig. 4). For example, dissolution of the minerals calcite and dolomite may result in calcium-magnesium-bicarbonate type water, and dissolution of gypsum (CaSO4) may contribute to a calcium magnesium-sulfate type water. Contributions of chloride above estimated natural background concentrations of about 10 mg/L may shift the overall water composition toward sodium-chloride-sulfate or calcium-magnesium-chloride-sulfate type water and indicate effects on water quality from anthropogenic sources of chloride as was described for nearby wells in the Stockton Formation (Sloto and others, 1996). Relatively higher summed PFOA and PFOS concentrations generally were associated with relatively higher chloride concentrations in samples from isolated intervals during 2018–19 packer tests performed by the USGS in 3 of 6 deep boreholes drilled in 2018 and in 6 of 7 existing boreholes drilled before 2017 at and near the former NAWC Warminster (figs. 6A and 6B).
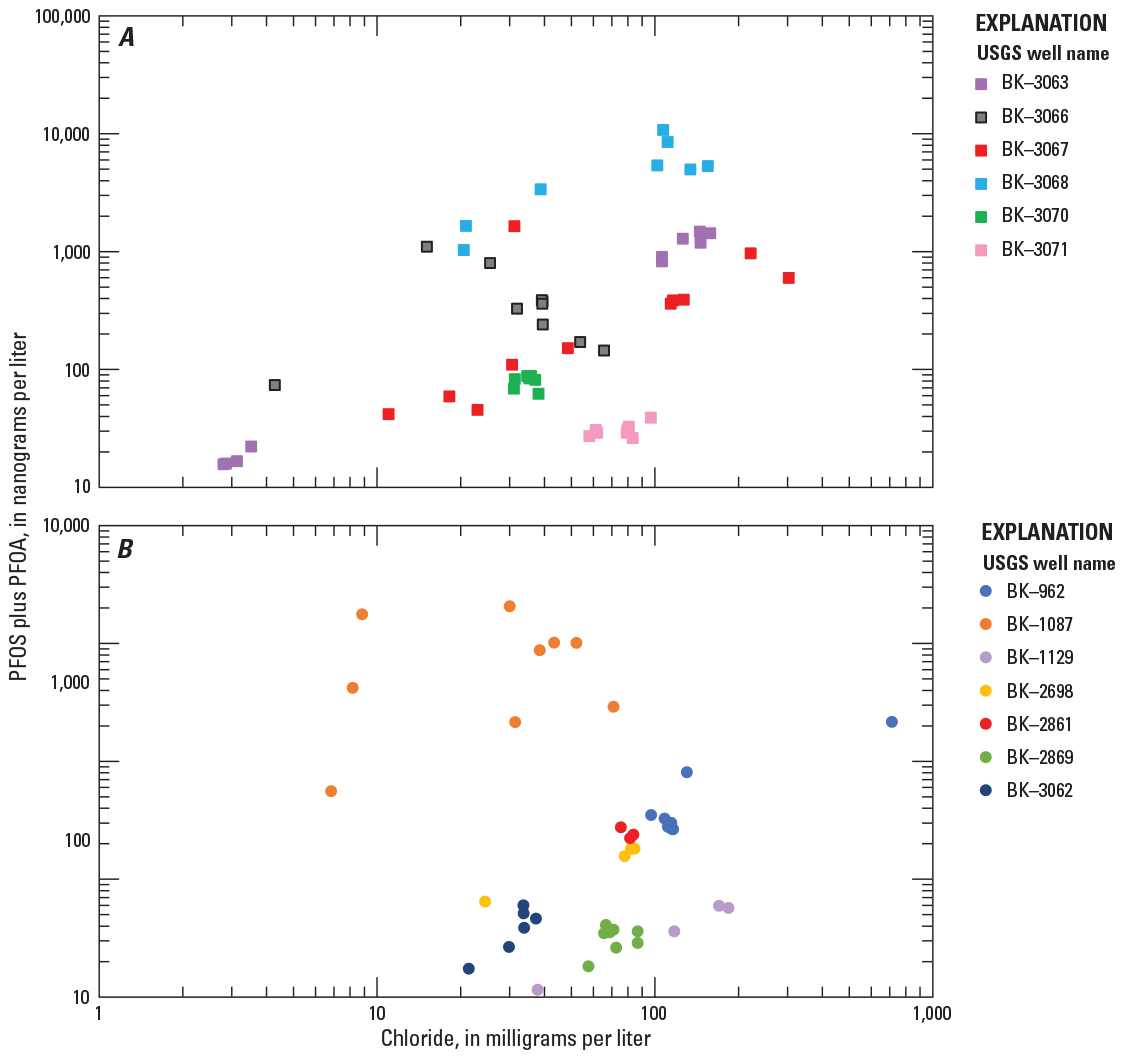

Scatterplot showing summed perfluorooctanesulfonic acid (PFOS) and perfluorooctanoic acid (PFOA) concentrations in water samples from isolated intervals during packer tests or other vertical profiling performed by the U.S. Geological Survey in relation to A, chloride concentrations for 6 deep boreholes drilled in 2018 and B, chloride concentrations for 7 existing boreholes drilled before 2017, and C, PFOA to PFOA mass ratio for 15 boreholes, at and near the former Naval Air Warfare Center (NAWC) Warminster, Bucks County, Pennsylvania, 2018–19. A lifetime health advisory (LHA) not to exceed 70 nanograms per liter (ng/L) for summed concentrations of PFOS and PFOA was established by U.S. Environmental Protection Agency established in 2016 (U.S. Environmental Protection Agency, 2016).
PFOS concentrations were greater than PFOA concentrations in more than half of the samples (table 5), and the PFOS to PFOA mass ratio was generally greater than 1.0 in samples with summed PFOA and PFOS concentrations greater than the LHA of 70 ng/L (fig. 6C). These mass ratios differed among boreholes and may be a characteristic that can be used to identify different PFAS source areas.
The isotopic composition of water can be used to provide information about recharge conditions and flow paths of water sampled from isolated intervals. Water samples with different isotopic compositions represent different recharge conditions related to temporal variability of the isotopic composition of precipitation. Water samples with similar isotopic compositions may indicate similar recharge conditions but may also indicate some intraborehole mixing of water from producing (inflow) zones to receiving (outflow) zones in the open boreholes. The isotopic composition of water from the isolated intervals falls largely along the local meteoric water line estimated from river samples (Kendall and Coplen, 2001), bounded mostly by the estimates for New Jersey and the average of estimates for New Jersey and Pennsylvania (fig. 7), which is consistent with the location of the study area in southeastern Pennsylvania near the New Jersey border. In studies in Pennsylvania and other temperate locations with similar seasonal variations in isotopic composition of precipitation, the isotopic composition of groundwater in hydrogeologic settings similar to the study area (sedimentary fractured-rock aquifers, temperate climate in northern hemisphere) has been reported to approximately represent a volume-weighted average of the isotopic composition of recharge throughout the year (Darling and others, 2003; Thomas and others, 2013), thus supporting a generalized inferred relation between isotopic composition of groundwater and baseflow. This finding would most likely pertain to settings where groundwater is relatively well mixed. Seasonal differences in the isotopic composition in precipitation may provide information about the seasonal timing of recharge. At the latitude of the study area (about 40.2 degrees) in the northern hemisphere, δ 18O values are generally heaviest (least negative) in summer and lightest (most negative) in winter, ranging from about −5 to −11 per mil in those seasons, respectively (Feng and others, 2009). Selected boreholes with isotopic compositions that indicate contributions of water from shallow producing zones to deeper receiving zones are discussed in more detail in the following sections for individual boreholes. Other reported differences in isotopic composition in water from isolated intervals may indicate differences in recharge areas and timing but detailed discussion of variations in isotopic composition are beyond the scope of this report.
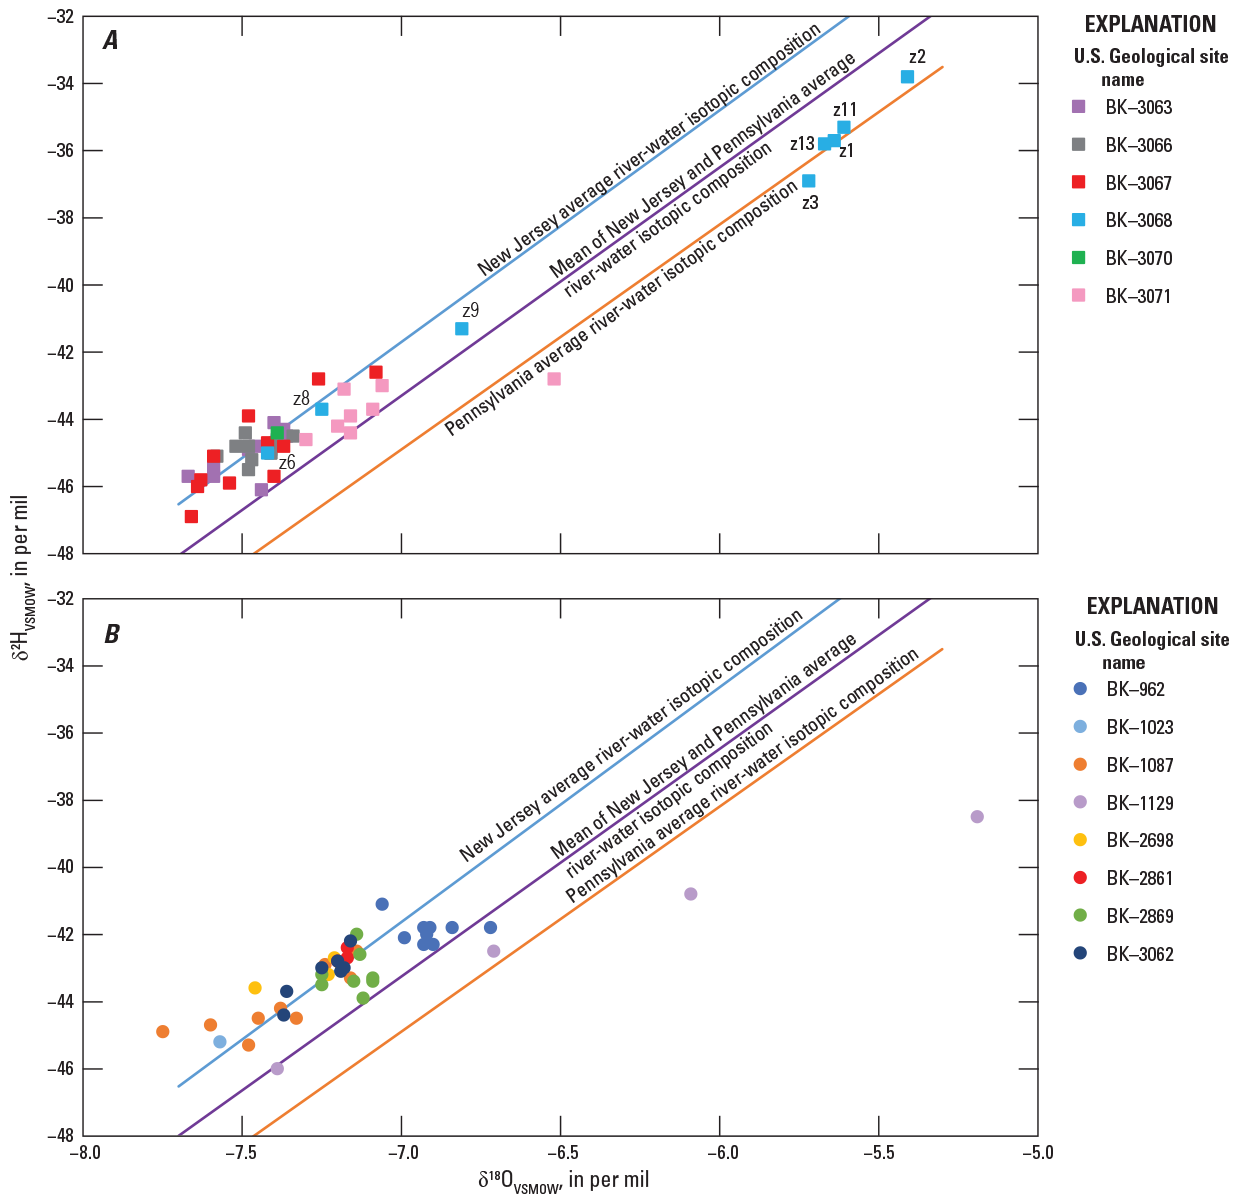
Scatterplot showing isotopic composition of water in samples collected from isolated intervals during packer tests performed by the U.S. Geological Survey in A, 6 deep boreholes drilled in 2018 and B, 7 existing boreholes at and near the former Naval Air Warfare Center (NAWC) Warminster, Bucks County, Pennsylvania, 2018–19 plotted with average isotopic composition for Pennsylvania and New Jersey river water. Samples from borehole BK–3068 (HN–117) are labeled by interval zone (z) number. River-water isotopic composition from Kendall and Coplen (2001).
Hydraulic and selected chemical results for packer tests and alternate vertical profiling are summarized in the following sections for each borehole and discussed in relation to findings from geophysical logs, including comparison of hydraulic heads in isolated intervals to direction of vertical borehole flow measured during logging. Packer tests are described using test names that refer to a zone number and “depths of field packer spacing” (measured to top of upper and lower packer bladders, respectively, when both packers are inflated); tabulated packer-test results also include estimated actual depths of the tested interval that account for packer bladder inflation as described in the “Methods” section. Chemical results of water samples from receiving intervals isolated during packer tests should be interpreted with caution as the observed water quality in packer tests of these receiving intervals with lower comparative hydraulic heads than surrounding zones may be affected by water from other producing intervals with higher hydraulic heads in the open borehole. In some cases, water quality of samples from intervals with either producing or receiving fractures that were isolated during packer tests of open boreholes may be compared to water-quality of samples from similar discrete intervals in reconstructed wells. The six deep boreholes drilled by the Navy’s contractors in 2018 were reconstructed as monitoring wells to be open to discrete intervals and then resampled in March 2020 (Battelle, 2021), so these and any more recent results could be compared to results of the 2018–19 packer tests.
BK–962 (NAWC 10)
BK–962 is an 8-in. diameter, 385-ft deep unused former production well with 50 ft of casing, in which open-borehole static water levels were 13.95 ft bls at the time of logging (table 4) and about 12.6–13.1 ft bls at the time of packer testing (appendix 1, table 1.1). Geophysical and borehole video logs collected by USGS in December 2017 (Senior and others, 2021) indicated numerous water-bearing fractures throughout the borehole, and upward flow was measured at the time of logging. Ten intervals were selected for testing using straddle packers with a spacing of 27.3 ft between the tops of the upper and lower bladders and an estimated test-interval length of about 21.4 ft between packers, assuming complete seals of 5.9-ft long upper and lower packer bladders (fig. 8; tables 4 and 6). The shallowest interval tested (zone 1, “above 65 ft bls”; open 50–65 ft bls) spanned the depths from above the top of the upper packer bladder at 65 ft bls to the bottom of the surface casing at 50 ft bls; static water level in zone 1 after packer inflation was about 11.7 ft bls (appendix 1, table 1.1). The deepest interval tested (zone 10, “below 341.5 ft bls”; open 347.4–384 ft bls) spanned depths from the bottom of the upper packer bladder (about 347.4 ft bls) to the bottom of the borehole at about 385 ft bls, as only the upper packer was inflated. A complete test was not done for, and no samples were collected from, zone 8 (“251.5–278.8 ft bls”; open 257.4–278.8 ft bls) because fractures in the isolated interval were not sufficiently productive to support pumping at a rate of less than 1 gal/min.
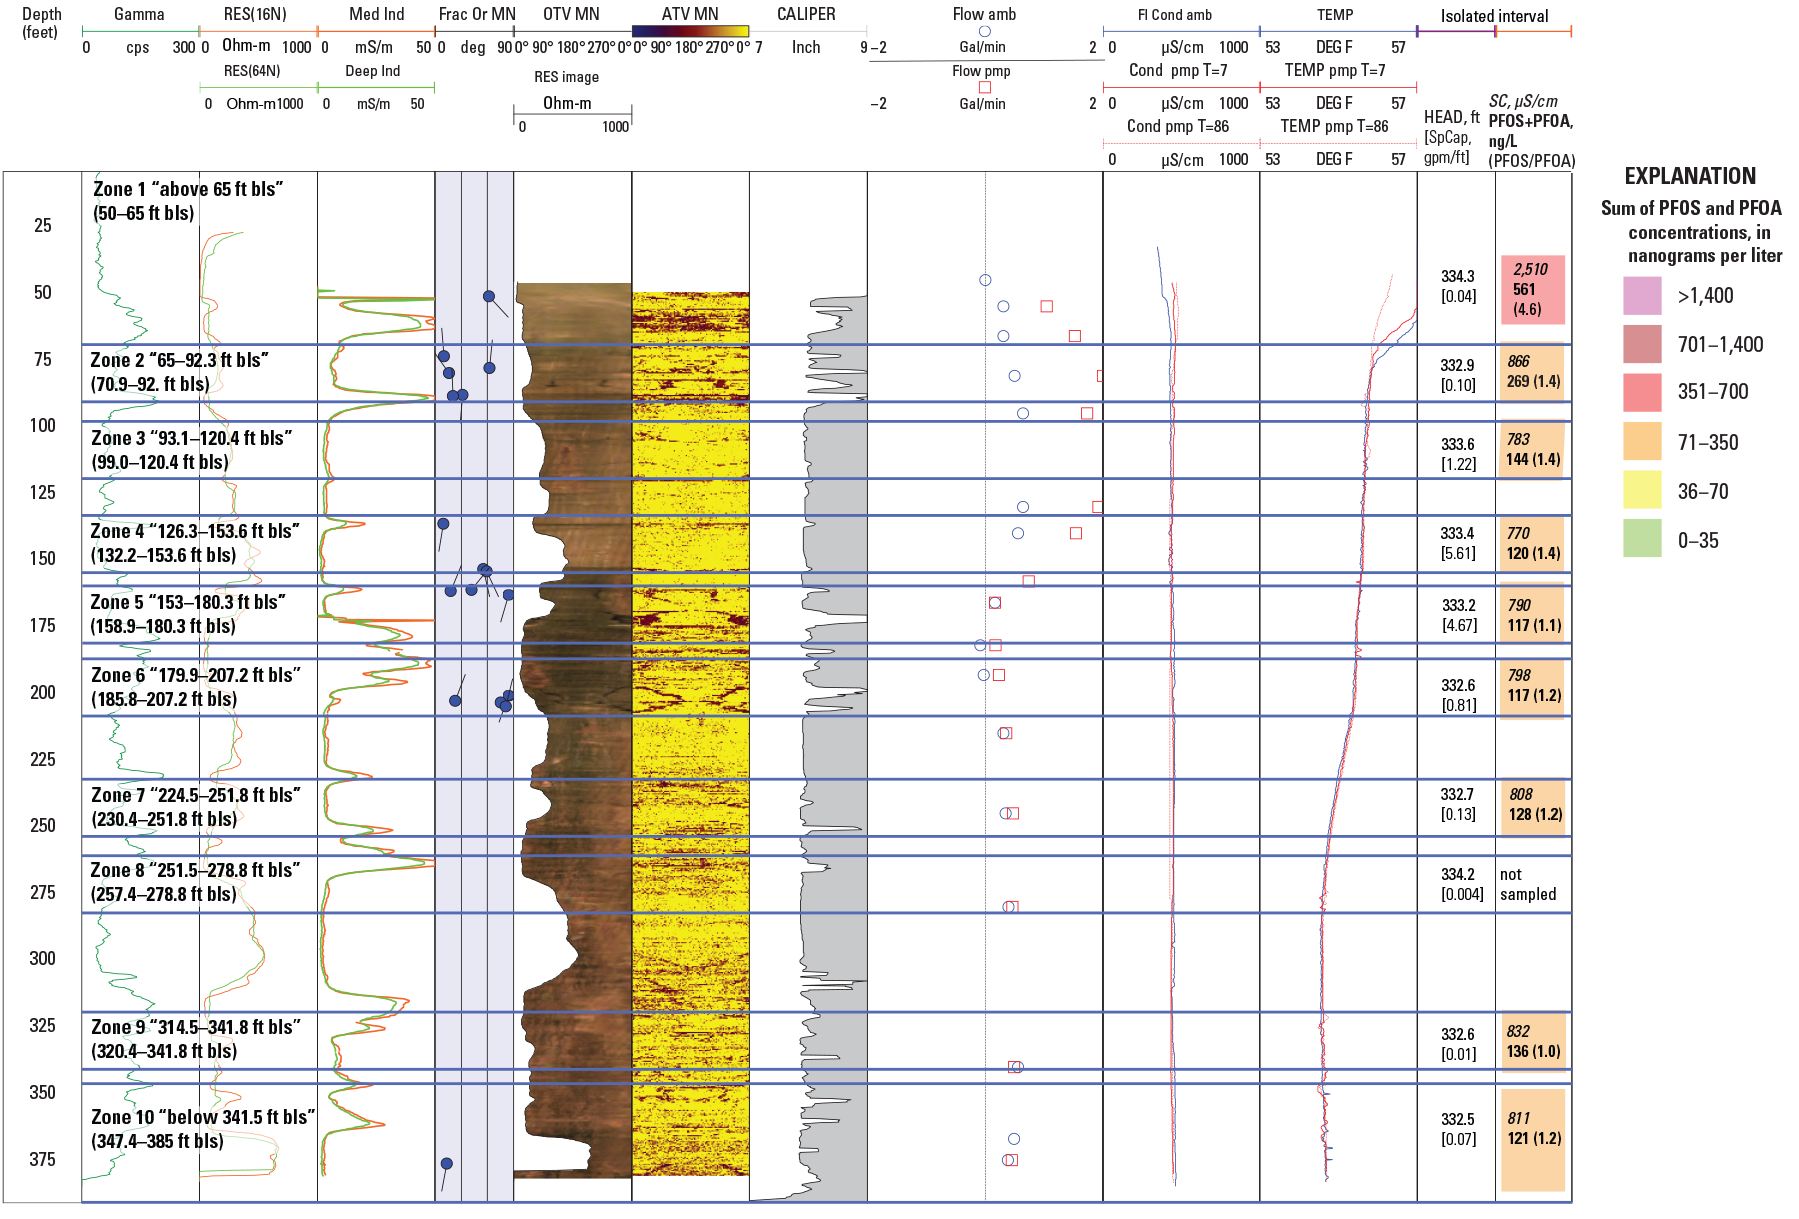
Geophysical logs for, and selected physical and chemical results of, May 2018 aquifer-interval-isolation (packer) tests in borehole BK–962 (NAWC 10), at the former Naval Air Warfare Center Warminster, Bucks County, Pennsylvania, including isolated-interval hydraulic head (in feet above North American Vertical Datum of 1988 [NAVD 88]), specific capacity (in gallons per minute per foot [gpm/ft]), water-sample specific conductance (in microsiemens per centimeters [µS/cm]), summed concentrations of perfluorooctanesulfonic acid (PFOS) and perfluorooctanoic acid (PFOA) (in nanograms per liter [ng/L), and PFOS to PFOA mass ratio. PFOS and PFOA data from Battelle (2021). Isolated intervals are depicted by blue lines, with depths to top and bottom of interval in feet below land surface (ft bls). Name of test for each interval includes zone number and “depths to top of bladder in upper and lower packer.” Estimated depths to top and bottom of tested interval in parentheses and also listed in table 6. See table 2 for explanation of log abbreviations.
Table 6.
Hydraulic head, specific capacity, and selected water quality for aquifer intervals isolated by packers in tests of well BK–962 (NAWC 10) at and near the former Naval Air Warfare Center Warminster, Bucks County, Pennsylvania, May 3–9, 2018.[PFOS and PFOA data from Battelle (2021). Tested interval identified by zone (z) number, listed with depths to top of upper packer bladder and to top and bottom of tested interval. Selected water quality includes field parameters and results of laboratory analysis for major ions, boron, stable isotopes of water (δ2H, δ18O), perfluorooctanesulfonic acid (PFOS), and perfluorooctanoic acid (PFOA). Hydraulic head for tested interval estimated from postinflation static water level. See table 1.1 in appendix 1 for more information about water levels and pumping rates for tests. Dates shown as month/date/year. Ft, feet; bls, below land surface; WL, water-level altitude; NAVD88, North American Vertical Datum of 1988; gpm/ft, gallons per minute per foot; DO, dissolved oxygen; mg/L, milligrams per liter; std., standard; SC, specific conductance; µS/cm, microsiemens per centimeter; °C, degree Celsius; Temp, water temperature; PFOS, perfluorooctanesulfonic acid; ng/L, nanograms per liter; PFOA, perfluorooctanoic acid; Ca, calcium; Mg, magnesium; K, potassium; Na, sodium; ANC, acid neutralizing capacity; CaCO3, calcium carbonate; Cl, chloride; F, fluoride; SiO2, silica; SO4, sulfate; B, boron; µg/L, micrograms per liter; δ 2H, delta hydrogen-2; per mil, parts per thousand; δ 18O, delta oxygen-18; Cl/Na molar ratio, chloride to sodium molar ratio; z, zone; <, less than; --, no data]
Little to no hydraulic connection to adjacent intervals, as indicated by relatively small drawdown in intervals adjacent to the pumped isolated interval, was observed for tests of zones 1, 2, 7, 8, 9, and 10 in borehole BK–962, but some hydraulic connection to adjacent intervals was indicated by larger drawdowns in adjacent intervals for tests of zones 3, 4, 5, and 6 (appendix 1, table 1.1; Senior and others, 2020). Of these tests, drawdowns in adjacent intervals of up to 0.69 ft were the greatest compared to drawdown in the pumped isolated interval for tests of zones 4 (“126.3–153.6 ft bls”; open 132.2–153.6 ft bls) and 5 (“153–180.3 ft bls”; open 158.9–180.3 ft bls), which share possibly leaky seals near about 153–158 ft bls and both have the largest apparent specific capacity of zones tested; however, the specific capacity for those pumped isolated intervals is overestimated because of hydraulic connections to, indicated by drawdowns in, adjacent intervals. The sum of specific-capacity values from packer tests was 12.65 (gal/min)/ft, about 20 percent more than the total specific capacity of 10.54 (gal/min)/ft for the open borehole estimated from data collected during logging.
Hydraulic-head values as inferred from postinflation static water levels ranged from 334.26 to 332.45 ft and differed by less than 2 ft among isolated intervals (table 6), indicating relatively small vertical hydraulic gradients between isolated water-bearing zones in the borehole. Head differences among isolated intervals indicated potential for both downward and upward flow. The highest hydraulic heads (greater than 334 ft above NAVD88) were in the shallowest interval tested (zone 1, “above 65 ft bls”; open 50–65 ft bls) and in the deeper low-permeability interval (zone 8, “251.5–278.8 ft bls”; open 257.4–278.8 ft bls). The lowest hydraulic heads (less than 333 ft above NAVD88) were in both shallow and deep intervals (zones 2, 6,7, 9, and 10), suggesting a complex pattern of apparently small gradients in the aquifer. During logging, upward borehole flow was generally measured, and possible outflow through fractures was observed at depths spanned by zones 6 (“179.9–-207.2 ft bls”; open 185.8–207.2 ft bls) and 1 (above 65 ft bls; open 50–65 ft bls). The observed increase in upward borehole flow from fractures spanned at depths by zones 4 and 5 (test intervals ranging in depth from about 132.2 to 180.3 ft bls) was consistent with these intervals having the highest specific capacity of intervals tested (fig. 8; table 6), although specific capacity for zones 4 and 5 might be slightly overestimated due to hydraulic interconnections and (or) leaky packer seals near 153–158 ft bls.
Field and laboratory water quality indicated that the water from the shallowest interval (zone 1, “above 65 ft bls”; open 50–65 ft bls) differed the most from water from other intervals (table 6). Water from zone 1 had the highest specific conductance, the highest concentrations of dissolved oxygen, calcium, magnesium, sodium, chloride, sulfate, PFOS, and PFOA, the highest PFOS to PFOA ratio, the lowest concentrations of acid neutralizing capacity and boron, and the most negative (lightest) δ18O values compared to water from other intervals (table 6). Concentrations of major ions and PFAS differed little among water samples from other isolated intervals in borehole BK–962, although water from zone 2 (“65–92.3 ft bls”; open 70.9–92.3 ft bls), the second shallowest interval, had higher concentrations of chloride, PFOS, and PFOA than water from all zones except zone 1. The extremely elevated chloride concentration of 717 mg/L in water from zone 1 was the highest chloride concentration measured in water samples from all 15 boreholes tested and exceeded the EPA secondary maximum contaminant level (SMCL) of 250 mg/L for chloride in drinking water (U.S. Environmental Protection Agency, 2018). The summed PFOS and PFOA concentrations were greater than the LHA of 70 ng/L in water from all intervals tested in borehole BK–962 and generally were higher in relation to increases in chloride concentrations (fig. 6B). As shown on a Piper diagram in figure 9, the composition of water from zone 1 plots as a calcium-magnesium-chloride type water and differs from that of water from other zones 2–10, which plots similarly as more of a mixed calcium-magnesium-bicarbonate-chloride type water (fig. 9).
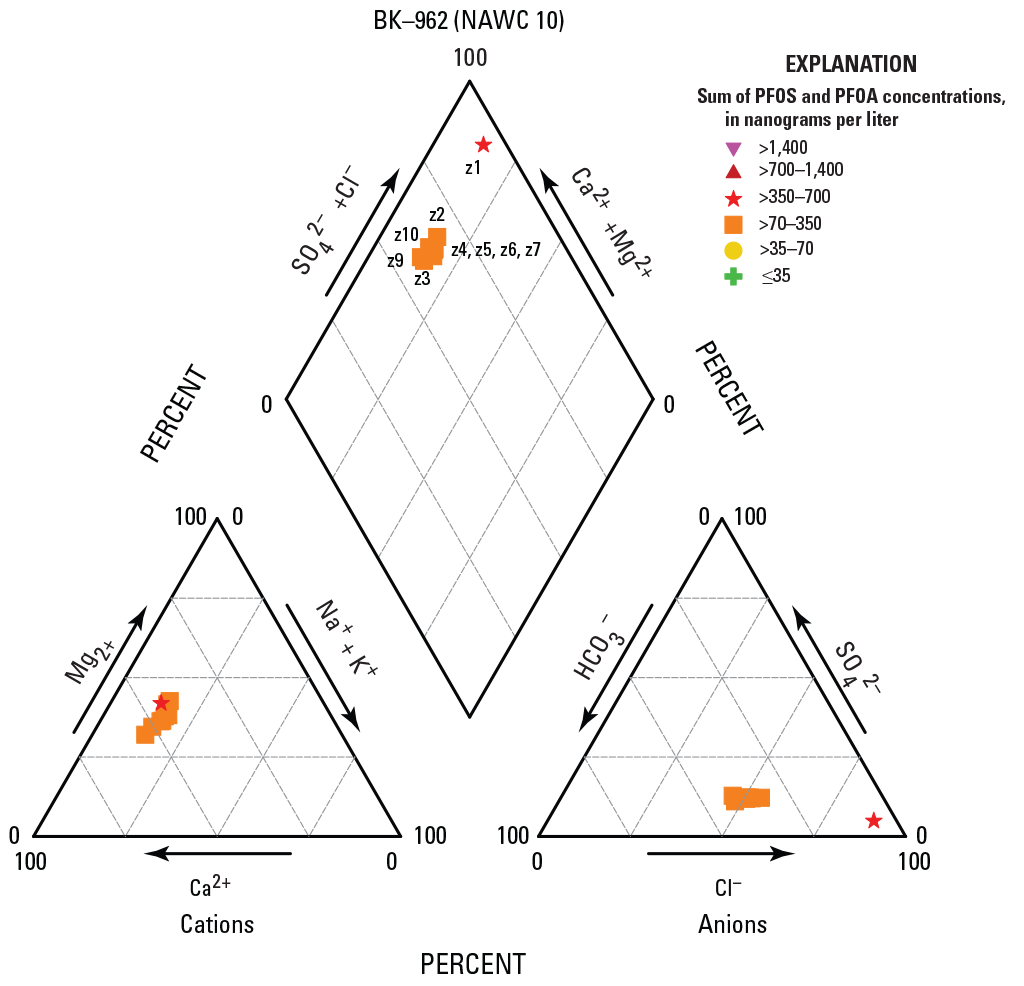
Piper diagram showing relative major ion composition of water samples collected from nine isolated intervals in borehole BK–962 (NAWC 10), at the former Naval Air Warfare Center Warminster, Bucks County, Pennsylvania, May 2018, with symbols depicting the range of summed perfluorooctanesulfonic acid (PFOS) and perfluorooctanoic acid (PFOA) concentrations. Cations include calcium (Ca2+), magnesium (Mg2+), sodium (Na+), and potassium (K+). Anions include bicarbonate (HCO3-), chloride (Cl-), and sulfate (SO42-). Intervals labeled by zone (z) number.
The overall observed pattern shows oxygenated, high-chloride water with the highest PFAS concentrations in the shallowest intervals, and similar chemical composition and low oxygen water with decreasing or stable PFAS concentrations in deeper intervals. Concentrations of PFAS and chloride were highest in the shallowest interval, suggesting that sources of these constituents (potential contaminants) may be at or near the surface nearby the borehole. The small differences in hydraulic heads and chemical composition of water from most other isolated intervals measured during the packer tests indicate hydraulic interconnection and possible mixing among water-bearing fractures in these intervals. These characteristics may reflect the use of BK–962 (NAWC 10) as a production well and the long period during which the well (drilled in 1976) has remained as an open borehole.
BK–1023 (well 28)
BK–1023 (well 28) is an 8-in. diameter, 604-ft deep unused former test well with 57 ft of casing, in which open-borehole static water levels were 29.53 ft bls at the time of logging (table 4) and about 19.8–27.7 ft bls at the time of packer testing (appendix 1, table 1.2). Geophysical and borehole video logs collected by USGS in September 2018 (Senior and others, 2021) indicated several water-bearing fractures throughout the borehole, with the largest above 200 ft bls; downward flow was measured at the time of logging. The borehole deviated substantially from vertical with depth, being offset horizontally more than 90 ft from vertical at total depth (fig. 2.2 of Senior and others, 2021), and due to concern about possible wedging of packer equipment in the deviated borehole, the deepest packer setting (top of lower packer bladder) was at about 177 ft bls. Four intervals were selected for testing using straddle packers with a spacing of 28.2 ft between the tops of the upper lower bladders and an estimated test-interval length of about 22.3 ft between packers, assuming complete seals of 5.9-ft long upper and lower packer bladders (fig. 10; tables 4 and 7; appendix 1, table 1.2); however, tests were completed for only three intervals as the shallowest interval (zone 1, “above 78 ft bls”; open 57–78 ft bls) did not yield sufficient water. The deepest intervals tested were zones 3 (“149–177.2 ft bls”; open 154.9–177.2 ft bls) and 4 (“149–604 ft bls”; open 154.9–604 ft bls at the bottom of borehole). By comparing results from overlapping zones 3 (“149–177.2 ft bls”; open 154.9–177.2 ft bls) and 4 (“149–604 ft bls”; open 154.9–604 ft bls), hydraulic properties and water quality of the interval from 177.2 to 604 ft bls may be inferred. Little to no hydraulic connection to adjacent intervals, as indicated by small drawdown in intervals adjacent to the pumped isolated interval, was observed for tests of all four intervals (appendix 1, table 1.2).
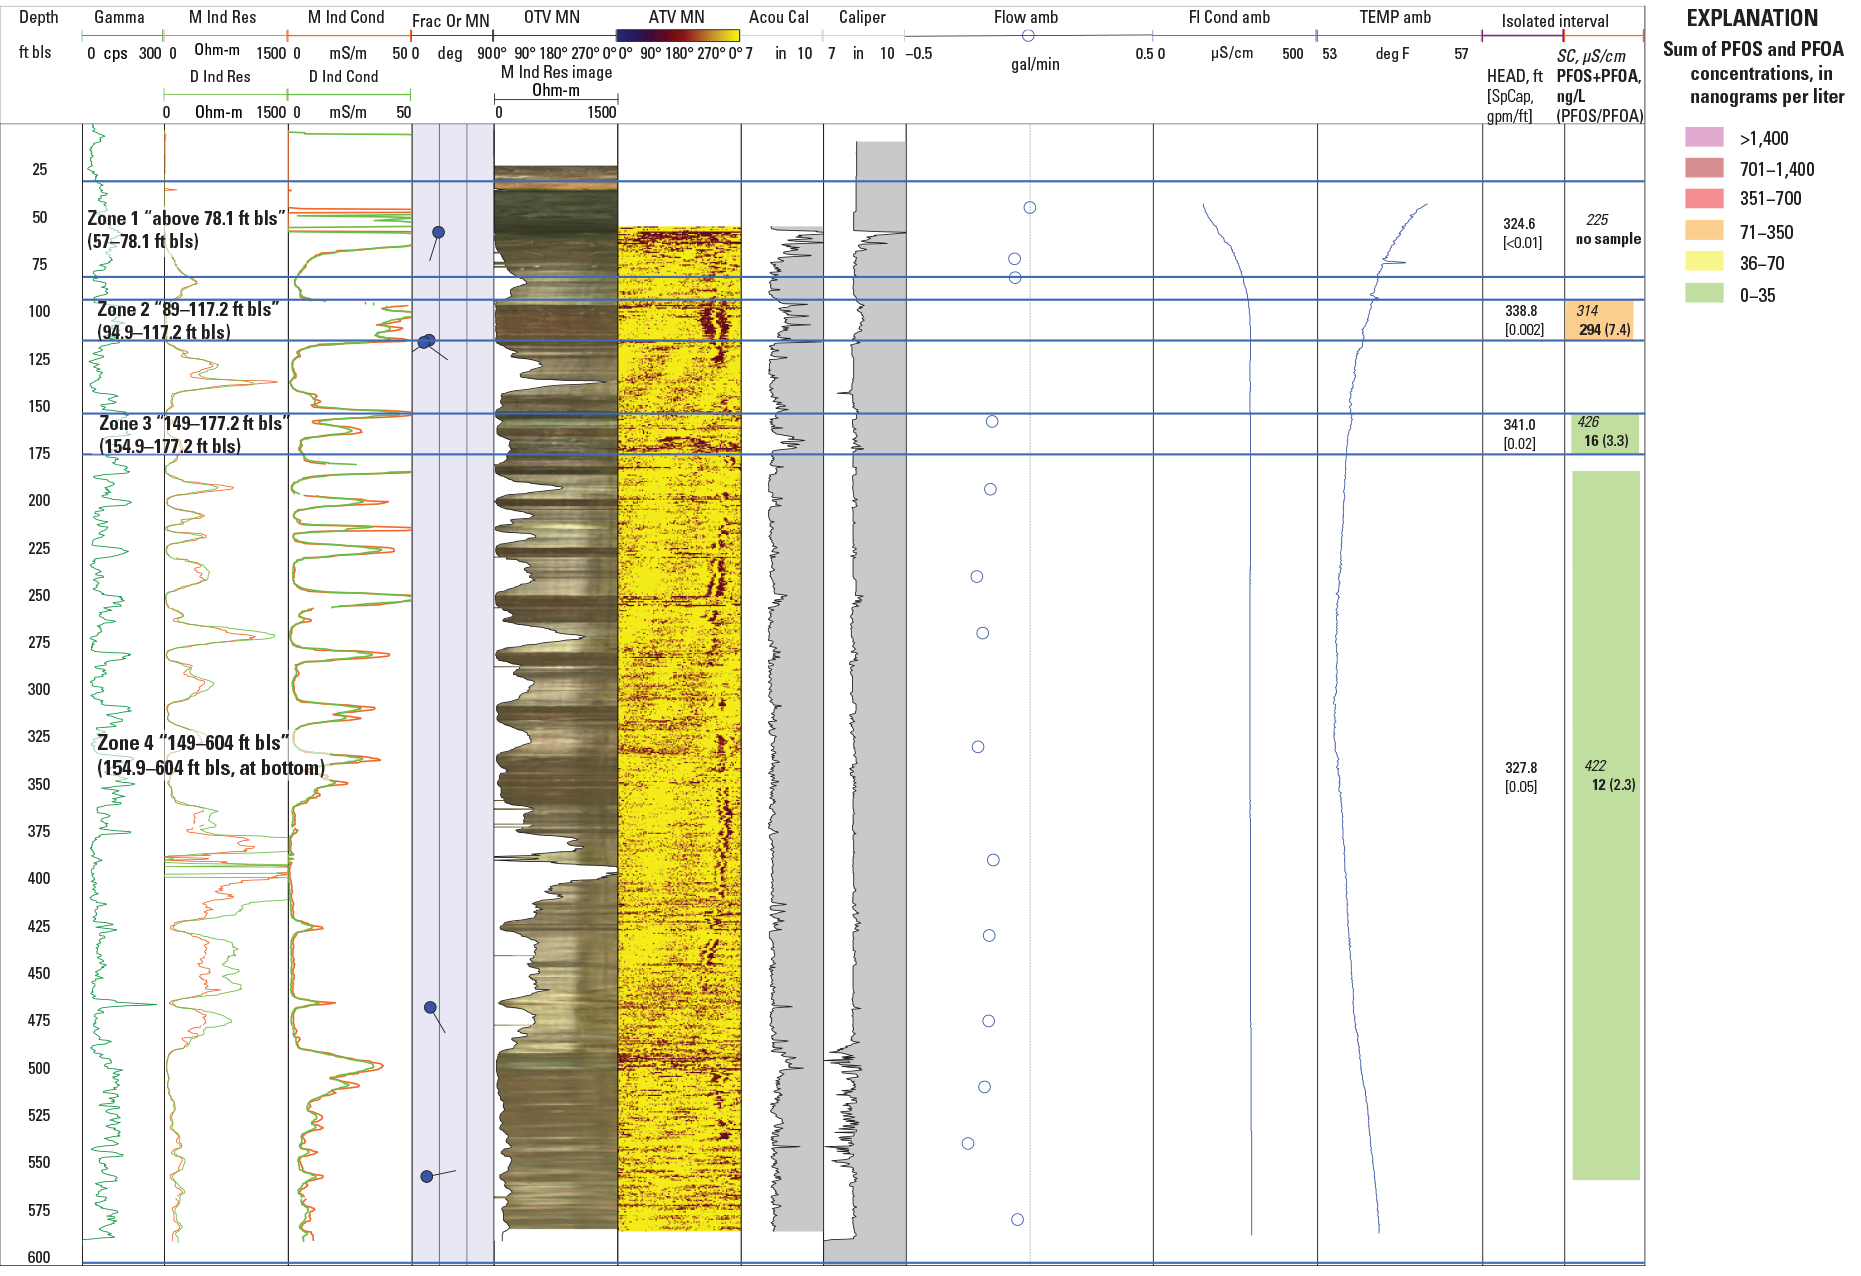
Geophysical logs for, and selected physical and chemical results of, October 2018 aquifer-interval-isolation (packer) tests in, borehole BK–1023 (well 28), near the former Naval Air Warfare Center Warminster, Bucks County, Pennsylvania, including isolated-interval hydraulic head (in feet above North American Vertical Datum of 1988 [NAVD 88]), specific capacity (in gallons per minute per foot [gpm/ft]),water-sample specific conductance (in microsiemens per centimeters [µS/cm]), summed concentrations of perfluorooctanesulfonic acid (PFOS) and perfluorooctanoic acid (PFOA) (in nanograms per liter [ng/L]), and PFOS to PFOA mass ratio. PFOS and PFOA data from Battelle (2021). Isolated intervals are depicted by blue lines, with depths to top and bottom of interval in feet below land surface (ft bls). Name of test for each interval includes zone number and “depths to top of bladder in upper and lower packer.” Estimated depths to top and bottom of tested interval in parentheses and also listed in table 7. See table 2 for explanation of log abbreviations.
Table 7.
Hydraulic head, specific capacity, and selected water quality for aquifer intervals isolated by packers in tests of well BK–1023 (well 28) at and near the former Naval Air Warfare Center Warminster, Bucks County, Pennsylvania, October 9–10, 2018.[PFOS and PFOA data from Battelle (2021). Tested isolated interval identified by zone (z) number, listed with depths to top of upper packer bladder and to top and bottom of tested interval. Selected water quality includes field parameters and results of laboratory analysis for major ions, boron, stable isotopes of water (δ 2H, δ18O), perfluorooctanesulfonic acid (PFOS), and perfluorooctanoic acid (PFOA). Hydraulic head for isolated interval estimated from postinflation static water level. See table 1.2 in appendix 1 for more information about water levels and pumping rates for tests. Dates shown as month/date/year. ft, feet; bls, below land surface; WL, water-level altitude; NAVD 88, North American Vertical Datum of 1988; Spec. cap., specific capacity; gpm/ft, gallons per minute per foot; DO, dissolved oxygen; mg/L, milligrams per liter; std, standard; SC, specific conductance; µS/cm, microsiemens per centimeter; °C, degree Celsius; PFOS, perfluorooctanesulfonic acid; ng/L, nanograms per liter; PFOA, perfluorooctanoic acid; δ 2H, delta hydrogen-2; per mil, parts per thousand; δ 18O, delta oxygen-18; z, zone; <, less than; --, no data]
Hydraulic heads as inferred from postinflation static water levels were higher (water-level altitudes of about 338.8 and 341.0 ft above NAVD 88, respectively) in zones 2 (“89.2–117.2 ft bls”; open 95.1–117.2 ft bls) and 3 (“149–177.2 ft bls”; open 154.9–177.2 ft bls) and lower (water-level altitude of 327 ft above NAVD88) in zone 4 (“149–604 ft bls”; open 154.9–604 ft bls) (table 7), which is consistent with an observed increase in downward flow below 100–150 ft bls at the time of logging in September 2018 (fig. 10). The interval below about 183.1 ft bls (depth that accounts for inflation of lower packer bladder in test of zone 3 (“149–177.2 ft bls”; open 154.9–177.2 ft bls) had the lowest hydraulic head, estimated to be about 318 ft above NAVD 88 in altitude from the water levels measured during the packer test of zone 3 (app. 1), which is consistent with the calculated value from composite head in zone 4 adjusted for contribution from zone 3. Overall, the borehole was low yielding and had the lowest specific capacity of boreholes tested during 2018–19. The sum of specific-capacity values from packer tests in BK–1023 (well 28) was about 0.07 (gal/min)/ft (tables 4 and 7). Of intervals tested, the interval spanning depths from 183.1 to 604 ft bls had the highest specific capacity of about 0.03 (gal/min)/ft (determined by subtracting specific capacity of zone 3 from that of zone 4; table 7).
Field water quality indicated that the water from the shallowest interval, zone 1 (above 78.1 ft bls) had the lowest specific conductance (225 microsiemens per centimeter [µS/cm]) and water from deeper intervals (below about 95 and 155 ft bls) had generally increasing specific conductance (ranging from 314 to 426 µS/cm) (table 7), which is consistent with geophysical logging results; the increases in specific conductance likely reflect increases in dissolved constituents that could result from longer residence time and (or) differences in mineralogy with depth. Generally, dissolved oxygen levels were relatively low (0.3–1.2 mg/L) and pH (7.4 to 7.8) was slightly above but near neutral in water from all intervals tested.
Of the three zones (2–4) with laboratory analyses for PFAS, water from zone 2 (“89–117.2 ft bls”) had the highest concentrations of PFOS and PFOA (259 and 35 ng/L, respectively) and the highest PFOS to PFOA mass ratio (7.4) (table 7). Other laboratory analyses were not done for water from isolated intervals in BK–1023, except for analysis for stable isotopes of water in water from zone 3, which indicated a light composition similar to water from some other former production wells (fig. 7). The summed PFOS and PFOA concentrations were greater than the LHA of 70 ng/L only in water from zone 2 (table 7). Water from zone 2 (“89-117.2 ft bls”) also had lower pH and higher dissolved oxygen concentration than water from other isolated intervals.
The overall observed pattern shows slightly oxygenated water, with the highest PFAS concentrations in a relatively low-yielding shallow interval (zone 2, “89–117.2 ft bls”; open 94.9–117.2 ft bls) and much lower PFAS concentrations in water from deeper intervals that had lower hydraulic heads. Concentrations of PFAS were highest in a relatively shallow interval with a relatively high hydraulic head, suggesting that sources of these constituents may be near the surface nearby the borehole.
BK–1087 (well 25)
BK–1087 (well 25) is an 8-in. diameter, 400-ft deep unused former test well with 60 ft of casing, in which open-borehole static water levels were 13.39 ft bls at the time of logging (table 4) and about 7.1–9.6 ft bls at the time of packer testing (appendix 1, table 1.3). Geophysical and borehole video logs collected by USGS in August 2018 (Senior and others, 2021) indicated several water-bearing fractures throughout the borehole, with the largest above 125 ft bls and fractures near 100 ft bls appearing to be the most hydraulically active; slight downward flow in the interval from about 65 to 125 ft bls was measured at the time of logging. Nine intervals were selected for testing using straddle packers with a spacing of 23.8 ft between the top of the upper and the lower bladders and an estimated test-interval length of about 17.9 ft between packers, assuming complete seals of 5.9-ft long upper and lower packer bladders (fig. 11; tables 4 and 8; appendix 1, table 1.3). The shallowest interval tested (zone 1, “above 81 ft bls”; open 60–81 ft bls) spanned the depths from above the top of the upper packer at 81 ft bls to bottom of surface casing at 60 ft bls; the static water level in zone 1 after packer inflation was about 7.7 ft bls (appendix 1, table 1.3), and zone 1 was low yielding when pumped. The deepest interval tested (zone 8, “335 to 400 ft bls”; open 340.9–400 ft bls at bottom of borehole), was low yielding and not pumped to remove three interval volumes before sampling due to field logistics (appendix 1, table 1.3).
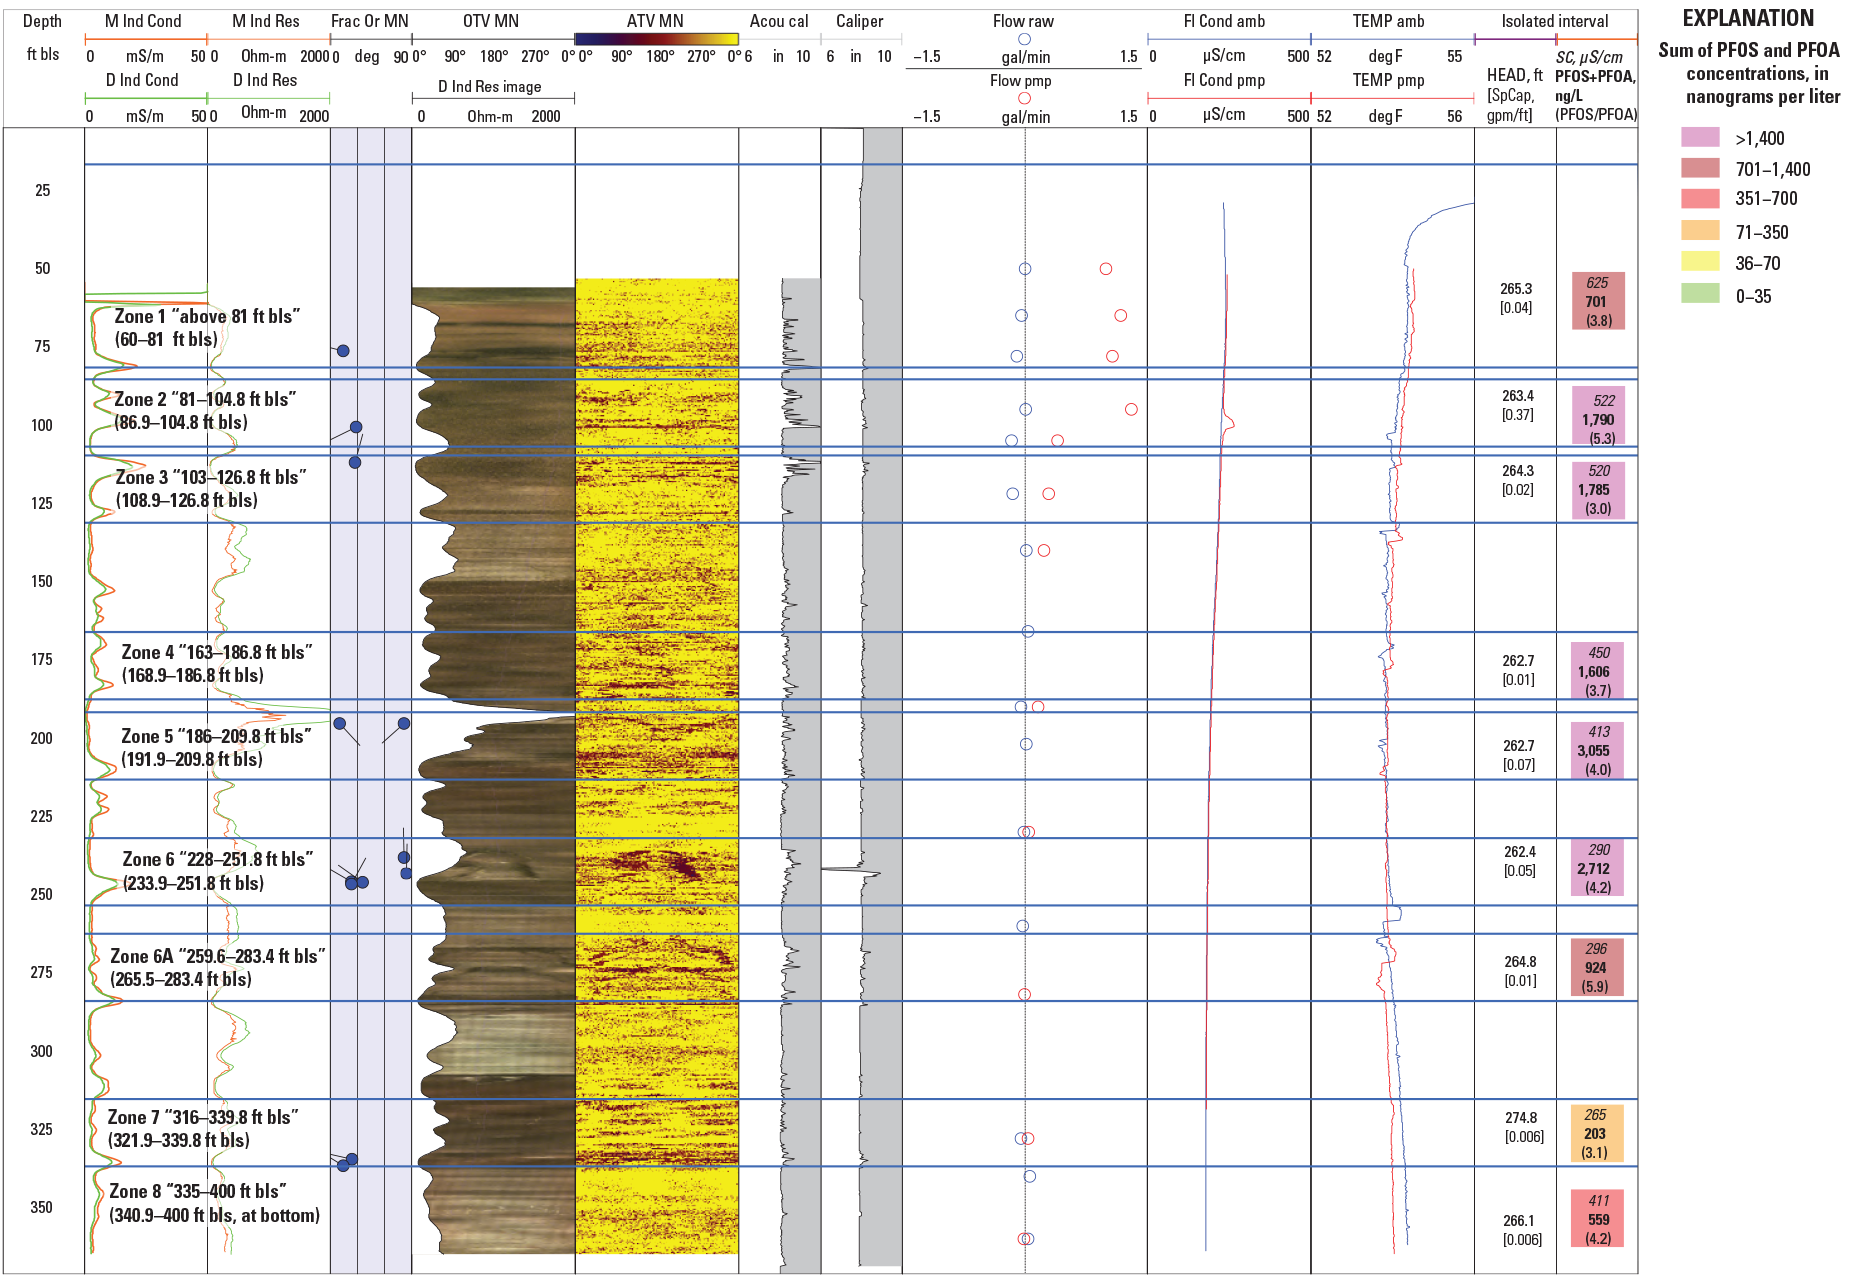
Geophysical logs for, and selected physical and chemical results of, May 2019 aquifer-interval-isolation (packer) tests in, borehole BK–1087 (well 25), near the former Naval Air Warfare Center Warminster, Bucks County, Pennsylvania, including isolated-interval hydraulic head (in feet above North American Vertical Datum of 1988 [NAVD 88]), specific capacity (in gallons per minute per foot [gpm/ft]), water-sample specific conductance (in microsiemens per centimeters, [µS/cm]), summed concentrations of perfluorooctanesulfonic acid (PFOS) and perfluorooctanoic acid (PFOA) (in nanograms per liter [ng/L]), and PFOS to PFOA mass ratio. PFOS and PFOA data from Battelle (2021). Isolated intervals are depicted by blue lines, with depths to top and bottom of interval in feet below land surface (ft bls). Name of test for each interval includes zone number and “depths to top of bladder in upper and lower packer.” Estimated depths to top and bottom of tested interval in parentheses and also listed in table 8. See table 2 for explanation of log abbreviations.
Table 8.
Hydraulic head, specific capacity, and selected water quality for nine aquifer intervals isolated by packers in tests of borehole BK–1087 (well 25) at former Naval Air Warfare Center Warminster, Bucks County, Pennsylvania, May 5–17, 2019.[PFOS and PFOA data from Battelle (2021). Tested isolated interval identified by zone (z) number, listed with depths to top of upper packer bladder and to top and bottom of tested interval. Selected water quality includes field parameters and results of laboratory analysis for major ions, boron, stable isotopes of water (δ2H, δ18O), perfluorooctanesulfonic acid (PFOS) and perfluorooctanoic acid (PFOA). Hydraulic head for isolated interval estimated from postinflation static water level. See table 1.3 in appendix 1 for more information about water levels and pumping rates for tests. Dates shown as month/date/year. ft, feet; bls, below land surface; WL, water-level altitude; NAVD 88, North American Vertical Datum of 1988; Spec. cap., specific capacity; gpm/ft, gallons per minute per foot; DO, dissolved oxygen; mg/L, milligrams per liter; std, standard; SC, specific conductance; µS/cm, microsiemens per centimeter; °C, degree Celsius; Temp, water temperature; PFOS, perfluorooctanesulfonic acid; ng/L, nanograms per liter; PFOA, perfluorooctanoic acid; Ca, calcium; Mg, magnesium; K, potassium; Na, sodium; ANC, acid neutralizing capacity; CaCO3, calcium carbonate; Cl, chloride; F, fluoride; SiO2, silica; SO4, sulfate; B, boron; µg/L, micrograms per liter; δ 2H, delta hydrogen-2; per mil, parts per thousand; δ 18O, delta oxygen-18; z, zone]
Little to no hydraulic connection to adjacent intervals, as indicated by small drawdown in intervals adjacent to the pumped isolated interval, was observed for tests of seven intervals; some hydraulic connection between the pumped and adjacent intervals was indicated by drawdown of about 4 ft below the bottom packer (less than 7 percent of drawdown in pumped isolated interval) in tests of two intervals, zones 4 (“163–186.8 ft bls”; open 168.9–186.8 ft bls) and 6A (“259.6–283.4 ft bls”; open 265.5–283.4 ft bls).
Hydraulic heads as inferred from postinflation static water levels were highest (water-level altitudes of about 265.3, 274.8, and 266.1 ft above NAVD 88, respectively) in zones 1 (“above 81 ft bls”; open 60–81 ft bls), 7 (“316.0–339.8 ft bls”; open 321.9–339.8 ft bls), and 8 (“335–400 ft bls”; open 340.9–400 ft bls at bottom of borehole) (table 8), indicating potential for downward flow from shallowest interval and upward flow from deepest intervals to intervals at intermediate depths. The apparent highest hydraulic head of 274.8 ft above NAVD 88 in altitude may be an artifact of slow postinflation response of zone 7 (“316.0–338.8 ft bls”; open 321.9–338.8 ft bls) (Senior and others, 2020), with the actual hydraulic head in zone 7 likely being lower. At the time of logging, only observed small amounts of downward flow from about 65 to 125 ft bls were measured, which may reflect both the low productivity of most intervals and generally small head differences between most intervals. Overall, the borehole was low yielding and had some of the lowest specific capacity results of all boreholes tested during 2018–19, having a sum of specific-capacity values from packer tests of 0.59 (gal/min)/ft (tables 4 and 8). The interval spanning depths from about 86.9 to 104.8 ft bls (zone 2) had the highest specific capacity of about 0.37 (gal/min)/ft of intervals tested in borehole BK–1087 (well 25) (table 8), representing about 63 percent of total borehole specific capacity, which is consistent with logging indication of fractures near 100 ft being most hydraulically active.
Field water quality indicated that specific conductance was highest (625 µS/cm) in water from the shallowest interval (zone 1, “above 81 ft bls”; open 60–81 ft bls) and generally decreased with depth, except in water from the deepest tested interval (zone 8, “335–400 ft bls”; open 340.9–400 ft bls) (table 8; fig. 11), which is generally consistent with geophysical logging results. The deepest interval tested, zone 8, was low yielding and was not pumped to remove three interval volumes before sampling (appendix 1, table 1.3), so that water samples from zone 8 may represent a partial mixture of water in the open borehole. Overall, dissolved oxygen levels were relatively low (0.4–1.4 mg/L) and pH was near neutral (7.0–7.7) in water from tested intervals.
The vertical distribution of chloride concentrations in water from isolated intervals showed a similar pattern to that of specific conductance, with zone 1 having the highest chloride concentration of 71 mg/L and other intervals generally having decreasing concentrations with depth, except for deepest zone 8 (“335–400 ft bls”; open 340.9–400 ft bls), which had a chloride concentration of 31.6 mg/L that was higher than that in some shallower intervals. Chloride concentrations less than 9 mg/L, representing approximate natural background levels as estimated from data from nearby studies (Sloto and Davis, 1983; Senior, 1996) were measured in water from zones 6, 6A, and 7, intervals that produced the most dilute water and the lowest calcium and magnesium concentrations of intervals tested and that ranged in depth about 233.9 to 338.8 ft bls (table 8). Summed concentrations of PFOA and PFOS were greater than the LHA of 70 ng/L in water from all intervals tested, ranging from 203 ng/L in zone 7 (“316–338.8 ft bls”; open 321.9–338.8 ft bls) to 3,055 ng/L in zone 5 (“186–209.8 ft bls”; open 191.9–209.8 ft bls). PFOA and PFOS concentrations were highest in intermediate-depth intervals, being greater than 1,600 ng/L in intervals ranging in depth from about 86.9 to 251.8 ft bls (zones 2–6) and did not appear to be strongly related to concentrations of chloride alone (fig. 6B; table 8) or other ions that were analyzed. However, the lowest summed concentration of PFOS and PFOA was measured in the water sample from low-yielding zone 7 (“316–338.8 ft bls”; open 321.9–338.8 ft bls) that had the lowest chloride concentration of intervals tested (table 8; figs. 6 and 12).
The water samples from intervals with the highest chloride and PFAS concentrations (zones 1–5) plot as calcium-magnesium-bicarbonate type waters with some contribution of chloride, as shown in figure 12. Water from the deepest interval tested (zone 8, “335–400 ft bls”; open 340.9–400 ft bls) also plots as this type of water, but the low-yielding deepest interval was not pumped to remove three-interval volumes due to time constraints (appendix 1, table 1.3) and represents a mixture of open-borehole and isolated-interval water. Water samples from intervals with low chloride concentrations (zones 6, 6A, and 7) had a large range of PFAS concentrations and plot as calcium-sodium-bicarbonate type waters (fig. 12).
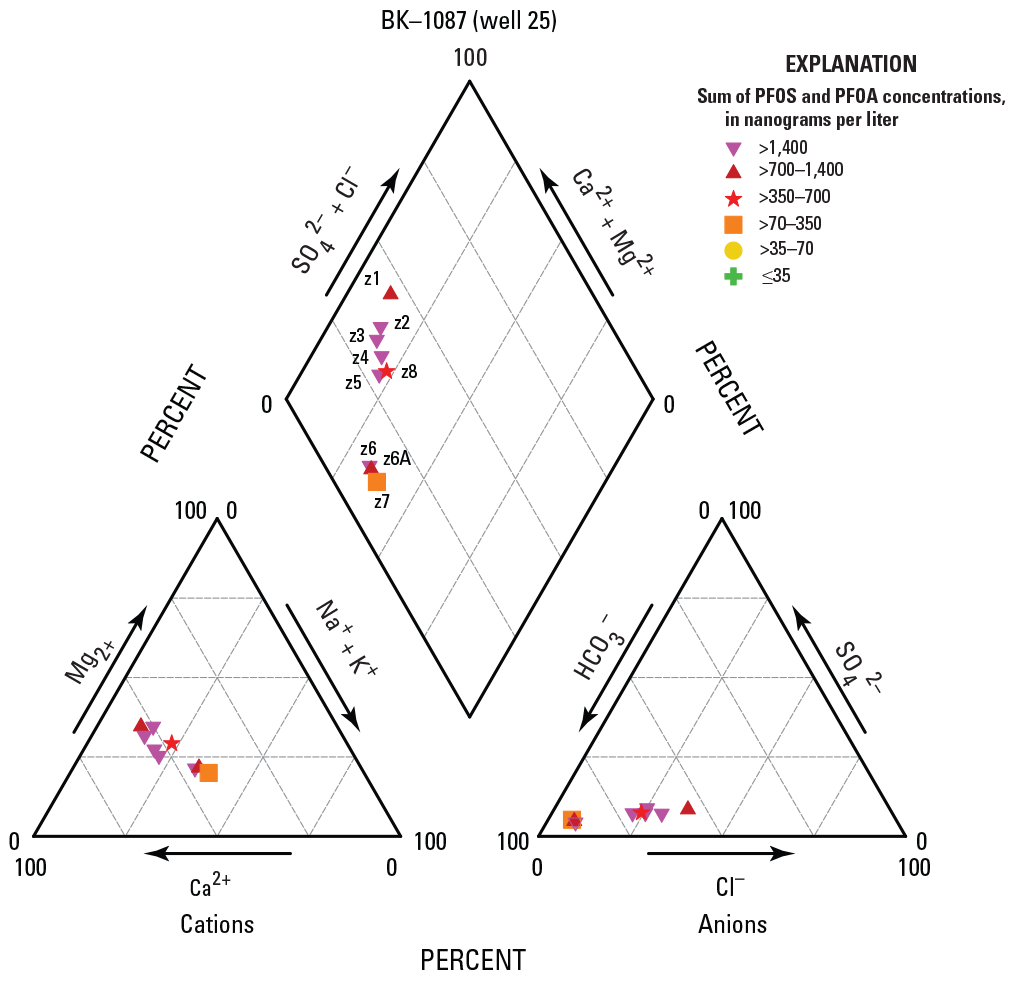
Piper diagram showing relative major ion composition of water samples collected from nine isolated intervals in borehole BK–1087 (well 25), near the former Naval Air Warfare Center Warminster, Bucks County, Pennsylvania, May 2018, with symbols depicting the range of summed perfluorooctanesulfonic acid (PFOS) and perfluorooctanoic acid (PFOA) concentrations. Cations include calcium (Ca2+), magnesium (Mg2+), sodium (Na+), and potassium (K+). Anions include bicarbonate (HCO3-), chloride (Cl-), and sulfate (SO42-). Intervals labeled by zone (z) number.
The lack of linear relations between PFAS concentrations, depth, and chemical composition in borehole BK–1087 (well 25) suggests that many processes may be affecting the apparent vertical distribution of PFAS and other chemical constituents in the borehole. The intervals with the highest specific capacity generally had higher summed PFOA and PFOS concentrations, which could indicate transport pathways from near and (or) distant sources of PFAS.
BK–1129 (well 36)
BK–1129 (well 36) is a 12-in. diameter, 375-ft deep unused former production well with 50 ft of casing and was flowing at top of casing 1.8 ft above land surface at the time of logging. Geophysical and borehole video logs collected by USGS in September 2018 (Senior and others, 2021) indicated many water-bearing fractures throughout the borehole. The artesian borehole was discharging at a rate of about 8 gal/min at the time of logging, with generally increasing amounts of upward flow measured from a depth of 356 ft bls to casing bottom at 50 ft bls (fig. 13; Senior and others, 2021). To support vertical profiling and because of site conditions that limited access for testing with packers, discrete-point samples were collected at four depths (310, 210, 125, and −1.8 ft bls, where −1.8 ft bls indicates sample collected at top of casing, which was 1.8 ft above land surface), to bracket the range of depths where inflow was estimated to occur in the borehole (fig. 13; tables 4 and 9).
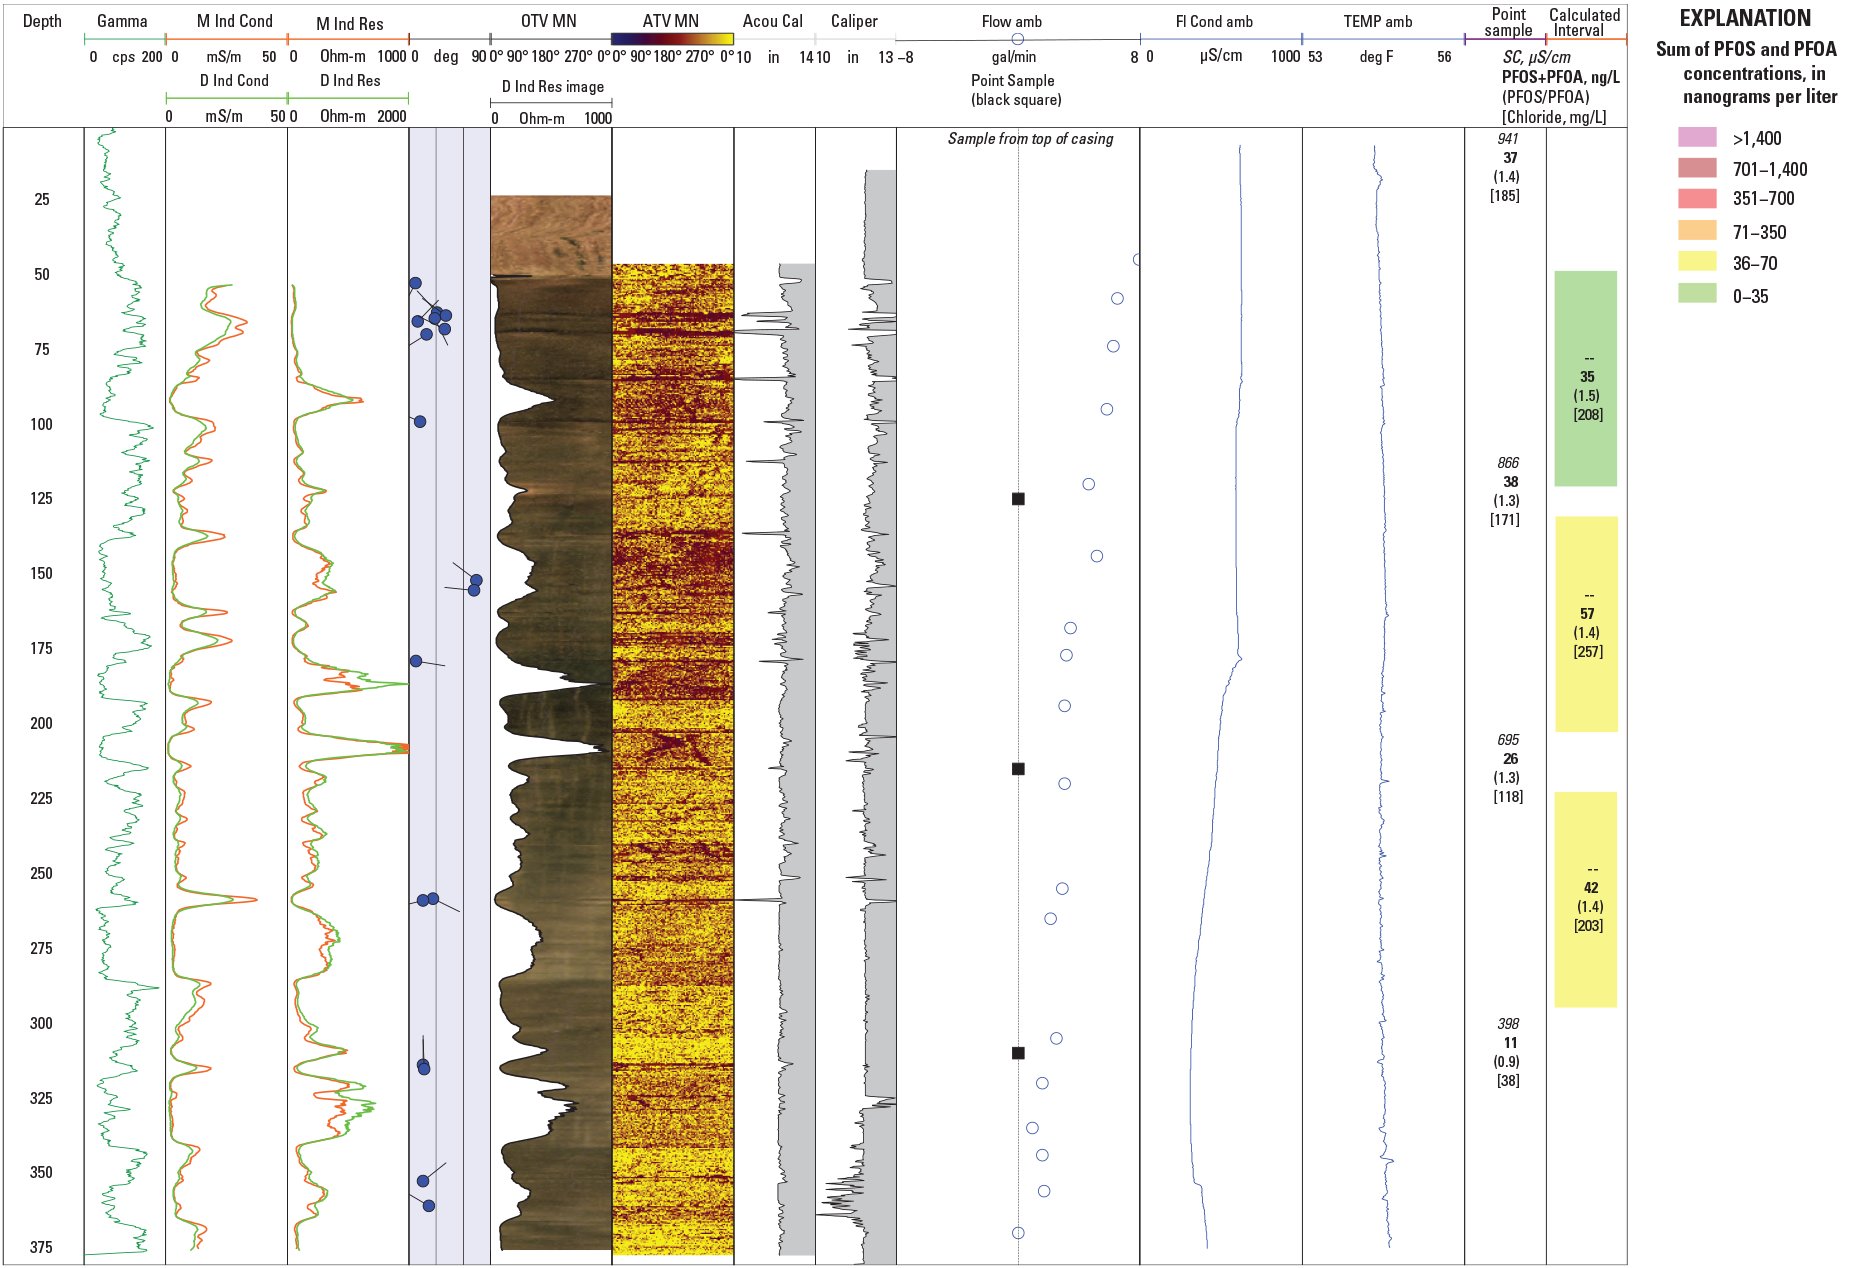
Geophysical logs for, and selected physical and chemical results of, September 2018 discrete-point samples collected at selected depths in, borehole BK–1129 (well 36), near the former Naval Air Warfare Center Warminster, Bucks County, Pennsylvania, including discrete-point-water-sample specific conductance (in microsiemens per centimeters [µS/cm]), summed concentrations of perfluorooctanesulfonic acid (PFOS) and perfluorooctanoic acid (PFOA) (in nanograms per liter [ng/L]), PFOS to PFOA mass ratio, and chloride (Cl) concentrations (in milligrams per liter [mg/L]). Chemical concentrations calculated for intervals between discrete point samples using discrete-point samples and borehole flow at top and bottom of interval depths. PFOS and PFOA data from Battelle (2021). See table 2 for explanation of log abbreviations.
Table 9.
Borehole flow and selected water quality for vertical profiling of well BK–1129 (well 36) near the former Naval Air Warfare Center Warminster, Bucks County, Pennsylvania, September 5, 2018.[PFOS and PFOA data from Battelle (2021). Selected water quality for discrete-point samples includes field parameters and results of laboratory analysis for major ions, boron, stable isotopes of water (δ2H, δ18O), perfluorooctanesulfonic acid (PFOS) and perfluorooctanoic acid (PFOA). Dates shown as month/date/year. USGS, U.S. Geological Survey; ft, feet; bls, below land surface; gpm, gallons per minute; DO, dissolved oxygen; mg/L, milligrams per liter; std, standard; SC, specific conductance; µS/cm, microsiemens per centimeter; °C, degree Celsius; Temp, water temperature; PFOS, perfluorooctanesulfonic acid; ng/L, nanograms per liter; PFOA, perfluorooctanoic acid; Ca, calcium; Mg, magnesium; K, potassium; Na, sodium; ANC, acid neutralizing capacity; CaCO3, calcium carbonate; Cl, chloride; F, fluoride; SiO2, silica; SO4, sulfate; B, boron; µg/L, micrograms per liter; δ 2H, delta hydrogen-2; per mil, parts per thousand; δ 18O, delta oxygen-18; --, no data]
Field water quality indicated that the water from the shallowest discrete-point sample collected at the top of casing (sampling point identified as 0 ft bls in field records, although top of casing was 1.8 ft above land surface) had the highest specific conductance (941 µS/cm) and water from deeper discrete-point samples had decreasing specific conductance, which is generally consistent with geophysical logging results (fig. 13; table 9).
The vertical distribution of chloride concentrations in water from these discrete-point samples showed a similar pattern to that of specific conductance, with the shallowest sample (collected at −1.8 ft bls) having the highest chloride concentration of 185 mg/L and generally decreasing concentrations with depth in other point samples to 38 mg/L at 310 ft bls. Summed concentrations of PFOA and PFOS were less than the LHA of 70 ng/L in water from all point samples tested, ranging from 11 mg/L in the deepest point sample at 310 ft bls to 38 and 37 mg/L in the samples at 125 and 0 ft bls. Overall, summed PFOS and PFOA concentrations were generally higher in relation to increases in chloride concentrations (fig. 6B). Using differences in measured borehole flow at discrete depths and associated point-sample concentrations, the calculated summed concentrations of PFOA and PFOS and concentrations of chloride in inflow between discrete points were both highest between depths of 125 and 210 ft bls, with values of 57 ng/L and 257 mg/L, respectively (table 9, fig. 13). The calculated concentration of chloride in inflow between 125 and 210 ft bls is greater than the SMCL of 250 mg/L for chloride in drinking water.
As shown on a Piper diagram in figure 14, the water compositions from discrete-point samples collected at four depths (and not corrected for inflow) range from a sodium-potassium-bicarbonate type water for the deepest, most dilute sample with the lowest summed PFOS and PFOA concentrations at 310 ft bls to types affected by increasing amounts of calcium, magnesium, and chloride at shallower depths, with the highest summed PFOS and PFOA concentrations at 125 and 0 ft bls (fig. 14; table 9).
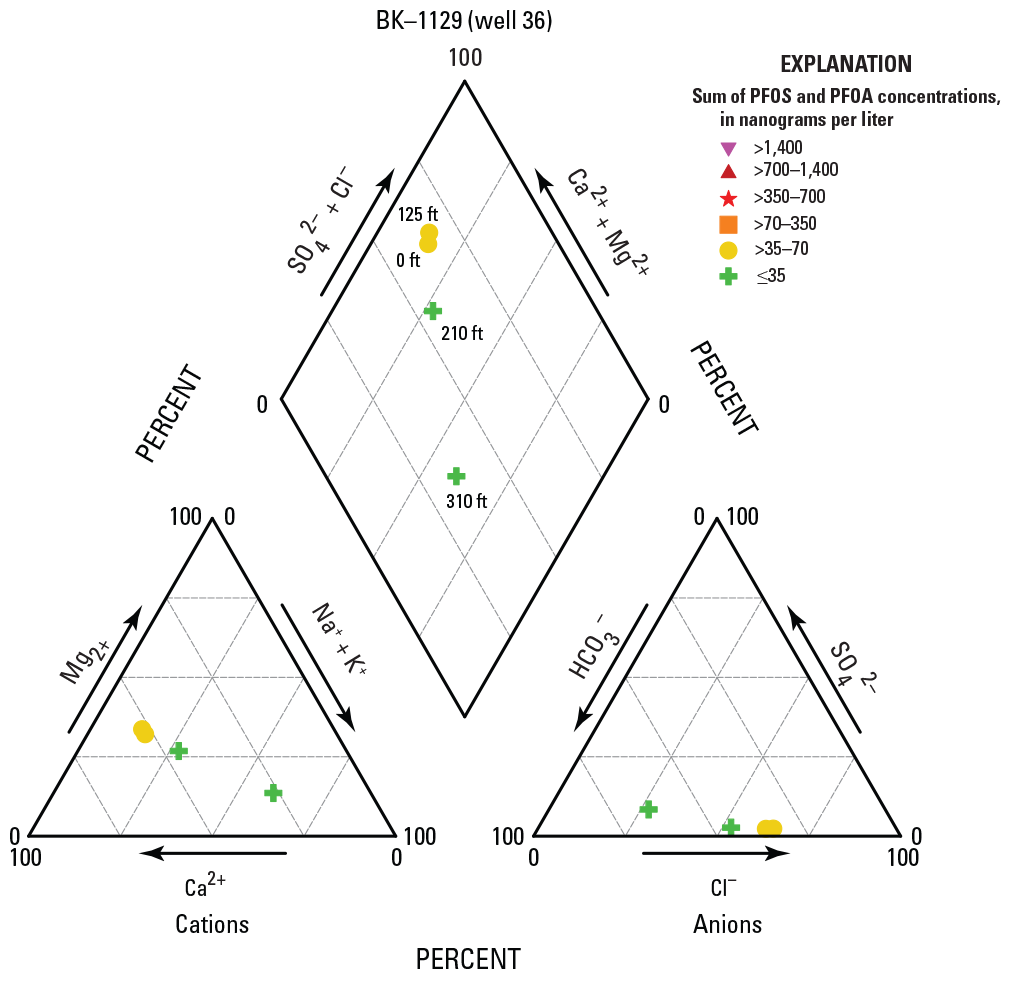
Piper diagram showing relative major ion composition of discrete-point water samples collected at four depths in borehole BK–1129 (well 36), near the former Naval Air Warfare Center Warminster, Bucks County, Pennsylvania, September 2018, with symbols depicting the range of summed perfluorooctanesulfonic acid (PFOS) and perfluorooctanoic acid (PFOA) concentrations. Cations include calcium (Ca2+), magnesium (Mg2+), sodium (Na+), and potassium (K+). Anions include bicarbonate (HCO3-), chloride (Cl-), and sulfate (SO42-). Intervals labeled by depth (in feet below land surface) of point sample number.
The distinct differences in water quality, including major ion concentrations and isotopic composition, among discrete-point samples suggest different sources of, and extent of anthropogenic effects (as indicated by chloride and PFAS concentrations) in, water from fractures at various depths. The deepest water samples (collected at 310 ft bls) have the lowest chloride and PFAS concentrations, whereas shallower water samples have higher concentrations of chloride and PFAS concentrations, indicating relatively greater anthropogenic effect in water from fractures above 310 ft bls.
BK–2698 (well 8)
BK–2698 (well 8) is a 10-in. diameter, 210.5-ft deep unused former production well with 60 ft of casing, in which open-borehole static water levels were 1.15 ft bls (0.35 ft above land surface) at the time of logging (table 4) and about 0.8 ft bls at the time of packer testing (appendix 1, table 1.4). Geophysical and borehole video logs collected by USGS in August and September 2019 (Senior and others, 2021) indicated several low-angle or bedding-plane water-bearing fractures throughout the borehole, with fractures near 145 ft bls appearing to be the most hydraulically active; upward flow in the interval from about 145 to 60 ft bls was measured at the time of logging. Interpretation of logs previously collected by USGS in the borehole indicated potential water-bearing fractures at 60, 97, and 150 ft bls (Bird, 1998). Five intervals were selected for testing using straddle packers with a spacing of 28.0 ft between top of the upper and lower bladders and an estimated test-interval length of about 22.1 ft between packers, assuming complete seals of 5.9-ft long upper and lower packer bladders; however, complete tests through sample collection were only done for four intervals as zone 4 was too low yielding to sustain pumping at rates above about 0.25 gal/min (fig. 15; tables 4 and 10; appendix 1, table 1.4). Little to no hydraulic connection to adjacent intervals, as indicated by small drawdown in intervals adjacent to the pumped isolated interval, was observed for tests of four intervals.
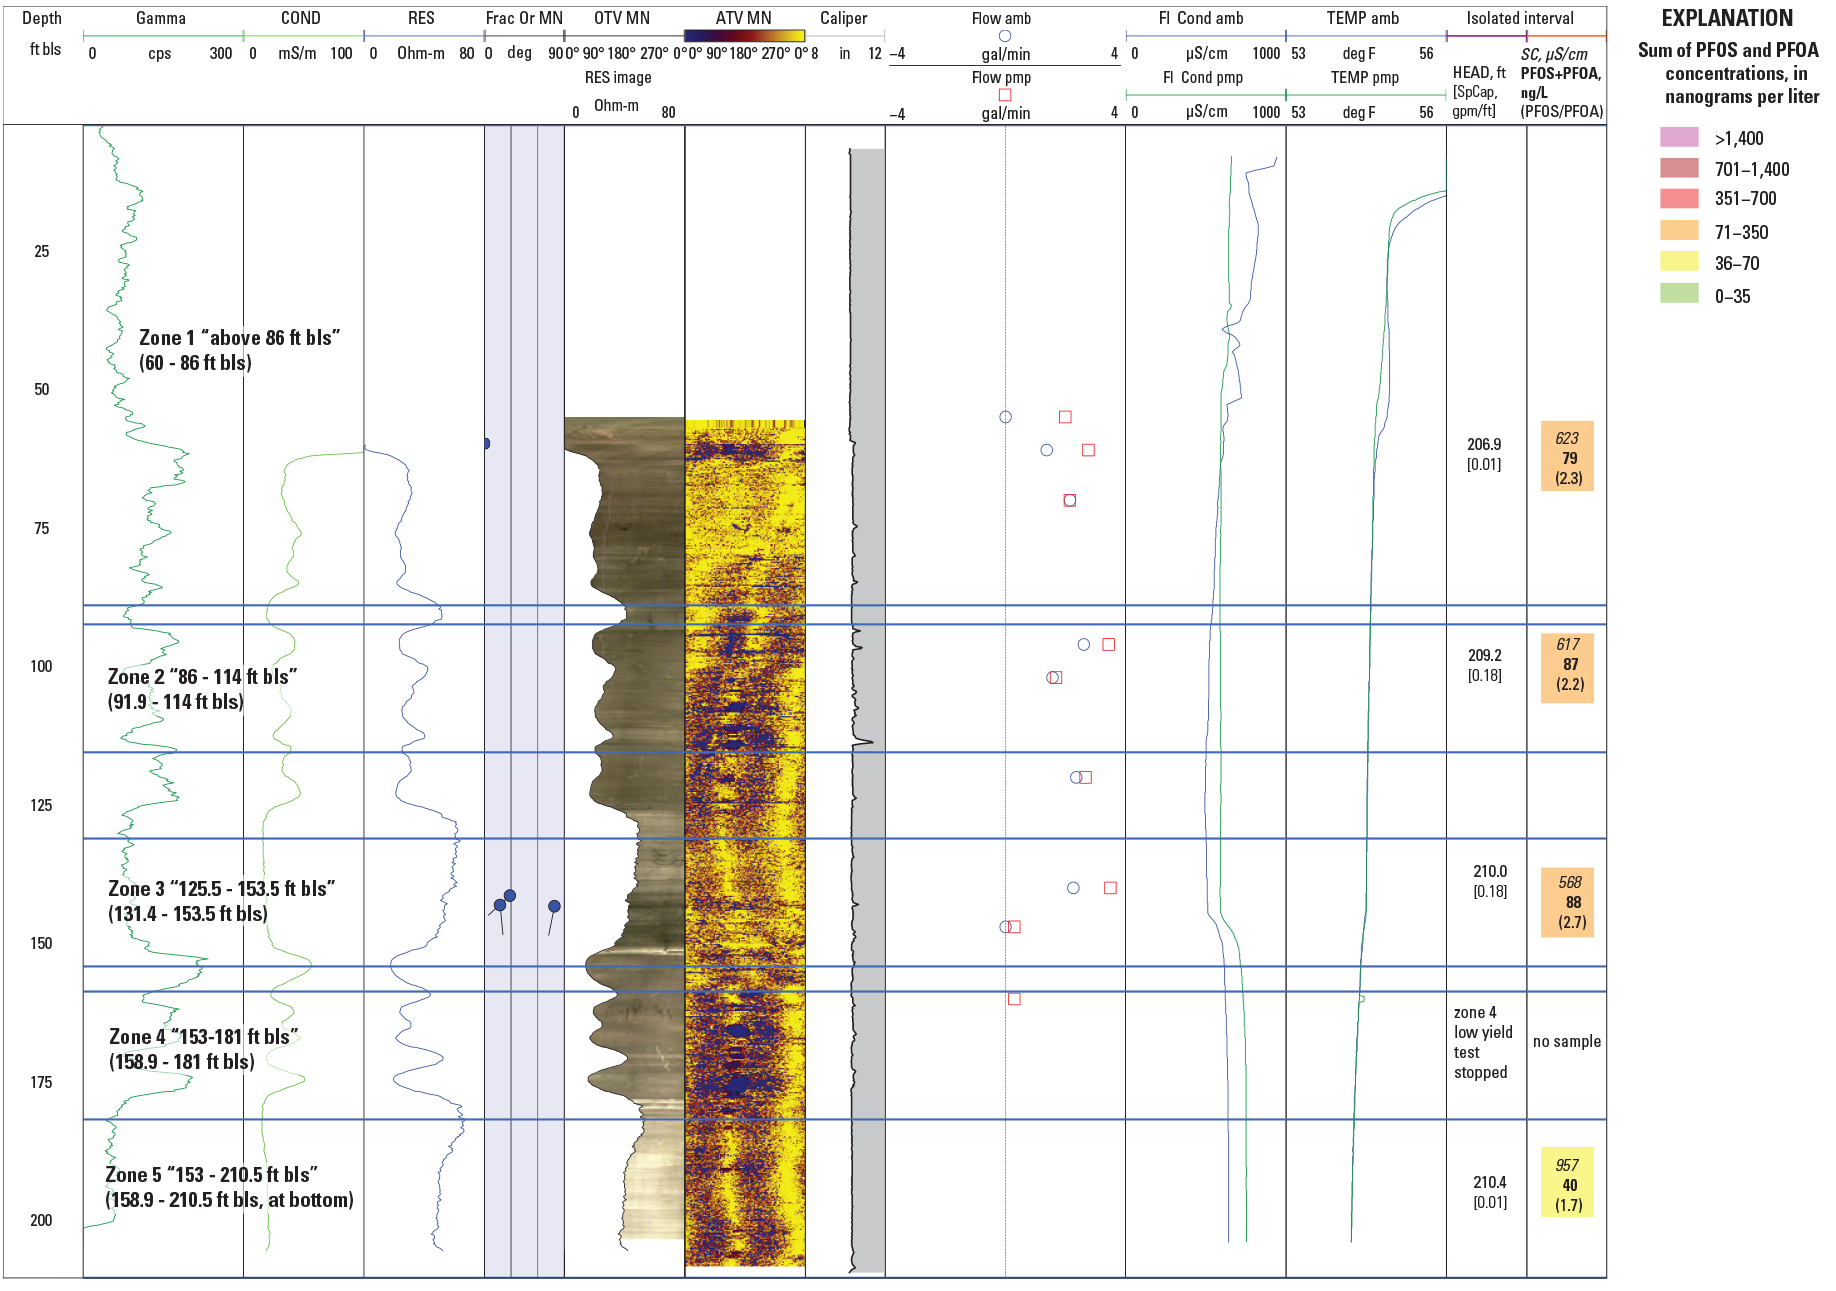
Geophysical logs for, and selected physical and chemical results of, August–September 2019 aquifer-interval-isolation (packer) tests in, borehole BK–2698 (well 8), near the former Naval Air Warfare Center Warminster, Bucks County, Pennsylvania, including isolated-interval hydraulic head (in feet above North American Vertical Datum of 1988 [NAVD 88]), specific capacity (in gallons per minute per foot [gpm/ft]),water-sample specific conductance (in microsiemens per centimeters [µS/cm]), summed concentrations of perfluorooctanesulfonic acid (PFOS) and perfluorooctanoic acid (PFOA) (in nanograms per liter [ng/L]), and PFOS to PFOA mass ratio. PFOS and PFOA data from Battelle (2021). Isolated intervals are depicted by blue lines, with depths to top and bottom of interval in feet below land surface (ft bls). Name of test for each interval includes zone number and “depths to top of bladder in upper and lower packer.” Estimated depths to top and bottom of tested interval in parentheses and also listed in table 10. See table 2 for explanation of log abbreviations.
Table 10.
Hydraulic head, specific capacity, and selected water quality for aquifer intervals isolated by packers in tests of well BK–2698 (well 8) near the former Naval Air Warfare Center Warminster, Bucks County, Pennsylvania, August 28–September 4, 2019.[PFOS and PFOA data from Battelle (2021). Tested isolated interval identified by zone (z) number, listed with depths to top of upper packer bladder and to top and bottom of tested interval. Selected water quality includes field parameters and results of laboratory analysis for major ions, boron, stable isotopes of water (δ2H, δ18O), perfluorooctanesulfonic acid (PFOS) and perfluorooctanoic acid (PFOA). Hydraulic head for isolated interval estimated from postinflation static water level. See table 1.4 in appendix 1 for more information about water levels and pumping rates for tests. Dates shown as month/date/year. ft, feet; bls, below land surface; WL, water-level altitude; NAVD 88, North American Vertical Datum of 1988; Spec. cap., specific capacity; gpm/ft, gallons per minute per foot; DO, dissolved oxygen; mg/L, milligrams per liter; std, standard; SC, specific conductance; µS/cm, microsiemens per centimeter; °C, degree Celsius; Temp, water temperature; PFOS, perfluorooctanesulfonic acid; ng/L, nanograms per liter; PFOA, perfluorooctanoic acid; Ca, calcium; Mg, magnesium; K, potassium; Na, sodium; ANC, acid neutralizing capacity; CaCO3, calcium carbonate; Cl, chloride; F, fluoride; SiO2, silica; SO4, sulfate; B, boron; µg/L, micrograms per liter; δ 2H, delta hydrogen-2; per mil, parts per thousand; δ 18O, delta oxygen-18; z, zone; <, less than; --, no data]
Hydraulic heads as inferred from postinflation static water levels were highest (water-level altitudes of about 214.3 and 210.4 ft above NAVD 88, respectively) in the deepest intervals (zones 4 [“153–181 ft bls”; open 158.9–181 ft bls] and 5 [“153–210.5 ft bls”; open 158.9–210.5 ft bls]) and lowest (water-level altitude of 206.9 ft above NAVD 88) in the shallowest interval (zone 1, “above 86 ft bls”; open 60–86 ft bls) (table 10), indicating potential for upward flow in the borehole, consistent flow direction measured at the time of logging. The sum of specific-capacity values from packer tests of 0.59 (gal/min)/ft was about 4 times less than the specific capacity of 2.47 (gal/min)/ft estimated from pumping during logging (tables 4 and 10); reasons for this difference in values are not known but could indicate an error in value from logging or exclusion of a water-producing feature from packer tests. The intervals from about 92.8 to 114 ft bls (zone 2) and 131.4 to 153.5 (zone 3) had the highest specific capacity of about 0.18 (gal/min)/ft of intervals tested in borehole BK–2698 (well 8) (table 10), consistent with logging indication of fractures near 145 ft bls being most hydraulically active and identification of probable water-bearing fractures near 110 ft bls (Senior and others, 2021).
Field water quality indicated that the water from the deepest interval, zone 5 (“153–210.5 ft bls”; open 158.9–210.5 ft bls), had the highest specific conductance (957 µS/cm); and water from the shallower intervals, zones 1–3, had lower values of specific conductance ranging from 568 to 623 µS/cm that decreased with depth (table 10; fig. 15), which is generally consistent with geophysical logging results. Overall, dissolved oxygen levels were relatively low (0.4–1.1 mg/L) and pH was near neutral (7.4–7.5) in water from tested intervals.
The vertical distribution of chloride concentrations was not directly related to specific conductance in water samples, as the interval with the highest specific conductance, zone 5 (“153–210.5 ft bls”; open 158.9–210.5 ft bls), had the lowest chloride concentrations but the highest calcium and sulfate concentrations, with sulfate concentrations of 382 mg/L exceeding the SMCL of 250 mg/L (table 10). Sulfate concentrations in samples from the four tested intervals in well BK–2698 (well 8) were among the highest (90th percentile) in samples from all boreholes (tables 5 and 10) and contributed proportionately to measured specific conductance. Summed concentrations of PFOA and PFOS were greater than the LHA of 70 ng/L in water from three shallowest intervals tested, ranging from 88 ng/L in zone 3 (“123.5-153.5 ft bls”; open 129.4–153.5 ft bls) to 79 ng/L in zone 1 (“above 86 ft bls”; open 60–86 ft bls). Summed PFOA and PFOS concentrations were higher in samples with higher chloride concentrations (fig. 6B).
The water samples from isolated intervals with the highest chloride and PFAS concentrations plot as calcium-bicarbonate-chloride type waters, as shown in the Piper diagram in figure 16. The water sample with the lowest summed concentrations of PFOS and PFOA (40 ng/L) was from the deepest interval tested, zone 5 (“153–210.5 ft bls”; open 158.9–210.5 ft bls), had the highest calcium and sulfate concentrations, and plots as a calcium-sulfate type water.
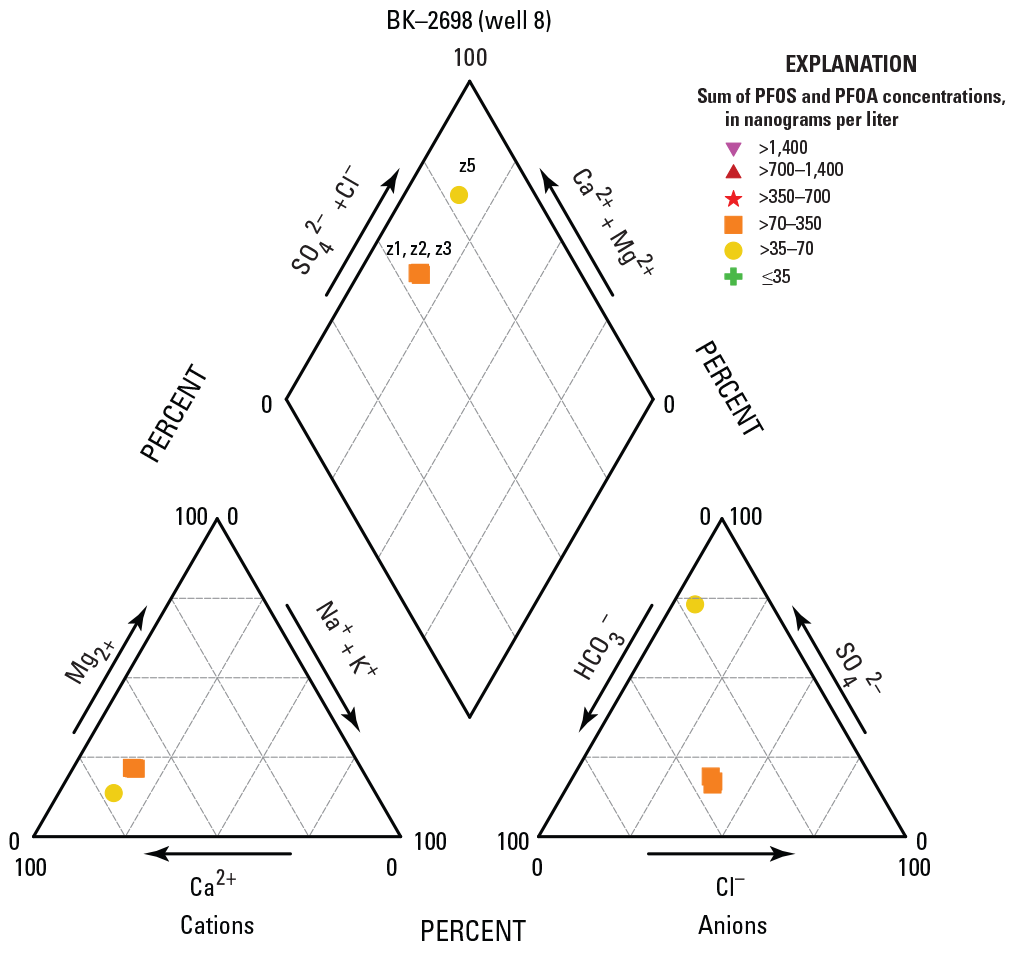
Piper diagram showing relative major ion composition of water samples collected from four isolated intervals in borehole BK–2698 (well 8), near the former Naval Air Warfare Center Warminster, Bucks County, Pennsylvania, August–September 2019, with symbols depicting the range of summed perfluorooctanesulfonic acid (PFOS) and perfluorooctanoic acid (PFOA) concentrations. Cations include calcium (Ca2+), magnesium (Mg2+), sodium (Na+), and potassium (K+). Anions include bicarbonate (HCO3-), chloride (Cl-), and sulfate (SO42-). Intervals labeled by zone (z) number.
BK–2861 (well 11)
BK–2861 (well 11) is a 10-in. diameter, 160-ft deep unused former production well with 83 ft of casing, in which open-borehole static water levels were 5.70 ft bls at the time of logging (table 4) and about 3.3–3.4 ft bls at the time of packer testing (appendix 1, table 1.5). Geophysical and borehole video logs collected by USGS in August and September 2019 (Senior and others, 2021) indicated several low- and high-angle water-bearing fractures throughout the borehole, with fractures near 138 and 150 ft bls appearing to be the most hydraulically active; upward flow at depths of about 128 and 144 ft bls in the borehole was measured under ambient conditions at the time of logging. Interpretation of logs previously collected by USGS in the borehole indicated major fractures at 119, 138, and 145 ft bls (Bird, 1998). Three intervals were selected for testing using straddle packers with a spacing of 24.9 ft between tops of the upper and lower bladders and an estimated test-interval length of about 19.0 ft between packers, assuming complete seals of 5.9-ft long upper and lower packer bladders; for the test of the deepest interval, only the upper packer was inflated (fig. 17; tables 4 and 11; appendix 1, table 1.5). Hydraulic connection to adjacent intervals, as indicated by drawdown in intervals adjacent to the pumped isolated interval, was observed for tests of the three intervals (appendix 1, table 1.5).
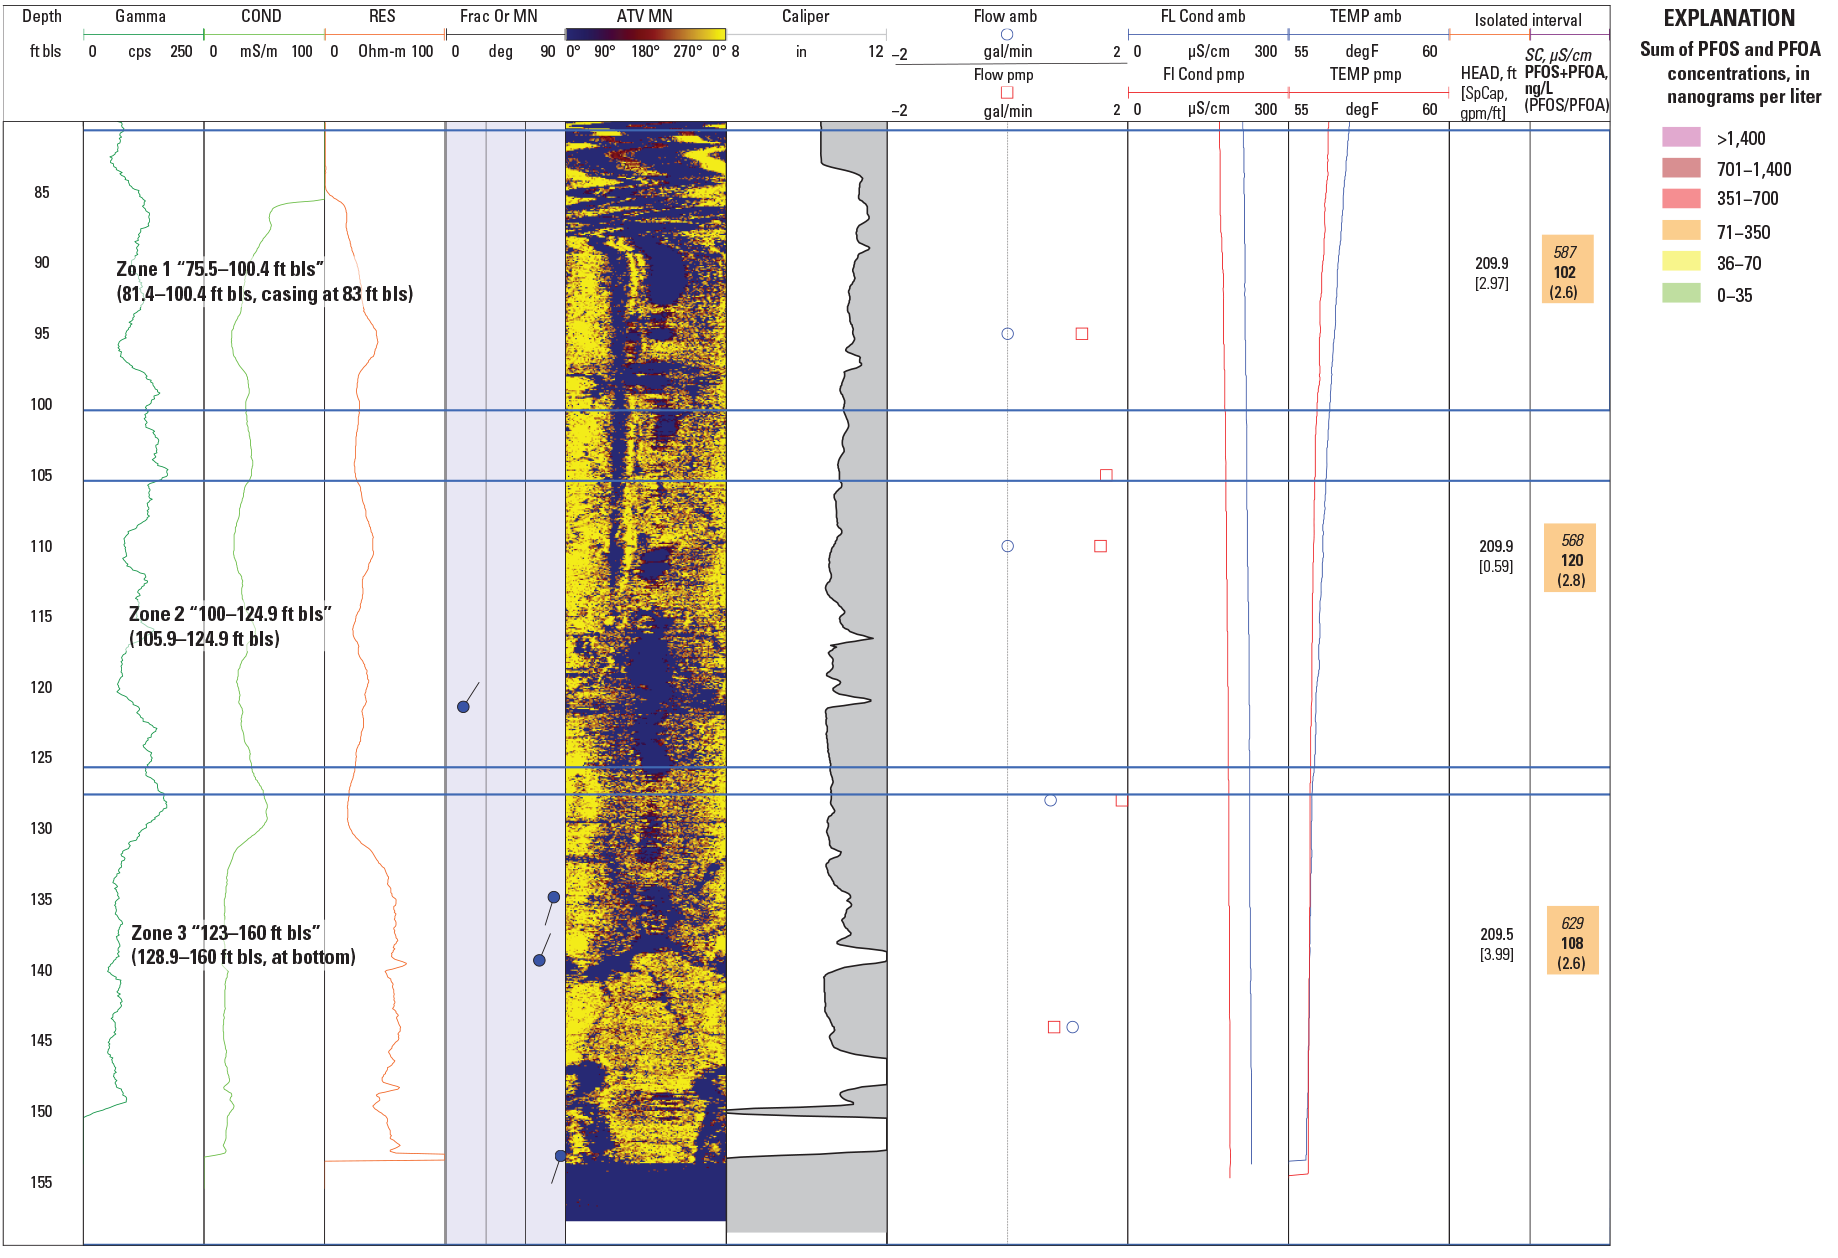
Geophysical logs for, and selected physical and chemical results of, August 2019 aquifer-interval-isolation (packer) tests in, borehole BK–2861 (well 11), near the former Naval Air Warfare Center Warminster, Bucks County, Pennsylvania, including isolated-interval hydraulic head (in feet above North American Vertical Datum of 1988 [NAVD 88]), specific capacity (in gallons per minute per foot [gpm/ft]),water-sample specific conductance (in microsiemens per centimeters [µS/cm]), summed concentrations of perfluorooctanesulfonic acid (PFOS) and perfluorooctanoic acid (PFOA) (in nanograms per liter [ng/L]), and PFOS to PFOA mass ratio. PFOS and PFOA data from Battelle (2021). Isolated intervals are depicted by blue lines, with depths to top and bottom of interval in feet below land surface (ft bls). Name of test for each interval includes zone number and “depths to top of bladder in upper and lower packer.” Estimated depths to top and bottom of tested interval in parentheses and also listed in table 11. See table 2 for explanation of log abbreviations.
Table 11.
Hydraulic head, specific capacity, and selected water quality for aquifer intervals isolated by packers in tests of well BK–2861 (well 11) near the former Naval Air Warfare Center Warminster, Bucks County, Pennsylvania, August 26–27, 2019.[PFOS and PFOA data from Battelle (2021). Tested isolated interval identified by zone (z) number, listed with depths to top of upper packer bladder and to top and bottom of tested interval. Selected water quality includes field parameters and results of laboratory analysis for major ions, boron, stable isotopes of water (δ2H, δ18O), perfluorooctanesulfonic acid (PFOS) and perfluorooctanoic acid (PFOA). Hydraulic head for isolated interval estimated from postinflation static water level. See table 1.5 in appendix 1 for more information about water levels and pumping rates for tests. Dates shown as month/date/year. ft, feet; bls, below land surface; WL, water-level altitude; NAVD 88, North American Vertical Datum of 1988; Spec. cap., specific capacity; gpm/ft, gallons per minute per foot; DO, dissolved oxygen; mg/L, milligrams per liter; std, standard; SC, specific conductance; µS/cm, microsiemens per centimeter; °C, degree Celsius; Temp, water temperature; PFOS, perfluorooctanesulfonic acid; ng/L, nanograms per liter; PFOA, perfluorooctanoic acid; Ca, calcium; Mg, magnesium; K, potassium; Na, sodium; ANC, acid neutralizing capacity; CaCO3, calcium carbonate; Cl, chloride; F, fluoride; SiO2, silica; SO4, sulfate; B, boron; µg/L, micrograms per liter; δ 2H, delta hydrogen-2; per mil, parts per thousand; δ 18O, delta oxygen-18; z, zone]
Hydraulic heads as inferred from postinflation static water levels were similar in value for all three tested intervals (table 11), reflecting hydraulic connections between tested isolated intervals. The sum of specific-capacity values from packer test of about 7.55 (gal/min)/ft was about 2 times greater than the specific capacity of 3.33 (gal/min)/ft estimated from pumping during logging (tables 4 and 11), due to hydraulic connections between tested and adjacent intervals (appendix 1, table 1.5) that resulted in specific-capacity values representing larger sections of the borehole (aquifer) than each isolated interval. The interval spanning depths from about 128.9 to 160 ft bls (zone 3) had the highest specific capacity of about 3.99 (gal/min)/ft of intervals tested in borehole BK–2861 (well 11) (table 11), consistent with logging indication of fractures near 138 and 150 ft bls being most hydraulically active (Senior and others, 2021).
Field water quality indicated that the water from the three isolated intervals had relatively similar specific conductance (568 to 629 µS/cm), (table 11; fig. 17), which is generally consistent with geophysical logging results. Overall, dissolved oxygen levels were very low (less than 0.1–0.1 mg/L) and pH was near neutral (7.3–7.4) in water from tested intervals.
The vertical distribution of chloride concentrations appeared related to specific conductance in water samples, with zone 2 (“100–124.9 ft bls”; open 105.9–124.9 ft bls) having the lowest values and zone 3 (“123–160 ft bls”; open 128.9–160 ft bls) having the highest values for specific conductance and chloride concentrations (although range in values was small) (table 11). Like water from nearby borehole BK–2698 (well 8), sulfate concentrations in samples from all three tested intervals in well BK–2861 (well 11) were among the highest (90th percentile) in samples from all boreholes (tables 5 and 11). Summed concentrations of PFOA and PFOS were similar in value and greater than the LHA of 70 ng/L in water from all three intervals tested, ranging from 102 ng/L in zone 1 (“75.5 to 100.4 ft bls”; open 81.4-100.4 ft bls) to 120 ng/L in zone 2 (“100–124.9 ft bls”; open 105.9-124.9 ft bls).
The water samples from the three intervals have similar chemical compositions and PFAS concentrations and all plot as calcium-bicarbonate-chloride type waters with some contribution of sulfate, as shown in figure 18. Overall, the lack of differences in hydraulic head, observed hydraulic connections among isolated intervals, and similar chemical composition of samples from three isolated intervals in BK–2861 (well 11) reflects interconnections through vertical fractures in and near the 160-ft deep borehole.
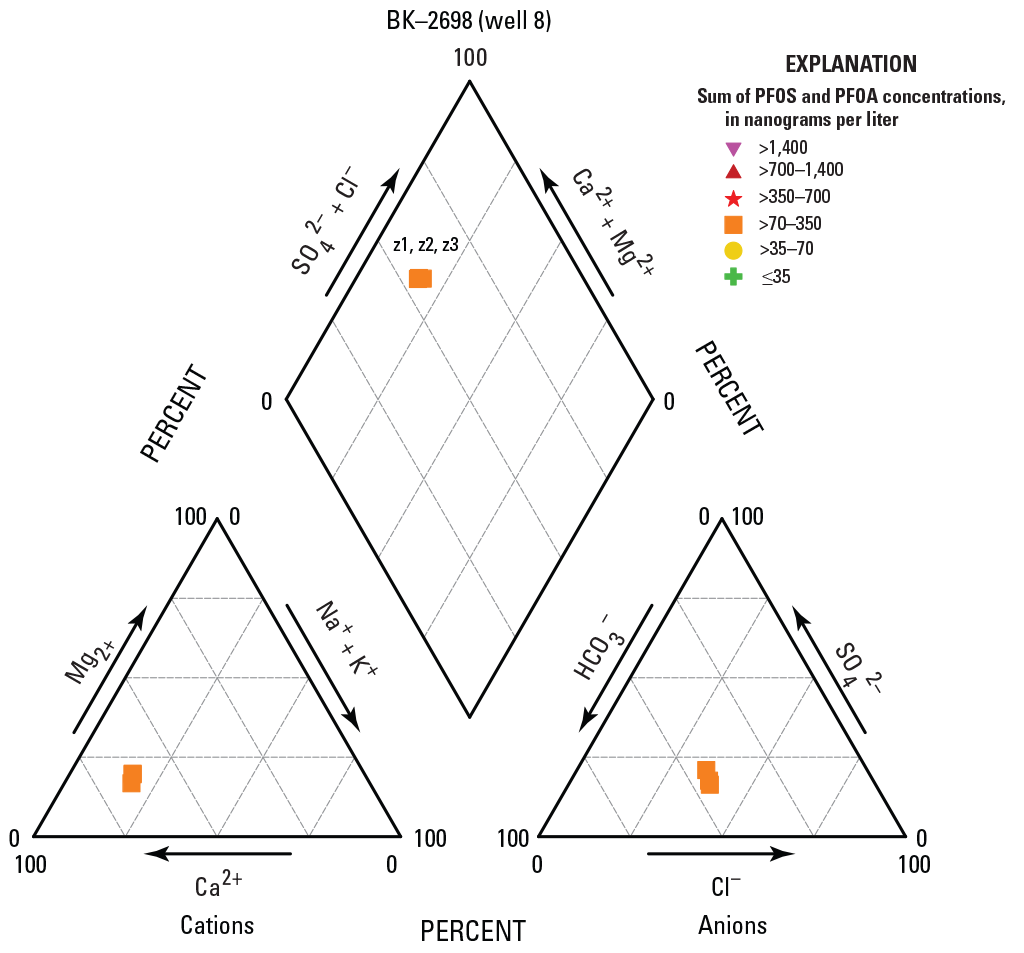
Piper diagram showing relative major ion composition of water samples collected from three isolated intervals in borehole BK–2861 (well 11), near the former Naval Air Warfare Center Warminster, Bucks County, Pennsylvania, August 2019, with symbols depicting the range of summed perfluorooctanesulfonic acid (PFOS) and perfluorooctanoic acid (PFOA) concentrations. Cations include calcium (Ca2+), magnesium (Mg2+), sodium (Na+), and potassium (K+). Anions include bicarbonate (HCO3-), chloride (Cl-), and sulfate (SO42-). Intervals labeled by zone (z) number.
BK–2869 (well 9)
BK–2869 (well 9) is a 10- to 12-in. diameter, 315-ft deep unused former production well with 63 ft of casing, in which open-borehole static water levels were 19.98 ft bls at the time of logging (table 4) and about 20.3–23.1 ft bls at the time of packer testing (appendix 1, table 1.6). The borehole diameter is 12 in. from the top of the borehole to a depth of 85 ft bls. Below that depth, the diameter is 10 in. Geophysical and borehole video logs collected by USGS in June 2019 (Senior and others, 2021) indicated several low-angle or bedding-plane water-bearing fractures throughout the borehole, with fractures between 63 and 85 ft bls appearing to be the most hydraulically active; downward flow in the interval from about 80 to 220 ft bls was measured at the time of logging. Ten intervals were selected for testing using straddle packers with a spacing of 22.2 ft between tops of the upper lower bladders and an estimated test-interval length of about 16.3 ft between packers, assuming complete seals of 5.9-ft long upper and lower packer bladders; however, complete tests through sample collection were only done for eight intervals as two intervals (zones 3 and 9) were too low yielding (fig. 19; tables 4 and 12; appendix 1, table 1.6). Little to no hydraulic connection to adjacent intervals was observed for tests of most intervals, as indicated by small drawdown in intervals adjacent to the pumped isolated interval, although some connection between the pumped isolated interval and the interval below the lower packer was indicated by measured water levels in tests of zones 4 (“143.5–165.7 ft bls”; open 149.4–165.7 ft bls) and 7 (“213–235.2 ft bls”; open 218.9–235.2 ft bls) (appendix 1, table 1.6).
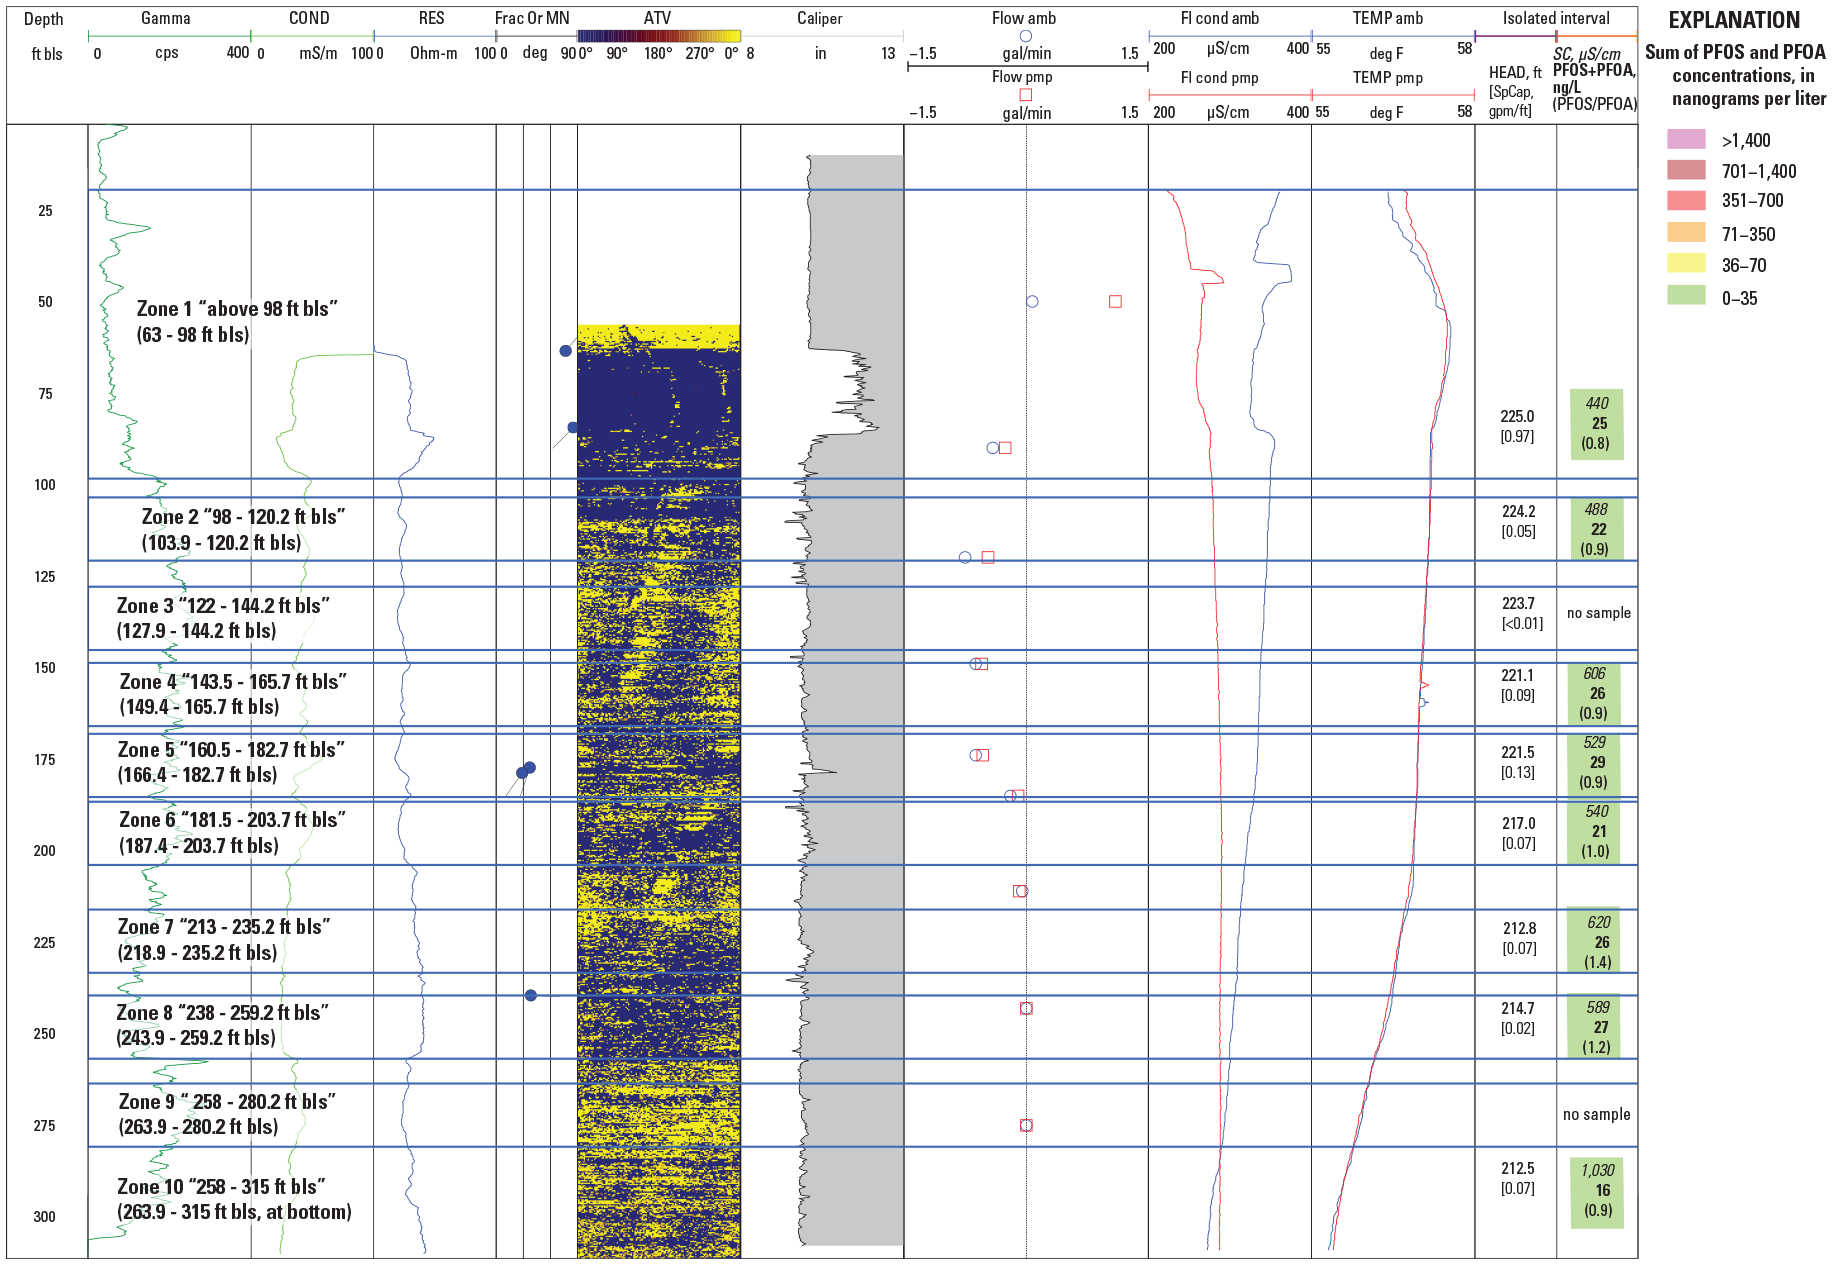
Geophysical logs for, and selected physical and chemical results of, July–August 2019 aquifer-interval-isolation (packer) tests in, borehole BK–2869 (well 9), near the former Naval Air Warfare Center Warminster, Bucks County, Pennsylvania, including isolated-interval hydraulic head (in feet above North American Vertical Datum of 1988 [NAVD 88]), specific capacity (in gallons per minute per foot [gpm/ft]),water-sample specific conductance (in microsiemens per centimeters [µS/cm]), summed concentrations of perfluorooctanesulfonic acid (PFOS) and perfluorooctanoic acid (PFOA) (in nanograms per liter [ng/L]), and PFOS to PFOA mass ratio. PFOS and PFOA data from Battelle (2021). Isolated intervals are depicted by blue lines, with depths to top and bottom of interval in feet below land surface (ft bls). Name of test for each interval includes zone number and “depths to top of bladder in upper and lower packer.” Estimated depths to top and bottom of tested interval in parentheses and also listed in table 12. See table 2 for explanation of log abbreviations.
Table 12.
Hydraulic head, specific capacity, and selected water quality for aquifer intervals isolated by packers in tests of well BK–2869 (well 9) near the former Naval Air Warfare Center Warminster, Bucks County, Pennsylvania, July 31–August 7, 2019. Tested isolated interval identified by zone (z) number, listed with depths to top of upper packer bladder and to top and bottom of tested interval. Selected water quality includes field parameters and results of laboratory analysis for major ions, boron, stable isotopes of water (δ2H, δ18O), perfluorooctanesulfonic acid (PFOS) and perfluorooctanoic acid (PFOA). PFOS and PFOA data from Battelle (2021). Hydraulic head for isolated interval estimated from post-inflation static water level. See table 1.6 in Appendix 1 for more information about water levels, pumping rates for tests.[PFOS and PFOA data from Battelle (2021). Tested isolated interval identified by zone (z) number, listed with depths to top of upper packer bladder and to top and bottom of tested interval. Selected water quality includes field parameters and results of laboratory analysis for major ions, boron, stable isotopes of water (δ2H, δ18O), perfluorooctanesulfonic acid (PFOS) and perfluorooctanoic acid (PFOA). See table 1.6 in appendix 1 for more information about water levels and pumping rates for tests. Dates shown as month/date/year. Ft, feet; bls, below land surface; WL, water-level altitude; NAVD 88, North American Vertical Datum of 1988; Spec. cap., specific capacity; gpm/ft, gallons per minute per foot; DO, dissolved oxygen; mg/L, milligrams per liter; std, standard; SC, specific conductance; µS/cm, microsiemens per centimeter; °C, degrees Celsius; Temp, water temperature; PFOS, perfluorooctanesulfonic acid; ng/L, nanograms per liter; PFOA, perfluorooctanoic acid; Ca, calcium; Mg, magnesium; K, potassium; Na, sodium; ANC, acid neutralizing capacity; CaCO3, calcium carbonate; Cl, chloride; F, fluoride; SiO2, silica; SO4, sulfate; B, boron; µg/L, micrograms per liter; δ 2H, delta hydrogen-2; per mil, parts per thousand; δ 18O, delta oxygen-18; z, zone; <, less than; --, no data]
Hydraulic heads as inferred from postinflation static water levels were highest (water-level altitudes of about 224 to 225 ft above NAVD 88) in the shallowest intervals above 144 ft bls (zones 1, 2, and 3) and lowest (water-level altitude of 212.7 ft above NAVD 88) in the deepest interval (zone 10 [“258–315 ft bls”; open 266.9–315 ft bls] at bottom of borehole) (table 12), indicating potential for downward flow in the borehole, consistent with the flow direction measured at the time of logging. The sum of specific-capacity values from packer tests of 2.46 (gal/min)/ft was about 2 times greater than the specific capacity of 1.03 (gal/min)/ft estimated from pumping during logging (tables 4 and 12), possibly due to some overestimation of specific capacity for isolated intervals with hydraulic connections to adjacent intervals and (or) related to measurement uncertainty of estimates from logging (appendix 1, table 1.5). The shallowest interval, zone 1 (“above 98 ft bls”; open 63–98 ft bls) had the highest specific capacity of about 0.97 (gal/min)/ft of intervals tested in borehole BK–2689 (well 9) (table 12), consistent with logging indication of fractures above 85 ft bls being most hydraulically active (Senior and others, 2021).
Field water quality indicated that specific conductance generally increased with depth, with water from the deepest interval, zone 10 (“258–315 ft bls”; open 266.9–315 ft bls) having the highest specific conductance of 1,030 µS/cm (table 12; fig. 19), a pattern that was not measured during geophysical logging under open-borehole ambient conditions. Overall, dissolved oxygen concentrations were moderate to low (6.0–1.1 mg/L) and generally decreased with depth. The pH was slightly lower than neutral (6.0–6.7) in water from tested intervals.
The vertical distribution of chloride concentrations was not strongly related to specific conductance in water samples, as the interval with the highest specific conductance, zone 10, had the lowest chloride concentrations but the highest calcium and sulfate concentrations, with sulfate concentrations of 345 mg/L exceeding the EPA SMCL of 250 mg/L for drinking water (U.S. Environmental Protection Agency, 2018; table 12). Sulfate concentrations in samples from the three deepest zones (7, 8, and 10) in well BK–2869 (well 9) (table 12) were among the highest (90th percentile) in samples from all boreholes (table 5) and contribute proportionately to measured specific conductance. Summed concentrations of PFOA and PFOS were similar in value and less than the LHA of 70 ng/L in water from all intervals tested, ranging from about 16 ng/L in zone 10 (“258–315 ft bls”; open 266.9–315 ft bls) to about 29 ng/L in zone 5 (“160.5–182.7 ft bls”; open 166.4–182.7 ft bls). Summed PFOA and PFOS concentrations were lowest in samples with the lowest chloride concentrations (from zone 10) but did not show a strong relation to chloride at higher concentrations (fig. 6B), although the range in both PFAS and chloride concentrations in water from the isolated intervals was small (table 12).
The water samples from isolated intervals with the highest chloride and PFAS concentrations plot as calcium-bicarbonate-chloride type waters, as shown in figure 20. The sample with the lowest summed concentrations of PFOS and PFOA was from the deepest interval tested, zone 10 (“258–315 ft bls”; open 266.9–315 ft bls), which had the highest calcium and sulfate concentrations and plots as a calcium-sulfate type water.
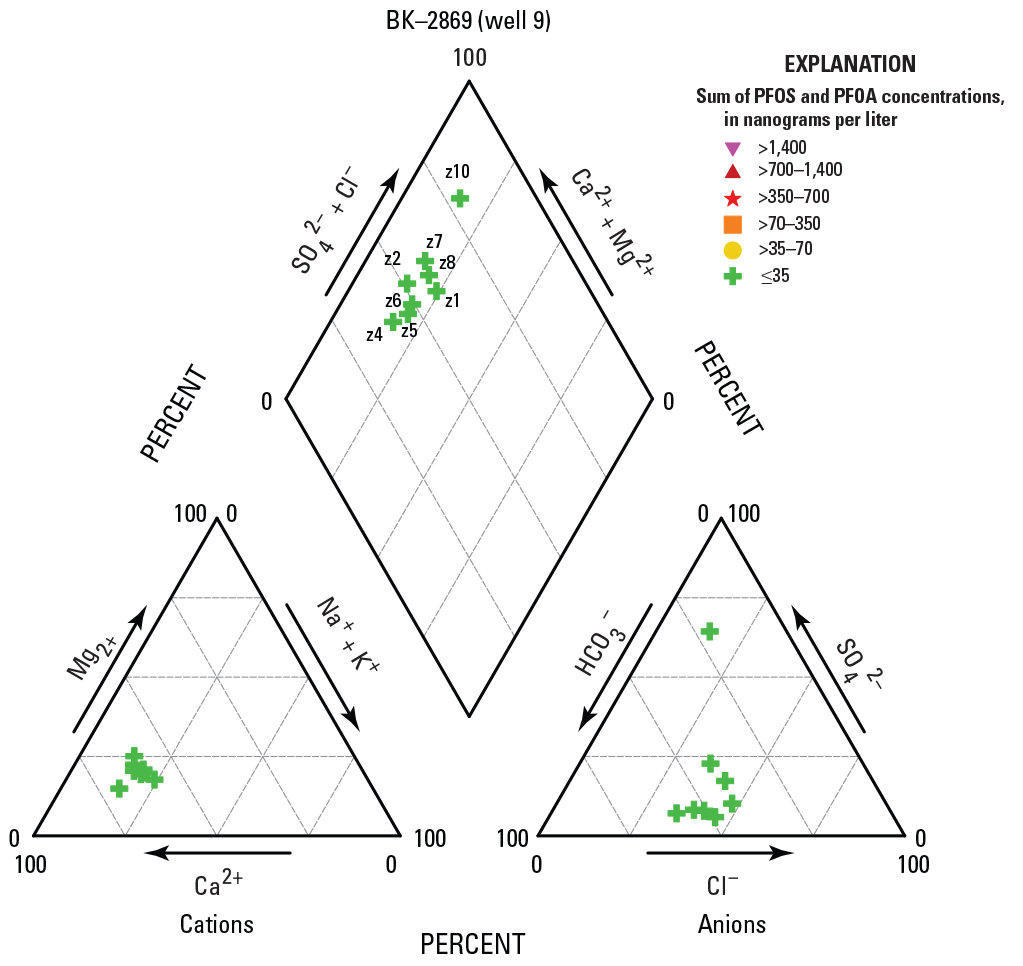
Piper diagram showing relative major ion composition of water samples collected from eight isolated intervals in borehole BK–2869 (well 9), near the former Naval Air Warfare Center Warminster, Bucks County, Pennsylvania, July–August 2019, with symbols depicting the range of summed perfluorooctanesulfonic acid (PFOS) and perfluorooctanoic acid (PFOA) concentrations. Cations include calcium (Ca2+), magnesium (Mg2+), sodium (Na+), and potassium (K+). Anions include bicarbonate (HCO3-), chloride (Cl-), and sulfate (SO42). Intervals labeled by zone (z) number.
The downward vertical gradients in the open borehole BK–2869 (well 9) may have resulted in transport of water from shallow intervals to deeper intervals, at least up to about 240 ft bls under ambient conditions. However, water from the deepest interval tested (zone 10, “258–315 ft bls”; open 266.9–315 ft bls) had a different chemical composition, with higher calcium and sulfate concentrations and lower summed PFOA and PFOS concentrations, than shallower intervals, indicating only, at most, some contributions of water from shallower intervals. The composition of water (calcium-sulfate-type) from the deepest interval (zone 10) in BK–2869 (well 9) is like that of water from the deepest interval in nearby well BK–2689 (well 8) (zone 5, “153–210.5 ft bls”; open 158.9–210.5ft bls), and could reflect the presence of minerals, such as glauberite reported to be a possible source of elevated calcium sulfate in the Stockton Formation (Greenman, 1955, p. 30), gypsum which has been identified in geologic units overlying the Stockton Formation (El Tabakh and Schreiber, 1998), or sulfides reported to be present in the Stockton Formation (Sloto and Grazul, 1995, p. 14), in that part of the aquifer.
BK–2870 (well 10)
BK–2870 (well 10) is a 10-in. diameter, 270-ft deep unused former production well with 61 ft of casing, in which open-borehole static water levels were 29.38 ft bls at the time of logging and alternate vertical profiling (table 4). Geophysical and borehole video logs collected by USGS in September 2019 (Senior and others, 2021) indicated several low- and high-angle water-bearing fractures throughout the borehole, with fractures above 85 ft bls appearing to be the most hydraulically active. Upward flow in the intervals from about 258 to 118 ft bls, a depth where outflow appears to occur, and from about 85 to 62 ft bls under ambient conditions was measured at the time of logging (Senior and others, 2021). A plastic 2-in. pipe left in the borehole is visible on borehole video logs at about 63 ft bls. The presence of the pipe precluded placement of packers and the location of the well restricted access for the vehicle used for packer deployment. Given these limitations, and the upward borehole flow directions, point samples were collected at discrete depths under ambient (140 and 80 ft bls) and pumping (140, 100, and 65 ft bls) conditions, to support vertical profiling. The depths selected for discrete-point sampling bracket the range of depths where inflow was estimated to occur in the borehole (fig. 21; table 13).
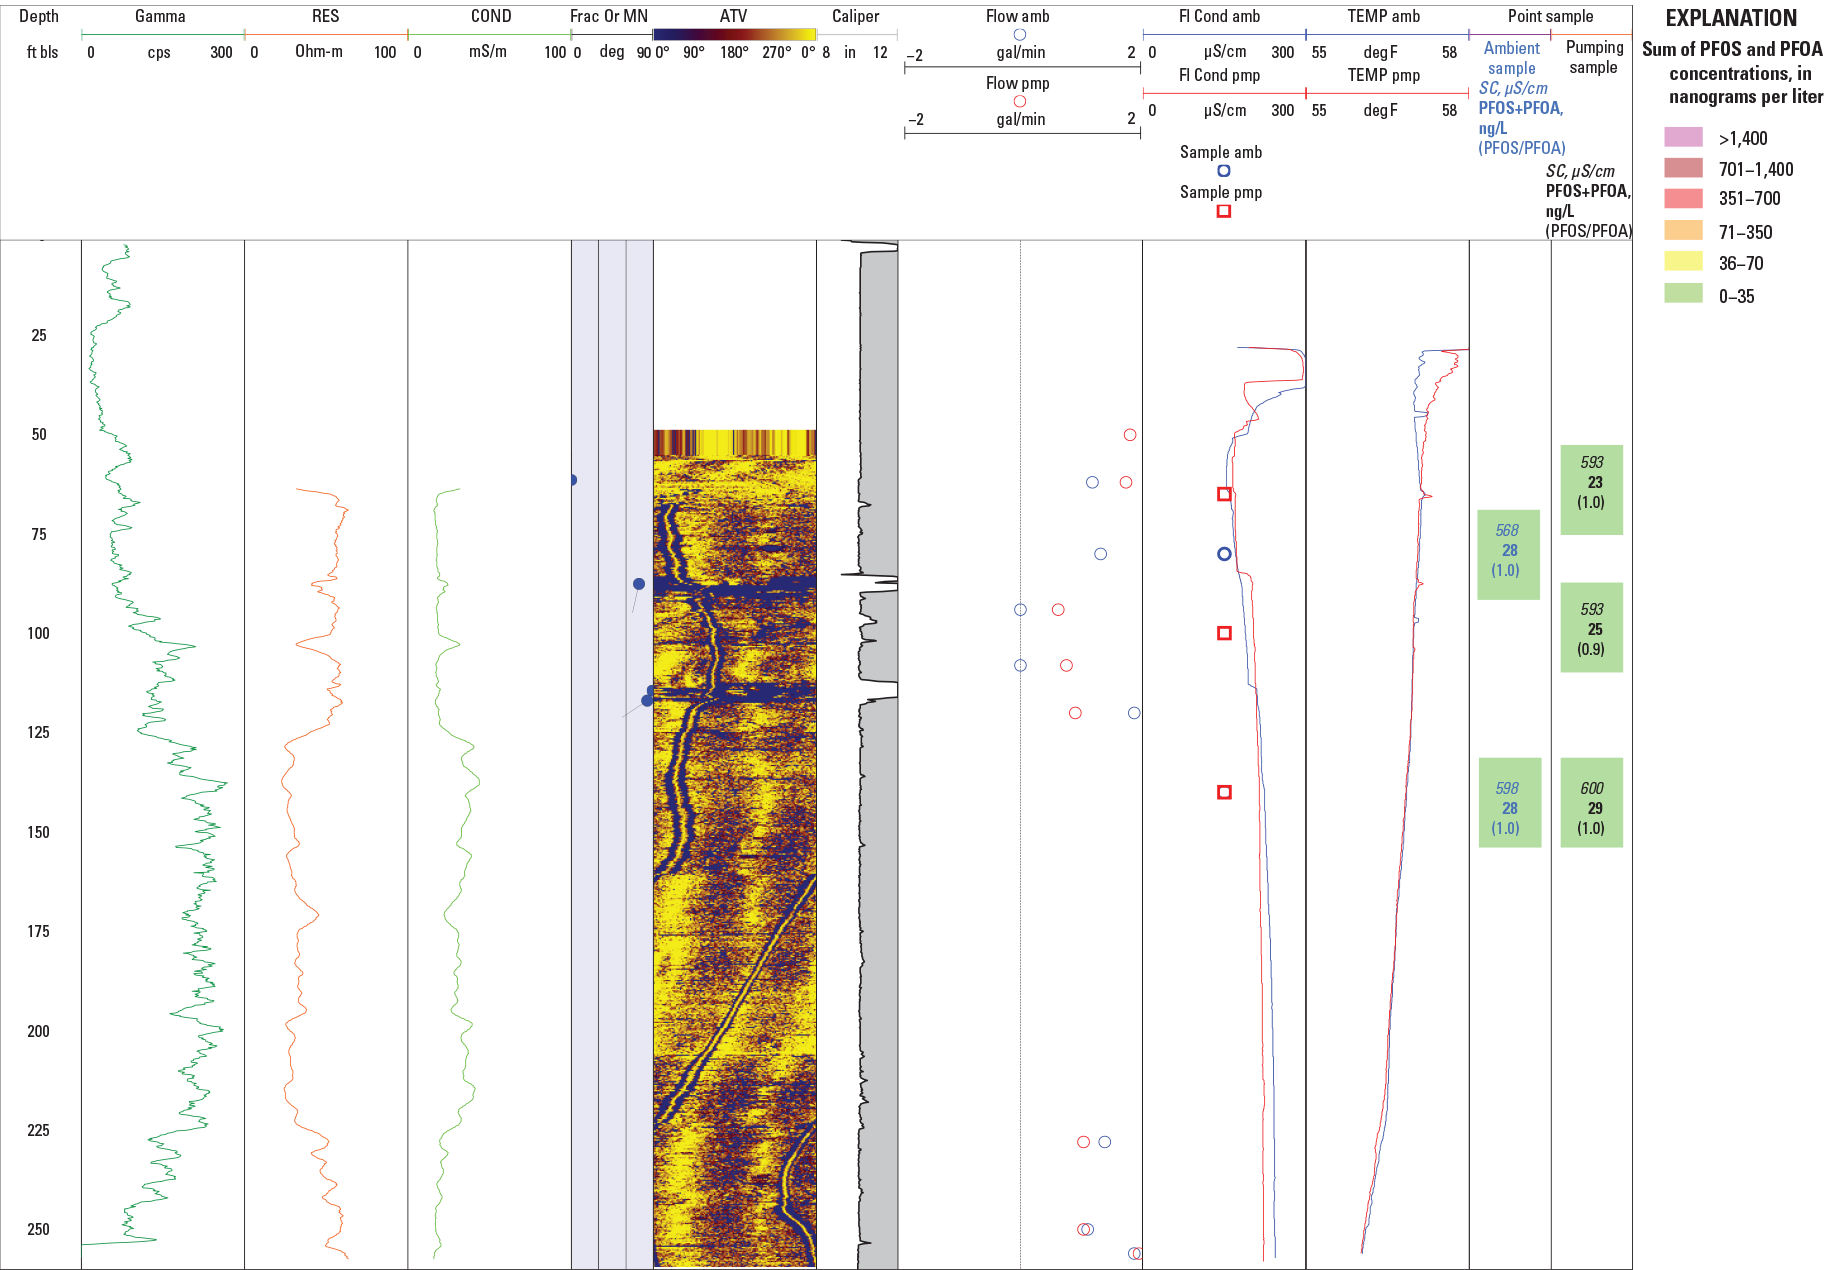
Geophysical logs for, and selected physical and chemical results of September 2019 point samples collected at selected depths in, borehole BK–2870 (well 10), near the former Naval Air Warfare Center Warminster, Bucks County, Pennsylvania, including point-water-sample specific conductance (in microsiemens per centimeters [µS/cm]), summed concentration of perfluorooctanesulfonic acid (PFOS) and perfluorooctanoic acid (PFOA) (in nanograms per liter [ng/L]), and PFOS to PFOA mass ratio. PFOS and PFOA data from Battelle (2021). See table 2 for explanation of log abbreviations.
Table 13.
Borehole flow and selected water quality for vertical profiling of well BK–2870 (well 10) near the former Naval Air Warfare Center Warminster, Bucks County, Pennsylvania, September 11, 2019.[PFOS and PFOA data from Battelle (2021). Selected water quality includes field parameters and results of laboratory analysis for stable isotopes of water (δ2H, δ18O), perfluorooctanesulfonic acid (PFOS), and perfluorooctanoic acid (PFOA). Dates shown as month/date/year. USGS, U.S. Geological Survey; ft, feet; bls, below land surface; gpm, gallons per minute; std, standard; SC, specific conductance; µS/cm, microsiemens per centimeter; °C, degree Celsius; δ 2H, delta hydrogen-2; per mil, parts per thousand; δ 18O, delta oxygen-18; PFOS, perfluorooctanesulfonic acid; ng/L, nanograms per liter; PFOA, perfluorooctanoic acid; gal/min, gallon per minute; --, no data]
Field water quality indicated that, under ambient conditions, the discrete-point sample collected 80 ft bls had lower specific conductance (568 µS/cm) than the deeper discrete-point sample collected at 140 ft bls (598 µS/cm), which is generally consistent with geophysical logging results (fig. 20; table 13). No laboratory analyses, other than those reported in table 13, were completed for the discrete-point samples. Summed concentrations of PFOA and PFOS were equal (28 ng/L) in both discrete-point samples collected under ambient conditions and were less than the LHA of 70 ng/L in discrete-point samples collected under both ambient and pumping conditions. For samples collected under pumping conditions (borehole pumped in casing below water level at 1.8 gal/min), summed concentrations of PFOA and PFOS were higher with depth, ranging from 29 ng/L at 140 ft bls to 23 ng/L at 65 ft bls, indicating that inflow from fractures at or near 85 ft bls has a dilutional effect, with lower PFAS concentrations than deeper fractures. The summed concentrations of PFOA and PFOS in inflow between discrete-depth points were not calculated using differences in measured borehole flow at discrete depths and associated point-sample concentrations because of uncertainty in flow measurements and apparent loss of flow from 140 to 100 ft bls (table 13) that affects conservation of mass calculations. Nevertheless, results of the discrete-point sampling indicate PFAS concentrations are greater below depths of 140 ft bls than at or above depths of 85 ft bls.
BK–3062 (well 15)
BK–3062 (well 15) is a 10-in. diameter, 400-ft deep unused test well with 93 ft of casing, in which open-borehole static water levels were 28.8 ft bls at the time of logging (table 4) and about 25.3–26.4 ft bls at the time of packer testing (appendix 1, table 1.7). Geophysical and borehole video logs collected by USGS in November 2017 (Senior and others, 2021) indicated several low-angle bedding-plane and a few high-angle water-bearing fractures throughout the borehole, with fractures near 95 and 185 ft bls appearing to be the most hydraulically active. Downward flow below about 280 ft bls, but no flow above 280 ft bls, was measured under ambient conditions at the time of logging. Eight intervals were selected for testing using straddle packers with a spacing of 23.8 ft between the tops of the upper and lower bladders and an estimated test-interval length of about 17.9 ft between packers assuming complete seals of 5.9-ft long upper and lower packer bladders, with the only upper packer inflated for the deepest interval tested; however, complete tests were only done for seven intervals as one interval (zone 6) was too low yielding (fig. 22; tables 4 and 14; appendix 1, table 1.7). Little to no hydraulic connection to adjacent intervals, as indicated by small drawdown in intervals adjacent to the pumped isolated interval, was observed for tests of the most intervals, although some connection between the isolated interval and an adjacent interval was indicated by measured water levels near a depth of about 110 ft bls in tests of zone 1 (“87–110.8 ft bls”; open 93.9–110.8 ft bls) and zone 2 (“110.5–134.3 ft bls”) (appendix 1, table 1.7).
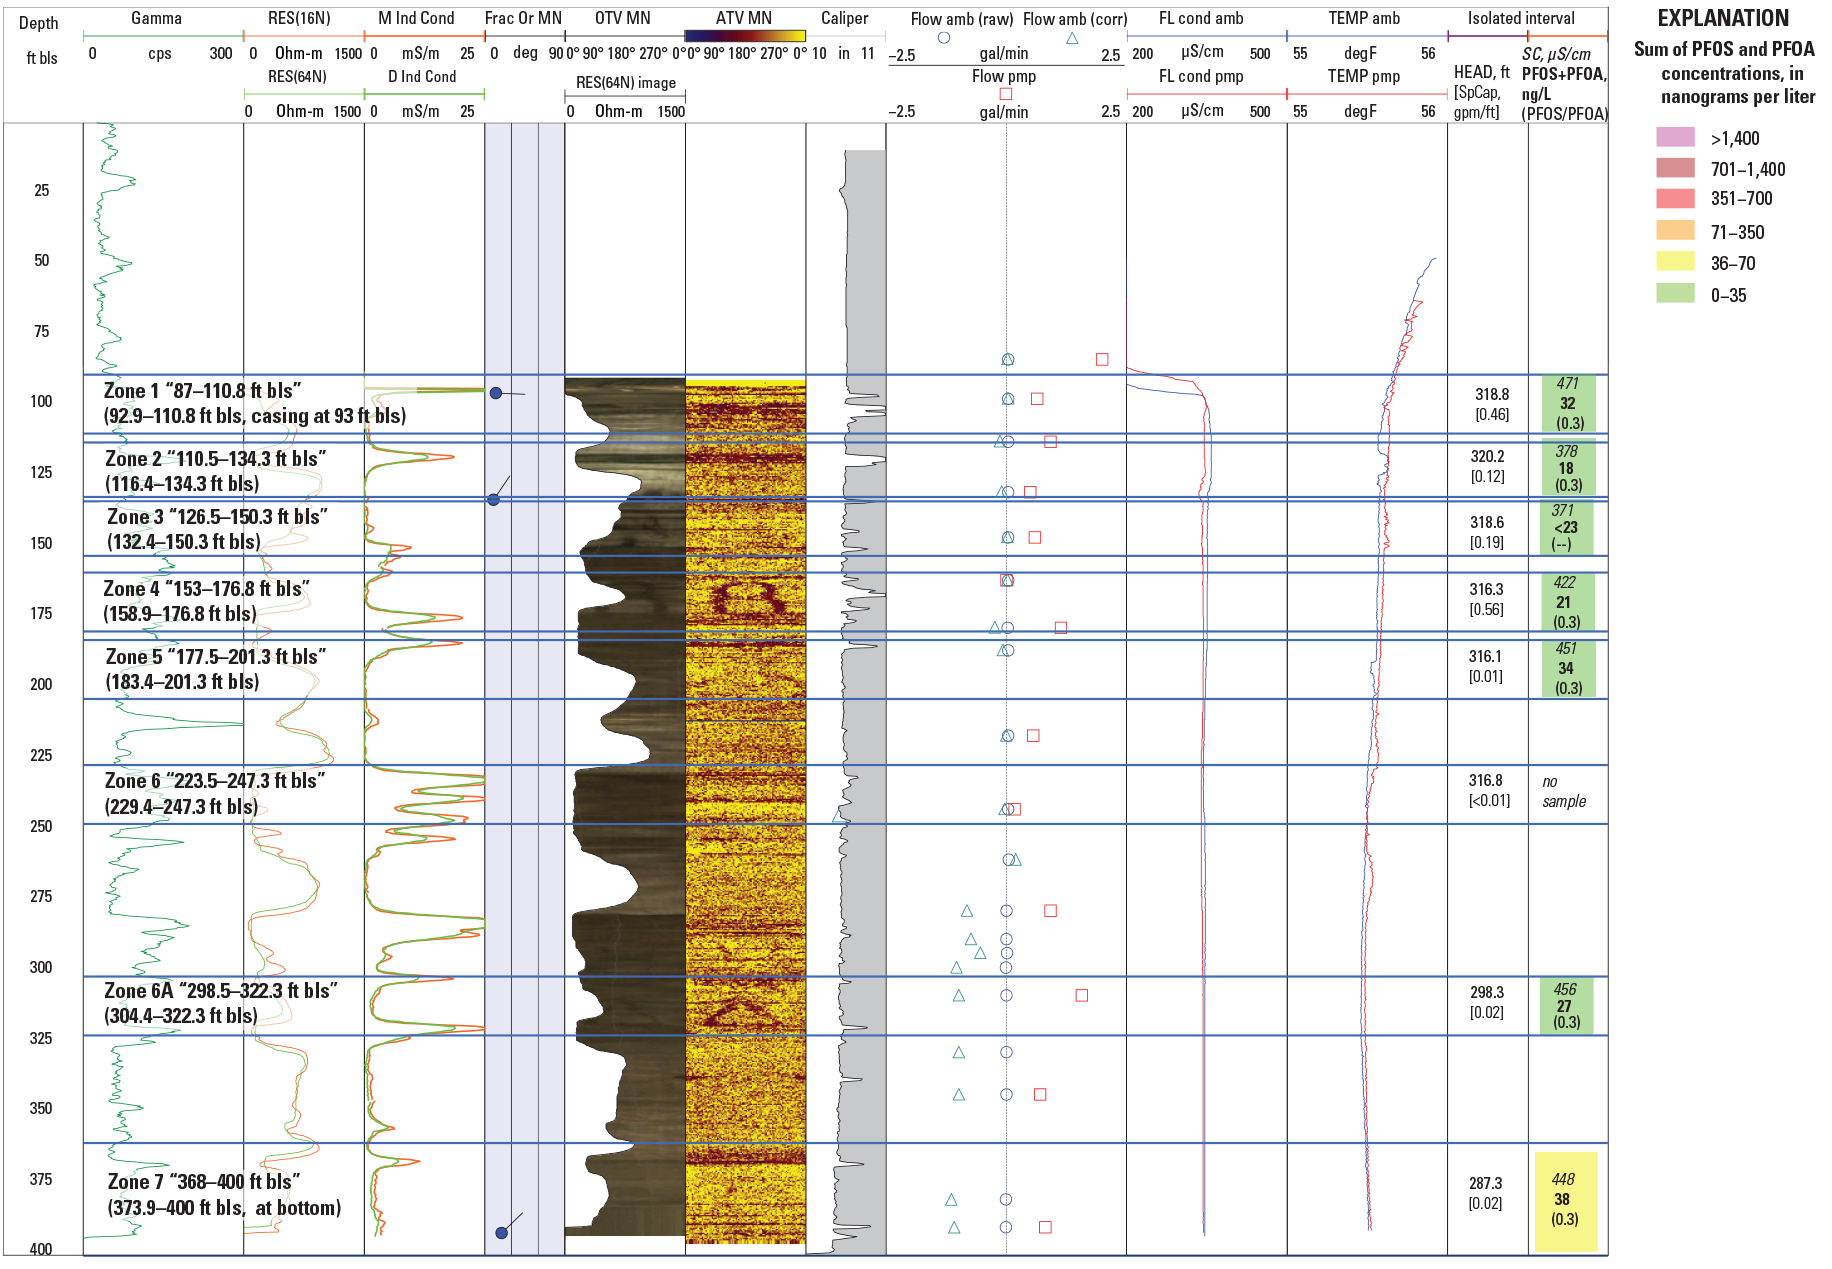
Geophysical logs for, and selected physical and chemical results of, April–May 2018 aquifer-interval-isolation (packer) tests in, borehole BK–3062 (well 15), at the former Naval Air Warfare Center Warminster, Bucks County, Pennsylvania, including isolated-interval hydraulic head (in feet above North American Vertical Datum of 1988 [NAVD 88]), specific capacity (in gallons per minute per foot [gpm/ft]),water-sample specific conductance (in microsiemens per centimeters [µS/cm]), summed concentrations of perfluorooctanesulfonic acid (PFOS) and perfluorooctanoic acid (PFOA) (in nanograms per liter [ng/L]), and PFOS to PFOA mass ratio. PFOS and PFOA data from Battelle (2021). Isolated intervals are depicted by blue lines, with depths to top and bottom of interval in feet below land surface (ft bls). Name of test for each interval includes zone number and “depths to top of bladder in upper and lower packer.” Estimated depths to top and bottom of tested interval in parentheses are also listed in table 14. Uncorrected (raw) and corrected (corr) ambient flow measurements from Senior and others (2021) are depicted. See table 2 for explanation of log abbreviations.
Table 14.
Hydraulic head, specific capacity, and selected water quality for aquifer intervals isolated by packers in tests of well BK–3062 (well 8) at the former Naval Air Warfare Center Warminster, Bucks County, Pennsylvania, April 25–May 2018.[PFOS and PFOA data from Battelle (2021). Tested isolated interval identified by zone (z) number, listed with depths to top of upper packer bladder and to top and bottom of tested interval. Selected water quality includes field parameters and results of laboratory analysis for major ions, boron, stable isotopes of water (δ2H, δ18O), perfluorooctanesulfonic acid (PFOS) and perfluorooctanoic acid (PFOA). See table 1.7 in appendix 1 for more information about water levels and pumping rates for tests. Dates shown as month/date/year. ft, feet; bls, below land surface; WL, water-level altitude; NAVD 88, North American Vertical Datum of 1988; Spec. cap., specific capacity; gpm/ft, gallons per minute per foot; DO, dissolved oxygen; mg/L, milligrams per liter; std, standard; SC, specific conductance; µS/cm, microsiemens per centimeter; °C, degree Celsius; Temp, water temperature; PFOS, perfluorooctanesulfonic acid; ng/L, nanograms per liter; PFOA, perfluorooctanoic acid; Ca, calcium; Mg, magnesium; K, potassium; Na, sodium; ANC, acid neutralizing capacity; CaCO3, calcium carbonate; Cl, chloride; F, fluoride; SiO2, silica; SO4, sulfate; B, boron; µg/L, micrograms per liter; δ 2H, delta hydrogen-2; per mil, parts per thousand; δ 18O, delta oxygen-18; z, zone; --, no data; <, less than]
Hydraulic heads as inferred from postinflation static water levels were highest (water-level altitude of about 320.2 ft above NAVD 88) in the shallow interval (zone 2, “110.5–134 ft bls”; open 116.4–134 ft bls) and lowest (water-level altitude of 287.3 ft above NAVD 88) in the deepest interval (zone 7, “368–400 ft bls”; open 373.9–400 ft bls at bottom of borehole) (table 14). For example, this difference in hydraulic heads of about 32.9 ft indicates potential for downward flow in the borehole, consistent with flow direction measured at the time of logging. The hydraulic heads for intervals above about 247 ft bls differ by less than about 4 ft, but the head difference increases to about 18 ft between zones 6 (“223.5–247.3 ft bls”; open 229.4–247.3 ft bls) and 6A (“298.5–322.3 ft bls”; open 304.4–322.3 ft bls), a factor that may contribute to the downward flow measured during logging under ambient conditions below 280 ft bls. The sum of specific-capacity values from packer tests of 1.38 (gal/min)/ft was about 1.5 times greater than the specific capacity of 0.89 (gal/min)/ft estimated from pumping during logging (tables 4 and 14), possibly due to some overestimation of specific capacity for the two isolated intervals with hydraulic connections to adjacent intervals (zones 1 and 2; appendix 1, table 1.7). The two intervals with the highest specific capacity, 0.46 (gal/min) ft in zone 1 (“87–110.8 ft bls”; open 92.9–110.8 ft bls) and 0.56 (gal/min)/ft in zone 4 (“153–176.8 ft bls”; open 158.9–176.8 ft bls), of intervals tested in borehole BK–3062 (well 15) (table 14) were consistent with logging indication of fractures near 95 ft bls being most hydraulically active and borehole video identification of fractures near 162.5 to 174 ft bls being possible principal water-bearing features (Senior and others, 2021).
Field water quality indicated that specific conductance did not range much in value among the tested isolated intervals but was highest in the shallowest interval zone 1 (471 µS/cm) and lowest in the next deepest intervals zone 2 and 3 (378 and 371 µS/cm, respectively) (table 14; fig. 22), which is generally consistent with fluid logs collected during geophysical logging. Overall, dissolved oxygen levels were moderate to low (3.8–0.4 mg/L), being lowest in zones 2 and 3, and pH was near neutral (7.5–8.0), being highest in zones 2 and 3.
Chloride concentrations generally appear to be related to specific conductance in water samples, as the intervals with the highest and lowest specific conductance, zones 1 and 3, respectively, had the highest chloride concentrations of 37.5 and 21 mg/L, respectively (table 14). Analyses for major ions were not done for water from zone 2 due to insufficient sample volume. Summed concentrations of PFOA and PFOS were similar in value and less than the LHA of 70 ng/L in water from all intervals tested, ranging from about 18 ng/L in zone 2 (“110.5–134.3 ft bls”; 116.4–134.3 ft bls) to about 38 ng/L in deepest zone 7 (“368–400 ft bls”; open 373.9–400 ft bls). Summed PFOA and PFOS concentrations were lowest in the sample with lowest chloride concentrations (from zone 3) (table 14) and generally were higher in relation to increases in chloride concentrations (figure 6B).
The samples from all intervals plot as calcium-magnesium-bicarbonate-type waters with some chloride component, as shown in figure 23, possibly indicating the presence of a magnesium-rich mineral in the aquifer such as dolomite or another source of magnesium. As for other boreholes that have been open for long periods, the downward vertical gradients in the open borehole BK–3062 (well 15) may have resulted in transport of water from shallow intervals to deeper intervals. Similarities in chemical compositions and summed PFOA and PFOS concentrations are indicated in comparison of shallow zone 1 and deeper zones 4–7, suggesting possible mixing of water from shallow to deeper intervals. PFAS concentrations were highest in zone 1 (32 ng/L) and deepest zone 7 (38 ng/L).
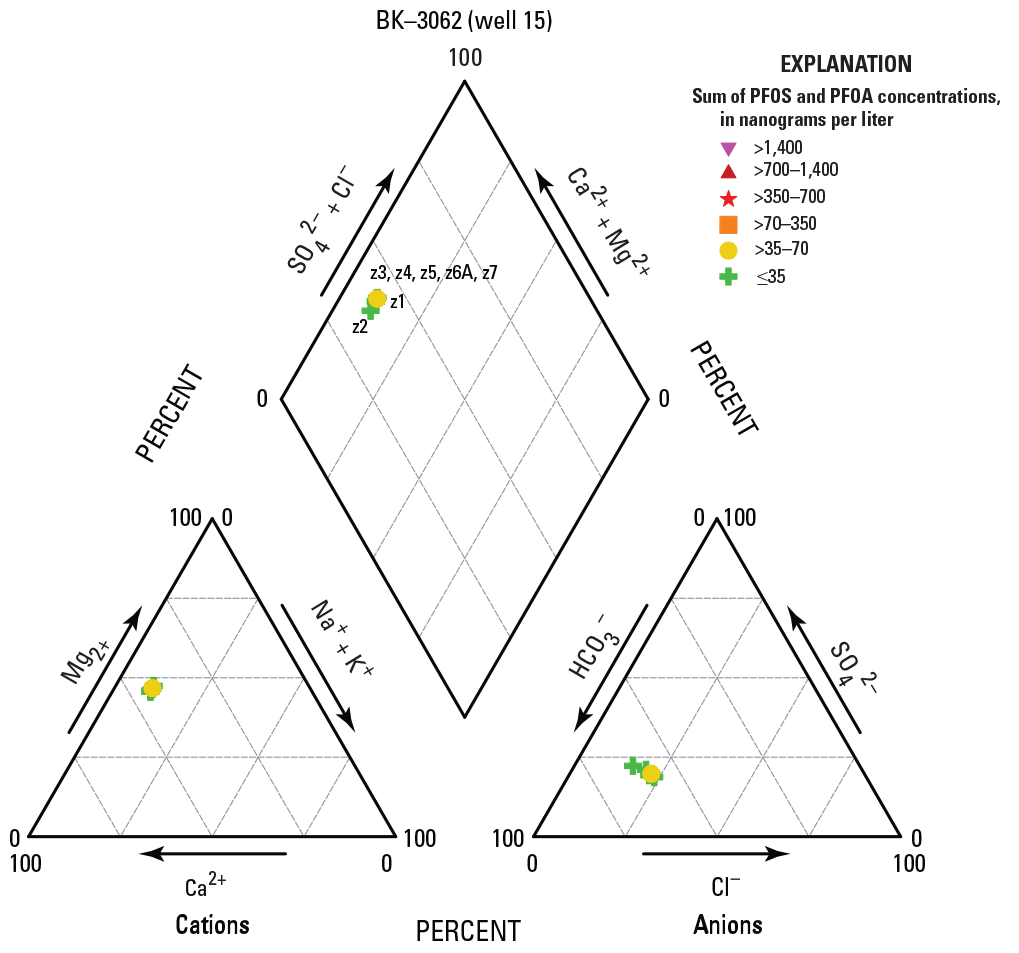
Piper diagram showing relative major ion composition of water samples collected from seven isolated intervals in borehole BK–3062 (well 15), at the former Naval Air Warfare Center Warminster, Bucks County, Pennsylvania, April–May 2018, with symbols depicting the range of summed perfluorooctanesulfonic acid (PFOS) and perfluorooctanoic acid (PFOA) concentrations. Cations include calcium (Ca2+), magnesium (Mg2+), sodium (Na+), and potassium (K+). Anions include bicarbonate (HCO3-), chloride (Cl-), and sulfate (SO42-). Intervals labeled by zone (z) number.
BK–3063 (HN–116)
BK–3063 (HN–116) is a 6-in. diameter, 601-ft deep borehole with 19 ft of casing drilled by the Navy in 2018 and reconstructed in 2019 as a monitoring well; open-borehole static water levels were 8.22 ft bls at the time of logging in May 2018 (table 4) and about 5.8–7.5 ft bls at the time of packer testing in June 2018 (appendix 1, table 1.8). Borehole BK–3063 (HN–116) is in an area of active shallow groundwater extraction for VOC remediation (Area A) at the former NAWC Warminster (fig. 3) (Battelle, 2016). Geophysical and borehole video logs collected by USGS in May 2018 (Senior and others, 2021), before well reconstruction, indicated several mostly high-angle water-bearing fractures throughout the borehole, with fractures near 47, 200, 400, 430, and 595 ft bls appearing to be the most hydraulically active. Upward flow at and above about 180 ft bls and downward flow below about 207 ft bls, and increased downward flow below about 395 ft bls was measured under ambient conditions at the time of logging. Ten intervals were selected for testing using straddle packers with a spacing of 37 ft between the top of the upper and lower packer bladders and an estimated test-interval length of about 32.8 ft between packers assuming complete seals of 4.2-ft long upper and lower packer bladders (fig. 24; tables 4 and 15; appendix 1, table 1.8). Zone 10 (“531.8–568.8 ft bls”; open 532–568.8 ft bls) spans a subset of zone 11 (“531.8–601 ft bls”; open 532–601 ft bls at bottom of borehole), and comparison of results from these two intervals can be used to estimate hydraulic and chemical properties of the interval from about 573 to 601 ft bls. Little to no hydraulic connection to adjacent intervals, as indicated by small to no drawdown in intervals adjacent to the pumped isolated interval, was observed for tests of most intervals, although some connection between the isolated interval and an adjacent interval was indicated for tests of zones 4 (“177.5–214.5 ft bls”; open 181.7–214.5 ft bls) and 8 (“381.5–418.5 ft bls”; open 386.7–418.5 ft bls) (appendix 1, table 1.8).
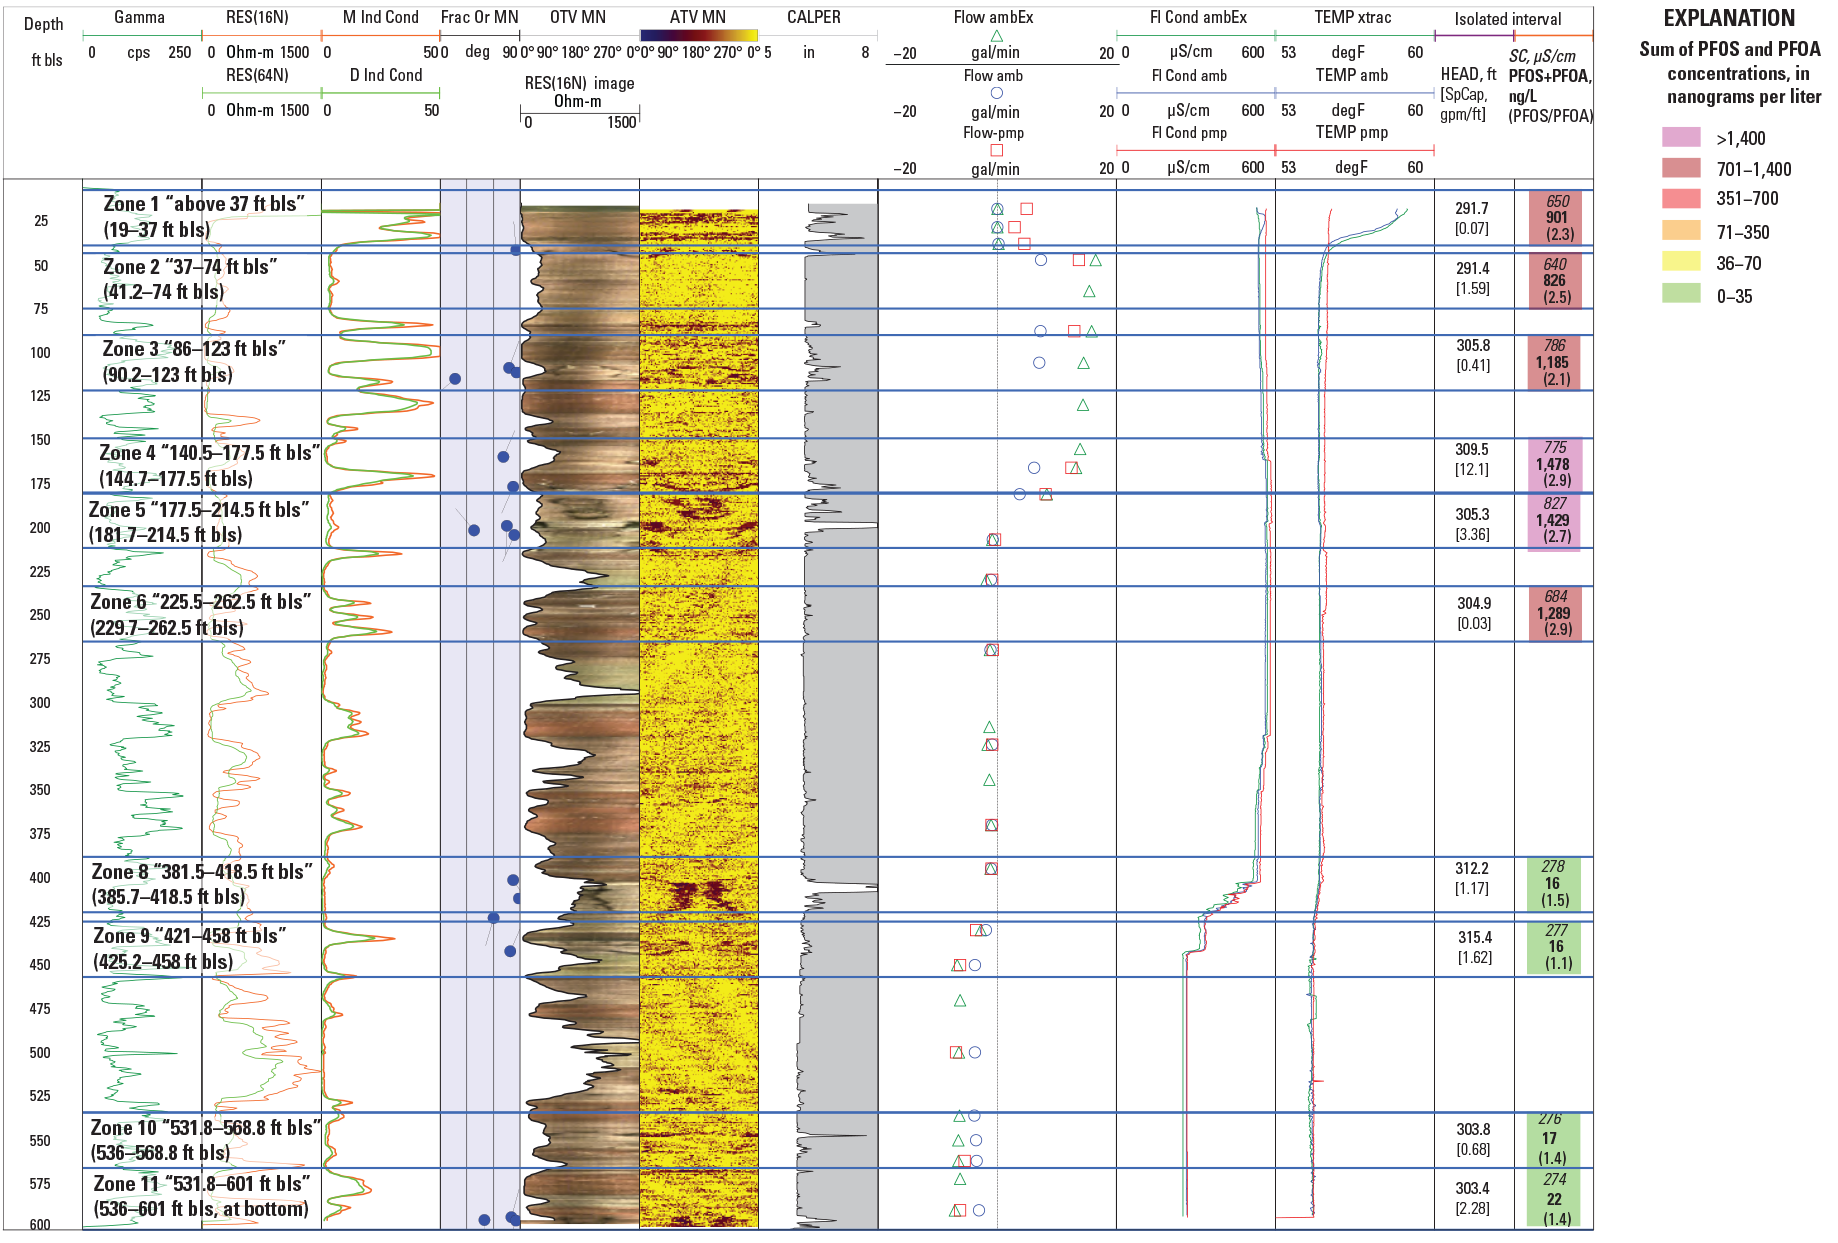
Geophysical logs for, and selected physical and chemical results of, June 2018 aquifer-interval-isolation (packer) tests in, borehole BK–3063 (well HN–116), at the former Naval Air Warfare Center Warminster, Bucks County, Pennsylvania, including isolated-interval hydraulic head (in feet above North American Vertical Datum of 1988 [NAVD 88]), specific capacity (in gallons per minute per foot [gpm/ft]),water-sample specific conductance (in microsiemens per centimeters [µS/cm]), summed concentrations of perfluorooctanesulfonic acid (PFOS) and perfluorooctanoic acid (PFOA) (in nanograms per liter [ng/L]), and PFOS to PFOA mass ratio. PFOS and PFOA data from Battelle (2021). Isolated intervals are depicted by blue lines, with depths to top and bottom of interval in feet below land surface (ft bls). Name of test for each interval includes zone number and “depths to top of bladder in upper and lower packer.” Estimated depths to top and bottom of tested interval in parentheses and also listed in table 15. See table 2 for explanation of log abbreviations.
Table 15.
Hydraulic head, specific capacity, and selected water quality for aquifer intervals isolated by packers in tests of well BK–3063 (well HN–116) at the former Naval Air Warfare Center Warminster, Bucks County, Pennsylvania, June 6–12, 2018.[PFOS and PFOA data from Battelle (2021). Tested isolated interval identified by zone (z) number, listed with depths to top of upper packer bladder and to top and bottom of tested interval. Selected water quality includes field parameters and results of laboratory analysis for major ions, boron, stable isotopes of water (δ2H, δ18O), perfluorooctanesulfonic acid (PFOS) and perfluorooctanoic acid (PFOA). Dates shown as month/date/year. ft, feet; bls, below land surface; WL, water level altitude; NAVD 88, North American Vertical Datum of 1988; Spec. cap., specific capacity; gpm/ft, gallons per minute per foot; DO, dissolved oxygen; mg/L, milligrams per liter; std, standard; SC, specific conductance; µS/cm, microsiemens per centimeter; °C, degrees Celsius; Temp, water temperature; PFOS, perfluorooctanesulfonic acid; ng/L, nanograms per liter; PFOA, perfluorooctanoic acid; Ca, calcium; Mg, magnesium; K, potassium; Na, sodium; ANC, acid neutralizing capacity; CaCO3, calcium carbonate; Cl, chloride; F, fluoride; SiO2, silica; SO4, sulfate; B, boron; µg/L, micrograms per liter; δ 2H, delta hydrogen-2; per mil, parts per thousand; δ 18O, delta oxygen-18; z, zone; --, no data]
Hydraulic heads as inferred from postinflation static water levels were highest (water-level altitude of about 315.4 ft above NAVD 88) in zone 9 (“421–458 ft bls”; open 452.2–458 ft bls) and lowest (water-level altitudes of 291.7 and 291.4 ft above NAVD 88) in zones 1 and 2 (“above 37 ft bls” and “37–74 ft bls”; open 19–37 ft bls and 41.2–74 ft bls, respectively), but were also relatively low (303.8 and 303.4 ft bls above NAVD 88 in altitude) in deepest zones 10 and 11 below about 536 ft bls) (table 15). These hydraulic heads indicate potential for both upward and downward flow in the borehole, which is generally consistent with, although differing in depths at which upward and downward flow directions were measured at the time of logging (fig. 24; Senior and others, 2021). The sum of specific-capacity values from packer tests of 22.59 (gal/min)/ft (tables 4 and 15) in BK–3063 (HN–116) is the second highest of all boreholes tested; however, the sum cannot be compared to specific capacity estimated from pumping during logging because that value was not reported. The interval with the highest specific capacity, 12.08 (gal/min)/ft in zone 4 (“140.5–177.5 ft bls”; open 144.7–177.5 ft bls), includes fractures near 162.5 to 174 ft bls identified from the borehole video as possible principal water-bearing intervals (Senior and others, 2021). Other intervals with relatively high specific capacity (table 15) were consistent with logging and borehole video indications of hydraulically active fractures (Senior and others, 2021).
Field water quality indicated large differences in specific conductance between zones 6 (“225.5–262.5 ft bls”; open 229.7–262.5 ft bls) and 8 (“381.5–418.5 ft bls”; open 385.7–418.5 ft bls), with water from zone 6 and intervals above zone 6 having higher specific conductance values (640–827 µS/cm) than water from zone 8 and intervals below zone 8 (274–278 µS/cm) (table 15), consistent with fluid logs collected during geophysical logging (fig. 24). Overall, in water from tested intervals, dissolved oxygen levels were moderate to low (2.6–0.3 mg/L), with concentrations highest in zone 1. The pH of the water was near neutral (7.5–7.8), with the most alkaline zones being the deepest (zones 8–11).
Differences in selected ions and PFAS concentrations among isolated intervals followed a similar pattern as the vertical distribution of specific conductance, with higher calcium, magnesium, sodium, chloride, sulfate, boron, PFOA, and PFOS concentrations in zone 6 (“225.5–262.5 ft bls”; open 229.7–262.5 ft bls) and intervals above zone 6 and lower concentrations of those constituents in zone 8 (“381.5–418.5 ft bls”; open 385.7–418.5 ft bls) and intervals below zone 8 (table 15). Chloride concentrations were greater than 100 mg/L in water from zone 6 and intervals above zone 6 and were the highest in water from zones 3 (“86–123 ft bls”; 146 mg/L), 4 (“140.5–177.5 ft bls”; 145 mg/L), and 5 (“177.5–214.5 ft bls”; 158 mg/L). Chloride concentrations were less than 4 mg/L, in the range of estimated natural background values, in water from zone 8 (“381–418 ft bls”; 2.8 mg/L) and intervals below zone 8. Water from zone 8 and intervals below zone 8 also differed from water from zone 6 and intervals above zone 6 by having higher fluoride and silica concentrations and lighter (more negative) isotopic composition (table 15; fig. 6A). Summed concentrations of PFOA and PFOS were substantially greater than the LHA of 70 ng/L in water from zone 6 (“225.5–262.5 ft bls”; open 229.7–262.5 ft bls) and all intervals above zone 6, ranging from about 826 ng/L in zone 2 (“86–123 ft bls”; open 90.2–123 ft bls) to about 1,478 ng/L in zone 4 (“140.5–177.5 ft bls”; open 144.9–177.5ft bls). Summed PFOA and PFOS concentrations were lower than the LHA of 70 ng/L in water from zone 8 (“381–418 ft bls”; open 385.2–418 ft bls) and all intervals below zone 8, ranging from about 16 to 22 ng/L. Higher PFAS concentrations were related to higher chloride concentrations (figure 6A).
The samples from isolated intervals in borehole BK–3063 (HN–116) plot as two different water types, calcium-bicarbonate-chloride type waters with elevated PFAS concentrations above 700 ng/L and calcium-bicarbonate type waters with lower PFAS concentrations below 35 ng/L as shown in (fig. 25). The elevated chloride concentrations in water from zone 6 and intervals above zone 6 appear to be from sources that include components other than, and in addition to, sodium chloride, as the chloride to sodium molar ratio for these samples is much greater than 1 (table 15).
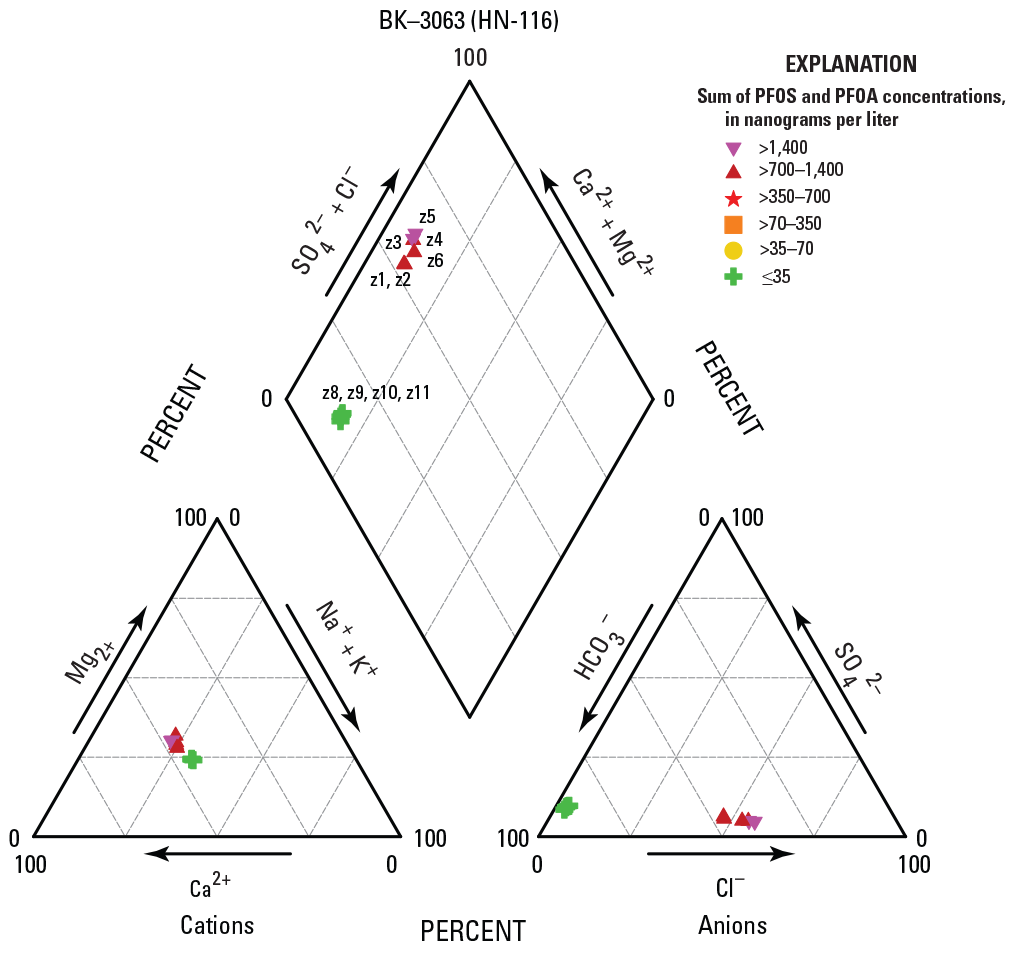
Piper diagram showing relative major ion composition of water samples collected from ten isolated intervals in borehole BK–3063 (well HN–116), at the former Naval Air Warfare Center Warminster, Bucks County, Pennsylvania, June 2018, with symbols depicting the range of summed perfluorooctanesulfonic acid (PFOS) and perfluorooctanoic acid (PFOA) concentrations. Cations include calcium (Ca2+), magnesium (Mg2+), sodium (Na+), and potassium (K+). Anions include bicarbonate (HCO3-), chloride (Cl-), and sulfate (SO42-). Intervals labeled by zone (z) number.
The pattern in borehole flow and differences in chemical composition and PFAS concentrations as exhibited in BK–3063 (HN–116) suggests that the borehole intercepts two distinct groundwater flow paths. Groundwater with elevated PFAS and chloride concentrations enters the borehole at depths above about 250 ft bls and flows up to exit through shallow fractures less than about 74 ft bls. Local shallow (less than 100 ft bls) pumping may affect this pathway. Groundwater with low concentrations of PFAS and chloride enters the borehole at depths below about 320 ft bls and flows down. The highest chloride and PFAS concentrations in water from intervals ranging in depth from about 140 to 25 ft bls and the upward vertical gradients in this depth range suggest that sources for these constituents may be at some distance from the well head.
BK–3066 (HN–118)
BK–3066 (HN–118) is a 6-in. diameter, 602-ft deep borehole with 19 ft of casing drilled in 2018 and reconstructed in 2019 as a monitoring well; open-borehole static water levels were 29.3 ft bls at the time of logging (table 4) and about 26.8–29.9 ft bls at the time of packer testing (appendix 1, table 1.9). Geophysical and borehole video logs collected by USGS in August 2018 (Senior and others, 2021) indicated several mostly low- and a few high-angle water-bearing fractures throughout the borehole, with fractures near 35 to 39 ft bls appearing to be the most hydraulically active, with cascading water from fractures at about 23 ft bls above the static water level of 29.3 ft bls in the open borehole. Under ambient conditions at the time of logging, downward flow was measured from about 35 to 575 ft bls, with decreasing amounts of downward flow below depths of about 530 and 565 ft bls, and upward flow was measured near 595 ft bls. Unstable water levels and a greater amount of downward flow under pumping than ambient conditions measured at the time of logging may indicate presence of nearby transient pumping (Senior and others, 2021). Twelve intervals were initially selected for testing using straddle packers with a spacing of 21.4 ft between the tops of the upper and lower bladders and an estimated test-interval length of about 17.2 ft between packers, assuming complete seals of 4.2-ft long upper and lower packer bladders; however, only eleven intervals were tested (fig. 26; tables 4 and 16; appendix 1, table 1.9) as the test of zone 7 (“320–351.4 ft bls”; open 324.2–351.4 ft bls) was terminated after an hour due to very slow postinflation water-level stabilization indicated that interval had extremely low yield. Static water levels in zone 1 (“above 28 ft bls”) rose after packer inflation from about 29 ft bls (below bottom of casing at 19 ft bls) to about 11.1 ft bls (in casing) (appendix 1, table 1.9) due to inflow from fractures at about 23 ft bls, so the tested interval for zone 1 was 19-28 ft bls. Zone 12 (“554.6–575 ft bls”; open 558.2-575 ft bls) spans a subset of zone 13 (“554.6–602 ft bls”; open 558.2–602 ft bls), and comparison of results from these two intervals can be used to estimate hydraulic and chemical properties of the interval from about 579.2 to 602 ft bls. Relatively little to no hydraulic connection to adjacent intervals, as indicated by small to no drawdown in intervals adjacent to the pumped isolated interval, was observed for tests of all intervals.
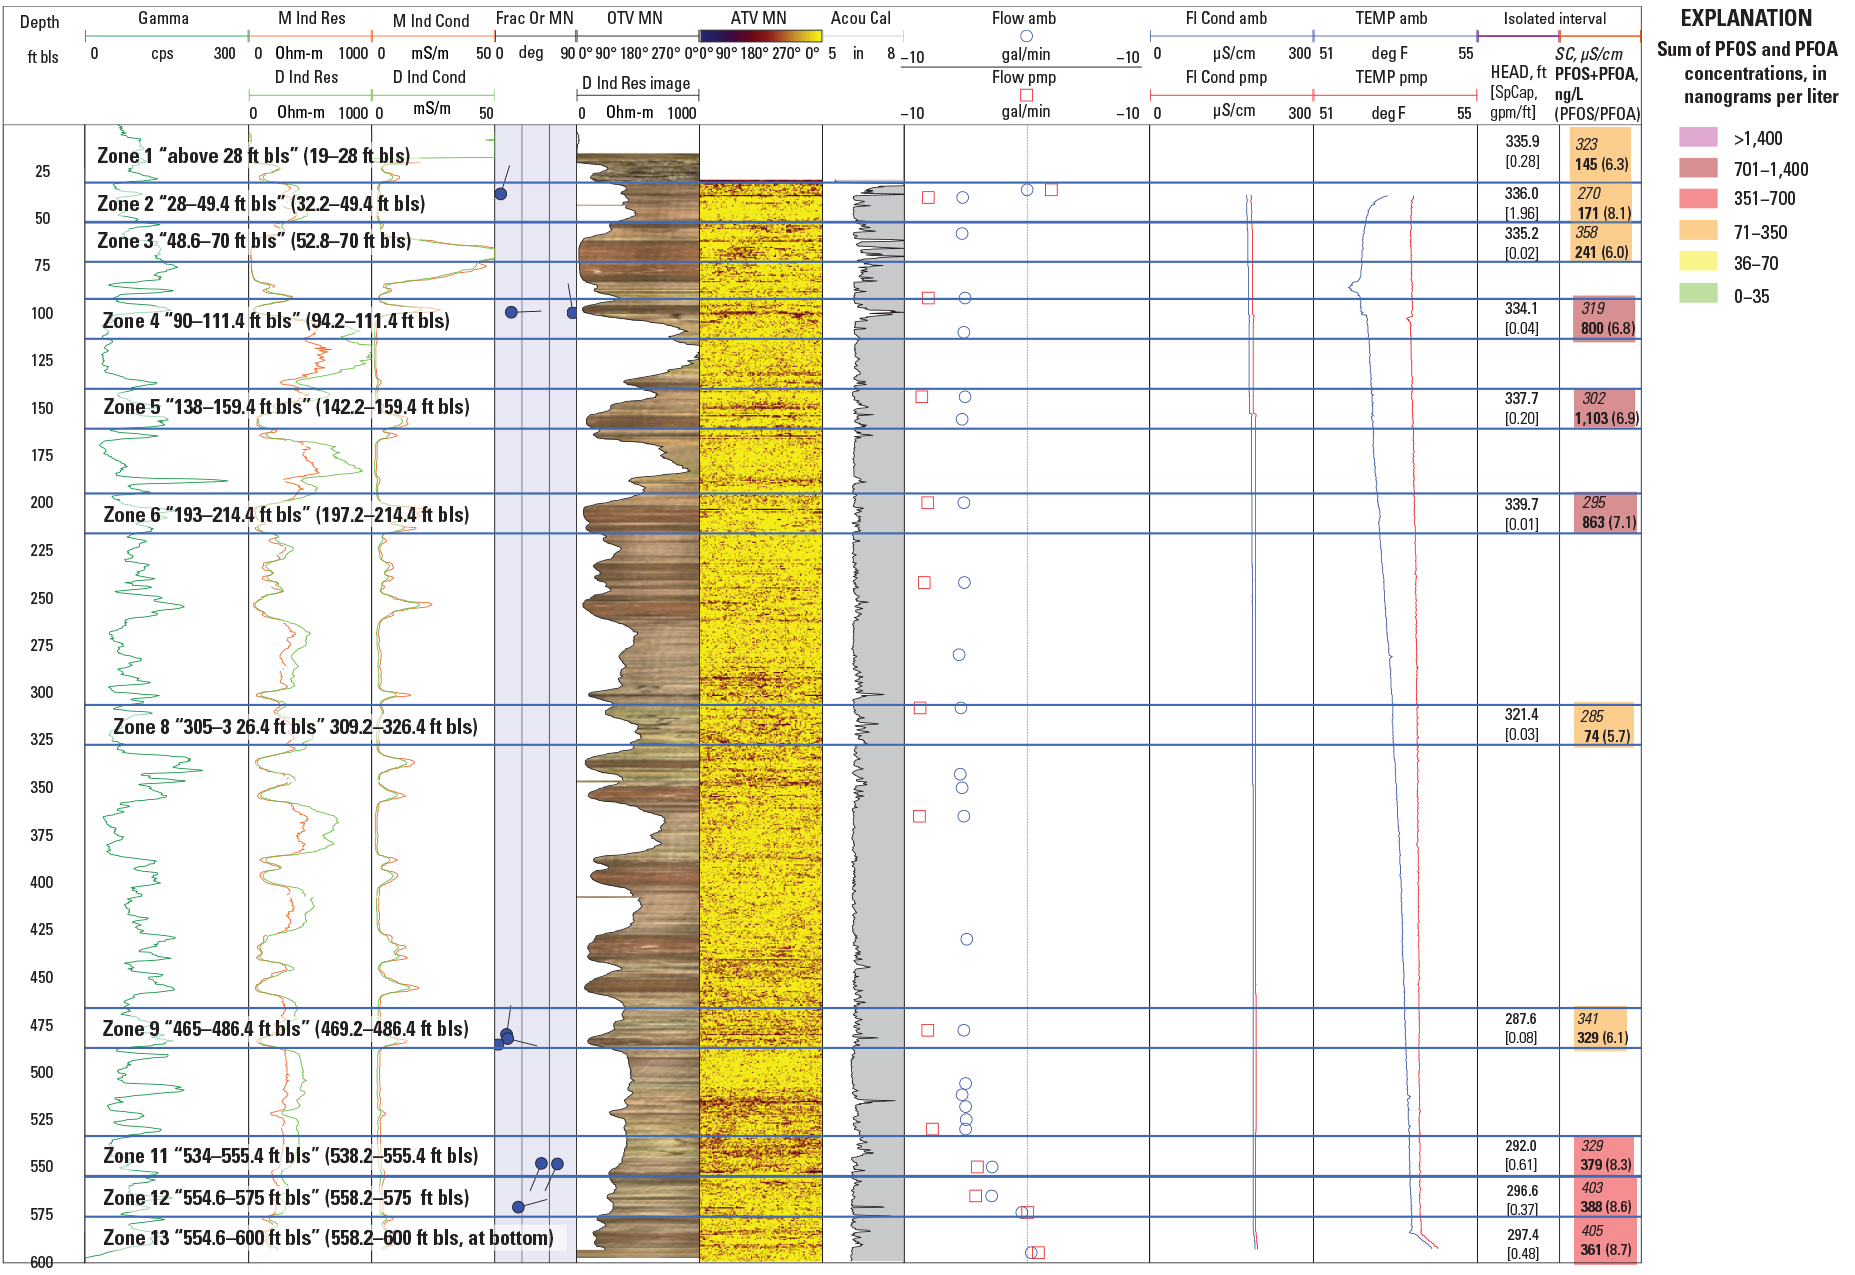
Geophysical logs for, and selected physical and chemical results of, August 2018 aquifer-interval-isolation (packer) tests in, borehole BK–3066 (well HN–118), at the former Naval Air Warfare Center Warminster, Bucks County, Pennsylvania, including isolated-interval hydraulic head (in feet above North American Vertical Datum of 1988 [NAVD 88]), specific capacity (in gallons per minute per foot [gpm/ft]),water-sample specific conductance (in microsiemens per centimeters [µS/cm]), summed concentration of perfluorooctanesulfonic acid (PFOS) and perfluorooctanoic acid (PFOA) (in nanograms per liter [ng/L]), and PFOS to PFOA mass ratio. PFOS and PFOA data from Battelle (2021). Isolated intervals are depicted by blue lines, with depths to top and bottom of interval in feet below land surface (ft bls). Name of test for each interval includes zone number and “depths to top of bladder in upper and lower packer.” Estimated depths to top and bottom of tested interval in parentheses also listed in table 16. See table 2 for explanation of log abbreviations.
Table 16.
Hydraulic head, specific capacity, and selected water quality for aquifer intervals isolated by packers in tests of well BK–3066 (well HN–118) at the former Naval Air Warfare Center Warminster, Bucks County, Pennsylvania, August 8–21, 2018.[PFOS and PFOA data from Battelle (2021). Tested isolated interval identified by zone (z) number, listed with depths to top of upper packer bladder and to top and bottom of tested interval. Selected water quality includes field parameters and results of laboratory analysis for major ions, boron, stable isotopes of water (δ2H, δ18O), perfluorooctanesulfonic acid (PFOS) and perfluorooctanoic acid (PFOA). Hydraulic head for isolated interval estimated from postinflation static water level. See table 1.9 in appendix 1 for more information about water levels, pumping rates for tests. Dates shown as month/date/year. ft, feet; bls, below land surface; WL, water-level altitude; NAVD 88, North American Vertical Datum of 1988; spec. cap., specific capacity; gpm/ft, gallons per minute per foot; DO, dissolved oxygen; mg/L, milligrams per liter; std, standard; SC, specific conductance; µS/cm, microsiemens per centimeter; °C, degree Celsius; Temp, water temperature; PFOS, perfluorooctanesulfonic acid; ng/L, nanograms per liter; PFOA, perfluorooctanoic acid; Ca, calcium; Mg, magnesium; K, potassium; Na, sodium; ANC, acid neutralizing capacity; CaCO3, calcium carbonate; Cl, chloride; F, fluoride; SiO2, silica; SO4, sulfate; B, boron; µg/L, micrograms per liter; δ 2H, delta hydrogen-2; per mil, parts per thousand; δ 18O, delta oxygen-18; z, zone; --, no data]
Hydraulic heads as inferred from postinflation static water levels were highest (water-level altitudes of about 334.1 to 339.6 ft above NAVD 88) in zone 6 (“193–214.4 ft bls”; open 197.2–214.4 ft bls) and intervals above zone 6 and lowest (water-level altitudes of 287.6 to 297.4 ft above NAVD 88) in zone 9 (“465–486.4 ft bls”; open 469.2–486.4 ft bls) and intervals below zone 9 (table 16. This distribution in hydraulic heads indicates potential for both upward and downward flow among isolated intervals in the borehole but, overall, indicates that the largest potential (head differences of up to 52 ft) for downward flow is from intervals above about 214 ft bls to intervals below 465 ft bls, which is generally consistent with flow directions measured at the time of logging (fig. 26). The sum of specific-capacity values from packer tests is 3.70 (gal/min)/ft in BK–3063 (HN–116) (tables 4 and 16); this sum cannot be compared to specific capacity estimated from pumping during logging because that value was not reported. The interval with the highest specific capacity, 1.96 (gal/min) ft in zone 2 (“28–49.4 ft bls”; open 32.2–49.4 ft bls), includes fractures near 35 to 39 ft bls identified from the borehole video as being most hydraulically active (Senior and others, 2021). Other intervals with relatively high specific capacity (table 16) were consistent with logging and borehole video indications of hydraulically active fractures (Senior and others, 2021).
Field water quality indicated a range in specific conductance (270–405 µS/cm) in water from isolated intervals, with the deepest intervals below about 558.8 ft bls (zones 12 and 13) having highest values (table 16), consistent with fluid logs collected during geophysical logging (fig. 26). Dissolved oxygen levels were greater than 2 mg/L in water from most intervals; those were the highest (7.8 and 8.6 mg/L) in shallowest intervals above 49 ft bls in zones 1 and 2, respectively, and were lowest (0.4 mg/L) in water from zone 8 (“305–326.4 ft bls”; open 309.2–326.4 ft bls). Water from zones 1 and 2 had the most acidic pH of 5.6 compared to water from other intervals, which had pH ranging from 6.5 to 7.8 (table 16).
Differences in selected ions and PFAS concentrations among isolated intervals followed the general patterns of water quality given above. Water from shallowest intervals (zones 1 and 2) were similar in composition to each other but different from water from other intervals, having, in addition to higher dissolved oxygen and low pH, higher sodium, chloride, and boron concentrations and lower calcium, magnesium, acid neutralizing capacity, fluoride, and PFAS concentrations (table 16). Water from zone 8 (“305–326.4 ft bls”; open 309.2–326.4 ft bls) differed in composition compared to water from other intervals, having the lowest concentrations of dissolved oxygen, sodium, chloride (4.6 mg/L, natural background value), sulfate, and PFAS and highest acid neutralizing capacity of all intervals tested. Summed PFOA and PFOS concentrations were greater than the LHA of 70 ng/L in water from all intervals tested, were highest (1,103 ng/L) in water from zone 5 (“138–159.4 ft bls”; open 142.2–159.4 ft bls) and lowest (74 ng/L) in water from zone 8 (“305–326.4 ft bls”; open 309.2–326.4 ft bls) (table 16). Higher PFAS concentrations appeared to be inversely related to chloride concentrations in general, unlike water from most other boreholes in the investigation (figure 6A), even though sampled water with the lowest PFAS concentrations also had the lowest chloride concentrations (4.8 mg/L) at background levels (see zone 5, table 16). Another characteristic that differentiates water from BK–3066 (HN–118) from other boreholes in the investigation is a high PFOS-to-PFAS mass ratio (5.7–8.7; table 16), which is among the highest (90th percentile) in water samples from all boreholes tested (table 4).
The samples from isolated intervals in borehole BK–3066 (HN–118) plot as three different water types, with highest PFAS concentrations in calcium-magnesium-bicarbonate type waters (zones 4 and 5) and lowest PFAS concentrations in calcium-bicarbonate type (zone 8) and calcium-sodium-chloride type (zones 1 and 2) waters as shown in (fig. 27). The sources of chloride in water from all intervals, except zones 5 and 8, include components other than, and in addition to, sodium chloride, as indicated by the chloride to sodium molar ratio for samples from most intervals being greater than 1 (1.4–2.4) (table 16).
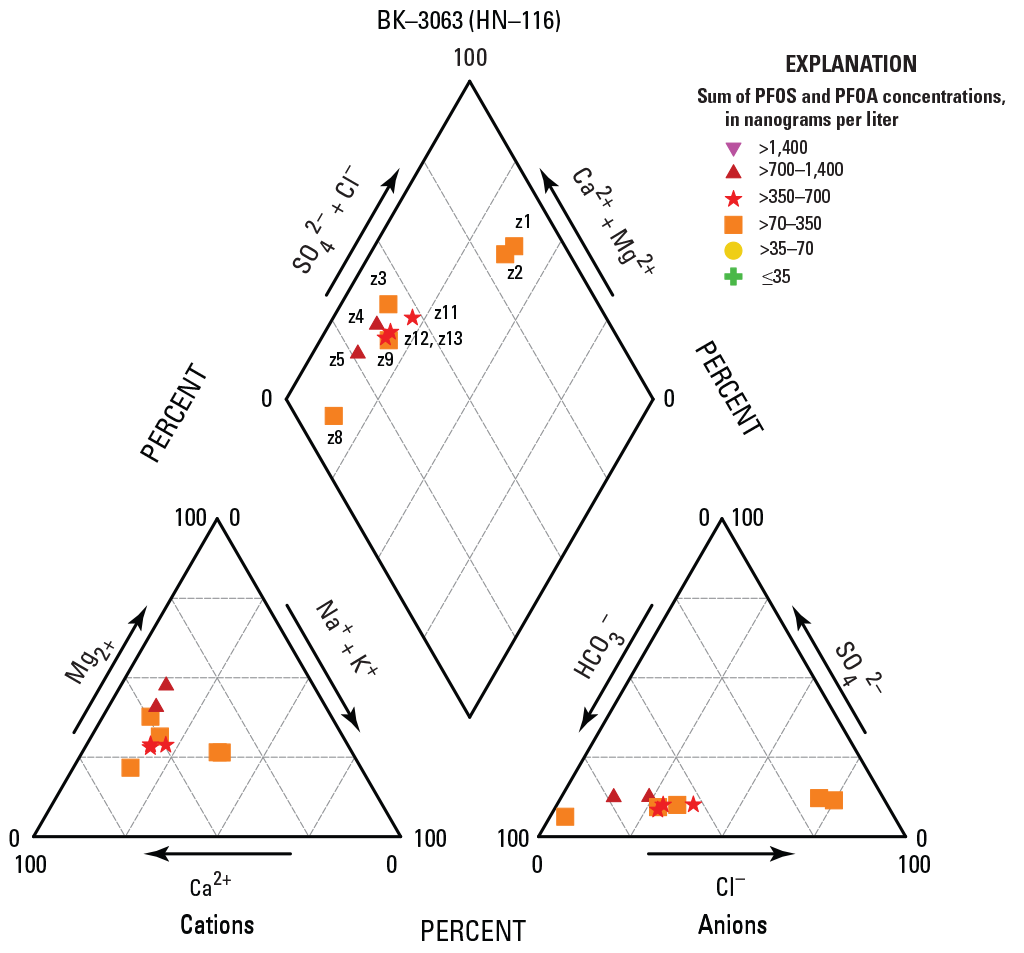
Piper diagram showing relative major ion composition of water samples collected from nine isolated intervals in borehole BK–3066 (well HN–118), at the former Naval Air Warfare Center Warminster, Bucks County, Pennsylvania, August 2018, with symbols depicting the range of summed perfluorooctanesulfonic acid (PFOS) and perfluorooctanoic acid (PFOA) concentrations. Cations include calcium (Ca2+), magnesium (Mg2+), sodium (Na+), and potassium (K+). Anions include bicarbonate (HCO3-), chloride (Cl-), and sulfate (SO42-). Intervals labeled by zone (z) number.
The pattern in borehole flow and differences in chemical composition and PFAS concentrations as exhibited in BK–3066 (HN–118) suggest that the borehole intercepts several different groundwater flow paths. Groundwater with elevated chloride and dissolved oxygen concentrations, low pH and acid neutralizing capacity, and slightly elevated PFAS enters the borehole at shallow depths above about 50 ft bls. Groundwater with elevated PFAS and slightly elevated chloride concentrations enters the borehole at intermediate depths from about 111 to 214 (zones 4, 5 and 6), two of which (zones 5 and 6) include water-bearing intervals that have the highest hydraulic heads and the potential to flow both upward and downward in the open borehole. Groundwater with slightly elevated PFAS and low chloride concentrations is present in the intermediate depth interval (zone 8, “305–326.4 ft bls”; open 309.2–326.4 ft bls). Groundwater with moderately elevated PFAS and chloride concentrations is present in water samples from intervals at depths below about 469 ft bls (zone 9 and deeper than zone 9). These deepest intervals (zones 9, 11, 12, and 13) have the lowest hydraulic heads in the borehole and may be affected by transport of water from intermediate depth intervals (zones 4, 5, and 6) and (or) shallower intervals with higher heads in the open borehole (table 16). The elevated PFAS concentrations in water from intervals ranging in depth from about 142 to 214 ft bls (zones 5 and 6) and the high hydraulic heads in this depth range suggest that sources for these constituents may be at some distance from the well head. Local pumping may affect groundwater-flow pathways near, and apparent hydraulic heads in, BK–3066 (HN–118).
BK–3067 (HN–119)
BK–3067 (HN–119) is a 6-in. diameter, 602-ft deep borehole with 20 ft of casing drilled in 2018 and reconstructed in 2019 as a monitoring well; open-borehole static water levels were 55 ft bls at the time of logging (table 4) and about 40.1–54.7 ft bls at the time of packer testing (appendix 1, table 1.10).Geophysical and borehole video logs collected by USGS in May 2018 (Senior and others, 2021) indicated several low- and high-angle water-bearing fractures throughout the borehole, with fractures above 65 ft bls appearing to be the most hydraulically active, and cascading water from several fractures in the interval from about 21 to 25 ft bls above the static water level of about 55 ft bls in the open borehole. Under ambient conditions at the time of logging in the open borehole, downward flow was measured from about 65 to 590 ft bls, with increasing amounts of downward flow from about 65 to 194 ft bls, decreasing amounts of downward flow from 194 to 566 ft bls, and upward flow was measured near 595 ft bls (Senior and others, 2021). Fourteen intervals were initially selected for testing using straddle packers with a spacing of 24.5 ft between the top of the upper and lower bladders and an estimated test-interval length of about 20.3 ft between packers assuming complete seals of 4.2-ft long upper and lower packer bladders; however, only eleven intervals were completed (fig. 28; tables 4 and 17), as tests of zones 5, 11, and 13 were estimated to have low yield (appendix 1, table 1.10). Static water levels in zone 1 (“above 50.5 ft bls”) rose after packer inflation from about 54.7 ft bls (below bottom of casing at 20 ft bls) to about 11.5 ft bls (in casing) (appendix 1, table 1.10) due to inflow from fractures at about 21 to 25 ft bls, so that the tested interval for zone 1 was 20–50.5 ft bls. Little to no hydraulic connection to adjacent intervals, as indicated by small to no drawdown in intervals adjacent to the pumped isolated interval, was observed for tests of almost all intervals, except the test of zone 1 (“above 50.5 ft bls”; open 20–50.5 ft bls), during which water levels indicated some hydraulic interconnection to the interval below the upper packer (zone 2, “50.5–75 ft bls”; open 54.9–75 ft bls) (appendix 1, table 1.10). The range in open-borehole static water levels (14.6 ft), measured during packer testing of BK–3067 (appendix 1, table 1.10), was the largest of all boreholes tested, rising from about 54.7 to 40.1 ft bls during the period of testing (August 23–September 5, 2018) when water levels in nearby long-term USGS observation well BK–1020 declined about 1 ft; possible, but unknown, local hydrologic conditions such as transient pumping may be affecting the open-borehole static water levels in BK–3067, which differ in magnitude and direction from those in the shallower 400-ft deep observation well BK–1020.
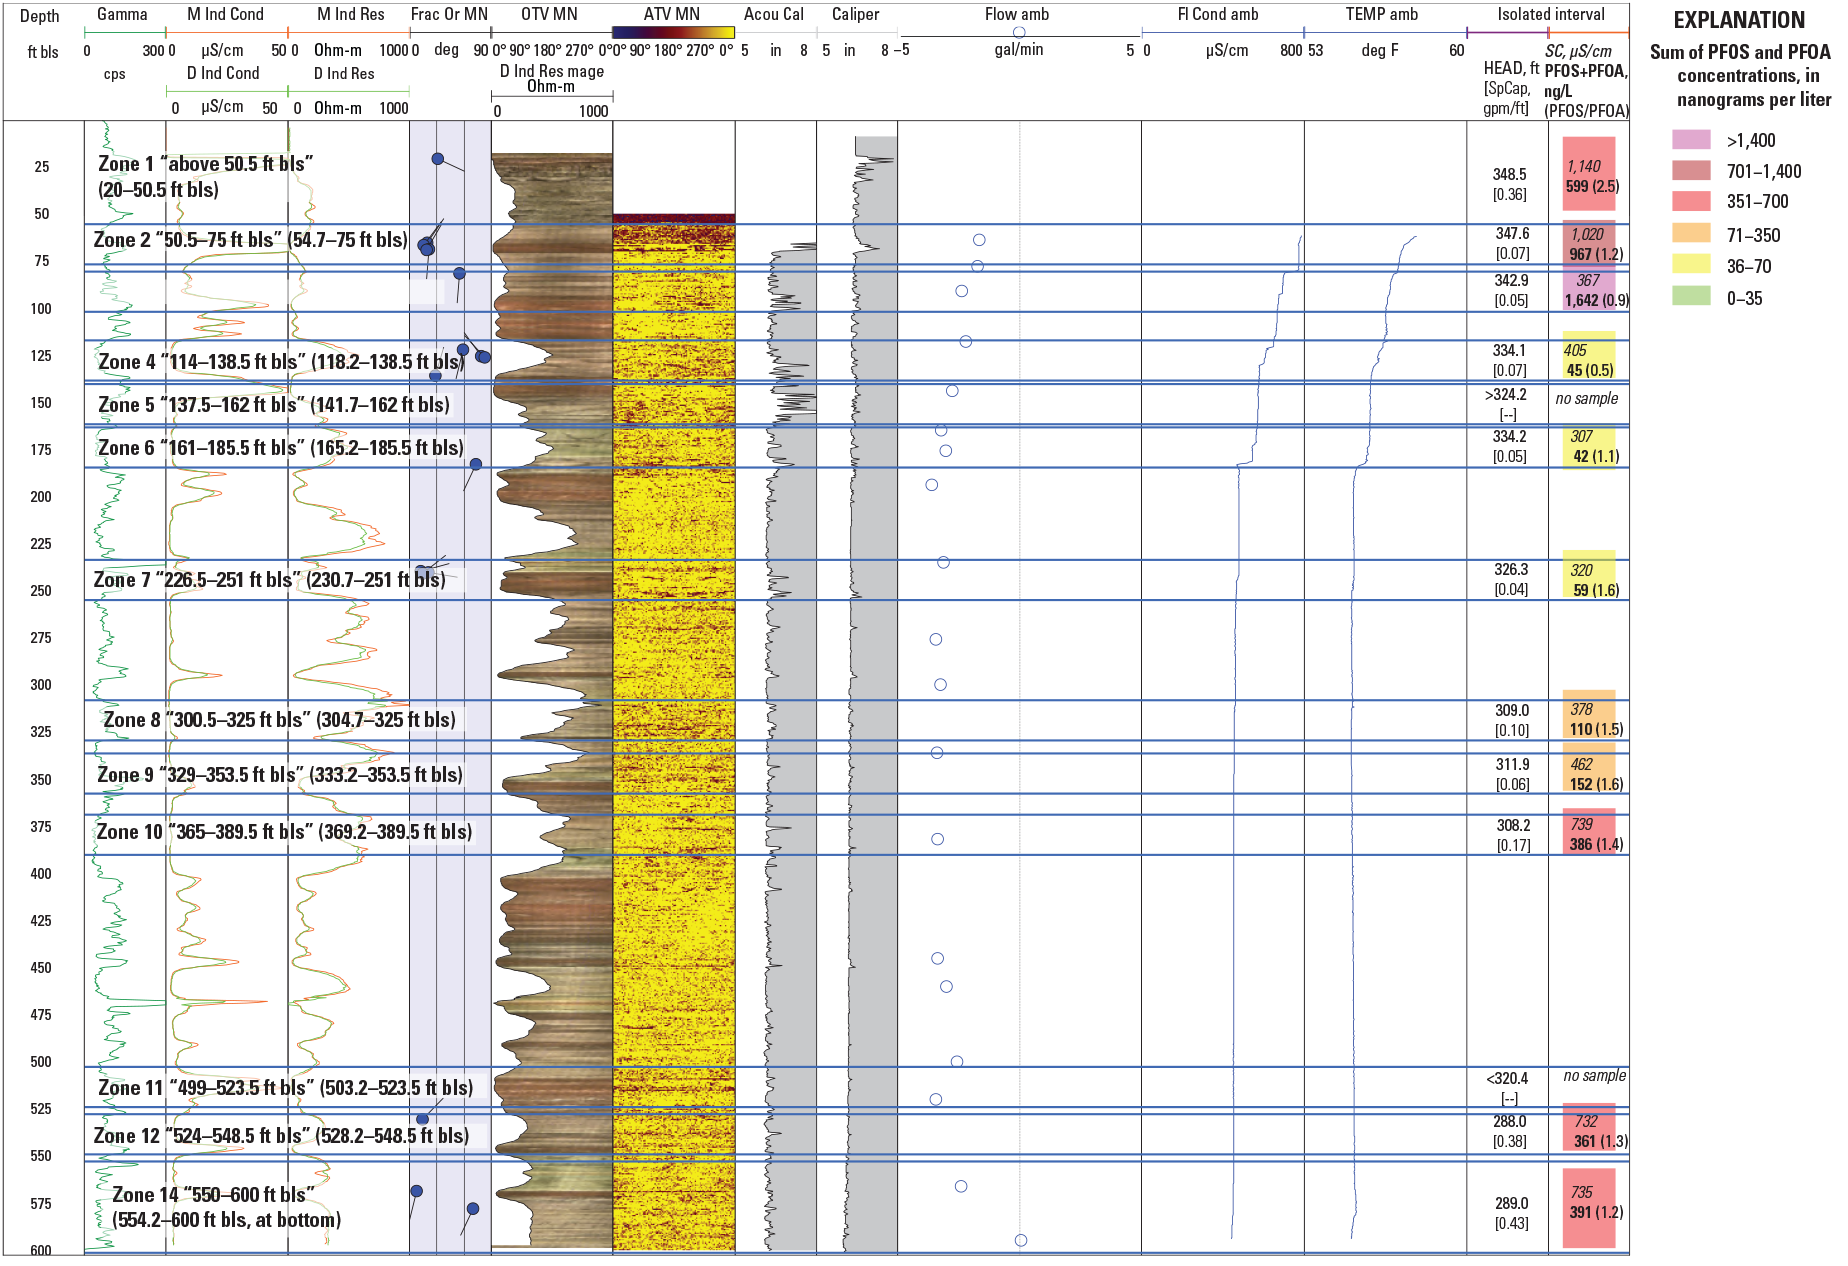
Geophysical logs for, and selected physical and chemical results of, August-September 2018 aquifer-interval-isolation (packer) tests in, borehole BK–3067 (well HN–119), at the former Naval Air Warfare Center Warminster, Bucks County, Pennsylvania, including isolated-interval hydraulic head (in feet above North American Vertical Datum of 1988 [NAVD 88]), specific capacity (in gallons per minute per foot [gpm/ft]),water-sample specific conductance (in microsiemens per centimeters [µS/cm]), summed concentration of perfluorooctanesulfonic acid (PFOS) and perfluorooctanoic acid (PFOA) (in nanograms per liter [ng/L]), and PFOS-to-PFOA mass ratio. PFOS and PFOA data from Battelle (2021). Isolated intervals are depicted by blue lines, with depths to top and bottom of interval in feet below land surface (ft bls). Name of test for each interval includes zone number and “depths to top of bladder in upper and lower packer.” Estimated depths to top and bottom of tested interval in parentheses and also listed in table 17. See table 2 for explanation of log abbreviations.
Table 17.
Hydraulic head, specific capacity, and selected water quality for aquifer intervals isolated by packers in tests of well BK–3067 (well HN–119) at the former Naval Air Warfare Center Warminster, Bucks County, Pennsylvania, August 22–September 5, 2018.[PFOS and PFOA data from Battelle (2021). Tested isolated interval identified by zone (z) number, listed with depths to top of upper packer bladder and to top and bottom of tested interval. Selected water quality includes field parameters and results of laboratory analysis for major ions, boron, stable isotopes of water (δ2H, δ18O), perfluorooctanesulfonic acid (PFOS) and perfluorooctanoic acid (PFOA). Hydraulic head for isolated interval estimated from postinflation static water level. See table 1.10 in appendix 1 for more information about water levels and pumping rates for tests. Dates shown as month/date/year. ft, feet; bls, below land surface; WL, water level altitude; NAVD 88, North American Vertical Datum of 1988; Spec. cap., specific capacity; gpm/ft, gallons per minute per foot; DO, dissolved oxygen; mg/L, milligrams per liter; std, standard; SC, specific conductance; µS/cm, microsiemens per centimeter; °C, degree Celsius; Temp, water temperature; PFOS, perfluorooctanesulfonic acid; ng/L, nanograms per liter; PFOA, perfluorooctanoic acid; Ca, calcium; Mg, magnesium; K, potassium; Na, sodium; ANC, acid neutralizing capacity; CaCO3, calcium carbonate; Cl, chloride; F, fluoride; SiO2, silica; SO4, sulfate; B, boron; µg/L, micrograms per liter; δ 2H, delta hydrogen-2; per mil, parts per thousand; δ 18O, delta oxygen-18; z, zone; <, less than; --, no data]
Hydraulic heads as inferred from postinflation static water levels were highest (water-level altitudes of about 347.6 to 348.6 ft above NAVD 88) in the shallowest intervals (above 75 ft bls; zones 1 and 2) and lowest (water-level altitudes of 288.0 to 291.4 ft above NAVD 88) in the deepest intervals (below 524 ft bls; zones 12, 13, and 14) (table 17). This distribution in hydraulic heads indicates potential for downward flow among isolated intervals in the borehole but, overall, indicates that the largest potential (head differences of up to 60 ft) for downward flow is from shallow to deep intervals, which is consistent with flow directions measured at the time of logging (fig. 28). The sum of specific-capacity values from packer tests is 1.78 (gal/min)/ft in BK–3067 (HN–119), which is the lowest of the six new wells drilled in 2018 (tables 4 and 17); this sum cannot be compared to specific capacity estimated from pumping during logging because that value was not reported. The intervals (zones 2, 12, and 14) with the highest specific capacity, ranging from 0.36 to 0.43 (gal/min)/ft, includes fractures above 65 ft bls, near 544 to 563, 574, and 595 ft bls, identified from logging or borehole video as potentially hydraulically active (Senior and others, 2021).
Field water quality indicated a range in specific conductance in water from isolated intervals, with the shallowest intervals above 75 ft bls (zones 1 and 2) having highest values (1,020–1,140 µS/cm) and intervals at depths ranging from about 165 to 251 ft bls (zones 6 and 7) having lowest values (307–320 µS/cm) (table 17), consistent with fluid logs collected during geophysical logging (fig. 28). Dissolved oxygen levels were highest (5.8 mg/L) in shallowest intervals above 75 ft bls (zones 1 and 2) and lowest (0.4 to 0.5 mg/L) in water from intervals at depths from about 165 to 354 ft bls (zones 6, 7, 8, and 9). Water from zones 1 and 2 had the most acidic pH of 5.4 and 6.0, respectively, compared to water from other intervals, which had pH ranging from 6.7 to 8.0 (table 17).
Differences in selected ions and PFAS concentrations among isolated intervals followed patterns of water from zones 1 and 2 that were similar in composition to each other but different from water from other intervals, having higher magnesium, potassium, sodium, chloride (221 to 303 mg/L), silica, and sulfate concentrations, in addition to higher dissolved oxygen concentrations, lower pH, acid neutralizing capacity, and fluoride concentrations, and heavier (less negative) isotopic composition (table 17). Summed concentrations of PFOA and PFOS were slightly to substantially greater than the LHA of 70 ng/L in water from 8 of 11 intervals tested, ranging from 110 ng/L in zone 8 (“300.5–325 ft bls”; 304.2–325 ft bls) to 1,642 ng/L in zone 3 (“76–100.5 ft bls”; open 80.2–100.5ft bls). Summed concentrations of PFOA and PFOS were less than the LHA of 70 ng/L in water from 3 intervals tested at depths from about 118 to 251 ft bls, ranging from 42 to 59 ng/L in zones 4, 6, and 7 (table 17). Higher PFAS concentrations generally appeared to be related to higher chloride concentrations (figure 6A), except for the highest PFAS concentration in water from zone 3 (“76–100.5 ft bls”; open 80.2–100.5ft bls); water from zone 3 had a chloride concentration (31 mg/L) similar in value to water from intervals with much lower PFAS concentrations (zones 4, 5, 7, and 8; table 17).
The samples from isolated intervals in borehole BK–3067 (HN–119) plot as three different water types, with elevated PFAS concentrations (599–967 ng/L) in calcium-magnesium-chloride type waters (zones 1 and 2), both the highest (1,642 ng/L) and low to slightly elevated PFAS concentrations (42–152 ng/L) in calcium-magnesium-bicarbonate type waters (zones 3, 4, 6, 7, 8, and 9), and intermediate PFAS concentrations (361–391 ng/L) in calcium-magnesium-bicarbonate-chloride type waters (zones 10, 12, and 14) that appear to be a mixture of the other two water types, as shown in the Piper diagram in figure 29. The sources of chloride in water from all intervals, except for zones 6 and 7, include components other than, and in addition to, sodium chloride, as indicated by the chloride to sodium molar ratio for samples from most tested intervals being greater than 1.0 (1.5–3.6) (table 17).
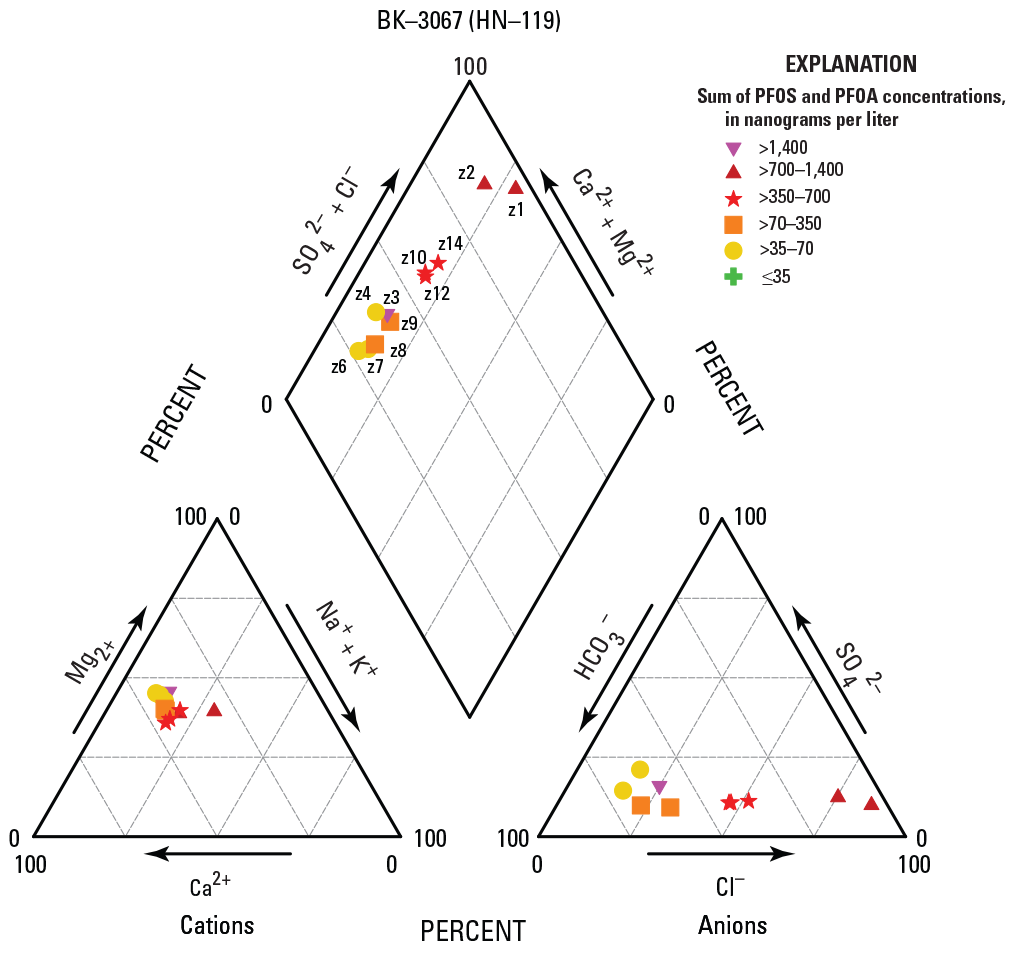
Piper diagram showing relative major ion composition of water samples collected from eleven isolated intervals in borehole BK–3067 (well HN–119), at the former Naval Air Warfare Center Warminster, Bucks County, Pennsylvania, August–September 2018, with symbols depicting the range of summed perfluorooctanesulfonic acid (PFOS) and perfluorooctanoic acid (PFOA) concentrations. Cations include calcium (Ca2+), magnesium (Mg2+), sodium (Na+), and potassium (K+). Anions include bicarbonate (HCO3-), chloride (Cl-), and sulfate (SO42-). Intervals labeled by zone (z) number.
Like BK–3066 (HN–118), the pattern in borehole flow and differences in chemical composition and PFAS concentrations exhibited in BK–3067 (HN–119) suggests that the borehole intercepts several different groundwater flow paths that have different hydraulic heads, which in the open borehole, can result in flow from shallower to deeper water-bearing features. Groundwater with elevated chloride and dissolved oxygen concentrations, low pH and acid neutralizing capacity, and relatively elevated PFAS concentrations enter the borehole at shallow depths above about 65 ft bls, which have the highest hydraulic heads. Groundwater with elevated PFAS and very slightly elevated chloride concentrations enter the borehole at depths from about 80 to 100.5 ft bls (zone 3). Zone 3 is an interval with a relatively high hydraulic head. Groundwater with relatively low PFAS and chloride concentrations is present in the intervals, ranging in depth from about 118 to 251 ft bls (zones 4, 6, and 7). Groundwater with moderately elevated PFAS and chloride concentrations is present in samples from intervals at depths below about 369 ft bls (zone 10 and deeper).The intervals below 369 ft bls (such as zones 10, 12, and 14) have the lowest hydraulic heads in the borehole and may be affected by transport of water from the shallower intervals above about 100 ft bls (zones 1, 2, and 3) with higher hydraulic heads in the open borehole, as indicated by similarities in composition to water from these shallow and deep intervals. The elevated PFAS concentrations in water from intervals shallower than 100.5 ft bls and the high hydraulic heads in this depth range suggest that sources for these constituents may be close to, and also at some distance from, the well head.
BK–3068 (HN–117)
BK–3068 (HN–117) is a 6-in. diameter, 600-ft deep borehole with 19 ft of casing drilled in 2018 and reconstructed in 2019 as a monitoring well; open-borehole static water levels were 15.35 ft bls at the time of logging (table 4) and about 12.6–14.3 ft bls at the time of packer testing (appendix 1, table 1.11). Geophysical and borehole video logs collected by USGS in May 2018 (Senior and others, 2021) indicated several low- and a few high-angle water-bearing fractures throughout the borehole, with fractures above 32 ft bls appearing to be the most hydraulically active. Under ambient conditions at the time of logging in the open borehole, downward flow was measured from about 19 to 509 ft bls, and upward flow was measured from about 595 to 515 ft bls (Senior and others, 2021). BK–3068 (HN–117) is in an area of active shallow groundwater pumping for VOC remediation (Area C) (Battelle, 2016). Nine intervals were initially selected for testing using straddle packers with a spacing of 25.6 ft between the top of the upper and lower bladders and an estimated test-interval length of about 21.4 ft between packers assuming complete seals of 4.2-ft long upper and lower packer bladders; however, only eight zones were completed (figure 30; tables 4 and 18), as the test of zone 4 indicated a very low yield (appendix 1, table 1.11). Little to no hydraulic connection to adjacent intervals, as indicated by small to no drawdown in intervals adjacent to the pumped isolated interval, was observed for tests of all zones, except the test of zone 2 (“32–57.6 ft bls”; open 36.2–57.5 ft bls), during which water levels indicated hydraulic interconnection to the interval below the lower packer (appendix 1, table 1.11).
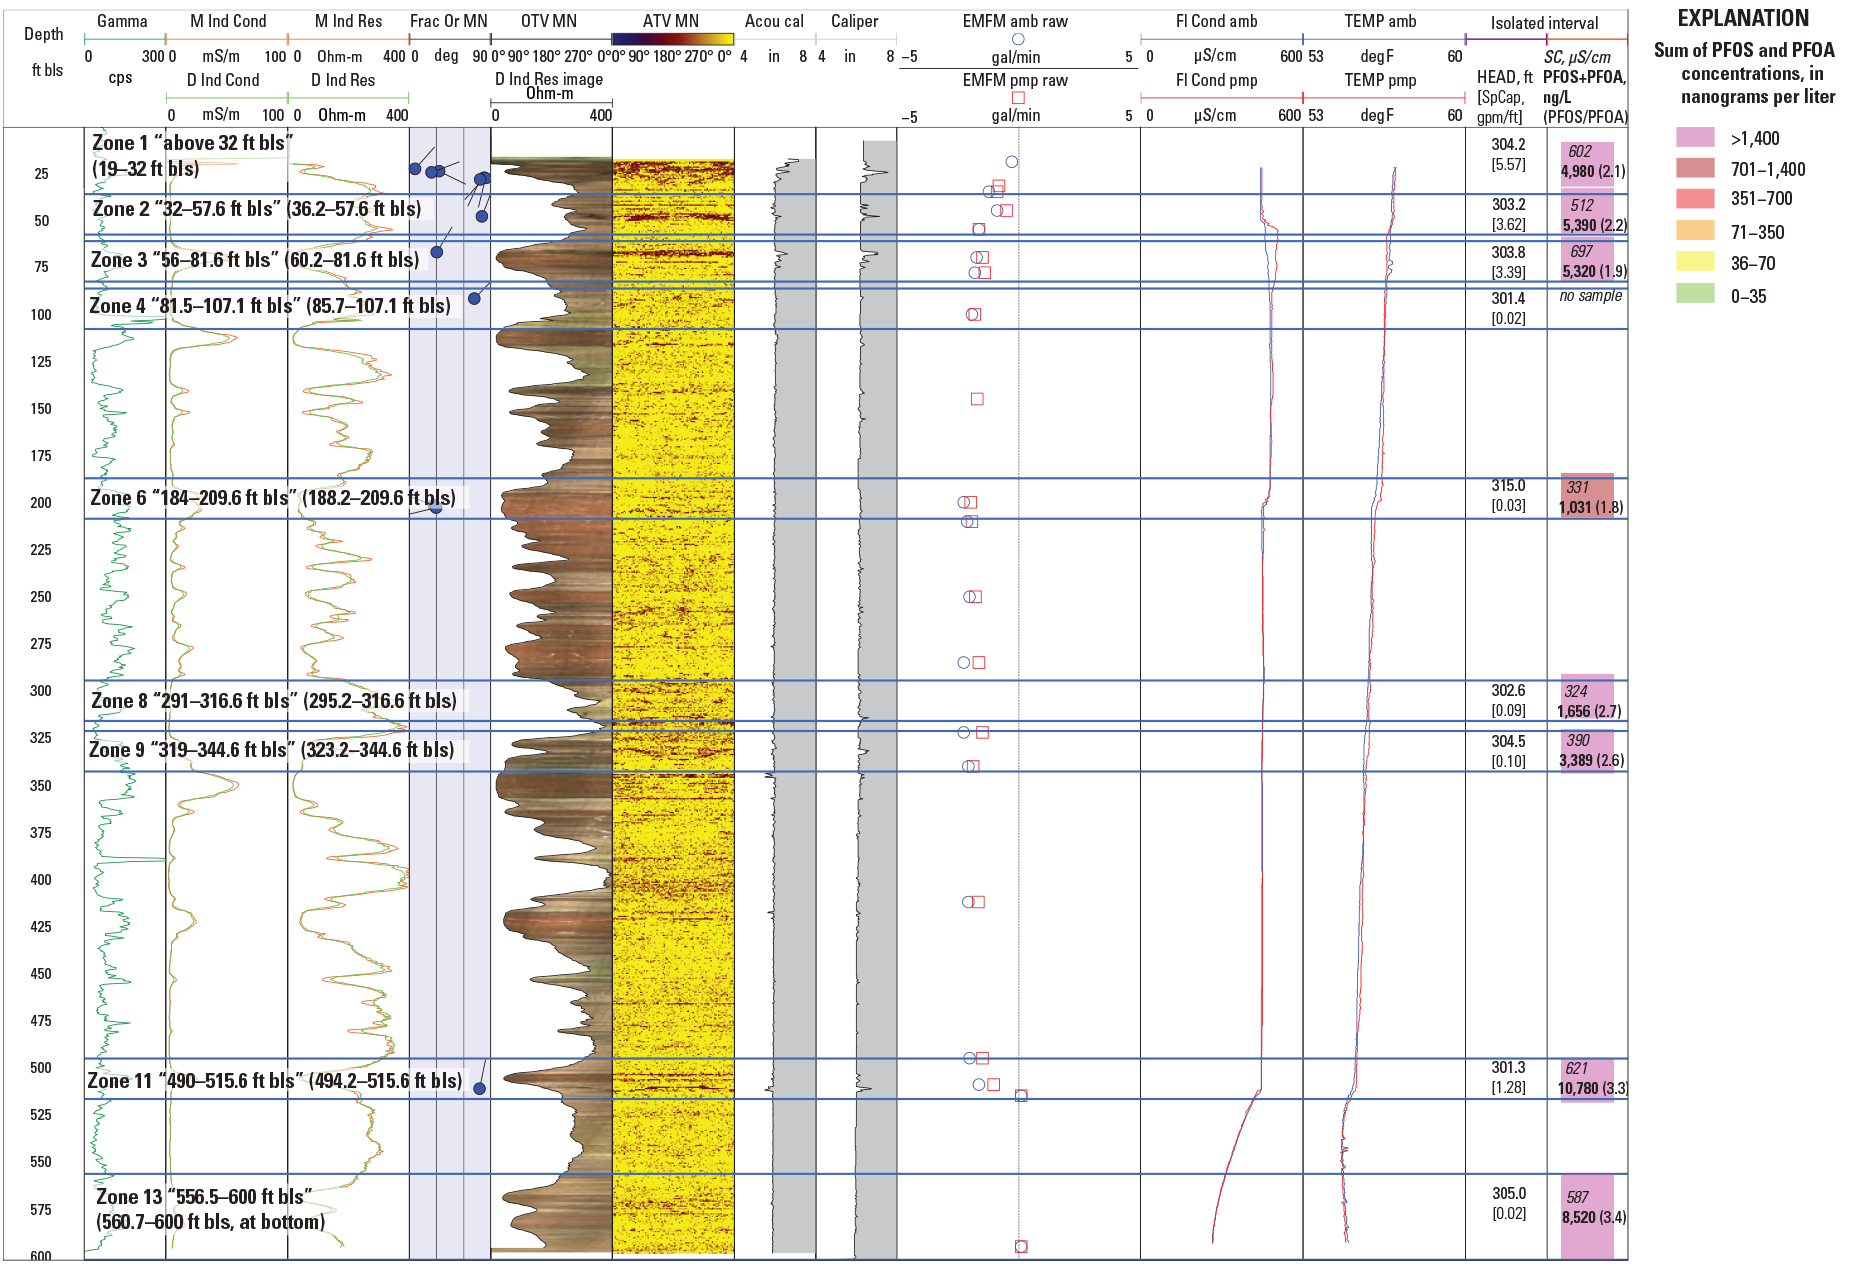
Geophysical logs for, and selected physical and chemical results of, September–October 2018 aquifer-interval-isolation (packer) tests in, borehole BK–3068 (well HN–117), at the former Naval Air Warfare Center Warminster, Bucks County, Pennsylvania, including isolated-interval hydraulic head (in feet above North American Vertical Datum of 1988 [NAVD 88]), specific capacity (in gallons per minute per foot [gpm/ft]),water-sample specific conductance (in microsiemens per centimeters [µS/cm]), summed concentration of perfluorooctanesulfonic acid (PFOS) and perfluorooctanoic acid (PFOA) (in nanograms per liter [ng/L]), and PFOS-to-PFOA mass ratio. PFOS and PFOA data from Battelle (2021). Isolated intervals are depicted by blue lines, with depths to top and bottom of interval in feet below land surface (ft bls). Name of test for each interval includes zone number and “depths to top of bladder in upper and lower packer.” Estimated depths to top and bottom of tested interval in parentheses and also listed in table 18. See table 2 for explanation of log abbreviations.
Table 18.
Hydraulic head, specific capacity, and selected water quality for aquifer intervals isolated by packers in tests of well BK–3068 (well HN–117) at the former Naval Air Warfare Center Warminster, Bucks County, Pennsylvania, September 21–October 2, 2018.[PFOS and PFOA data from Battelle (2021). Tested isolated interval identified by zone (z) number, listed with depths to top of upper packer bladder and to top and bottom of tested interval. Selected water quality includes field parameters and results of laboratory analysis for major ions, boron, stable isotopes of water (δ2H, δ18O), perfluorooctanesulfonic acid (PFOS) and perfluorooctanoic acid (PFOA). Hydraulic head for isolated interval estimated from postinflation static water level. See table 1.11 in appendix 1 for more information about water levels, pumping rates for tests. Dates shown as month/date/year. ft, feet; bls, below land surface; WL, water-level altitude; NAVD 88, North American Vertical Datum of 1988; Spec. cap., specific capacity; gpm/ft, gallons per minute per foot; DO, dissolved oxygen; mg/L, milligrams per liter; std, standard; SC, specific conductance; µS/cm, microsiemens per centimeter; °C, degree Celsius; Temp, water temperature; PFOS, perfluorooctanesulfonic acid; ng/L, nanograms per liter; PFOA, perfluorooctanoic acid; Ca, calcium; Mg, magnesium; K, potassium; Na, sodium; ANC, acid neutralizing capacity; CaCO3, calcium carbonate; Cl, chloride; F, fluoride; SiO2, silica; SO4, sulfate; B, boron; µg/L, micrograms per liter; δ 2H, delta hydrogen-2; per mil, parts per thousand; δ 18O, delta oxygen-18; z, zone; --, no data]
Hydraulic heads as inferred from postinflation static water levels were highest (water-level altitude of about 314.95 ft above NAVD 88) in the intermediate depth interval spanning 188.2 to 209.6 ft bls (zone 6) and lowest (water-level altitude of 301.3 ft above NAVD 88) in the deep interval spanning 494.2 to 516.6 ft bls (zone 11) (table 18); the altitude of hydraulic heads in other intervals ranged from 302.6 to 304.95 ft above NAVD 88 and showed no clear relation with depth as heads greater than 304 ft above NAVD 88 in altitude were measured in the shallowest (zone 1, “above 32 ft bls”), intermediate (zone 9, “319–344-ft bls”), and deepest (zone 13, “556.5–600 ft bls”) intervals. This distribution in hydraulic heads indicates that the potential for both upward and downward flow among isolated intervals in the borehole, but the relatively low head and high specific capacity in zone 11 (“490–515.6 ft bls”; open 494.2–515.6 ft bls) may have resulted in net downward flow directions to those depths measured at the time of logging (fig. 30) and while the borehole was open. The sum of specific-capacity values from packer tests is 14.1 (gal/min)/ft in BK–3068 (HN–117), among the highest of the 6 new wells drilled in 2018, and about 13 percent more than the total specific capacity of 12.5 (gal/min)/ft for the open borehole estimated from data collected while logging (tables 4 and 18); the difference between sum of specific-capacity values from packer tests and that determined from logging is related to hydraulic interconnections and resulting overestimation of specific capacity for the isolated interval in the zone 2 test (appendix 1, table 1.11). The shallowest interval above 32 ft bls (zone 1, open 19–32 ft bls) had the highest specific capacity of 5.57 (gal/min)/ft and includes fractures above 32 ft bls identified from logging as being most hydraulically active (Senior and others, 2021).
Field water quality showed higher specific conductance (512–697 µS/cm) in water from shallowest isolated intervals above about 82 ft bls (zones 1, 2, and 3) and deepest intervals below about 494 ft bls (zones 11 and 13) than in water from intermediate depth intervals (324–390 µS/cm) (zones 6, 8, and 9, ranging in depth from about 188 to 345 ft bls) (table 18), only partially consistent with fluid logs collected during geophysical logging that showed lowest conductance at depth (fig. 30). Dissolved oxygen levels were highest (1.3–1.5 mg/L) in shallower intervals above about 82 ft bls (zones 1, 2, and 3) and lowest (0.3 to 0.8 mg/L) in water from intervals at depths below about 188 ft bls (zones 6, 8, 9, 11, and 13). Water from zones 1 and 2 had slightly more acidic pH of 6.4 to 6.5, respectively, compared to water from other intervals which had pH ranging from 6.6 to 7.7 (table 18).
Differences in selected ions and PFAS concentrations among isolated intervals followed the general patterns of water quality indicated by field measurements given above. Water samples from shallow intervals above 82 ft bls (zones 1, 2, and 3) and deep intervals below about 494 ft bls (zones 11 and 13) were similar in composition to each other but different from water samples from intermediate-depth intervals, ranging from about 188 to 345 ft bls (zones 6, 8, 9); water samples from the shallow and deep intervals have, in addition to higher specific conductance, higher sodium, chloride (102 to 155 mg/L), sulfate and boron concentrations, lower pH and silica concentrations, and heavier (less negative) isotopic composition than water samples from intermediate depth intervals (table 18; fig. 7A). The isotopic composition of water from the shallow intervals (zones 1, 2, and 3) and the deep intervals (zones 11 and 13) is the heaviest of water from all intervals tested, having values that are consistent with summertime precipitation (Feng and others, 2009), suggesting possibly recent recharge as the isolation interval tests were completed in late September to early October 2018. Water from shallow intervals above 82 ft bls (zones 1, 2, and 3) also had lowest acid neutralizing capacity. Summed concentrations of PFOA and PFOS were greater than the LHA of 70 ng/L in water from all intervals tested, ranging from 1,031 ng/L in zone 6 (“184–209.6 ft bls”; open 188.2–209.6 ft bls) to 10,780 ng/L in zone 11 (“490–515.6 ft bls”; open 494–515.6 ft bls). Higher PFAS concentrations generally appeared to be related to higher chloride concentrations (figure 6A).
The samples from isolated intervals in borehole BK–3068 (HN–117) plot as transitional between two different water types, with higher PFAS concentrations (4,980–10,780 ng/L) in sodium-calcium-chloride type (zones 1, 2, 3, 11, and 13) waters and lower PFAS concentrations (1,030–3,389 ng/L) in calcium-sodium-bicarbonate-chloride type waters (zones 6, 8, and 9), as shown in the Piper diagram in figure 31. The sources of chloride in water with elevated chloride concentrations (greater than 100 mg/L) have a large component of sodium chloride, as the chloride to sodium molar ratio for samples from these intervals (zones 1, 2, 3, 11, and 13) is near 1.0 (0.88–1.20) (table 18).
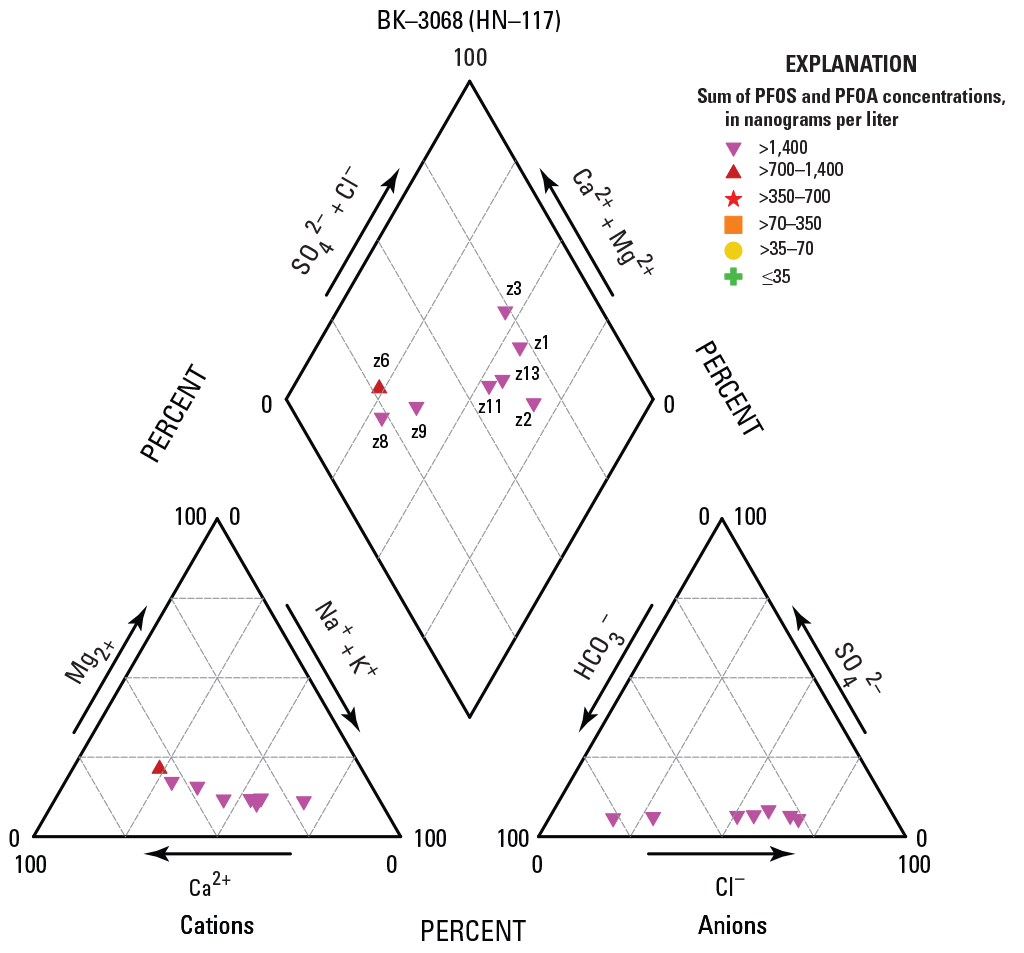
Piper diagram showing relative major ion composition of water samples collected from eight isolated intervals in borehole BK–3068 (well HN–117), at the former Naval Air Warfare Center Warminster, Bucks County, Pennsylvania, September–October 2018, with symbols depicting the range of summed perfluorooctanesulfonic acid (PFOS) and perfluorooctanoic acid (PFOA) concentrations. Cations include calcium (Ca2+), magnesium (Mg2+), sodium (Na+), and potassium (K+). Anions include bicarbonate (HCO3-), chloride (Cl-), and sulfate (SO42-). Intervals labeled by zone (z) number.
Like other deep boreholes such as BK–3067 (HN–119), the pattern in borehole flow and differences in chemical composition and PFAS concentrations as exhibited in BK–3068 (HN–117) suggest that the borehole intercepts several different groundwater flow paths that have different hydraulic heads, which in the open borehole, can result in flow from shallower to deeper water-bearing features. Local pumping associated with groundwater extraction for remediation purposes at NAWC Warminster Area C (Battelle, 2016) may potentially lower hydraulic heads in shallow intervals. Groundwater with elevated chloride and dissolved oxygen concentrations, low pH and acid neutralizing capacity, and relatively elevated PFAS concentrations may enter the borehole at shallow depths above about 82 ft bls and travel down the open borehole to exit through fractures below 490 ft bls, as indicated by similar chemical compositions of waters from these different depths, including the heaviest (least negative) isotopic composition (figure 7A); these similarities and observed borehole flow directions suggest that water sampled from the deepest intervals (zones 11 and 13) is a mixture of water from shallow and deep intervals. Groundwater with the lowest PFAS and chloride concentrations and lightest (most negative) isotopic composition was from zone 6 (“184–209.6 ft bls”), the interval with the highest hydraulic head (table 18; figure 7A). The vertical distribution of PFAS concentrations in water from isolated intervals in BK–3068 (HN–117) suggests that sources for these constituents may be close to, and also at some distance from, the well head.
BK–3070 (HN–120D)
BK–3070 (HN–120D) is a 6-in. diameter, 555-ft deep borehole with 59 ft of casing drilled to initial depth of 580 ft in 2018 and reconstructed in 2019 as a monitoring well; open-borehole static water levels were 15.44 ft bls at the time of logging (table 4) and about 14.8–15.1 ft bls at the time of packer testing (appendix 1, table 1.12). BK–3070 (HN–120D) was the second borehole drilled in its general location after the first borehole BK–3069 (HN–120S) collapsed during drilling. Geophysical and borehole video logs collected by USGS in October 2018 (Senior and others, 2021) indicated several low- and high-angle water-bearing fractures throughout the borehole, with fractures above 68 ft bls appearing to be the most hydraulically active. Under ambient conditions at the time of logging in the open borehole, downward flow was measured from about 62 to 545 ft bls, with decreases in downward flow below 124 ft bls and substantial decreases in downward flow below 322 ft bls (Senior and others, 2021). Eight intervals were initially selected for testing using straddle packers with a spacing of 22.9 ft between the top of the upper and lower bladders and an estimated test-interval length of about 18.7 ft between packers assuming complete seals of 4.2-ft long upper and lower packer bladders; however, only seven intervals were completed (fig. 32; tables 4 and 19), as the test of zone 6 indicated a very low yield (appendix 1, table 1.12). Little to no hydraulic connection to adjacent intervals, as indicated by small to no drawdown in intervals adjacent to the pumped isolated interval, was observed for tests of all intervals other than the tests of zone 1 (“above 65 ft bls”; open 59–65 ft bls) and zone 2 (“65–87.9 ft bls”; open 69.2–87.9 ft bls), during which water levels indicated hydraulic interconnection to the intervals across the packer placed at 65 ft bls (appendix 1, table 1.12). Water levels in nearby (about 30 ft away) open borehole BK–3069 (well HN–120S) were measured during aquifer-interval-isolation tests in BK–3070 (HN–120D) to provide information about the extent of hydraulic connection between the two boreholes and showed response to pumping in shallow intervals, zones 1 and 2, in BK–3070 (HN–120D) (appendix 1, table 1.12); borehole BK–3068 (HN–120S) is open from 20 to about 30 ft bls, after collapsing below that depth (30 ft bls) during drilling.
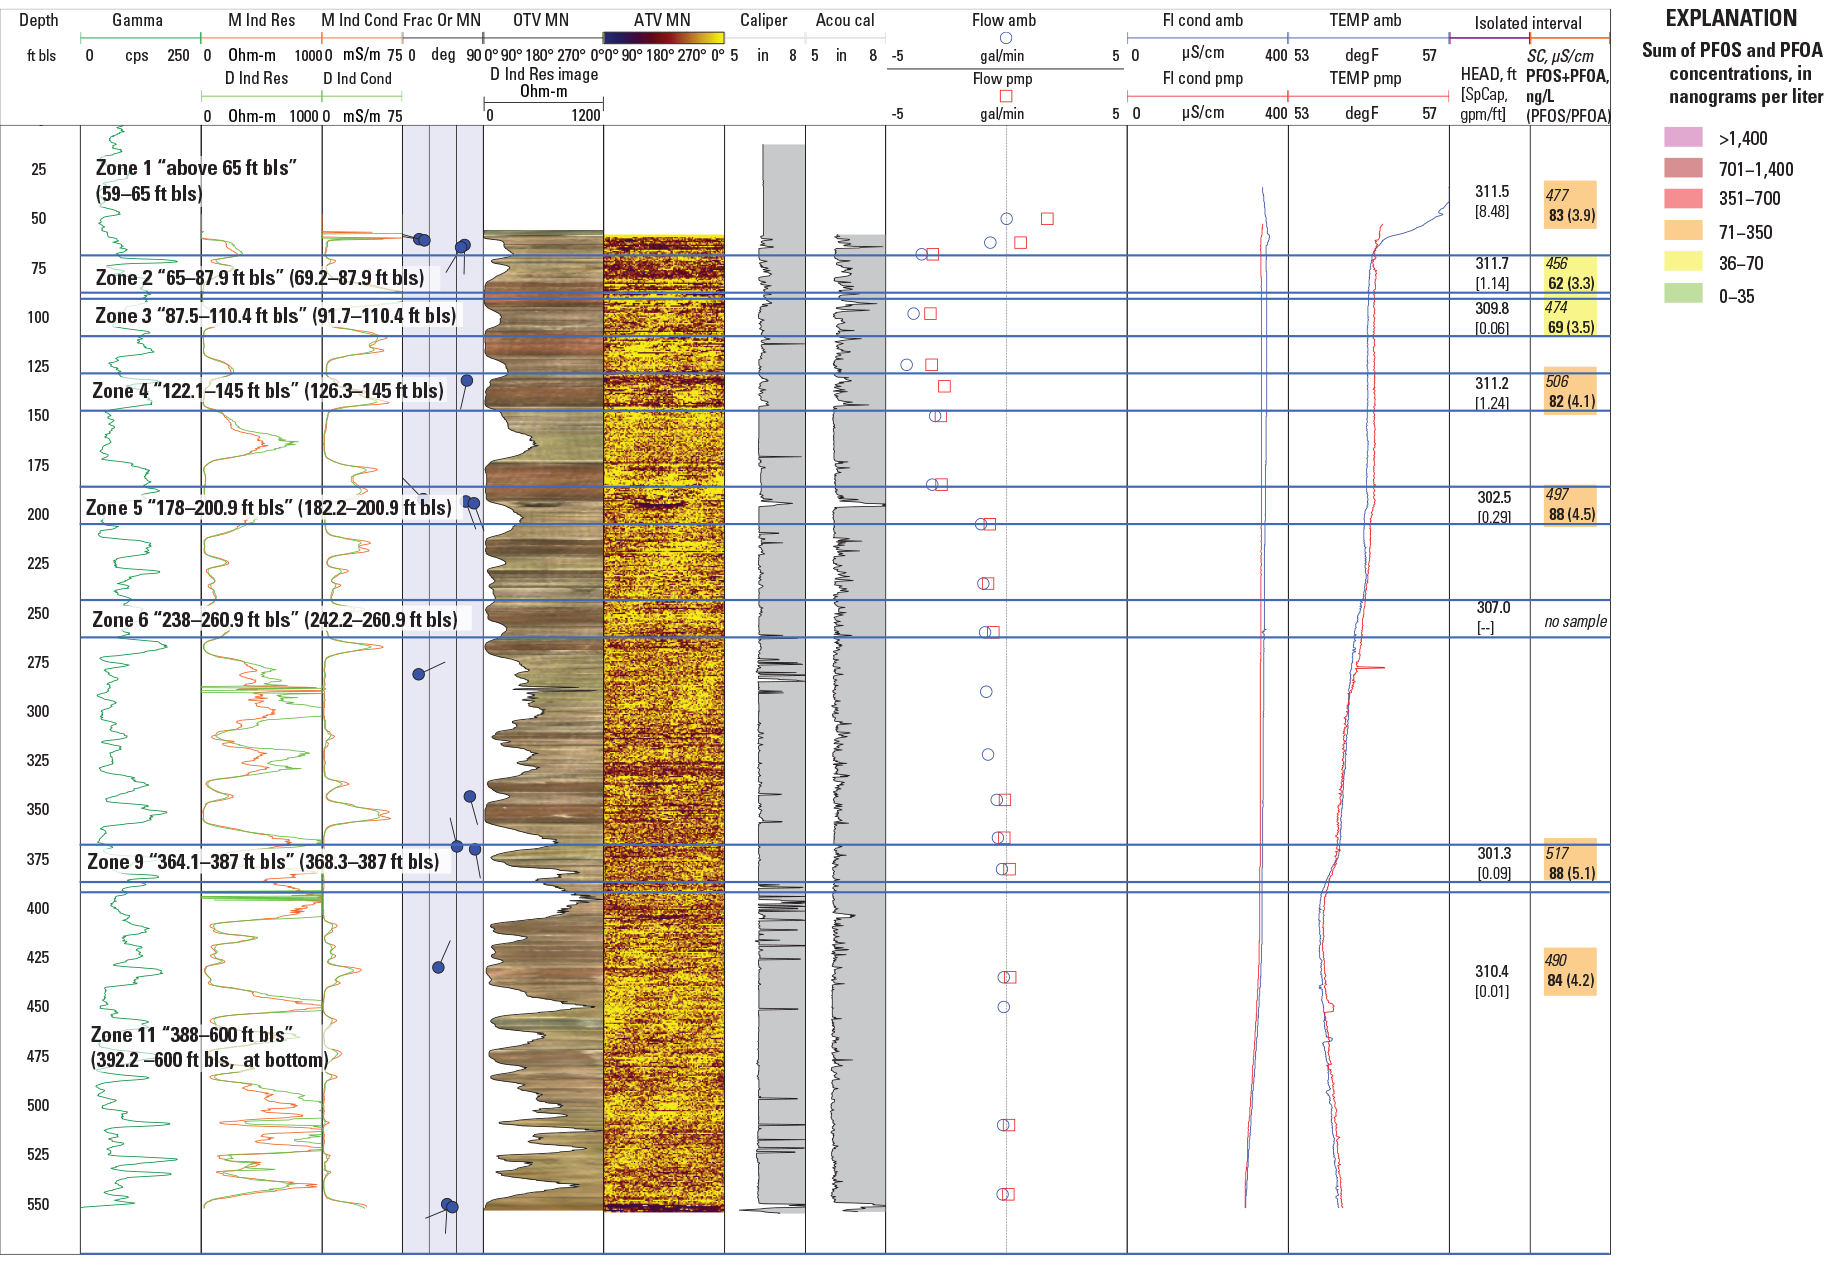
Geophysical logs for, and selected physical and chemical results of, November 2018 aquifer-interval-isolation (packer) tests in, borehole BK–3070 (well HN–120D), at the former Naval Air Warfare Center Warminster, Bucks County, Pennsylvania, including isolated-interval hydraulic head (in feet above North American Vertical Datum of 1988 [NAVD 88]), specific capacity (in gallons per minute per foot [gpm/ft]), water-sample specific conductance (in microsiemens per centimeters [µS/cm]), summed concentrations of perfluorooctanesulfonic acid (PFOS) and perfluorooctanoic acid (PFOA) (in nanograms per liter [ng/L]), and PFOS to PFOA mass ratio. PFOS and PFOA data from Battelle (2021). Isolated intervals are depicted by blue lines, with depths to top and bottom of interval in feet below land surface (ft bls). Name of test for each interval includes zone number and “depths to top of bladder in upper and lower packer.” Estimated depths to top and bottom of tested interval in parentheses and also listed in table 19. See table 2 for explanation of log abbreviations.
Table 19.
Hydraulic head, specific capacity, and selected water quality for aquifer intervals isolated by packers in tests of well BK–3070 (well HN–120D) at the former Naval Air Warfare Center Warminster, Bucks County, Pennsylvania, November 1–9, 2018.[PFOS and PFOA data from Battelle (2021). Tested isolated interval identified by zone (z) number, listed with depths to top of upper packer bladder and to top and bottom of tested interval. Selected water quality includes field parameters and results of laboratory analysis for major ions, boron, stable isotopes of water (δ2H, δ18O), perfluorooctanesulfonic acid (PFOS) and perfluorooctanoic acid (PFOA). Hydraulic head for isolated interval estimated from postinflation static water level. See table 1.12 in appendix 1 for more information about water levels and pumping rates for tests. Dates shown as month/date/year. ft, feet; bls, below land surface; WL, water-level altitude; NAVD 88, North American Vertical Datum of 1988; Spec. cap., specific capacity; gpm/ft, gallons per minute per foot; DO, dissolved oxygen; mg/L, milligrams per liter; std, standard; SC, specific conductance; µS/cm, microsiemens per centimeter; °C, degree Celsius; Temp, water temperature; PFOS, perfluorooctanesulfonic acid; ng/L, nanograms per liter; PFOA, perfluorooctanoic acid; Ca, calcium; Mg, magnesium; K, potassium; Na, sodium; ANC, acid neutralizing capacity; CaCO3, calcium carbonate; Cl, chloride; F, fluoride; SiO2, silica; SO4, sulfate; B, boron; µg/L, micrograms per liter; δ 2H, delta hydrogen-2; per mil, parts per thousand; δ 18O, delta oxygen-18; z, zone; --, no data]
Hydraulic heads as inferred from postinflation static water levels were highest (water-level altitudes of about 309.8 to 311.7 ft above NAVD 88) in intervals above 145 ft bls (zones 1, 2, 3, and 4) and lowest (water-level altitude of 301.3 ft above NAVD 88) in the interval from 368.3 to 387.0 ft bls (zone 9) (table 19). This distribution in hydraulic heads indicates an overall potential for downward flow to depths near 387 ft bls, which is generally consistent with flow directions and rates measured at the time of logging (fig. 32). The sum of specific-capacity values from packer tests is 11.3 (gal/min)/ft in BK–3070 (HN–120D), among the highest of boreholes tested; the sum is about 25 percent more than the total specific capacity of 9 (gal/min)/ft for the open borehole estimated from data collected while logging (tables 4 and 19), possibly because of an overestimation related to interconnections in the tests of zones 1 and 2 (appendix 1, table 1.12). The shallowest interval above 65 ft bls (zone 1) has the highest apparent specific capacity of 8.48 (gal/min)/ft (a value that is higher than actual because of hydraulic connections to adjacent intervals) and includes fractures identified from logging as being most hydraulically active (Senior and others, 2021).
Field water quality showed a relatively small range in specific conductance (456–517 µS/cm) in water from all isolated intervals (table 19), which is consistent with fluid logs collected during geophysical logging (fig. 32). Dissolved oxygen concentrations were moderate to low (0.4–2.8 mg/L) and did not show a pattern related to depth. The pH was near neutral (6.9– 7.5), and like DO concentrations, did not show a pattern related to depth (table 19). The deepest interval tested, zone 11 (“388–600 ft bls”; open 382.4–600 ft bls at bottom of borehole), had a very low yield and was not pumped sufficiently to remove three interval volumes (appendix 1, table 1.12), so water-quality results for this interval represent mixed borehole water.
Small to no differences in dissolved ion and PFAS concentrations were apparent among isolated intervals, although water from the shallowest interval above 65 ft bls (zone 1) had the highest magnesium and sulfate concentrations, highest pH, and lowest potassium, sodium, and boron concentrations (table 19). Summed concentrations of PFOA and PFOS were greater than the LHA of 70 ng/L in water from 6 of 8 intervals tested, ranging from 62 ng/L in zone 2 (“65–87.9 ft bls”; open 69.2–87.9 ft bls) to 88 ng/L in zones 5 (“178–200.9 ft bls”; open 182.4–200.9 ft bls) and 9 (“364.1–387 ft bls”; open 368.3–387 ft bls). PFAS concentrations were highest (88 ng/L) in intervals (zones 5 and 9) with the lowest hydraulic heads (table 19). PFAS concentrations did not appear to be related to chloride concentrations for the small range of values for these constituents from isolated intervals in BK–3070 (HN–120D) (fig. 6A).
The samples from isolated intervals in BK–3070 (HN–120D) all plot as the same water calcium-bicarbonate water type with some component of magnesium and chloride (fig. 33). The sources of chloride in the water samples have a large sodium chloride component, as the chloride to sodium molar ratio for samples is not much larger than 1.0 (1.24–1.55) (table 19). The lack of differences in water quality among the intervals may be partly related to mixing, as water from shallow water-bearing features could travel down to deeper water-bearing features either through open boreholes or through interconnections in the aquifer, as indicated by small differences in hydraulic heads among isolated intervals.
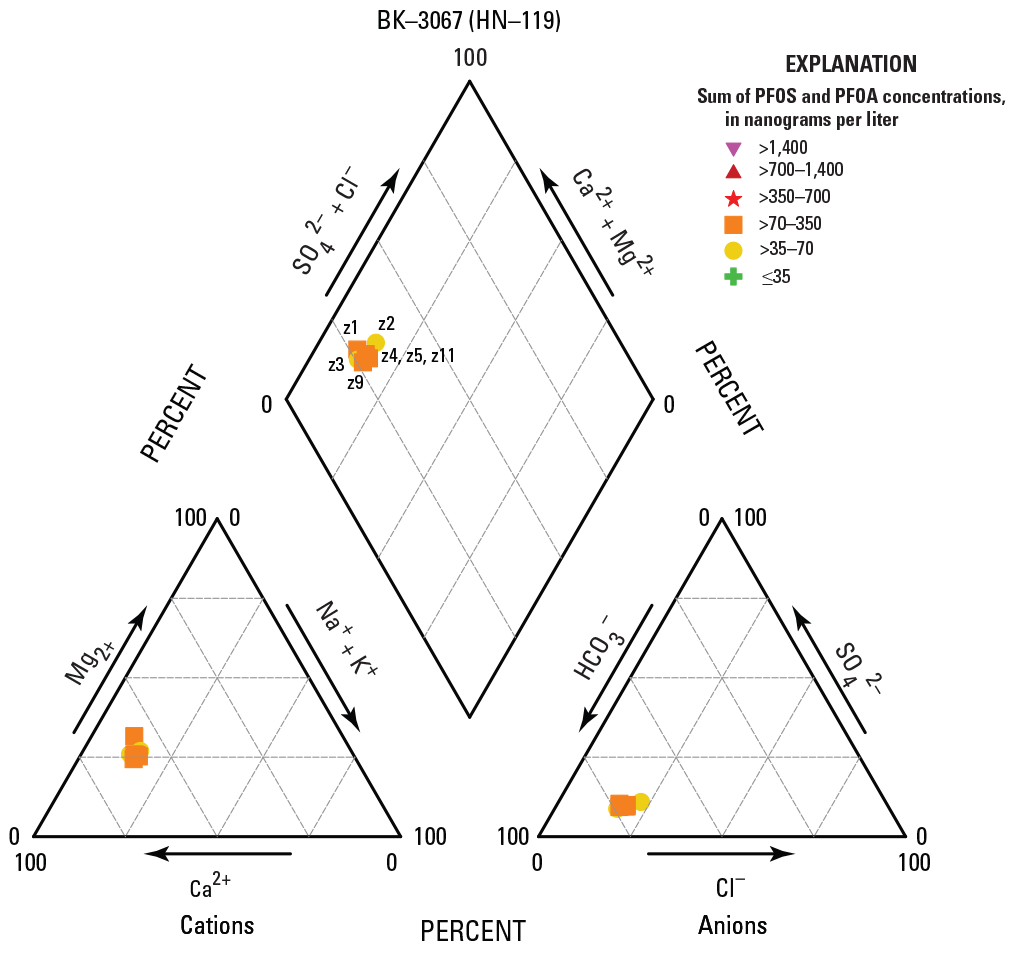
Piper diagram showing relative major ion composition of water samples collected from seven isolated intervals in borehole BK–3070 (well HN–120D), at the former Naval Air Warfare Center Warminster, Bucks County, Pennsylvania, November 2018, with symbols depicting the range of summed perfluorooctanesulfonic acid (PFOS) and perfluorooctanoic acid (PFOA) concentrations. Cations include calcium (Ca2+), magnesium (Mg2+), sodium (Na+), and potassium (K+). Anions include bicarbonate (HCO3-), chloride (Cl-), and sulfate (SO42-). Intervals labeled by zone (z) number.
BK–3071 (HN–121)
BK–3071 (HN–121) was drilled as a 6-in. diameter, 600-ft deep borehole with 20 ft of casing in 2018 but collapsed below 400 ft after drilling (and before logging and packer tests) to a depth of about 415 ft and reconstructed in 2019 as a monitoring well; open-borehole static water levels were 11.6 ft bls at the time of logging (table 4) and about 11.1–11.5 ft bls at the time of packer testing (appendix 1, table 1.13). Geophysical and borehole video logs collected by USGS in November 2018 (Senior and others, 2021) indicated several low- and high-angle water-bearing fractures throughout the borehole, with fractures above 32 ft bls appearing to be the most hydraulically active. Under ambient conditions at the time of logging in the open borehole, downward flow was measured from about 34 to 410 ft bls, with decreases in downward flow below 360 ft bls; measured downward flow rates were greater under pumping conditions than under ambient conditions, suggesting transient pumping nearby (Senior and others, 2021). Eight intervals were selected for testing using straddle packers with a spacing of 29.9 ft between the top of the upper and lower packer bladders and an estimated test-interval length of about 25.7 ft between packers, assuming complete seals of 4.2-ft long upper and lower packer bladders (fig. 34; tables 4 and 20). Little to no hydraulic connection to adjacent intervals, as indicated by small to no drawdown in intervals adjacent to the pumped isolated interval, was observed for tests of all zones (appendix 1, table 1.13).
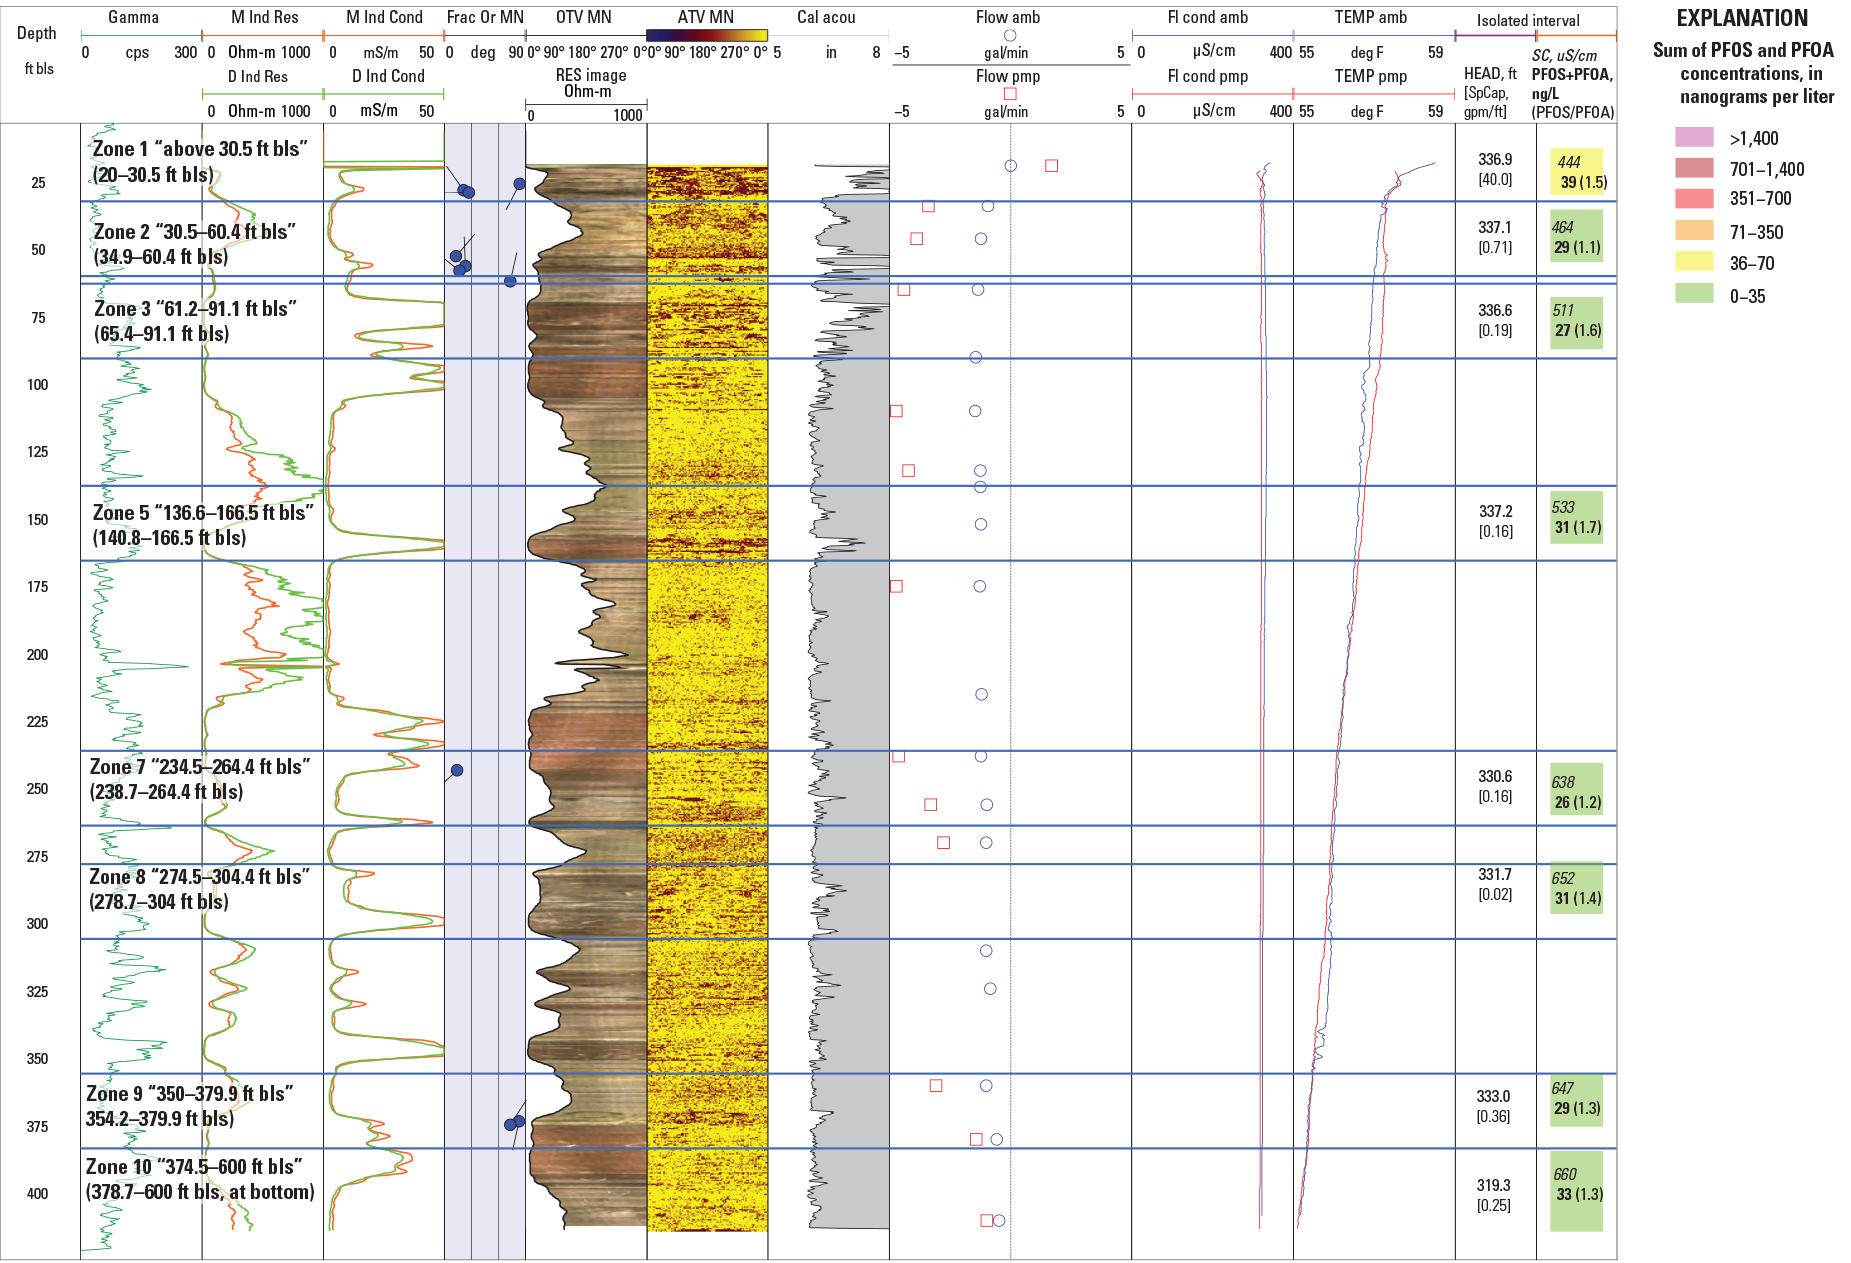
Geophysical logs for, and selected physical and chemical results of, November 2018 aquifer-interval-isolation (packer) tests in, borehole BK–3071 (well HN–121), at the former Naval Air Warfare Center Warminster, Bucks County, Pennsylvania, including isolated-interval hydraulic head (in feet above North American Vertical Datum of 1988 [NAVD 88]), specific capacity (in gallons per minute per foot [gpm/ft]), water-sample specific conductance (in microsiemens per centimeters [µS/cm]), summed concentration of perfluorooctanesulfonic acid (PFOS) and perfluorooctanoic acid (PFOA) (in nanograms per liter [ng/L]), and PFOS to PFOA mass ratio. PFOS and PFOA data from Battelle (2021). Isolated intervals are depicted by blue lines, with depths to top and bottom of interval in feet below land surface (ft bls). Name of test for each interval includes zone number and “depths to top of bladder in upper and lower packer.” Estimated depths to top and bottom of tested interval in parentheses and also listed in table 20. See table 2 for explanation of log abbreviations.
Table 20.
Hydraulic head, specific capacity, and selected water quality for aquifer intervals isolated by packers in tests of well BK–3071 (well HN–121) at the former Naval Air Warfare Center Warminster, Bucks County, Pennsylvania, November 14–27, 2018.[PFOS and PFOA data from Battelle (2021). Tested isolated interval identified by zone (z) number, listed with depths to top of upper packer bladder and to top and bottom of tested interval. Selected water quality includes field parameters and results of laboratory analysis for major ions, boron, stable isotopes of water (δ2H, δ18O), perfluorooctanesulfonic acid (PFOS) and perfluorooctanoic acid (PFOA). Hydraulic head for isolated interval estimated from postinflation static water level. See table 1.13 in appendix 1 for more information about water levels, pumping rates for tests. Dates shown as month/date/year. ft, feet; bls, below land surface; WL, water-level altitude; NAVD 88, North American Vertical Datum of 1988; Spec. cap., specific capacity; gpm/ft, gallons per minute per foot; DO, dissolved oxygen; mg/L, milligrams per liter; std, standard; SC, specific conductance; µS/cm, microsiemens per centimeter; °C, degree Celsius; Temp, water temperature; PFOS, perfluorooctanesulfonic acid; ng/L, nanograms per liter; PFOA, perfluorooctanoic acid; Ca, calcium; Mg, magnesium; K, potassium; Na, sodium; ANC, acid neutralizing capacity; CaCO3, calcium carbonate; Cl, chloride; F, fluoride; SiO2, silica; SO4, sulfate; B, boron; µg/L, micrograms per liter; δ 2H, delta hydrogen-2; per mil, parts per thousand; δ 18O, delta oxygen-18; z, zone; --, no data]
Hydraulic heads as inferred from postinflation static water levels were highest (water-level altitudes of about 336.6 to 337.2 ft above NAVD 88) in the intervals above 166.5 ft bls (zones 1, 2, 3, and 5) and lowest (water-level altitude of 319.3 ft above NAVD 88) in the interval below 378.7 ft bls to bottom of borehole (zone 10) (table 20). This distribution in hydraulic heads indicates an overall potential for downward flow, which is consistent with flow directions and rates measured at the time of logging (fig. 34). The sum of specific-capacity values from packer tests is about 41.9 (gal/min)/ft in BK–3071 (HN–121), the highest of boreholes tested. The sum is about 23 percent more than the total specific capacity of 34 (gal/min)/ft for the open borehole estimated from data collected while logging (tables 4 and 20), a value that may be affected by inaccurate or unsteady drawdown during logging. The shallowest interval above 30.5 ft bls (zone 1, open 20–30.5 ft bls) has the highest specific capacity of 40 (gal/min)/ft and includes fractures identified from logging as being most hydraulically active (Senior and others, 2021).
Field water quality showed that specific conductance increased with depth, from 444 µS/cm in water above 30.5 ft bls (zone 1) to 660 µS/cm in water below 378.7 ft bls (zone 10) (table 20). This vertical distribution of specific conductance differs from the straight fluid conductance log collected during geophysical logging, which was likely affected by downward flow in the open borehole (fig. 34). Dissolved oxygen concentrations were higher (4.0–4.9 mg/L) in the shallower intervals above about 91 ft bls (zones 1, 2, and 3) than in the deeper intervals (table 20). The water had acidic pH of 5.4 from the shallowest interval above 30.5 ft bls (zone 1) and near neutral pH ranging from 6.5 to 7.3 from all other intervals. The deepest interval tested, zone 10 (“below 374.5 ft bls”; open from 378.7 to about 415 ft bls and collapsed section below 415 ft bls to initial bottom at 600 ft bls) was pumped sufficiently to remove about only 1.5-interval volumes, as calculated by assuming the borehole was open 378.7–600 ft bls (appendix 1, table 1.13), so water-quality results for this interval represent some mixture of open borehole water.
Differences in dissolved ion and PFAS concentrations were apparent among isolated intervals, with water from the shallowest interval above 30.5 ft bls (zone 1) having the highest sodium, chloride, boron, and PFAS concentrations and lowest calcium, magnesium, silica concentrations, lowest pH, acid neutralizing capacity, and specific conductance (table 20). Water samples from zones 2 and 3 (intervals ranging in depth from about 34.7 to 91 ft bls) had the highest magnesium and lowest sodium concentrations compared to other intervals. Summed concentrations of PFOA and PFOS were less than the LHA of 70 ng/L and differed little in value in water from intervals tested, were highest (39 ng/L) in water from the shallowest interval (zone 1), and ranged from 26 to 33 ng/L in water from other intervals. PFAS concentrations appeared to be weakly related to chloride concentrations for the relatively small range of values for these constituents in isolated intervals in BK–3071 (HN–121) (figure 6A).
The samples from isolated intervals in borehole BK–3071 (HN–121) plot as two types, a calcium-sodium-chloride type with highest PFAS for water from the shallowest interval (zone 1) and calcium-magnesium-bicarbonate type with some component of chloride for water from other intervals (fig. 35). The sources of chloride in the water samples from most intervals have a large sodium chloride component, as indicated by the chloride to sodium molar ratio for these samples being only somewhat larger than 1.0 (1.53–1.96), except for water from relatively shallow intervals ranging in depth from about 34.7 to 91 ft bls (zones 2 and 3) that have chloride to sodium molar ratios that are greater than 3 (table 20).
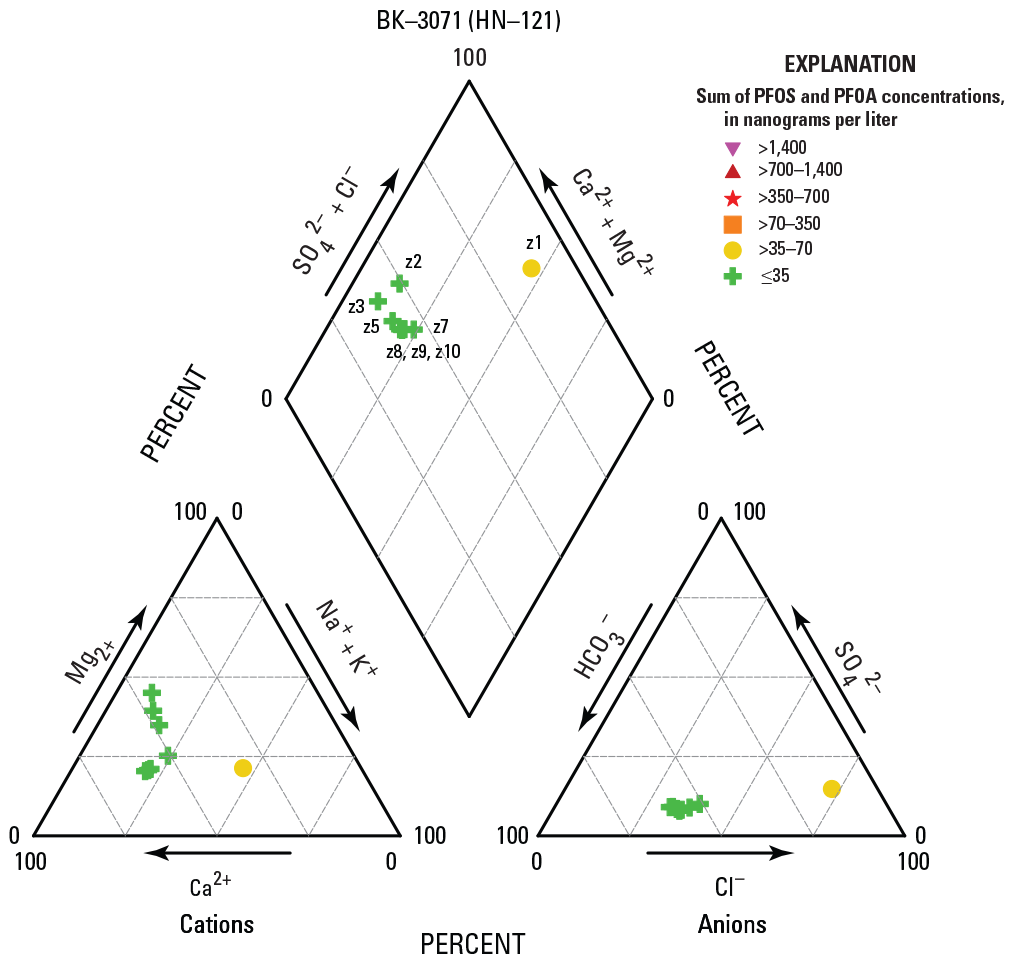
Piper diagram showing relative major ion composition of water samples collected from eight isolated intervals in borehole BK–3071 (well HN–121), at the former Naval Air Warfare Center Warminster, Bucks County, Pennsylvania, November 2018, with symbols depicting the range of summed perfluorooctanesulfonic acid (PFOS) and perfluorooctanoic acid (PFOA) concentrations. Cations include calcium (Ca2+), magnesium (Mg2+), sodium (Na+), and potassium (K+). Anions include bicarbonate (HCO3-), chloride (Cl-), and sulfate (SO42-). Intervals labeled by zone (z) number.
Like other deep boreholes such as BK–3067 (HN–119), the pattern in borehole flow and differences in chemical composition and PFAS concentrations as exhibited in BK–3071 (HN–121) suggests that the borehole intercepts several different groundwater flow paths that have different hydraulic heads, which in the open borehole, can result in flow from shallower to deeper water-bearing features. Groundwater with elevated chloride and dissolved oxygen concentrations, low pH and acid neutralizing capacity, and the highest PFAS concentrations is present at shallow depths above about 30.5 ft bls (zone 1); water from intervals above about 166 ft bls with the highest heads had the potential to travel down the open borehole and exit through fractures below about 238.7 ft bls (zones 7, 8, 9, and 10), as indicated by similar chemical compositions of waters from these greater depths, which appear to be a mixture of water from shallow and deep intervals. The vertical distribution of PFAS and chloride concentrations in water from isolated intervals in BK–3071 (HN–121) suggests that at least one source for these constituents may be close to the well head.
Geophysical Log Correlation and Relation to Hydrogeologic Framework
Geophysical logs collected by USGS during 2017–19 (Senior and others, 2021) and during 1994–98 for selected deep boreholes (mostly greater than about 300 ft in depth) (table 21) were used to develop lithologic correlations at and near the former NAWC Warminster base at depths up to 600 ft bls. These correlations are shown on geologic sections with measured water levels to help describe the hydrogeologic framework in the study area. The 10 boreholes logged during 2017–19 ranged in depth from 385 to 602 ft, and 10 boreholes logged during 1994–98 ranged in depth from 157 to 576 ft (table 21); other information about length of casing, drill date, and estimated land-surface elevation at well head is given in table 3. Three of the logs collected during 1994-98 in boreholes with depths of only 157 to 171 ft bls (table 21) were included in correlations to provide more spatial detail in selected areas. All boreholes drilled for use as monitoring wells at the former NAWC Warminster are identified by the Navy with the prefix “HN-” followed by a sequentially assigned number (tables 3 and 21).
The sandier and siltier lithologies in the sedimentary rocks of the Stockton Formation can be distinguished using certain geophysical log signatures. Sandier beds are commonly indicated by relatively lower natural gamma activity and higher electrical resistance and, conversely, siltier beds are commonly indicated by relatively higher natural gamma activity and lower electrical resistance. Available data on natural gamma, single-point resistance, and (or) resistivity geophysical logs were correlated between boreholes at and near the former NAWC Warminster at a base-wide scale. The base-wide correlations among boreholes along five section lines are generalized, being limited by sparsity of deep logs and spatially variable characteristics of the Stockton Formation, in which beds may not be laterally continuous or uniform in thickness. These preliminary correlations may be refined using new and additional log data in future studies.
Table 21.
Boreholes with geophysical logs used for lithologic correlations as depicted on section lines at and near the former Naval Air Warfare Center Warminster, Bucks County, Pennsylvania.[Section lines shown on figure 37 and other borehole characteristics listed in table 3. USGS, U.S. Geological Survey; ft, feet; bls, below land surface; X, log used in correlation; O, log collected but not used in correlation; --, log not available or used]
Lithology and Relation to Previous Correlations
Geophysical log correlations on cross sections identified 11 units that contain mudstones and (or) siltstones indicated by relatively elevated gamma activity on logs at NAWC Warminster and vicinity. For purposes of discussion in this report, naming convention for these correlated mudstone and siltstone-containing lithologic units are M–1 (for the shallowest unit) through M–11 (the deepest unit) (table 22). Although only the mudstone and siltstone lithologic units are labeled in this study, sandstone beds of interest are represented by the unnamed portions of the Stockton Formation located between each of these labeled mudstone and siltstone-containing units, so these correlations can be directly converted into sandstone unit correlations as well.
Table 22.
Lithologic units identified from correlation of logs used for this study and corresponding lithologic units identified in previous investigations.[Corresponding lithologic units identified in previous investigations by Sloto and Grazul (1998) and Tetra Tech (2010). Lithologic units identified from correlation of geophysical logs.]
| Correlated mudstone-siltstone containing unit, this study | Lithologic units from Sloto and Grazul (1998)1 | Lithologic units from Tetra Tech (2010) |
|---|---|---|
| M–1 | Not present | A/B contact |
| M–2 | Not present | Part(s) of B |
| M–3 | Not present | B/C contact |
| M–4 | Not present | Part(s) of C |
| M–5 | Part(s) of B | Part(s) of C |
| M–6 | C | Part(s) of C |
| M–7 | E; top of F | Part(s) of C |
| M–8 | G | Not present |
| M–9 | Base of H | Not present |
| M–10 | J | Not present |
| M–11 | Not present | Not present |
Based on well SW-3 from Sloto and Grazul (1998).
Previous work developed log correlations showing sandier and siltier units to a depth of about 300 ft bls in Areas A and D on the northwestern part of the former NAWC Warminster (Tetra Tech, 2010) (fig. 3). Sloto and Grazul (1998) presented log correlations that included two 600-ft deep former supply wells in Area D. Figure 36 and table 22 show how the names for lithologic units presented here relate to those identified in previous log correlations at NAWC Warminster by Sloto and Grazul (1998) and Tetra Tech (2010). The areas of investigation of Sloto and Grazul (1998) and Tetra Tech (2010) are smaller and more localized than the NAWC Warminster base-wide correlations presented in this report, so not all lithologic units mapped in this study are accounted for in either of those previous investigations. Additional studies at NAWC Warminster that contain correlations did not provide label names to lithologic or hydrogeologic units, thus are omitted from comparison.
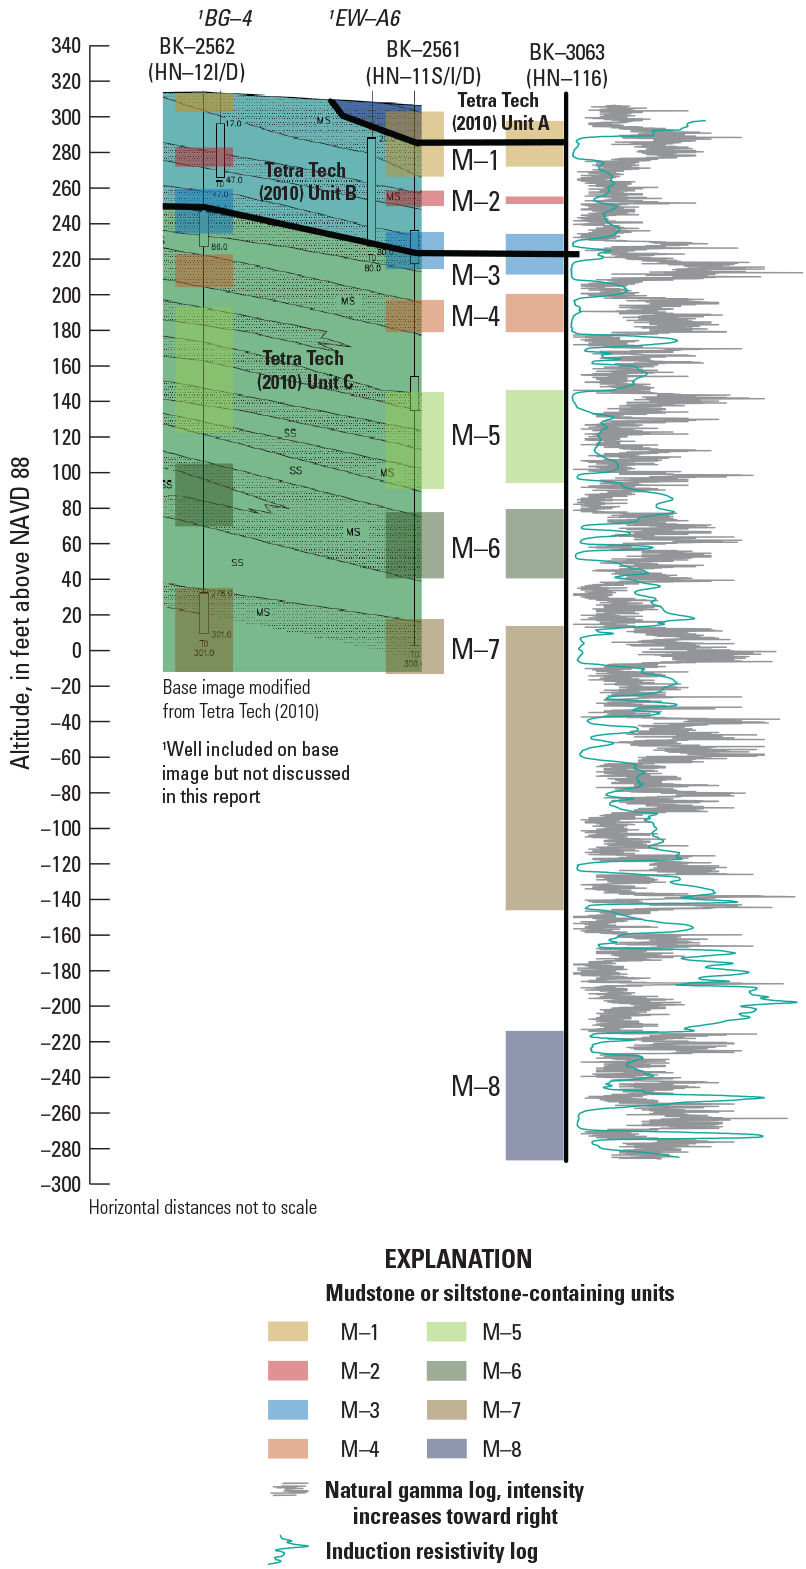
Conceptual cross section delineating lithologic unit names with equivalent previously developed hydrogeologic unit nomenclature for conceptual site model (Tetra Tech, 2010), former Naval Air Warfare Center Warminster, Bucks County, Pennsylvania.
Identification and mapping of lithologic units in this report utilized a similar approach to that of Sloto and Grazul (1998) by drawing contacts of units at the interface between sandstone and mudstone and siltstone units; thus, several units from Sloto and Grazul (1998) have direct equivalents to this study. Tetra Tech (2010) named hydrogeologic units A, B, and C, which group several undivided lithologies within each unit. Contacts between Tetra Tech (2010) units A, B, and C were drawn in the middle of individual mudstone and siltstone beds; for example, the boundary between Tetra Tech (2010) units B and C occurs in the middle of mudstone/siltstone unit M–3 mapped in this study, and therefore, a direct equivalent to this study is not available owing to this different approach to defining regional stratigraphy.
Correlation and Structure
Five cross sections were constructed to show correlation of geophysical logs in the subsurface across NAWC Warminster and vicinity (fig. 37): section A–A′ (plate 1), section B–B′ (plate 2), section C–C′ (plate 3), section D–D′ (plate 4), and section E–E′ (plate 5). Triangulation of bed altitudes on cross sections indicates an approximate strike of N. 78° E., and dips ranging from about 4° NW. to 12° NW. with an average dip of about 8° NW. These estimates are consistent with Conger and Bird (1999), who also estimated a strike of N. 78° E. and dip of 10° NW. Section C–C′ is aligned parallel to the dip direction with wells projected onto the cross section along strike. The other lines of section show true distances between each borehole.
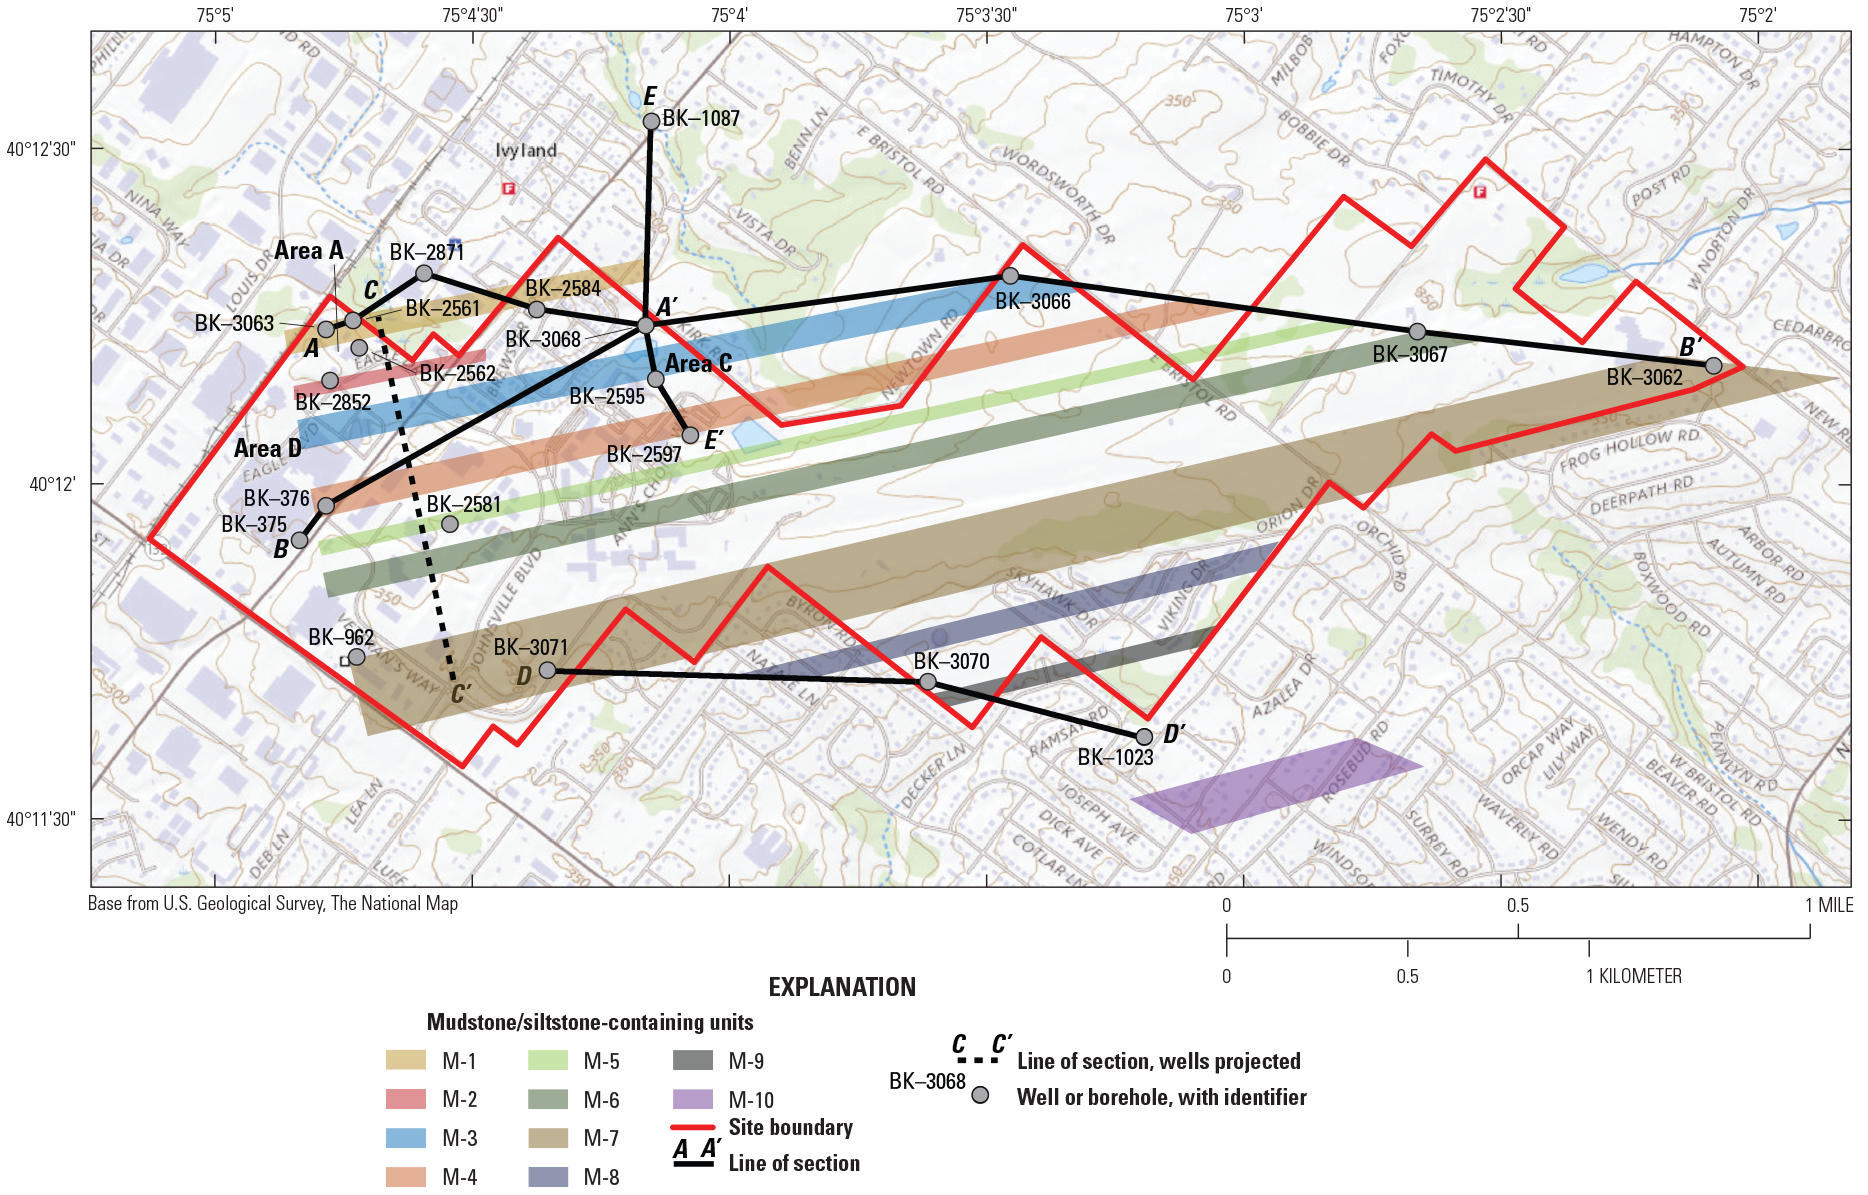
Map showing lines of section and approximate outcrop areas of mudstone and siltstone units, former Naval Air Warfare Center Warminster, Bucks County, Pennsylvania.
The approximate expression of the mudstone and siltstone units at land surface is shown on figure 37 and is where the units correlated on lines of section were projected up to land surface to represent their outcrop areas. Unit M–11 is stratigraphically lower and outcrops farther south of the site where data are lacking, so M–11 is not shown in figure 37. Recharge focused in these outcrop areas passes through soil and weathered bedrock to unweathered sections of the aquifer, where the orientation of water-bearing openings is affected by the lithology and structure of the dipping sedimentary beds and groundwater flow generally will be directed preferentially along the strike and dip of these beds.
Given the nature of the fluvial depositional environment of the Stockton Formation, borehole-log correlations and structure of these units as identified across NAWC Warminster should be considered generalized. The spatial resolution of borehole-log correlations for sandstone units between mudstone and siltstone units is limited to the width (or lateral extent) of the sandstone unit (Bridge and Tye, 2000). Smoot (2010) suggested that the sandstone beds of the Stockton Formation may have lateral extents as small as 300 meters (984 ft) for bed thicknesses ranging from about 10 to 15 meters (about from 33 to 49 ft). The spacings among deep boreholes at NAWC Warminster used for correlation (spacings commonly greater than 1,000 ft and sometimes greater than 3,000 ft) are similar in magnitude to the suggested range of lateral bed extents (Smoot, 2010), but they are large enough to introduce additional uncertainty in log correlations. Other challenges that affect the correlation and structure of these units include an assumption that erosional surfaces at the bottom and top of these beds are flat and consistent between boreholes, which is generally not the case (Bridge and Tye, 2000) as many of these beds are laterally discontinuous and pinch out (Herman, 2010), characteristics that affect the estimated dip angles in particular. Additionally, it was assumed that geologic units on similar stratigraphic levels follow general strike and dip of the beds and are more likely to contain hydraulically connected water-bearing fractures thus, the generalized groundwater pathways indicated in this framework developed by the correlations are still valid at this level of resolution even if the chronologic/stratigraphic correlation between these units differs. Herman (2010) suggested that bed pinch outs do not affect overall aquifer properties such as hydraulic conductivity in the Stockton Formation compared to elsewhere in the Newark Basin, which indicates that these assumptions for correlating units for hydrogeologic interpretation are valid for the Stockton Formation without additional information on their nature. Further refinement to reduce these uncertainties is not possible based on the limited geophysical log data alone.
Distribution of Water Levels and Hydrologic Conditions Within Correlation Framework
Water levels plotted on cross sections indicate general patterns of hydrologic conditions at NAWC Warminster, showing similar relative head differences and vertical gradients among isolated intervals in several boreholes. Water levels measured in isolated intervals during packer tests were not synoptically collected and can be affected by seasonal variability in recharge rates or other temporal variability related to nearby changes in pumping, so they should not be used for direction, although broad characterizations can be assessed at the scale of the NAWC Warminster base. The seasonal range of water levels in 400-ft deep open-borehole observation well BK–1020 was up to about 12 ft during the 2018–19 period of aquifer-interval-isolation tests, a period when overall water levels were generally higher median values than long-term median values (fig. 38).
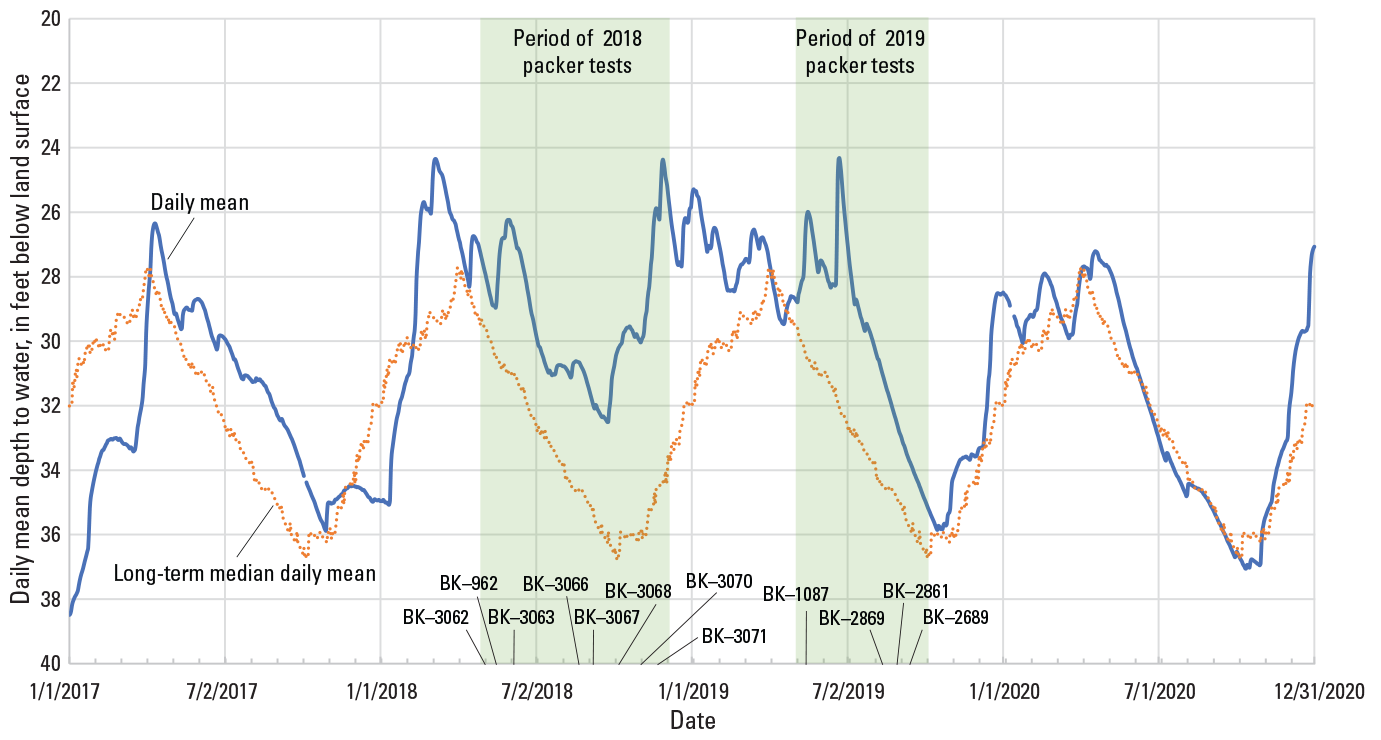
Hydrograph showing 2017–19 daily mean and long-term (January 1976–March 2022) median daily mean water levels in U.S. Geological Survey (USGS) observation well BK–1020, former Naval Air Warfare Center (NAWC) Warminster, Bucks County, Pennsylvania. Periods of packer testing in boreholes at and near NAWC Warminster during 2018–19 are indicated by shading. Data from USGS National Water Information System (U.S. Geological Survey, 2023).
Along the northern and southern perimeters of the former NAWC Warminster, downward vertical gradients were indicated by hydraulic heads measured in isolated intervals during packer testing, especially in deep boreholes (greater than 400 ft), as shown by distribution of these hydraulic heads on sections A–A′ (plate 1), B–B′ (plate 2), and D–D′ (plate 4); the downward vertical gradients in deep boreholes are consistent with borehole flow directions measured during geophysical logging. Preliminary evaluation of observed head distributions suggests that hydraulic heads may be partly related to the topography of outcrop areas of hydrogeologic units, which may then affect groundwater flow and potential contaminant migration at and near the former NAWC Warminster. Observed head distributions also may be affected by nearby local pumping. Other studies in sedimentary-fractured rock aquifers of the Newark Basin have shown that head distributions are partly controlled by land-surface elevations in the recharge area where dipping layers crop out (Risser and Bird, 2003).
In boreholes along the northern perimeter of the NAWC Warminster, including BK–3066 (HN–118), BK–3067 (HN–119), and BK–3062 (well 15) on section B–B′ (plate 2), the highest hydraulic heads were measured in isolated intervals in, or adjacent to, mudstone or siltstone containing lithologic units M–6, where present, or M–7, if M–6 not present, with relatively much higher (10–50 ft) hydraulic heads above (shallower than) than below (deeper than) these units, such that there is an apparent divide in vertical gradients (vertical groundwater divide) associated with these units. Factors affecting this apparent vertical groundwater divide include stratigraphic differences in permeability and recharge and discharge conditions. Lithologic units M–6 and M–7 are estimated, as projected, to crop out near the highest land-surface elevations on the former NAWC Warminster, flanking the former runway, and are not present or limited in extent at lower elevations along the southern perimeter of the NAWC Warminster (fig. 37). In two other wells along the northern perimeter of the former NAWC Warminster, the highest hydraulic heads in boreholes BK–3063 (HN–116) and BK–3068 (HN–117) were in units M–6 or M–7, which occur about 200–400 ft bls as shown in section A–A′ (plate 1). In contrast to most boreholes shown in section B–B′ (plate 2), the hydraulic heads in the shallowest isolated intervals in these two boreholes are similar to, or lower than, hydraulic heads below units M–6 and M–7 and may be affected by nearby local shallow (less than 100 ft deep) pumping for VOC remediation in Areas A and C (Battelle, 2016), respectively (fig. 37).
Hydraulic heads are among the lowest in, or adjacent to, lithologic units M–10 and M–11 in the NAWC Warminster study area. The low hydraulic heads are found near the bottom of boreholes BK–3066 (HN–118), BK–3067 (HN–119), and BK–3062 (well 15) along the northern perimeter of the former NAWC Warminster (section B–B′, plate 2) and at depths of about 300–400 ft in boreholes BK–3071 (HN–121) and BK–3070 (HN–120D) along the southern perimeter of the former NAWC Warminster (section D–D′, plate 4). These lower heads in units M–10 and M–11 may indicate a topographic effect on groundwater levels, with unit outcrop at lower land-surface elevations than the topographic high running southwest to northeast through NAWC Warminster parallel to the outcrop area of unit M–7 (fig. 37). Units M–10 and M–11 outcrop offsite and at lower land-surface elevations to the south-southeast of NAWC Warminster, where hydraulic heads may also be lowered by hydraulic connections with nearby streams that act as drains or groundwater-discharge locations. Data from previous studies also indicate the presence of relatively lower hydraulic heads in or near units M-10 and M-11. Sloto and Grazul (1998) reported downward vertical gradients in two 600-ft deep former production wells, BK–376 (SW–4) and BK–375 (SW–3), with the lowest heads in parts of the borehole interpreted to be near or within unit M–10 (section B–B′, plate 2; section C–C′, plate 3). The divide between low heads in units M–10 and M–11 and the relatively higher heads in overlying units appears to occur near units M–7 to M–9 in the stratigraphic sequence. Where unit M–10 is present in deeper borehole BK–3068 (HN–117) along the northern perimeter of the former NAWC Warminster (plates 1, 2, and 5), onsite and (or) offsite pumping wells in the vicinity may cause lower heads in the shallower units and mask this divide. An exception to low heads associated near unit M-10 was indicated by heads measured in isolated intervals in the 400-ft deep borehole BK–962 (NAWC 10) (section C–C′, plate 3), which had small head differences (less than 2 ft) in isolated intervals and upward flow at the time of logging in contrast to downward flow directions and low heads at depth measured in nearby 600-ft deep former production wells, BK–376 (SW–4) and BK–375 (SW–3) (Sloto and Grazul, 1998); possible factors controlling head distribution in BK–962 (NAWC 10) other than lithology and topographic setting, are not known.
Large vertical gradients between hydrogeologic units generally indicate a limited vertical permeability through or across those units and (or) intervening units. The vertical head divide above lithologic units M–10 and M–11 limits the potential for vertical groundwater flow and associated contaminant transport across overlying units M–7 to M–9. However, open boreholes with downward hydraulic head gradients can act as conduits for groundwater flow and associated contaminant transport, as water flows downhole from producing fractures with higher heads to receiving fractures with lower heads; thus, some contaminants may be present at depth in the open borehole because downward flow between stratigraphically separated water-bearing intervals is connected (short-circuited) by the open borehole rather than through migration in the aquifer along natural flow paths. In the absence of an open borehole, potential contaminants in deeper units below the vertical divide would likely come from possible sources farther updip and (or) upgradient within the hydrogeologic unit.
Downward groundwater flow and associated PFAS transport may have occurred during the 1940s–1990s when deep production wells were open and in use on the former NAWC Warminster. For example, the two approximately 600-ft deep production wells in boreholes BK–375 (SW–3) and BK–376 (SW–4) in Area D of the former NAWC Warminster had downward flow to fractures at depths of at least 500 ft bls (Sloto and Grazul, 1998); fractures at these depths in these two wells intercept mudstone and siltstone unit M–10, a lithologic unit with low hydraulic heads in boreholes BK–3068 (HN–117) and BK–3066 (HN–118) along the northern perimeter of the former NAWC Warminster (section B–B′, plate 2).
The general overview of head distributions and relations to lithologic units is limited by the sparsity of data (few deep boreholes and long distances between boreholes) on the former NAWC Warminster. To confirm the preliminary evaluation, further characterization would be needed.
Summary
The U.S. Geological Survey (USGS) collected data on the vertical distribution of hydraulic head, specific capacity, and water quality using aquifer-interval-isolation (packer) tests and other vertical profiling methods in 15 boreholes completed in fractured sedimentary bedrock in Northampton, Warminster, and Warwick Townships, Bucks County, Pennsylvania during 2018–19. The work was done to support detailed groundwater investigations at and near the former Naval Air Warfare Center (NAWC) Warminster, where groundwater contamination with per- and polyfluoroalkyl substances (PFAS) had become a concern since 2014. Two PFAS compounds, perfluorooctanesulfonic acid (PFOS) and perfluorooctanoic acid (PFOA), are present in groundwater in the area at and near the former NAWC Warminster in concentrations above 2016 U.S. Environmental Protection Agency health advisory levels of 70 nanograms per liter (ng/L) for summed PFOA and PFOS concentrations. The area is underlain by the Triassic Stockton Formation, which forms a sedimentary fractured-rock aquifer used for private, industrial, and public drinking water supply.
Geophysical and video logs collected by USGS during 2017–19 were used to identify potential water-bearing fractures for the assessment of the vertical distribution of aquifer properties and water quality in 15 boreholes; this assessment was done through hydraulic tests and sampling of discrete water-bearing features using a straddle-packer system in 13 boreholes and depth-discrete point sampling under known borehole-flow conditions in 2 boreholes. The 15 boreholes ranged in depth from about 210 to 604 feet (ft) below land surface (bls) and included six-inch diameter boreholes drilled to initial depths of about 600 ft bls in 2018 for use as monitoring wells on the former NAWC Warminster property and nine 8- to 12-inch diameter existing former production or unused test wells. Casing lengths ranged from about 19 to 93 ft bls. Depth to the ambient water level in open boreholes at the time of logging ranged from about 1.8 ft above land surface in a flowing-artesian well to about 55 ft bls.
Most wells had many water-bearing fractures or openings throughout the depth of the open boreholes, and generally, these openings appeared to be either parallel to bedding or high-angle fractures approximately orthogonal to bedding. Measured borehole flow was predominantly downward in most of the deepest boreholes (greater than 400 ft), which were commonly located at the highest land-surface elevations at and near the former NAWC Warminster, with inflow from fractures at relatively shallow depths and outflow through fractures near or below depths of 500 ft bls and hydraulic head differences up to about 60 ft between shallow and deep intervals measured during the packer tests. Borehole flow was predominantly upward in most boreholes less than 400 ft in depth and farther from the former NAWC Warminster. Total borehole specific capacity ranged from about 0.07 to 41 gallons per minute per foot ([gal/min)/ft]). Specific-capacity values for tested individual isolated intervals at depths from less than 30 ft bls to greater than 580 ft bls ranged from 0.02 to 40.0 (gal/min)/ft, with a median of 1.14 (gal/min)/ft, with a large range in values at most depths. Relatively high specific-capacity values (greater than 1 [gal/min]/ft) were measured both in shallow (less than 200 ft bls) and deep (400–600 ft bls) sections of the aquifer.
The packer tests and depth-discrete point sampling for 15 boreholes showed differences in water quality of samples among isolated intervals in the boreholes, as indicated by field properties (pH, dissolved oxygen, and specific conductance) and concentrations of dissolved major ions, PFOA, and PFOS, with summed PFOA and PFOS concentrations ranging from about 11 to 10,780 ng/L and greater than 70 ng/L in 62 of 104 intervals and discrete-depths tested. The mass ratio of PFOS to PFOA was generally higher than 1.0 in samples with summed PFOA and PFOS concentrations greater than 70 ng/L, with values as high as 8.7. In many boreholes, summed concentrations of PFOA and PFAS were related to chloride concentrations, which were elevated above natural background values (less than 10 milligrams per liter [mg/L]) in most samples and as high as 717 mg/L. Sources of the elevated chloride include components other than common rock salt (sodium chloride), as indicated by chloride to sodium molar ratios greater than 1.0. In several boreholes, samples from the shallowest intervals had the highest chloride concentrations, suggesting a local nearby source of chloride. In boreholes with strong downward flow, water quality in deeper intervals with relatively low hydraulic heads may be a mixture of water from shallower intervals with relatively high hydraulic heads through transport between water-bearing fractures at various depths in the open borehole, and this should be interpreted with caution; results could be verified with repeat sampling of discrete monitoring intervals in wells that were reconstructed by the Navy in 2019 after packer testing. The highest summed PFOS and PFOA concentration (10,780 ng/L) was measured in a deep isolated interval with relatively low hydraulic head and water quality (isotopic and major ion composition) indicating mixing of water from shallower intervals. The potential for downward migration of PFAS in groundwater from shallower intervals with higher hydraulic heads is present in the aquifer system, but migration would be much slower through the undisturbed aquifer than through open boreholes. Downward groundwater flow and possible associated PFAS transport may have occurred during the 1940s–1990s, periods when deep production wells were open and in use on the former NAWC Warminster, short-circuiting natural flow paths by opening hydraulic connections (pathways) through low-permeability (confining) layers.
Through a correlation of natural gamma and resistivity logs, 11 lithologic units were identified in boreholes drilled at and near the former NAWC Warminster and interpreted to strike northeast and dip to the northwest. Hydraulic heads were highest in isolated intervals that intercepted beds projected to crop out at the highest land-surface elevation on the former NAWC Warminster, indicating topographic controls on the groundwater system. The hydrogeologic framework in conjunction with the vertical distribution of hydraulic heads and water quality may assist in evaluating sources of PFAS and potential migration pathways of PFAS in groundwater flow.
References Cited
Battelle, 2016, Fourth five-year review report for former Naval Air Warfare Center Warminster, Warminster, Pennsylvania: Report N62269.PF.001040 NAWC WARMINSTER 5090.3b prepared for the U.S. Navy Naval Facilities Engineering Command under contract no. N62583–11–D–0515 task order no. 0063, November 2016, variously paginated, accessed November 15, 2023, at https://administrative-records.navfac.navy.mil/Public_Documents/MID_ATLANTIC/WARMINSTER_NAWC/N62269_001040_REDACTED.pdf.
Battelle, 2019, Preliminary remedial investigation data 22 April 2019, accessed January 19, 2023, at https://media.defense.gov/2022/Mar/24/2002962656/-1/-1/0/NAWC_20190422_PRELIM_RI_DATA_UPDATE.PDF.
Battelle, 2021, Preliminary remedial investigation data 26 May 2021, accessed January 19, 2023, at https://media.defense.gov/2022/Mar/24/2002962660/-1/-1/0/NAWC_20210607_PRELIM_RI_DATA_UPDATE.PDF.
Berg, T.M., Edmunds, W.E., Geyer, A.R., comps., 1980, Geologic map of Pennsylvania (2d ed.): Pennsylvania Geological Survey, 4th ser., Map 1, 3 sheets, scale 1:250,000. [Also available at https://maps.dcnr.pa.gov/publications/Default.aspx?id=712].
Bierly, A.D., and Oest, C.W., 2023, Bedrock geologic map of the Mesozoic basin in the Ambler, Hatboro, and Langhorne 7.5-minute quadrangles, Bucks County, Pennsylvania: Pennsylvania Geological Survey, 1 plate, scale 1:24,000, accessed April 19, 2023, at https://ngmdb.usgs.gov/Prodesc/proddesc_114684.htm.
Bird, P.H., 1998, Geohydrology and ground-water quality of Warwick Township, Bucks County, Pennsylvania: U.S. Geological Survey Water-Resources Investigations Report 97–4267, 37 p., accessed April 19, 2019, at https://doi.org/10.3133/wri974267.
Bridge, J.S., and Tye, R.S., 2000, Interpreting the dimensions of ancient fluvial channel bars, channels, and channel belts from wireline- logs and cores: American Association of Petroleum Geologists Bulletin, v. 84, no. 8, p. 1205–1228. [Also available at https://doi.org/10.1306/A9673C84-1738-11D7-8645000102C1865D].
Conger, R.W., 1998, Identification of water-bearing zones by the use of geophysical logs and borehole television surveys, collected February to September 1997, at the Former Naval Air Warfare Center, Warminster, Bucks County, Pennsylvania: U.S. Geological Survey Open-File Report 98–86, 26 p., accessed January 6, 2023, at https://doi.org/10.3133/ofr9886.
Conger, R.W., and Bird, P.H., 1999, Identification of water-bearing fractures by the use of geophysical logs, May to July 1998, former Naval Air Warfare Center, Bucks County, Pennsylvania: U.S. Geological Survey Open-File Report 99–215, 27 p., accessed June 15, 2021 at https://doi.org/10.3133/ofr99215.
Darling, W.G., Bath, A.H., and Talbot, J.C., 2003, The O and H stable isotopic composition of freshwaters in the British Isles—2. Surface waters and groundwater: Hydrology and Earth System Sciences, v. 7, no. 2, p. 183–195, accessed January 6, 2023, at https://doi.org/10.5194/hess-7-183-2003.
El Tabakh, M., and Schreiber, B.C., 1998, Diagenesis of the Newark Rift Basin, Eastern North America: Sedimentology, v. 45, no. 5, p. 855–874, accessed May 31, 2022, at https://doi.org/10.1046/j.1365-3091.1998.00183.x.
Feng, X., A. M.Faiia, and E. S.Posmentier, 2009, Seasonality of isotopes in precipitation—A global perspective: Journal of Geophysical Res, v. 114, D8, p. 1–13, accessed June 22, 2022, at https://doi.org/10.1029/2008JD011279.
Goode, D.J., and Senior, L.A., 2020, Groundwater withdrawals and regional flow paths at and near Willow Grove and Warminster, Pennsylvania—Data compilation and preliminary simulations for conditions in 1999, 2010, 2013, 2016, and 2017: U.S. Geological Survey Open-File Report 2019–1137, 127 p., accessed March 10, 2020, at https://doi.org/10.3133/ofr20191137.
Greenman, D.W., 1955, Ground water resources of Bucks County, Pennsylvania: Pennsylvania Geological Survey, 4th ser., Water Resource Report 11, 66 p., 1 plate, scale 1:62,500. [Also available at https://ngmdb.usgs.gov/Prodesc/proddesc_32971.htm.]
Herman, G.C., 2010, Hydrogeology and borehole geophysics of fractured-bedrock aquifers, Newark Basin, New Jersey, chap. F of Herman, G.C., and Serfes, M.E., eds., Contributions to the geology and hydrogeology of the Newark Basin: Trenton, N.J., State of New Jersey, Department of Environmental Protection, p. F1–F45.
Izbicki, J.A., 2004, A small-diameter sample pump for collection of depth-dependent samples from production wells under pumping conditions: U.S. Geological Survey Fact Sheet 2004–3096, 2 p., accessed March 7, 2022, at https://doi.org/10.3133/fs20043096.
Izbicki, J.A., Christensen, A.H., Hanson, R.T., Martin, P., Crawford, S.M., and Smith, G.A., 1999, U.S. Geological Survey combined well-bore flow and depth-dependent water sampler; U.S. Geological Survey Fact Sheet 196–99, accessed March 7, 2022, at https://doi.org/10.3133/fs19699.
Kendall, C., and Coplen, T.B., 2001, Distribution of oxygen-18 and deuterium in river waters across the United States: Hydrological Processes, v. 15, no. 7, p. 1363–1393, accessed June 22, 2022, at https://doi.org/10.1002/hyp.217.
Leidos, 2018, Groundwater monitoring report for the perfluorinated compound investigation at the Horsham Air Guard Station (111th Attack Wing), Horsham, Pennsylvania: Report prepared for NGB/A4OR Joint Base Andrews, Maryland under contract no. W9133L-14-D-0007, delivery order no. 0005, variously paginated, accessed November 16, 2023, at https://ar.afcec-cloud.af.mil/Search.
Leidos, 2022, Technical Memorandum for PFAS Remedial Investigation Phase I Activities at Biddle Air National Guard Base, Horsham, Pennsylvania: Report prepared for National Guard Bureau Restoration Branch (A4VR) 3501 Fetchet Avenue Joint Base Andrews, Maryland under Contract Number GS00Q14OADU122 Delivery Order Number W9133L-19-F-2521, variously paginated, accessed January 23, 2024, at https://ar.afcec-cloud.af.mil/Search.
Longwill, S.M., and Wood, C.R., 1965, Ground-water resources of the Brunswick Formation in Montgomery and Berks Counties, Pennsylvania: Pennsylvania Geological Survey, 4th ser., Water Resource Report 22, 59 p., 1 plate. [Also available at https://maps.dcnr.pa.gov/publications/Default.aspx?id=160.]
Low, D.J., Hippe, D.J., and Yannacci, D., 2002, Geohydrology of southeastern Pennsylvania: U.S. Geological Survey Water-Resources Investigation Report 2000–4166, 347 p. [Also available at https://doi.org/10.3133/wri004166.]
Lyttle, P.T., and Epstein, J.B., 1987, Geologic map of the Newark 1 degree x 2 degrees quadrangle, New Jersey, Pennsylvania, and New York: U.S. Geological Survey Miscellaneous Investigations Map I–1715, scale 1:250,000, accessed March 10, 2020, at https://doi.org/10.3133/i1715.
National Atmospheric Deposition Program, 2023, Data for National Trends Network Site ntn-NJ99, accessed December 9, 2023, at https://nadp.slh.wisc.edu/sites/ntn-NJ99/.
Newport, T.G., 1971, Ground-water resources of Montgomery County, Pennsylvania: Pennsylvania Geological Survey, 4th ser., Water Resource Report 29, 83 p., 2 plates. [Also available at https://maps.dcnr.pa.gov/publications/Default.aspx?id=167.]
Pennsylvania Department of Environmental Protection, 2021, DEP proposal to set stricter PFAS limits approved by Environmental Quality Board: Pennsylvania Department of Environmental Protection news release, November 16, 2021, accessed June 30, 2022, at https://www.ahs.dep.pa.gov/NewsRoomPublic/articleviewer.aspx?id=22025&typeid=1.
Pennsylvania Department of Environmental Protection, 2023, Safe drinking water PFAS MCL Rule: Pennsylvania Bulletin v. 53, no. 2, p. 333–361, accessed March 27, 2023, at https://www.pacodeandbulletin.gov/secure/pabulletin/data/vol53/53-2/53-2.pdf.
Piper, A.M., 1944, A graphic procedure in the geochemical interpretation of water-analyses: Eos, Transactions American Geophysical Union, v. 25, no. 6, p. 914–928. [Also available at https://hatarilabs.com/ih-en/what-is-a-piper-diagram-and-how-to-create-one.]
Resolution Consultants, 2019, Remedial investigation report Per and Polyfluoroalkyl substances investigations activities Willow Grove, PA Report, volume I Text, Tables, Figures, Appendices A–G: Report N00158_001068 NASJRB WILLOW GROVE, PA SSIC 5000-33: Report prepared for the U.S. Navy Naval Facilities Engineering Command under contract no. N62470–11–D–8013, September 2019, variously paginated, accessed November 16, 2023, at https://administrative-records.navfac.navy.mil/Public_Documents/MID_ATLANTIC/WILLOW_GROVE_NAS/N00158_001068_REDACTED.pdf.
Rima, D.R., Meisler, H., and Longwill, S., 1962, Geology and hydrology of the Stockton Formation in southeastern Pennsylvania: Pennsylvania Geological Survey, 4th ser., Water Resource Report 14, 110 p., 4 plates. [Also available at https://maps.dcnr.pa.gov/publications/Default.aspx?id=130.]
Risser, D.W., and Bird, P.H., 2003, Aquifer tests and simulation of ground-water flow in Triassic sedimentary rocks near Colmar, Bucks and Montgomery Counties, Pennsylvania: U.S. Geological Survey Water-Resources Investigations Report 2003–4159, 73 p., accessed November 16, 2023, at https://doi.org/10.3133/wri034159.
Rowland, C.J., 1997, Altitude and configuration of the potentiometric surface in Warwick Township, Bucks County, Pennsylvania, September 1994 through May 1995: U.S. Geological Survey Open-File Report 97–554, 1 plate, accessed November 16, 2023, at https://doi.org/10.3133/ofr97554.
Sevon, W.D., comp., 2000, Physiographic provinces of Pennsylvania (4th ed.): Pennsylvania Geological Survey, 4th ser., Map 13, scale 1:2,000,000, accessed January 31, 2023, at https://elibrary.dcnr.pa.gov/GetDocument?docId=1752507&DocName=Map13_PhysProvs_Pa.pdf.
Schlische, R., 1992, Structural and stratigraphic development of the Newark extensional basin, eastern North America—Evidence for the growth of the basin and its bounding structures: Geological Society of America Bulletin, v. 104, no. 10, p. 1246–1263, accessed November 16, 2023 at https://doi.org/10.1130/0016-7606(1992)104<1246:SASDOT>2.3.CO;2.
Senior, L.A., 1996, Ground-water quality and its relation to hydrogeology, land use, and surface-water quality in the Red Clay Creek Basin, Piedmont Physiographic Province, Pennsylvania and Delaware: U.S. Geological Survey Water Resources Investigations Report 96–4288, 122 p., accessed November 16, 2023, at https://doi.org/10.3133/wri964288.
Senior, L.A., and Goode, D.J., 1999, Ground-water system, estimation of aquifer hydraulic properties, and effects of pumping on ground-water flow in Triassic sedimentary rocks in and near Lansdale, Pennsylvania: U.S. Geological Survey Water-Resources Investigations Report 99–4228, 111 p. [Also available at https://doi.org/10.3133/wri994228.]
Senior, L.A., Zarr, L.F., Olson, L., and Rosman, R., 2020, Water-level data and selected field notes for aquifer-interval-isolation tests at and near the former Naval Air Warfare Center Warminster, Bucks County, Pennsylvania, 2018–19 (ver. 2.0, January 2024): U.S. Geological Survey data release, https://doi.org/10.5066/P9TC92B5.
Senior, L.A., Anderson, J.A., and Bird, P.H., 2021, Geophysical and video logs of selected wells at and near the former Naval Air Warfare Center Warminster, Bucks County, Pennsylvania, 2017–19: U.S. Geological Survey Open-File Report 2021–1025, 92 p., accessed February 25, 2022, at https://doi.org/10.3133/ofr20211025.
Sloto, R.A., 1997, Results of borehole geophysical logging and aquifer-isolation tests conducted in the John Wagner and Sons, Inc former production well, Ivyland, Pennsylvania: U.S. Geological Survey Water-Resources Investigations Report 1997–4095, 18 p., accessed January 6, 2023, at https://doi.org/10.3133/wri974095.
Sloto, R.A., 2008, Interpretation of borehole geophysical logs at Area C, former Naval Air Warfare Center, Warminster Township, Bucks County, Pennsylvania, 2007: U.S. Geological Survey Open-File Report 2008–1207, 20 p., accessed June 2, 2020, at https://doi.org/10.3133/ofr20081207.
Sloto, R.A., 2010, Changes in groundwater flow and volatile organic compound concentrations at the Fischer and Porter Superfund Site, Warminster Township, Bucks County, Pennsylvania, 1993–2009: U.S. Geological Survey Scientific Investigations Report 2010–5054, 115 p., accessed June 2, 2020, at https://doi.org/10.3133/sir20105054.
Sloto, R.A., Conger, R.W., and Grazul, K.E., 1998, Geohydrology and distribution of volatile organic compounds in ground water in the Casey Village area, Bucks County, Pennsylvania: U.S. Geological Survey Water-Resources Investigations Report 98–4010, 81 p., accessed January 6, 2023, at https://doi.org/10.3133/wri984010.
Sloto, R.A., and Davis, D.K., 1983, Effect of urbanization on the water resources of Warminster Township, Bucks County, Pennsylvania: U.S. Geological Survey Water-Resources Investigations Report 82–4010, 78 p., accessed March 28, 2019, at https://doi.org/10.3133/wri824020.
Sloto, R.A., and Grazul, K.E., 1995, Altitude and configuration of the potentiometric surface, Casey Village, Warminster and Upper Southampton townships, Bucks County, Pennsylvania, August 3, 1995: U.S. Geological Survey Open-File Report 95–717, 2 maps on one sheet, accessed January 6, 2023, at https://doi.org/10.3133/ofr95717.
Sloto, R.A., and Grazul, K.E., 1998, Results of borehole geophysical logging and hydraulic tests conducted in Area D supply wells, former U.S. Naval Air Warfare Center, Warminster, Pennsylvania: U.S. Geological Survey Water-Resources Investigations Report 98–4129, 47 p., accessed June 24, 2022, at https://doi.org/10.3133/wri984129.
Sloto, R.A., Macchiaroli, P., and Conger, R.W., 1995, Geohydrology and vertical distribution of volatile organic compounds in ground water, Fischer and Porter Company Superfund Site, Warminster, Bucks County, Pennsylvania: U.S. Geological Survey Water-Resources Investigations Report 95–4220, 137 p., 3 plates, accessed December 9, 2020, at https://doi.org/10.3133/wri954220.
Sloto, R.A., Macchiaroli, P., and Towle, M.T., 1996, Geohydrology of the Stockton Formation and cross-contamination through open boreholes, Hatboro Borough and Warminster Township, Pennsylvania: U.S. Geological Survey Water-Resources Investigations Report 86–4047, 49 p., 2 plates, accessed March 28, 2019, at https://doi.org/10.3133/wri964047.
Tetra Tech, 2014, Evaluation of potential source of perfluorinated compounds, former Naval Air Warfare Center Warminster, Warminster, Pennsylvania: Report prepared for Naval Facilities Engineering Command Mid-Atlantic, Norfolk, Virginia, contract number N62470–08–D–1001, contract task orderWE23, report N62269.AR.001000 NAWC WARMINSTER 5090.3a, November 2014, accessed November 16, 2023, at https://administrative-records.navfac.navy.mil/Public_Documents/MID_ATLANTIC/WARMINSTER_NAWC/N62269_001000_REDACTED.pdf.
Tetra Tech, 2021, Final fifth five year review report NAWC Warminster, Pennsylvania: Report N62269_002350 prepared for Naval Facilities Engineering Systems Command Mid-Atlantic under contract no. N6247016D9008 task order no. N4008518F5769, November 2021, variously paginated, accessed November 26 26, 2023, at https://administrative-records.navfac.navy.mil/Public_Documents/MID_ATLANTIC/WARMINSTER_NAWC/N62269_002350_REDACTED.pdf.
Tetra Tech, 2022, Final 2017 to 2020 summary report for private well sampling former Naval Air Warfare Center (NAWC) Warminster Warminster, Pennsylvania, March 2022, v. 1 of 10, Letter and Tables: U.S. Navy Report N62269–002495 NAWC Warminster, PA SSIC 5000-33a, accessed March 27, 2023, at https://administrative-records.navfac.navy.mil/Public_Documents/MID_ATLANTIC/WARMINSTER_NAWC/N62269_002495.pdf.
Thomas, E.M., Lin, H., Duffy, C.J., Sullivan, P.L., Holmes, G.H., Brantley, S.L., and Jin, L., 2013, Spatiotemporal patterns of water stable isotope compositions at the Shale Hills Critical Zone Observatory—Linkages to subsurface hydrologic processes: Vadose Zone Journal, v. 12, no. 4, p. 1–16, accessed July 8, 2022, at https://doi.org/10.2136/vzj2013.01.0029.
Turner-Peterson, C.E., and Smoot, J.P., 1985, New thoughts on facies relationships in the Triassic Stockton and Lockatong Formations, Pennsylvania and New Jersey, in Gilpin, G.R., Jr., and Froehlich, A.J., eds., Proceedings of the second U.S. Geological Survey workshop on the early Mesozoic basins of the Eastern United States: U.S. Geological Survey Circular 946, p. 10–17, accessed January 6, 2023, at https://doi.org/10.3133/cir946.
U.S. Department of Defense and U.S. Department of Energy, 2017, DoD/DOE quality systems manual (QSM) for environmental laboratories [DoD quality systems manual ver. 5.1; DOE quality systems for analytical services ver. 3.1]: U.S. Department of Defense and U.S. Department of Energy, accessed March 22, 2022, at https://denix.osd.mil/edqw/documents/documents/qsm-version-5-1-final/.
U.S. Department of Defense and U.S. Department of Energy, 2018, DoD/DOE quality systems manual (QSM) for environmental laboratories [DoD quality systems manual ver. 5.1.1]: U.S. Department of Defense and U.S. Department of Energy, accessed March 22, 2022, at https://denix.osd.mil/edqw/documents/documents/qsm-version-5-1-1-final/.
U.S. Environmental Protection Agency, 2012, Third unregulated contaminant rule: U.S. Environmental Protection Agency web page, accessed January 31, 2019, at https://www.epa.gov/dwucmr/third-unregulated-contaminant-monitoring-rule.
U.S. Environmental Protection Agency, 2014, Peer review of health effects documents for PFOA and PFOS, EPA–820–F–14–004: Washington, D.C., U.S. Environmental Protection Agency, Office of Water, 2 p., accessed January 10, 2023, at https://nepis.epa.gov/Exe/ZyPDF.cgi/P100MYTX.PDF?Dockey=P100MYTX.PDF.
U.S. Environmental Protection Agency, 2016, Fact sheet—PFOA & PFOS drinking water health advisories, EPA 800–F–16–003: Washington, D.C., U.S. Environmental Protection Agency, 5 p., accessed March 28, 2018, at https://www.epa.gov/sites/production/files/2016-06/documents/drinkingwaterhealthadvisories_pfoa_pfos_updated_5.31.16.pdf.
U.S. Environmental Protection Agency, 2018, 2018 edition of the drinking water standards and health advisories, EPA 822–F–18–001: Washington, D.C., U.S. Environmental Protection Agency, Office of Water, 12 p., accessed May 5, 2023, at https://www.epa.gov/system/files/documents/2022-01/dwtable2018.pdf.
U.S. Environmental Protection Agency, 2022, Technical fact sheet—Drinking water health advisories for four PFAS (PFOA, PFOS, GenX chemicals, and PFBS), EPA 822–F–22–002: U.S. Environmental Protection Agency, Office of Water, 7 p., accessed June 30, 2022, at https://www.epa.gov/system/files/documents/2022-06/technical-factsheet-four-PFAS.pdf.
U.S. Environmental Protection Agency, 2023, Per- and polyfluoroalkyl substances (PFAS): U.S. Environmental Protection Agency web page, accessed March 27, 2023, at https://www.epa.gov/sdwa/and-polyfluoroalkyl-substances-pfas.
U.S. Geological Survey, 2008, Chapter A6—Field measurements: U.S. Geological Survey Techniques of Water-Resources Investigations, book 9, chap. A6, 9 p., accessed November 16, 2023, at https://doi.org/10.3133/twri09A6.
U.S. Geological Survey, 2018, General introduction for the “National field manual for the collection of water-quality data” (ver. 1.1, June 2018): U.S. Geological Survey Techniques and Methods, book 9, chap. A0, 4 p., accessed November 16, 2023, at https://doi.org/10.3133/tm9A0.
U.S. Geological Survey, 2020, GeoLog locator: U.S. Geological Survey database, accessed March 13, 2020, at https://webapps.usgs.gov/GeoLogLocator/#!/search.
U.S. Geological Survey, 2023, USGS water data for the Nation: U.S. Geological Survey National Water Information System database, accessed November 16, 2023, at http://dx.doi.org/10.5066/F7P55KJN.
U.S. Navy, 2022a, Naval Air Warfare Center (NAWC) Warminster Technical Review Committee (TRC), August 19, 2021: Former Naval Air Warfare Center Warminster presentation, accessed March 27, 2023, at https://media.defense.gov/2022/Mar/24/2002962712/-1/-1/0/NAWC_20210819_TRC_PRESENTATION.PDF.
U.S. Navy, 2022b, Willow Grove Restoration Advisory Board (RAB), December 8, 2021: NASJRB Willow Grove presentation, accessed March 27, 2023, at https://media.defense.gov/2022/Mar/23/2002962012/-1/-1/0/WG_20211208_PRESENTATION_RAB.PDF.
Appendix 1. Water-Level Data for Aquifer-Interval-Isolation (Packer) Tests
Introduction
Water levels measured above, within, and below the tested interval isolated by packers provide information about the extent of packer seals, differences in hydraulic head among intervals separated by packers, and responses to pumping in intervals separated by packers. A schematic of packer configuration is shown in figure 1.1. Plots of water levels measured above, within, and below the tested interval isolated by packers for each of the 13 boreholes tested are available with the water-level data and notes about times of packer inflation, start of pumping, pumping rates, sample collection, and packer deflation for these tests in the U.S. Geological Survey (USGS) data release (Senior and others, 2020).

A, Schematic of straddle-packer configuration used for tests of isolated water-bearing intervals performed by the U.S. Geological Survey in wells at and near the former Naval Air Warfare Center Warminster, 2018–19 and B, examples of test configurations when water is pumped from above the upper packer, between the two packers, or below the upper packer (single packer inflation only) to the bottom of the borehole.
Packer tests are described using test names that refer to a zone number and “depths of field packer spacing” (measured to tops of upper and lower packer bladder, respectively, for tests when both packers are inflated), and these depths do not account for length of boreholes sealed after inflating packer bladders as described in the “Methods” section of this report. Estimated actual depths of the tested interval that account for bladder inflation are in provided tabulated packer-test results in the “Hydraulic and Chemical Results for Isolated Intervals in Individual Boreholes” section of this report.
Two examples of water-level response to straddle-packer inflation, pumping from the isolated interval between packers, and packer deflation are shown in figure 1.2. In the test of BK–2869 zone 5 (fig. 1.2A), water levels separated by up to 10 feet (ft) after packer inflation such that the depth to water was least in the part of the borehole above the upper packer (highest hydraulic head) and greatest in the part of the borehole below the lower packer (lowest hydraulic head), indicating downward vertical head gradients among these intervals in the borehole; water levels above and below the interval isolated by straddle packers did not change in response to pumping from the isolated interval, indicating that packers formed a good hydraulic seal in the borehole and that the vertical permeability of the aquifer adjacent to the packers is limited. In the test of BK–962 zone 5 (fig. 1.2B), water levels separated by up to about 0.5 ft after packer inflation such that depth to water was least in the part of the borehole isolated by straddle packers (highest hydraulic head) and greatest in the part of the borehole below the lower packer (lowest hydraulic head), indicating small vertical head gradients from the isolated interval between packers toward adjacent intervals above and below; water levels above the isolated interval declined slightly in response to pumping from the isolated interval and increased slightly after pumping stopped, indicating at least some hydraulic connection between these parts of the borehole (possibly through fractures outside the borehole), but water levels below the isolated interval did not change in response to pumping the isolated interval, indicating another good hydraulic seal of the lower packer within the borehole.

Water levels before and during packer inflation, during pumping and recovery, and after packer deflation, in feet below land surface (ft bls), for A, BK–2869 zone 5 (“160.5–182.7 ft bls”) aquifer-isolation- interval (packer) test August 2, 2019, and B, BK–962 zone 5 (“153–180.3 ft bls”) isolation interval (packer) test May 7, 2018, at and near the former Naval Air Warfare Center Warminster, Bucks County, Pennsylvania.
Good hydraulic seals were indicated by measured water levels in most aquifer-interval- isolation tests, such as the example test shown in figure 1.2A. Boreholes with hydraulic connections between zones isolated by packers and adjacent parts of the borehole as indicated by relatively large drawdown in adjacent parts of the borehole during pumping of an isolated interval include BK–962 (zones 3, 4, and 5) (for zone 5, see figure 1.2B); BK–2871 (zones 1, 2, and 3), BK–2869 (zone 4), BK–3062 (zones 1 and 2), BK–3068 (zone 2), and BK–3070 (zone 1).
Tests of Individual Boreholes
Water levels measured above, within, and below the tested interval isolated by packers for the open borehole, after packer inflation and water-level stabilization just before start of pumping, while pumping and just before sample collection are reported in tables 1.1–1.13 for the 2018–19 tests of 13 boreholes (table 4). Water levels are reported in feet below land surface (ft bls) and are available in Senior and others (2020). Tables 1.1–1.13 also list interval specific capacity (calculated from drawdown determined from the water level just before pumping to the water level before sample collection), estimated average pumping rate, pumping duration, volume of water pumped before sample collection (calculated using estimated average pumping rate and pumping duration), and target three-interval volume (calculated using distance from top of bladder in upper packer to top of packer in lower packer). This target three-interval volume, as calculated, excludes portions of borehole sealed by upper packer bladder estimated to be 3–4 ft for the 6-inch (in.) and 8-in. diameter boreholes, respectively. Tables 1.1–1.13 also includes the volume of water in the 2-in. pipe string between the pump and top of upper packer plus drawdown in the 2-in. pipe string; the water in the 2-in. pipe was assumed to be removed through simple plug flow during pumping, so that this volume was only counted once (and not multiplied by three) in estimating the target three-interval volume. For shallowest intervals tested when the pump is placed in annulus above the upper packer, the target volume was estimated by summing amounts of a three-volume purge using stabilized water levels (drawdown) during pumping and a single volume indicated by initial drawdown after pumping was started.
Water levels measured as depth to water below land surface above, within, and below the tested interval isolated by packers for the open borehole are depicted as continuous lines on plots for tests of the 13 individual boreholes in the data release (Senior and others, 2020). In these plots, water levels above the upper packer are depicted using red line and labeled “upper,” water levels within (or between) the interval isolated by straddle packers are depicted using a blue line and labeled “mid,” and water levels below the lower packer are depicted using a green line and labeled “lower” (fig. 1.2). For most tests, except the shallowest and deepest intervals, pumping was done in the mid interval isolated by straddle packers. For tests of the shallowest interval tested (zone 1), pumping was commonly done above the upper packer. For tests of the deepest interval tested, pumping was commonly done below a single inflated packer. In tests of the deepest zones in 6-in. diameter boreholes, measured water levels recorded by the transducer below the lower packer appear to be affected by water levels above the upper packer, likely due to some equipment leakage under high hydrostatic pressure; therefore, water levels below the lower packer in these tests of deep intervals (greater than about 300 ft bls) may represent composite heads of levels above and below the isolated interval and should be interpreted with caution, as is noted in the data release (Senior and others, 2020, especially for boreholes BK–3063 (HN–116), BK–3066 (HN–118), BK–3067 (HN–119), BK–3070 (HN–120D), and BK–3071 (HN–121).
BK–962 (NAWC 10)
Ten intervals were isolated for testing in the 400-ft deep and 8-in. diameter borehole BK–962 (NAWC 10) (table 1.1) that had 50 ft of casing. Packers with 5.9-ft long bladders were used for tests of BK–962. Tests of zones 1 and 2 used the same packer setup, with top of upper packer set at 65 ft bls. The shallowest interval tested (zone 1, “above 65 ft bls”) spanned depths from above the top of the upper packer at 65 ft bls to static water level at 12.6 ft bls. The test of the next deepest interval (zone 2, “65–92.3 ft bls”) was started using the same packer set up as test for zone 1 (“above 65 ft bls”), while water levels were still recovering above the upper packer from test of zone 1 (see plots for well BK–962 in Senior and others, 2020). The water levels for these packer tests indicate that zones 1 and 2 have little to no hydraulic connection. Relatively little to no hydraulic connection to adjacent intervals, as indicated by small drawdown in intervals adjacent to the pumped isolated interval, was also observed for tests of zones 7, 8, 9, and 10, but some hydraulic connection to adjacent intervals was indicated by drawdowns in adjacent intervals for tests of zones 3, 4, 5, and 6 (table 1.1; see also water-levels plots for BK–962 in Senior and others, 2020). The deepest interval tested (zone 10, “below 341.5 ft bls”) spanned depths from the upper packer to the bottom of the borehole at about 385 ft bls, as only the upper packer was inflated. A complete test was not done, and samples were not collected for zone 8 (“251.5–278.8 ft bls”) because fractures in the isolated interval were not sufficiently productive to support pumping at a rate of less than 1 gal/min (drawdown was large at very low pumping rates).
Table 1.1.
Water levels, drawdown, pumping rates, computed specific capacity, pumping duration before sampling, estimated pumped volume before sampling, and target three-interval volume in aquifer-interval-isolation (packer) tests of well BK–962 (NAWC 10), zones 1–10, at former Naval Air Warfare Center Warminster, Bucks County, Pennsylvania, May 3–9, 2018.[Interval top is top of upper packer bladder, except for zone 1 where top is bottom of casing above upper packer. Interval bottom is top of lower packer bladder, except for zone 10 where it is bottom of hole and only upper packer is inflated. Dates shown as month/date/year. WL, water level; ft, feet; NAVD 88, North American Vertical Datum of 1988; DTW, depth to water; bls, below land surface; gpm, gallons per minute; gpm/ft, gallons per minute per foot; min, minutes; gal, gallons; --, not available]
BK–1023 (well 28)
Four intervals were isolated for testing in the 605-ft deep, 8-in. diameter borehole BK–1023 (well 28) (table 1.2) that had 57 ft of casing. Packers with 5.9-ft long bladders were used for tests of BK–1023. The shallowest interval tested (zone 1, “above 78 ft bls”) spanned depths from above the top of the upper packer to bottom of casing at 57 ft bls. When pumped, this shallowest interval was low yielding, with drawdown that indicated most pumped water was from borehole storage and only minor recovery after pumping was stopped; no sample was collected from zone 1. The next shallowest interval tested (zone 2, “89–117.2 ft bls”) was also low yielding but could sustain a pumping rate of about 0.16 gal/min to allow interval purging and subsequent sample collection. The deepest intervals tested were zones 3 (“144–177 ft bls”) and 4 (“144–604 ft bls,” at the bottom of borehole). By comparing results from overlapping zones 3 (“144–177.2 ft bls”) and 4 (“144–604 ft bls”), hydraulic properties and water quality of the interval ranges from 177.2 to 604 ft bls may be inferred. The volume of water pumped from isolated intervals was less than the target three-interval-volume by varying amounts, partly as a result of low yield of the borehole and limitations related to packer placement (borehole strongly deviated from vertical below about 150 ft bls”).
Table 1.2.
Water levels, drawdown, pumping rates, computed specific capacity, pumping duration before sampling, estimated pumped volume before sampling, and target three-interval volume in aquifer-interval-isolation (packer) tests of well BK–1023 (well 28), zones 1–4, near the former Naval Air Warfare Center Warminster, Warminster Township, Bucks County, Pennsylvania, October 9–10, 2018.[Interval top is top of upper packer bladder, except for zone 1 where top is bottom of casing above upper packer. Interval bottom is top of lower packer bladder, except for zone 4 where it is bottom of hole and only upper packer is inflated. Dates shown as month/date/year. WL, water level; ft, feet; NAVD 88, North American Vertical Datum of 1988; DTW, depth to water; bls, below land surface; gpm, gallons per minute; gpm/ft, gallons per minute per foot; min, minutes; gal, gallons, <, less than; --, not available]
BK–1087 (well 25)
Nine intervals were isolated for testing in the 400-ft deep, 8-in. diameter borehole BK–1087 (well 25) that had 60 ft of casing (table 1.3). Packers with 5.9-ft long bladders were used for tests of BK–1087. Tests of zones 1 and 2 used the same packer setup, with top of upper packer set at 81 ft bls. The shallowest interval tested (zone 1, “above 81 ft bls”) spanned depths from above the top of the upper packer to bottom of casing at 60 ft bls and was low yielding when pumped. Pumping was stopped in zone 1 after large drawdown (about 70 ft) was measured during initial pumping in zone 1, and water levels in that interval recovered slowly. The test of zone 2 (“81–104.8 ft bls”), an interval that did not show water-level response to pumping in zone 1, was started during recovery of initial pumping in zone 1. After the test of zone 2, zone 1 was pumped again for sample collection. In the tests of zones 4 (“163–186.8 ft bls”) and 6 (“228–251.8 ft bls”), water levels below the lower packer declined slightly in response to pumping in the isolated interval. In the test of zone 5 (“186–209.8 ft bls”), water levels below the lower packer declined slowly and steadily to reach a lower head than the tested reach but did not respond to pumping in the isolated interval. The volume of water pumped from the deepest isolated interval tested (zone 10, “below 335 ft bls” to bottom of borehole at 400 ft bls) was less than the target three-interval volume because of field logistics and the low yield of this zone.
Table 1.3.
Water levels, drawdown, pumping rates, computed specific capacity, estimated pumped volume before sampling, and target three-interval volume in aquifer-interval-isolation (packer) tests of well BK–1087 (well 25), zones 1–8, near the former Naval Air Warfare Center Warminster, Ivyland Borough, Bucks County, Pennsylvania, May 7–17, 2019.[Interval top is top of upper packer bladder, except for zone 1 where top is bottom of casing above upper packer. Interval bottom is top of lower packer bladder, except for zone 8 where it is bottom of hole and only upper packer is inflated. Dates shown as month/date/year. WL, water level; ft, feet; NAVD 88, North American Vertical Datum of 1988; DTW, depth to water; bls, below land surface; gpm, gallons per minute; gpm/ft, gallons per minute per foot; min, minutes; gal, gallons, --, not available]
BK–2698 (well 8)
Five intervals were isolated for testing in the 210.55-ft deep, 10-in. diameter borehole BK–2698 (well 8) (table 1.4) that had 60 ft of casing, although complete tests were done for only four intervals as test of zone 4 (“153–181 ft bls”) was discontinued after 2 minutes of pumping because of extreme low yield and large drawdown. Packers with 5.9-ft long bladders were used for tests of BK–2698. Tests of zones 1 and 2 used the same packer setup, with top of upper packer set at 86 ft bls. The shallowest interval tested (zone 1, “above 86 ft bls”) spanned depths from above the top of the upper packer at 86 ft bls to bottom of casing at 60 ft bls and was pumped twice, first on August 28, 2019, for about 25 minutes and then again for a complete test on August 29, 2019 (Senior and others, 2020). Water levels in nearby 160-ft-deep open borehole BK–2861 (well 11) were measured during aquifer-interval-isolation tests of BK–2698 (well 8) and showed a response to pumping only in test of zone 3 (“125.3–153.3 ft bls”).
Table 1.4.
Water levels, drawdown, pumping rates, computed specific capacity, pumping duration before sampling, estimated pumped volume before sampling, and target three-interval volume in aquifer-interval-isolation (packer) tests of well BK–2698 (well 8), zones 1–5, and water levels in nearby well BK–2861 (well 11) during tests near the former Naval Air Warfare Center Warminster, Warwick Township, Bucks County, Pennsylvania, August 28–September 5, 2019.[Interval top is top of upper packer bladder, except for zone 1 where top is bottom of casing above upper packer. Interval bottom is top of lower packer bladder, except for zone 5 where it is bottom of hole and only upper packer is inflated. Dates shown as month/date/year. WL, water level; ft, feet; NAVD 88, North American Vertical Datum of 1988; DTW, depth to water; bls, below land surface; gpm, gallons per minute; gpm/ft, gallons per minute per foot; min, minutes; gal, gallons, --, not available]
Altitude of water level calculated using depth to water below land-surface altitude of 310 and 314.2 feet above NAVD 88 as estimated from light detection and ranging for wells BK–2698 and BK–2861, respectively.
BK–2861 (well 11)
Three intervals were isolated for testing in the 160-ft deep, 10-in. diameter borehole BK–2861 (well 11) (table 1.5) that had 83 ft of casing. Packers with 5.9-ft long bladders were used for tests of BK–2861. In the test of the shallowest interval, zone 1 (“75–100.3 ft bls”), the upper packer was inflated in casing and water levels below the lower packer responded to pumping in the isolated interval (table 1.5). Hydraulic connections between intervals separated by packers were also indicated by water levels measured during tests of zones 2 (“100–124.9 ft bls”) and 3 (“123–160 ft bls” at bottom) tests, with water levels in and above the isolated interval about equal in the test of zone 2 (“100–124.9 ft bls”) (table 1.5; Senior and others, 2020). Water levels in nearby 210.5-ft deep open borehole BK–2698 (well 8) were measured during aquifer-interval-isolation tests of zone 2 and 3 in BK–2861 (well 11) and showed response to pumping in both tests (table 1.5; Senior and others, 2020).
Table 1.5.
Water levels, drawdown, pumping rates, computed specific capacity, pumping duration before sampling, estimated pumped volume before sampling, and target three-interval volume in aquifer-interval-isolation (packer) tests of well BK–2861 (well 11), zones 1–3, and water levels in nearby well BK–2698 (well 8) during tests, near the former Naval Air Warfare Center Warminster, Warwick Township, Bucks County, Pennsylvania, August 26–27, 2019.[Interval top is top of upper packer bladder. Interval bottom is top of lower packer bladder, except for zone 3 where it is bottom of hole and only upper packer is inflated. Dates shown as month/date/year. WL, water level; ft, feet; NAVD 88, North American Vertical Datum of 1988; DTW, depth to water; bls, below land surface; gpm, gallons per minute; gpm/ft, gallons per minute per foot; min, minutes; gal, gallons, --, not available]
BK–2869 (well 9)
Ten intervals were isolated for testing in the 315-ft deep, 10-in. diameter borehole BK–2869 (well 9) (table 1.6) that had 63 ft of casing, although complete tests were done for eight intervals as tests of zones 3 (“122–144.2 ft bls”) and 9 (“258–280.2 ft bls”) were discontinued after a few minutes of pumping because of extreme low yield and large drawdown. Packers with 5.9-ft long bladders were used for tests of BK–2869. Tests of zones 1 and 2 used the same packer setup, with the top of the upper packer set at 98 ft bls. The shallowest interval tested (zone 1, “above 98 ft bls”) spanned depths from above the top of the upper packer at 98 ft bls to bottom of casing at about 63 ft bls. Relatively little to no hydraulic connection to adjacent intervals, as indicated by small to no drawdown in intervals adjacent to the pumped isolated interval, was observed for tests of most zones, but a small hydraulic connection to adjacent intervals was indicated by drawdown in interval below the bottom packer during the test of zone 7 (“213–235.2 ft bls”) (table 1.6; see water-levels plots for BK–2869 in Senior and others, 2020)). The deepest interval tested (zone 7, “below 258 ft bls”) spanned depths from the upper packer to the bottom of the borehole at about 315 ft bls, as only the upper packer was inflated.
Table 1.6.
Water levels, drawdown, pumping rates, computed specific capacity, pumping duration before sampling, estimated pumped volume before sampling, and target three-interval volume in aquifer-interval-isolation (packer) tests of well BK–2869 (well 9), zones 1–10, near the former Naval Air Warfare Center Warminster, Warwick Township, Bucks County, Pennsylvania, July 20–August 7, 2019.[Interval top is top of upper packer bladder, except for zone 1 where top is bottom of casing above upper packer. Interval bottom is top of lower packer bladder, except for zone 10 where it is bottom of hole and only upper packer is inflated. Dates shown as month/date/year. WL, water level; ft, feet; NAVD 88, North American Vertical Datum of 1988; DTW, depth to water; bls, below land surface; gpm, gallons per minute; gpm/ft, gallons per minute per foot; min, minutes; gal, gallons, --, not available; <, less than]
BK–3062 (well 15)
Eight intervals were isolated for testing in the 400-ft deep, 10-in. diameter borehole BK–3062 (well 15) (table 1.7) that had 93 ft of casing, although complete tests were done for only seven intervals as test of zone 6 (“223.5–247.3 ft bls”) was discontinued after 8 minutes of pumping because of extreme low yield and large drawdown. Packers with 5.9-ft long bladders were used for tests of BK–3062. In the test of the shallowest interval, zone 1 (“87–110.8 ft bls”), the upper packer was inflated in casing and water levels below the lower packer responded to pumping in the isolated interval (table 1.7). Some hydraulic connection to an adjacent interval for the packer setting near 110 ft bls was also indicated by drawdown in the interval above the upper packer during the test of zone 2 (“110.5–134.3 ft bls”) (table 1.7; see water-levels plots for BK–3082 in Senior and others (2020)). The deepest interval tested (zone 10, “below 368 ft bls”) spanned depths from the upper packer to the bottom of the borehole at about 307 ft bls, as only the upper packer was inflated. Pumped volumes were less than the target three-interval-volumes for tests of zones 5, 6A, and 7, partly because of field logistics for these very low yielding intervals.
Table 1.7.
Water levels, drawdown, pumping rates, computed specific capacity, pumping duration before sampling, estimated pumped volume before sampling, and target three-interval volume in aquifer-interval-isolation (packer) tests of well BK–3062 (well 15), zones 1–7, at the former Naval Air Warfare Center Warminster, Northampton Township, Bucks County, Pennsylvania, April 25–May 2, 2018.[Interval top is top of upper packer bladder. Interval bottom is top of lower packer bladder, except for zone 7 where it is bottom of hole and only upper packer is inflated. Dates shown as month/date/year. WL, water level; ft, feet; NAVD 88, North American Vertical Datum of 1988; DTW, depth to water; bls, below land surface; gpm, gallons per minute; gpm/ft, gallons per minute per foot; min, minutes; gal, gallons; --, not available; <, less than]
BK–3063 (well HN–116)
Ten intervals were isolated for testing in the 601-ft deep, 6-in. diameter borehole BK–3063 (HN–116) (table 1.8) that had 19 ft of casing. Packers with 4.2-ft long bladders were used for tests of BK–3063. The shallowest intervals tested, zones 1 and 2 (“above 37 ft bls” and “37–74 ft bls”), used the same packer set up. The test of zone 2 (“37–74 ft bls”) was done before test of zone 1 (“above 37 ft bls to bottom of casing at 19 ft bls”), which was started after water levels had recovered from pumping zone 2 (see plots for well BK–3063 in Senior and others (2020)). The water levels for these packer tests indicate that zones 1 and 2 have little to no hydraulic connection, and relatively little to no hydraulic connection to adjacent intervals, as indicated by small drawdown in intervals adjacent to the pumped isolated interval, was also observed for tests of most other zones, except for tests of zones 5 and 8 (table 1.8; see also water-levels plots for BK–3062 in Senior and others (2020)). In the test of zone 5 (“177.5–214.5 ft bls”), the water level above the upper packer responded slightly to pumping in the isolated interval. In the test of zone 8 (“381.5–418.5 ft bls”), the water level below the lower packer responded slightly to pumping in the isolated interval. The deepest interval tested (zone 11, “below 531 ft bls”) spanned depths from the upper packer to the bottom of the borehole at about 601 ft bls, as only the upper packer was inflated.
Table 1.8.
Water levels, drawdown, pumping rates, computed specific capacity, pumping duration before sampling, estimated pumped volume before sampling, and target three-interval volume in aquifer-interval-isolation (packer) tests of well BK–3063 (HN–116), zones 1–11, at the former Naval Air Warfare Center Warminster, Bucks County, Pennsylvania, June 6–12, 2018.[Interval top is top of upper packer bladder, except for zone 1 where top is bottom of casing above upper packer. Interval bottom is top of lower packer bladder, except for zone 8 where it is bottom of hole and only upper packer is inflated. Dates shown as month/date/year. WL, water level; ft, feet; NAVD 88, North American Vertical Datum of 1988; DTW, depth to water; bls, below land surface; gpm, gallons per minute; gpm/ft, gallons per minute per foot; min, minutes; gal, gallons, --, not available]
BK–3066 (well HN–118)
Ten intervals were isolated for testing in the 602-ft deep and 6-in. diameter borehole BK–3066 (HN–118) (table 1.9) that had 19 ft of casing. Packers with 4.2-ft long bladders were used for tests of BK–3066. The shallowest intervals tested, zones 1 and 2 (“above 28 ft bls” and “28–49.4 ft bls”), used the same packer set up. Because the static water level of about 29.5 ft bls in the open borehole was below the upper packer before upper packer inflation, no water levels were measured and recorded by the transducer initially; after the upper packer was inflated, the water level above the upper packer rose due to inflow from water-producing fractures above 28 ft bls to a static level of about 11.1 ft bls. For the test of zone 1 (“above 28 ft bls”), the interval was pumped twice, being dewatered on August 8, 2019, and then pumped to collect samples and measure hydraulic properties on August 9, 2019 (Senior and others, 2020). Water levels measured by the transducer below the lower packer appear to be affected by equipment problems (leakage and interconnection to interval above upper packer) for tests of numerous zones, including zones 1, 2, 10, 11, 12, and 13, as indicated by water-level responses during tests (Senior and others, 2020). Given this limitation, relatively little to no hydraulic connection to adjacent intervals, as indicated by small drawdown in intervals adjacent to the pumped isolated interval, was observed for tests of most zones, except for tests of zones 12 and 13 (table 1.9; see also water-levels plots for BK–3066 in Senior and others (2020)). In the tests of zones 12 (“554.6–575 ft bls”) and 13 (“554.6–602 ft bls” at bottom), the water level above the upper packer responded slightly to pumping in the isolated interval.
Table 1.9.
Water levels, drawdown, pumping rates, computed specific capacity, pumping duration before sampling, estimated pumped volume before sampling, and target three-interval volume in aquifer-interval-isolation (packer) tests of well BK–3066 (HN–118), zones 1–12, at the former Naval Air Warfare Center Warminster, Bucks County, Pennsylvania, August 8–21, 2018.[Interval top is top of upper packer bladder, except for zone 1 where top is bottom of casing above upper packer. Interval bottom is top of lower packer bladder, except for zone 12 where it is bottom of hole and only upper packer is inflated. Dates shown as month/date/year. WL, water level; ft, feet; NAVD 88, North American Vertical Datum of 1988; DTW, depth to water; bls, below land surface; gpm, gallons per minute; gpm/ft, gallons per minute per foot; min, minutes; gal, gallons, --, not available]
Altitude of water level calculated using depth to water below land-surface altitude of 347 feet above NAVD 88 as estimated from light detection and ranging.
BK–3067 (well HN–119)
Fourteen intervals were isolated for testing in the 602-ft deep and 6-in. diameter borehole BK–3067 (HN–119) (table 1.10) that had 20 ft of casing, although complete tests were done for only eleven intervals as tests of zones 5, 11, and 13 were discontinued due to low productivity (Senior and others, 2020). Packers with 4.2-ft long bladders were used for tests of BK–3067. The water levels in isolated intervals for tests of zones 5 (“223.5–247.3 ft bls”) and 11 (“499–523.5 ft bls”) were very slow to stabilize after packer inflation, indicating very low productivity, and these intervals were not pumped. The test of zone 13 (“550–574.5 ft bls”) was discontinued after 13 minutes of pumping because of extreme low yield and large drawdown.
The shallowest intervals tested, zones 1 (“above 50.5 ft bls”) and 2 (“50.5–75 ft bls”), used the same packer set up (“50.5–75 ft bls”). As the static water level of about 54.7 ft bls in the open borehole was below the upper packer before upper packer inflation, no water levels were measured and recorded by the transducer initially; after the upper packer was inflated, the water level above the upper packer rose due to inflow from water-producing fractures above 50 ft bls to a static level of about 11.5 ft bls. Water levels measured by the transducer below the lower packer appear to be affected by equipment problems (leakage and interconnection to interval above upper packer) for tests of many zones, as indicated by water-level responses during tests (Senior and others, 2020). Given this limitation, relatively little to no hydraulic connection to adjacent intervals, as indicated by small drawdown in intervals adjacent to the pumped isolated interval, was observed for tests of most zones, except for the test of zone 1 (table 1.10; see also water-levels plots for BK–3067 in Senior and others (2020)). In the test of zone 1 (“above 50.5 ft bls”), the water level below the upper packer responded slightly to pumping above the upper packer.
Table 1.10.
Water levels, drawdown, pumping rates, computed specific capacity, pumping duration before sampling, estimated pumped volume before sampling, and target three-interval volume in aquifer-interval-isolation (packer) tests of well BK–3067 (HN–119), zones 1–10, at the former Naval Air Warfare Center Warminster, Bucks County, Pennsylvania, August 22–September 5, 2018.[Interval top is top of upper packer bladder, except for zone 1 where top is bottom of casing above upper packer. Interval bottom is top of lower packer bladder, except for zone 14 where it is bottom of hole and only upper packer is inflated. Dates shown as month/date/year. WL, water level; ft, feet; NAVD 88, North American Vertical Datum of 1988; DTW, depth to water; bls, below land surface; gpm, gallons per minute; gpm/ft, gallons per minute per foot; min, minutes; gal, gallons; --, not available]
BK–3068 (well HN–117)
Eleven intervals were isolated for testing in the 600-ft deep, 6-in. diameter borehole BK–3068 (HN–118) (table 1.11) that had 19 ft of casing, although complete tests were done for only ten intervals as tests of zone 12 (“556.5–582.1 ft bls”) was not pumped after packer inflation (Senior and others, 2020). Packers with 4.2-ft long bladders were used for tests of BK–3068. The shallowest intervals tested, zones 1 (“above 32 ft bls”) and 2 (“32–57.6 bls”), used the same packer set up (“32–57.6 ft bls”). The test of zone 1 was done after the test of zone 2, following water-level recovery from pumping. Relatively little to no hydraulic connection to adjacent intervals, as indicated by small drawdown in intervals adjacent to the pumped isolated interval, was observed for tests of most zones, except for the test of zone 2 (table 1.11; see also water-levels plots for BK–3062 in Senior and others (2020)). In the test of zone 2 (“32–57.6 ft bls”), the water level below the lower packer responded slightly to pumping in the isolated interval; however, in the test of zone 3 (“56–81 ft bls”), no hydraulic connection to adjacent intervals is indicated by water level in intervals adjacent to the pumped isolated interval. Similar to what was observed in tests of some other boreholes (such as BK–3066, BK–3067), water levels measured by the transducer below the lower packer appear to be affected by equipment problems (leakage and interconnection to interval above upper packer) for tests of several zones in BK–3068 (HN–117), as indicated by water-level responses during tests in zones deeper than about 300 ft bls (Senior and others, 2020). Given this limitation, water levels below the lower packer should be interpreted with caution.
Table 1.11.
Water levels, drawdown, pumping rates, computed specific capacity, pumping duration before sampling, estimated pumped volume before sampling, and target three-interval volume in aquifer-interval-isolation (packer) tests of well BK–3068 (HN–117), zones 1–13, at the former Naval Air Warfare Center Warminster, Bucks County, Pennsylvania, September 24–October 3, 2018.[Interval top is top of upper packer bladder, except for zone 1 where top is bottom of casing above upper packer. Interval bottom is top of lower packer bladder, except for zone 13 where it is bottom of hole and only upper packer is inflated. Dates shown as month/date/year. Ft, feet; bls, below land surface; WL, water level; NAVD 88, North American Vertical Datum of 1988; DTW, depth to water; gpm, gallons per minute; gpm/ft, gallons per minute per foot; min, minutes; gal, gallons]
BK–3070 (well HN–120D)
Eight intervals were isolated for testing in the 555-ft deep, 6-in. diameter borehole BK–3070 (HN–120D) (table 1.12) that had 59 ft of casing, although complete tests were done for seven intervals as water levels were very slow to stabilize after packer inflation in the test of zone 6 (“238–260.9 ft bls”), indicating very low productivity, therefore zone 6 was not pumped (Senior and others, 2020). Packers with 4.2-ft long bladders were used for tests of BK–3070. The shallowest intervals tested, zones 1 (“above 65 ft bls”) and 2 (“65–87.9 bls”), used the same packer set up (“65–87.9 ft bls”). The test of zone 1 was done after the test of zone 2, following water-level recovery from pumping. Relatively little to no hydraulic connection to adjacent intervals, as indicated by small drawdown in intervals adjacent to the pumped isolated interval, was observed for tests of most zones, except for tests of zones 1 and 2 (table 1.12; see also water-levels plots for BK–3070 in Senior and others (2020)). Hydraulic connections near packer setting at 65 ft bls are indicated by water level responses in tests of zones 1 and 2. In the test of zone 1 (“above 65 ft bls”), the water level below the upper packer responded slightly to pumping above the upper packer, and in the test of zone 2 (“65–87.9 ft bls”), the water level above the upper packer responded slightly to pumping in the isolated interval below the upper packer. Water levels in nearby open borehole BK–3069 (well HN–120S) were measured during aquifer-interval-isolation tests in BK–3070 (HN–120D) and showed response to pumping in shallow zones 1 and 2 in BK–3070 (HN–120D) (table 1.12; Senior and others, 2020). BK–3069 (HN–120S) was initially drilled to about 425 ft bls but had collapsed at the time of aquifer-interval-isolation tests in BK–3070 (HN–120D), when it was open to at least a depth of 29 ft bls. Similar to what was observed in tests of some other boreholes (such as BK–3066, BK–3067), water levels measured by the transducer below the lower packer appear to be affected by equipment problems (leakage and interconnection to interval above upper packer) for tests of several zones in BK–3070 (HN–120D) (Senior and others, 2020). Given this limitation, water levels below the lower packer should be interpreted with caution. The pumped volume was less than the target three-interval-volume for test of zone 11 (“388–600 ft bls” at bottom), partly because of field logistics for this very low yielding interval.
Table 1.12.
Water levels, drawdown, pumping rates, computed specific capacity, pumping duration before sampling, estimated pumped volume before sampling, and target three-interval volume in aquifer-interval-isolation (packer) tests of well BK–3070 (HN–120D), zones 1–11, and water levels in nearby well BK–3069 (HN–120S) during tests, at the former Naval Air Warfare Center Warminster, Bucks County, Pennsylvania, November 1–9, 2018.[Interval top is top of upper packer bladder, except for zone 1 where top is bottom of casing above upper packer. Interval bottom is top of lower packer bladder, except for zone 1 where it is bottom of hole and only upper packer is inflated. Dates shown as month/date/year. WL, water level; ft, feet; NAVD 88, North American Vertical Datum of 1988; DTW, depth to water; bls, below land surface; gpm, gallons per minute; gpm/ft, gallons per minute per foot; min, minutes; gal, gallons; --, not available]
BK–3071 (well HN–121)
Eight intervals were isolated for testing in the 600-ft deep (collapsed to about 415 ft bls after drilling and before packer tests), 6-in. diameter borehole BK–3071 (HN–121) (table 1.13) that had 20 ft of casing (Senior and others, 2020). Packers with 4.2-ft long bladders were used for tests of BK–3071. The shallowest intervals tested, zones 1 (“above 30.5 ft bls”) and 2 (“30.5–60.4 bls”), used the same packer set up (“30.5–60.4 ft bls”). The test of zone 2 was done after the test of zone 1, following water-level recovery from pumping. Relatively little to no hydraulic connection to adjacent intervals, as indicated by small drawdown in intervals adjacent to the pumped isolated interval, was observed for tests of all zones, although water levels below the lower packer declined gradually to new hydraulic heads during several tests (table 1.13; see also water-levels plots for BK–3070 in Senior and others (2020)). Similar to what was observed in tests of some other boreholes (such as BK–3066, BK–3067) water levels measured by the transducer below the lower packer appear to be affected by equipment problems (leakage and interconnection to interval above upper packer) for tests of several zones in BK–3071 (HN–121) (Senior and others, 2020). Given this limitation, water levels below the lower packer should be interpreted with caution. The pumped volume was less than (about 60 percent of) the target three-interval volume for test of zone 11 (“388–600 ft bls” at bottom), although the three-interval volume was calculated using the assumption that the well was open to 600 ft bls; if the well had collapsed below 415 ft bls, the actual three-interval volume might be less than that of an open borehole and the pumped volume might be closer in value to the actual three-interval volume.
Table 1.13.
Water levels, drawdown, pumping rates, computed specific capacity, pumping duration before sampling, estimated pumped volume before sampling, and target three-interval volume in aquifer-interval-isolation (packer) tests of well BK–3071 (HN–121), zones 1–10, at the former Naval Air Warfare Center Warminster, Bucks County, Pennsylvania, November 14–27, 2018.[Interval top is top of upper packer bladder, except for zone 1 where top is bottom of casing above upper packer. Interval bottom is top of lower packer bladder, except for zone 10 where it is bottom of hole and only upper packer is inflated. Dates shown as month/date/year. WL, water level; ft, feet; NAVD 88, North American Vertical Datum of 1988; DTW, depth to water; bls, below land surface; gpm, gallons per minute; gpm/ft, gallons per minute per foot; min, minutes; gal, gallons, --, not available]
References Cited in Appendix 1
Senior, L.A., Zarr, L.F., Olson, L., and Rosman, R., 2020, Water-level data and selected field notes for aquifer-interval-isolation tests at and near the former Naval Air Warfare Center Warminster, Bucks County, Pennsylvania, 2018–19 (ver. 2.0, January 2024): U.S. Geological Survey data release, https://doi.org/10.5066/P9TC92B5.
Conversion Factors
U.S. customary units to International System of Units
International System of Units to U.S. customary units
Temperature in degrees Celsius (°C) may be converted to degrees Fahrenheit (°F) as follows: °F = (1.8 × °C) + 32.
Temperature in degrees Fahrenheit (°F) may be converted to degrees Celsius (°C) as follows: °C = (°F – 32) / 1.8.
Datum
Vertical coordinate information is referenced to the North American Vertical Datum of 1988 (NAVD 88).
Horizontal coordinate information is referenced to North American Datum of 1983 (NAD 83).
Altitude, as used in this report, refers to distance above the vertical datum.
Supplemental Information
Specific conductance is given in microsiemens per centimeter at 25 degrees Celsius (µS/cm at 25 °C).
Concentrations of chemical constituents in water are given in milligrams per liter (mg/L), micrograms per liter (µg/L), or nanograms per liter (ng/L).
Results for measurements of stable isotopes of an element (with symbol E) in water, solids, and dissolved constituents commonly are expressed as the relative difference in the ratio of the number of the less abundant isotope (iE) to the number of the more abundant isotope of a sample with respect to a measurement standard.
Abbreviations
ANG
Biddle Air National Guard Station
EPA
U.S. Environmental Protection Agency
LHA
lifetime health advisory
MCL
maximum contaminant level
NAWC
Naval Air Warfare Center
NASJRB
Naval Air Station Joint Reserve Base
Navy
U.S. Navy
NWQL
National Water Quality Laboratory
PFAS
per- and polyfluoroalkyl substances
PFOA
perfluorooctanoic acid
PFOS
perfluorooctanesulfonic acid
ppt
parts per trillion
PVC
polyvinyl chloride
SMCL
secondary maximum contaminant level
USGS
U.S. Geological Survey
VOC(s)
volatile organic compound(s)
VSMOW
Vienna Standard Mean Ocean Water
For additional information about this report, contact:
Director, Pennsylvania Water Science Center
U.S. Geological Survey
215 Limekiln Road
New Cumberland, PA 17070
For additional information, visit:
https://www.usgs.gov/centers/pennsylvania-water-science-center
Publishing support provided by the Baltimore and Reston Publishing Service Centers
Disclaimers
Any use of trade, firm, or product names is for descriptive purposes only and does not imply endorsement by the U.S. Government.
Although this information product, for the most part, is in the public domain, it also may contain copyrighted materials as noted in the text. Permission to reproduce copyrighted items must be secured from the copyright owner.
Suggested Citation
Senior, L.A., and Fiore, A.R., 2024, Results of 2018–19 water-quality and hydraulic characterization of aquifer intervals using packer tests and preliminary geophysical-log correlations for selected boreholes at and near the former Naval Air Warfare Center Warminster, Bucks County, Pennsylvania (ver. 1.1, January 2025): U.S. Geological Survey Open-File Report 2024–1007, 136 p., https://doi.org/10.3133/ofr20241007.
ISSN: 2331-1258 (online)
Study Area
| Publication type | Report |
|---|---|
| Publication Subtype | USGS Numbered Series |
| Title | Results of 2018–19 water-quality and hydraulic characterization of aquifer intervals using packer tests and preliminary geophysical-log correlations for selected boreholes at and near the former Naval Air Warfare Center Warminster, Bucks County, Pennsylvania |
| Series title | Open-File Report |
| Series number | 2024-1007 |
| DOI | 10.3133/ofr20241007 |
| Edition | Version 1.0: March 2024; Version 1.1 January 2025 |
| Publication Date | March 18, 2024 |
| Year Published | 2024 |
| Language | English |
| Publisher | U.S. Geological Survey |
| Publisher location | Reston, VA |
| Contributing office(s) | New Jersey Water Science Center, Pennsylvania Water Science Center |
| Description | Report: xv, 136 p.; 5 Plates; Data Release |
| Country | United States |
| State | Pennsylvania |
| Other Geospatial | Naval Air Warfare Center Warminster |
| Online Only (Y/N) | Y |
| Additional Online Files (Y/N) | Y |