

Assessing Influence from Wastewater Treatment Facilities on Glorieta Creek and the Pecos River Within Pecos National Historical Park, New Mexico, February–October 2022
Links
- Document: Report (1.54 MB pdf) , HTML , XML
- Appendixes:
- Appendix 1 (35.8 KB xlsx) - Water Chemistry Data for Samples Collected by the U.S. Geological Survey from Pecos National Historical Park in 2022
- Appendix 1 (22.5 KB csv)
- Dataset: USGS water data for the Nation - USGS National Water Information System database
- Download citation as: RIS | Dublin Core
Acknowledgments
We would like to thank Eric Lassance and Jeremy Moss from Pecos National Historical Park for their valuable assistance with project logistics and field support. In addition, Mollie Hanttula, Autumn Hatcliff, and Kevin Lash provided field support that was indispensable to project success.
Brittany Mora and Hailey Galit, U.S. Geological Survey, went above and beyond to help collect samples during long field days.
Abstract
The Pecos National Historical Park protects 2.9 miles of the Pecos River and part of Glorieta Creek within the park boundaries. Updated water-quality data can assist resource managers in determining if effluent from two nearby wastewater treatment plants (WWTPs) is affecting the quality of the water in the Pecos River and Glorieta Creek within the park. Water samples were collected four times in 2022 at two WWTP outfalls, two locations on Glorieta Creek, and two locations on the Pecos River. Water quality parameters (dissolved oxygen, water temperature, pH, turbidity, specific conductance) were measured in the field, and samples were collected and analyzed for major ions, trace elements, rare earth elements, nutrients, bacteria, and per- and polyfluoroalkyl substances (PFAS).
Specific conductance values in all samples collected from Glorieta Creek exceeded the New Mexico Surface Water Quality Standard (NMWQS) of 300 microsiemens per centimeter at 25 degrees Celsius. Concentrations of dissolved oxygen in three samples collected from Glorieta Creek and one sample for the Pecos WWTP did not meet the standard for high-quality cold-water use. Concentrations of Escherichia coli in samples from the Pecos WWTP exceeded the NMWQS of 235 colony-forming units per 100 milliliters during every sampling event. Concentrations of E. coli in samples collected from two sites on Glorieta Creek in August exceeded the NMWQS.
The chemical signature of water from Glorieta Creek indicated groundwater and (or) septic system contributions. Water samples collected from the Pecos River all had similar chemical signatures of calcium-bicarbonate type. Although concentrations of several trace elements were higher in samples from Glorieta Creek than in samples from the Pecos River, no concentrations exceeded the drinking-water standards. No concentrations exceeded aquatic life standards except for copper concentrations in two samples from the downstream location on Glorieta Creek. The trace element signature and the gadolinium anomalies in the WWTP samples indicate anthropogenic contributions.
Eleven of the 28 PFAS compounds analyzed were detected in samples during this study, with the treated wastewater effluent samples having the highest total PFAS concentrations. The total PFAS concentrations in samples from Glorieta Creek decreased by an order of magnitude as the creek flowed downstream. At the downstream site on the Pecos River, there was only one sample that had a detection of PFAS.
Introduction
The Pecos National Historical Park (PECO) in northern New Mexico attracts thousands of visitors every year for its cultural significance and natural beauty (fig. 1). The park is located in a valley, which was an advantageous location for the Indigenous peoples of Pecos, allowing them to build a pueblo that became the prominent trading center of the region in the 15th century. Pecos also became a part of the trade route on the Santa Fe Trail and was a significant military location during the Mexican War and the American Civil War (National Park Service, 2015). Another reason why the Pecos Pueblo became globally, nationally, and regionally significant is because the Pecos River provided a reliable water source and a riparian/wetland habitat, which is rare in the arid Southwest (National Park Service, 2015). Currently, PECO visitors have access to the Pecos River through a fishing program and a hiking trail. As part of a long-term recreation plan, PECO staff intend to expand access to the Pecos River and create a new nature trail that will bring visitors to Glorieta Creek within PECO (fig. 2; National Park Service, 2010).
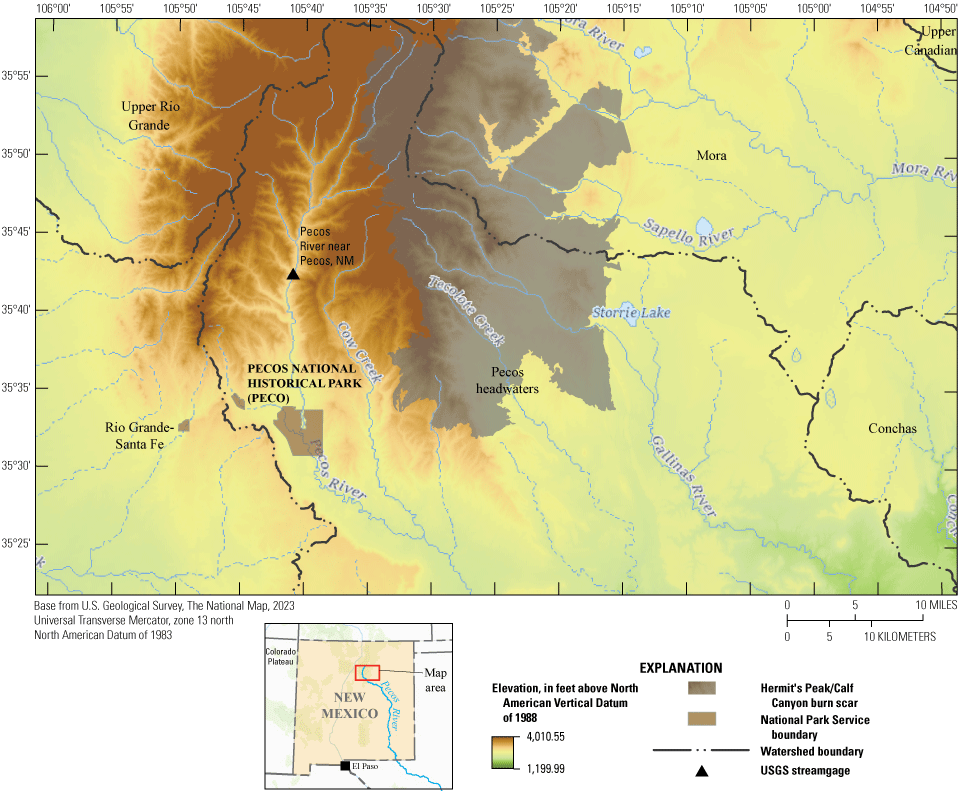
Location of the Pecos River headwaters watershed and neighboring watersheds in the area of Pecos National Historical Park, New Mexico.
There are two wastewater treatment plants (WWTP) upgradient of water resources in PECO on both Glorieta Creek and the Pecos River. The anthropogenic influence of the WWTPs on the water quality of Glorieta Creek and the Pecos River is not well understood. Park personnel could utilize water quality data to manage riparian vegetation and fish populations and plan for expanded trail access to water resources. In addition, water quality monitoring can inform PECO personnel on whether exposure to the water resources is safe, on when and where to post signage or not allow access to waterways, and about any exceedances of water quality standards. Up-to-date water-quality information can be used by park management for comparison of compounds detected in effluent from the nearby WWTPs with State and Federal standards. The U.S. Geological Survey (USGS), in cooperation with the National Park Service, studied the current water quality within the park to understand current conditions over a range of seasons throughout the year.
Purpose and Scope
This report presents the results of a study to assess the influence of two upgradient WWTPs on Glorieta Creek and the Pecos River. Data are presented from water samples collected during the period February–October 2022 from Glorieta Creek and the Pecos River, which were analyzed for major ions, trace elements, nutrients, bacteria, and PFAS compounds. Up-to-date water quality information can be used to inform park personnel in decision making related to management and access of the water resources.
Hydrologic Setting
The Pecos River originates at its headwaters in the mountains of northern New Mexico and flows south-southeasterly through eastern New Mexico into Texas for about 970 miles, where it eventually joins the Rio Grande near the United States border with Mexico (Bureau of Reclamation, 2021). The study area is in the Pecos headwaters watershed where PECO protects 2.9 miles of the Pecos River, including the confluence with Glorieta Creek. Because PECO is split by private land, PECO is divided into two units: the Main Unit and the Pigeon Ranch Unit. PECO protects 3.2 miles of Glorieta Creek in the Main Unit and 1 mile of Glorieta Creek in the Pigeon Ranch Unit (fig. 1) (Porter and Longley, 2009). The water quality sampling locations are within PECO boundaries except for the two sampling locations at the wastewater treatment plant (WWTP) outfalls (fig. 2; table 1).
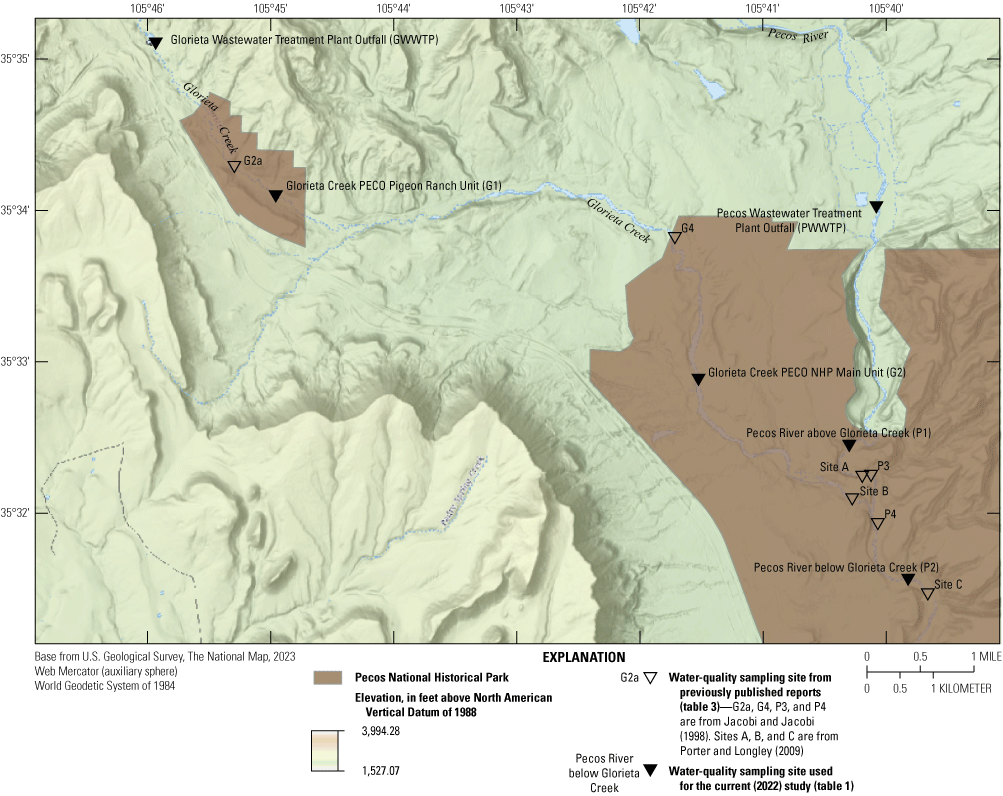
Locations of historical sampling sites (Jacobi and Jacobi, 1998; Porter and Longley, 2009) and sampling sites used to study the influence of wastewater treatment plants on the Pecos River and Glorieta Creek, February–October 2022.
Table 1.
Site information for locations of surface-water sample collection in the Pecos National Historical Park study area.[Information from U.S. Geological Survey (USGS), 2023; ID, identification; NM, New Mexico; NR, not reported]
| USGS station number | Station (site) name (fig. 2) |
Short name | Latitude (decimal degrees) |
Longitude (decimal degrees) |
|---|---|---|---|---|
| 353506105455610 | Glorieta Wastewater Treatment Plant Outfall, NM | GWWTP | NR | NR |
| 353406105445810 | Glorieta Creek PECO Pigeon Ranch Unit, NM | G1 | 35.568194 | −105.74930 |
| 353253105413210 | Glorieta Creek PECO NHP Main Unit, NM | G2 | 35.548000 | −105.692083 |
| 353401105400510 | Pecos Wastewater Treatment Plant Outfall, NM | PWWTP | NR | NR |
| 353227105401810 | Pecos River above Glorieta Creek, NM | P1 | 35.540722 | −105.671666 |
| 353134105394910 | Pecos River below Glorieta Creek, NM | P2 | 35.52597 | −105.66369 |
The Edwards Aquifer Research and Data Center (EARDC) reported that in the early 1980s through the early 1990s, the Pecos River Basin had relatively good water quality conditions (Porter and Longley, 2009). However, the portions of the Pecos River and Glorieta Creek in PECO are listed on the 2022 State of New Mexico §303(d) List of Impaired Surface Waters (New Mexico Environment Department Surface Water Quality Bureau [NMEDSWQB], 2022). The Pecos River within the park boundaries is listed as impaired for temperature and dissolved oxygen for high-quality cold-water use, and Glorieta Creek within the park boundaries is listed for nutrients and specific conductance exceedances for high-quality cold-water use.
The southwestern United States is in a prolonged period of drought with consistently warm and dry conditions (Mankin and others, 2021). Because of this drought, the wastewater effluent is becoming a larger and more consistent component of the water resources. Two wastewater treatment plant (WWTP) facilities are located upgradient from water resources in PECO (fig. 2). According to the National Pollutant Discharge Elimination System permits, the Glorieta WWTP (GWWTP) discharges an average of 0.0265 million gallon per day to Glorieta Creek (U.S. Environmental Protection Agency [EPA], 2018). The WWTP for the Village of Pecos, N. Mex., (PWWTP) discharges an average of 0.56 million gallons per day to the Pecos River (EPA, 2022). The discharge from the PWWTP was not constant at the outflow like the GWWTP outfall. This discharge variability from the PWWTP could be due to the plant operations, demand on the system, or possibly rainfall infiltration in the system. When the discharge was low, a standing pool of effluent was adjacent to the Pecos River. However, during higher flows in the Pecos River, the river overflowed in the area where the effluent is discharged. In Glorieta Creek, no flow was observed upgradient from the WWTP during the dry period.
Historically, annual precipitation ranged from 16 to 20 inches, and the mean air temperature ranged from −9.4 degrees Celsius (°C) to 25 °C in the winter months and summer months, respectively (Porter and Longley, 2009). The winter precipitation totals for late 2017 and early 2018 were some of the lowest on record (90 years) and resulted in historically low discharge values at the USGS Pecos River near Pecos, N. Mex., streamgage (USGS station no. 08378500; hereinafter referred to as the Pecos River streamgage) in late April through June which is typically the period of high flows at the site following snowmelt runoff. In 2020, even following an average winter precipitation season, the flows in the river decreased sharply and resulted in another summer of below-normal flow. Similar low-flow events occurred in 1981, 2002, 2006, and 2020. However, the low snowmelt runoff in 2018 is the most extreme on record, with the majority of the discharge during that time period measured within the tenth percentile.
During the synoptic sampling for this study (February to October 2022), the discharge measured at the Pecos River streamgage was generally below historical averages, except for discharge during July through September, when high flows resulted from frequent monsoon precipitation (fig. 3; USGS, 2023). Also, from early April through mid-August in 2022, the largest fire in New Mexico history, the Hermit’s Peak/Calf Canyon Fire, burned in the watershed above the Pecos Headwaters watershed as well as in the northeastern part of the Pecos Headwaters watershed (fig. 1). PECO staff witnessed the water in the Pecos River flowing with a gray color and noted black ash deposits on the banks of the river in July 2022 (E. Lassance, National Park Service, oral commun., 2022).
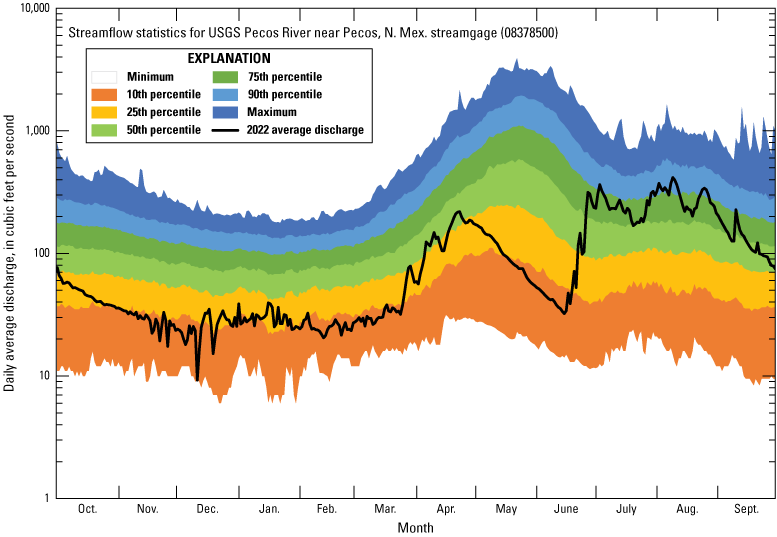
Streamflow statistics for the U.S. Geological Survey (USGS) Pecos River near Pecos, N. Mex., streamgage (USGS station no. 08378500) (USGS, 2023).
The sampling sites were not colocated with USGS streamgages; however, the Pecos River near Pecos, N. Mex., streamgage (USGS station no. 08378500) is located about 15 miles upstream from site P1 (table 1), and discharge data from that streamgage were used as a reference for the two sampling sites on the Pecos River (P1 and P2). Discharge measurements taken at P1 and P2 were comparable to those from the Pecos River streamgage (table 2). The water quality samples for this study were collected during times of varying discharge at the Pecos River streamgage (fig. 4). The February sample was collected at low flow; the May sample was collected during a decrease in discharge after snowmelt runoff; the August sample was collected during high flow from the monsoon season; and the October sample was collected during decreasing discharge but not as low as that measured during the winter months (fig. 4). When the discharge was higher, the differences between the reported Pecos River streamgage discharge data and P2 measured discharge were larger. This is not surprising because the flow changes more rapidly during higher flows, and changes in discharge amounts between an upstream and downstream site could be delayed.
Table 2.
Discharge at Pecos River sampling sites within Pecos National Historical Park compared with discharge at the Pecos River near Pecos, N. Mex., streamgage (USGS station no. 08378500), February–October 2022 (USGS, 2023).[Dates are in month/day/year format; ft3/s, cubic feet per second; no., number; USGS, U.S. Geological Survey]
| Sample date | Site (table 1; fig. 2) | Total discharge at sampling location (ft3/s) | USGS station no. 08378500 daily discharge (ft3/s) | USGS station no. 08378500 instantaneous discharge (ft3/s) | Difference between total discharge at sampling location and daily discharge at USGS station no. 08378500 (percent) |
|---|---|---|---|---|---|
| 2/1/2022 | P1 | 24.7 | 24.2 | 28.30 | 2.0 |
| 5/10/222 | P2 | 117 | 131 | 127.14 | 11.3 |
| 10/25/2022 | P2 | 112 | 109 | 105.41 | 2.7 |
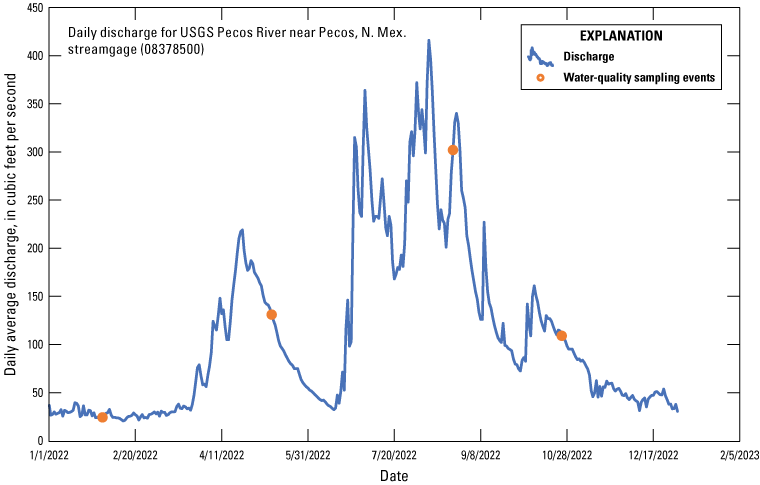
Discharge at the Pecos River near Pecos, N. Mex., streamgage (USGS station no. 08378500) in 2022 (USGS, 2023).
During each sampling event except for the one in August, Glorieta Creek was dry above where the GWWTP effluent flows into the creek. At the G1 and G2 sampling locations, the flow was very slow (less than 1.5 feet per second). At the G1 sampling location, the active stream channel was about 5 feet wide and had filamentous algae. The G2 site has a low gradient which creates a larger stream channel and more of a wetland environment than at the G1 site. Along with algae, submerged aquatic vegetation was growing in the creek at the G2 location.
Previous Studies
Water quality samples have been collected from Glorieta Creek and the Pecos River in PECO in the past. Relatively good water quality conditions were observed in the Pecos River Basin during the early 1980s through the early 1990s (Porter and Longley, 2009). The EARDC compiled 15 years of water quality field data collected during 1994–2009 into a comprehensive report (Porter and Longley, 2009). Two locations on the Pecos River and one location on Glorieta Creek presented in the EARDC report are similar to the sampling locations in the current study: Site A, upstream from the Glorieta confluence, is slightly downstream from USGS sampling location P1; Site C is slightly downstream from USGS sampling location P2; and Site B is downstream from USGS sampling location G2, and both sites are before the confluence with the Pecos River (table 3; fig. 2). The data summarized in the EARDC report include water temperature, specific conductance, pH, and dissolved oxygen.
Table 3.
Site information from previously published reports and their correlation to sites sampled in the current (2022) Pecos National Historical Park study area.[ID, identification; USGS, U.S. Geological Survey]
| Historical site ID (fig. 2) |
Reference | Closest USGS site (fig. 2) |
Latitude (decimal degrees) |
Longitude (decimal degrees) |
|---|---|---|---|---|
| Site A | Porter and Longley, 2009 | P1 | 35.537398 | −105.669917 |
| Site B | G2 | 35.534918 | −105.671273 | |
| Site C | P2 | 35.524450 | −105.661037 | |
| G2a | Jacobi and Jacobi, 1998 | G1 | 35.571444 | −105.754917 |
| G4 | G2 | 35.563611 | −105.695278 | |
| P3 | P1 | 35.537420 | −105.668722 | |
| P4 | P2 | 35.532111 | −105.667806 |
The EARDC study reported that water temperature in the Pecos River increased from 1994 to 2002 and decreased from 2003 to 2009 (Porter and Longley, 2009). Median water temperature from all the study sites in Glorieta Creek was higher than that measured at the Pecos River sites (table 4). Specific conductance was relatively stable at Sites A and C in the Pecos River from 1994 to 2009; however, specific conductance in Glorieta Creek showed an upward trend. The median concentration values of specific conductance in Glorieta Creek were more than three times higher than the median values recorded in the Pecos River. This resulted in the specific conductance exceeding the New Mexico Surface Water Quality Standard of 300 microsiemens per centimeter at 25 degrees Celsius (µS/cm at 25 °C) in 98 percent of the observations at Site B in Glorieta Creek. Median pH values ranged from 8.10 to 8.30 with no significant trends observed at the sites. Dissolved oxygen concentration was relatively constant from 1994 to 2009 in the Pecos River, however, dissolved oxygen concentrations at the sampling location in Glorieta Creek decreased since about 2000 when below-average streamflow was observed. The median dissolved oxygen concentration ranged from 8.7 milligrams per liter (mg/L) at sampling locations in Glorieta Creek to 9.8 mg/L in the Pecos River (table 4). A small percentage of the dissolved oxygen concentrations did not meet the New Mexico water quality criterion of 6 mg/L or more (Porter and Longley, 2009).
Table 4.
Median and range of water-quality parameter data from Porter and Longley (2009) and from the current (2022) study (USGS, 2023) in the area of Pecos National Historical Park, New Mexico.[USGS, U.S. Geological Survey; °C, degree Celsius; µS/cm at 25 °C, microsiemens per centimeter at 25 degrees Celsius; mg/L, milligrams per liter]
| Site name (fig. 2) |
Water temperature (°C) | Specific conductance (µS/cm at 25 °C) | pH (standard units) | Dissolved oxygen (mg/L) | ||||
|---|---|---|---|---|---|---|---|---|
| Median | Range | Median | Range | Median | Range | Median | Range | |
| P11 | 11.5 | 3.1–13.1 | 157 | 121–192 | 7.75 | 7.2–8.1 | 9.0 | 8.6–11.1 |
| Site A2 | 8.4 | 0.1–22.8 | 218 | 100–415 | 8.30 | 6.6–9.0 | 9.8 | 5.6–20.7 |
| P21 | 13.7 | 6.4–15.0 | 162 | 120–181 | 8.00 | 7.8–8.3 | 8.5 | 8.2–10.8 |
| Site C2 | 8.7 | 0.2–23.5 | 226 | 100–880 | 8.20 | 6.5–9.0 | 9.4 | 5.3–15.0 |
| G21 | 11.3 | 1.8–17.9 | 946 | 624–997 | 7.50 | 7.4–7.7 | 4.8 | 4.5–6.5 |
| Site B2 | 12.9 | 0.5–29.1 | 755 | 180–1,396 | 8.10 | 6.6–9.0 | 8.7 | 3.4–8.8 |
USGS site (short name; see table 1).
Site from the Porter and Longley (2009) study.
An additional study was conducted between March 1995 and March 1997 to assess the existing water quality, identify sources of water quality degradation, and establish a baseline and cost-effective protocol for continuing water quality monitoring. These results were summarized and described in “Water Quality Assessment of the Pecos River and Glorieta Creek, Pecos National Historic Park, New Mexico (March 1995 to March 1997)” (Jacobi and Jacobi, 1998). Jacobi and Jacobi reported that the quality of the water in the Pecos River would be categorized as able to support a high-quality cold-water fishery, according to New Mexico Surface Water Quality Standards. However, Glorieta Creek does not meet that standard because contaminants, low oxygen, and turbidity prevent the creek from supporting high-quality cold-water macroinvertebrates that are a vital food source for fish (Jacobi and Jacobi, 1998).
In addition to field parameters, Jacobi and Jacobi (1998) analyzed water samples for nutrients, major ions, bacteria, and benthic invertebrates. In their 1995–97 report, sites G2a, G4, P3, and P4 are each located near the USGS sites used during this study: G1, G2, P1, and P2, respectively (table 3; fig. 2) (Jacobi and Jacobi, 1998).
Generally, nutrient concentrations measured at all Pecos River sites were lower than the concentrations at the Glorieta Creek sites downstream from the GWWTP. All the locations on the Pecos River and the sampling location above the GWWTP had total phosphorus concentrations below the detection limit of 0.09 mg/L. However, the total phosphorus concentration was higher at the sampling location downstream from the GWWTP, and those concentrations decreased as Glorieta Creek flowed downstream. On the Pecos River, the ammonia-nitrogen concentrations were below the detection limit of 0.1 mg/L. The sampling location on Glorieta Creek directly downstream from the GWWTP had substantially higher ammonia as nitrogen concentrations than any of the other locations, likely due to municipal effluent. This sampling location, along with the downstream sampling location on Glorieta Creek, had substantially higher concentrations of nitrate plus nitrite as nitrogen than the other locations; the other sampling locations either had low or no detections of nitrate plus nitrite as nitrogen (Jacobi and Jacobi, 1998).
In this 1995–97 study (Jacobi and Jacobi, 1998), the major ions were measured, and generally, the anions were substantially higher at the Glorieta Creek sampling locations than at the Pecos River locations. For the cations, all locations on Glorieta Creek except for the site above the GWWTP had substantially higher concentrations than the sampling locations in the Pecos River. At sampling locations in the Pecos River, the concentrations of dissolved constituents increased as the sampling locations moved downstream (Jacobi and Jacobi, 1998).
Currently (2023), the New Mexico Environment Department assesses and lists impaired waters in New Mexico every 2 years based on segments of surface water (NMEDSWQB, 2022). The reach of Glorieta Creek from the GWWTP to the perennial portion of the Pecos River was listed on the State of New Mexico Clean Water Act 303(d)/305(b) integrated list in 2004 for specific conductance and in 2012 for nutrient/eutrophication with source unknown (New Mexico Environment Department, 2016). The Pecos River within the park boundaries was listed as impaired for temperature to support high-quality cold-water macroinvertebrates in 2004, and has previously been listed for turbidity (NMEDSWQB, 2022)
Although these historical studies provide background information to put our results into context, sampling occurred 13 or more years ago, and samples were collected infrequently. The historical studies also provided limited information on levels of nutrients, bacteria, and per- and polyfluoroalkyl substances (PFAS). PFAS compounds are commonly detected in wastewater effluent, including throughout New Mexico (USGS, 2023).
Methods
From February 2022 to October 2022, four water quality sampling events occurred using discrete methods at two WWTPs outfalls, two locations on Glorieta Creek, and two locations on the Pecos River (fig. 2). This section describes the field, analytical, and data analysis methods used for collection and analysis of water samples. Water quality data are publicly available from the USGS National Water Information System (USGS, 2023) by using the station numbers listed in table 1 and are summarized in appendix 1.
Field Methods
All discrete samples were collected by USGS personnel using standard field methods from the USGS National Field Manual (USGS, variously dated). The field parameters pH, water temperature, specific conductance, dissolved oxygen, turbidity, and barometric pressure were measured onsite directly before water samples were collected. Samples were collected by either using isokinetic equal-width-increment sampling methods or by grab sampling for average velocities less than 1.5 feet per second. For analysis of major ions, trace and rare earth elements, and nutrients, a Teflon sample bottle, Teflon nozzle, and Teflon churn were used for sampling. For the analysis of PFAS compounds, a polycarbonate sample bottle, Delrin nozzle, and a polycarbonate churn (equipment was cleaned with liquinox, tap water, 5 percent hydrochloric acid, deionized water, methanol, and Optima blank water) were used. While collecting the sample for PFAS analysis, personnel wore elbow-length polyethene gloves and nitrile gloves over the polyethylene gloves.
If equal-width-increment sampling was performed, the appropriate sample bottle and nozzle were used to collect samples across the cross section to composite into a churn for analysis. If the grab method was used for sampling, the appropriate sample bottle was dipped into the stream several times to collect enough water for analysis and then composited into the churn. If the grab sampling method was used to collect a sample for PFAS analysis, the PFAS sample bottle was dipped directly into the stream.
Water samples collected by either sampling method were processed by using C-flex tubing and were filtered (0.45-micrometer pore size) for major ions, trace elements, nutrients, and alkalinity. Samples for analysis of bacteria were always collected with a single grab sample in a 1-liter wide-mouth polyethylene bottle that had been cleaned with liquinox, tap water, and deionized water and autoclaved.
Analytical Methods
Samples were analyzed for nutrients at the USGS National Water Quality Laboratory in Lakewood, Colo. Samples were analyzed for major ions, trace elements, and rare-earth elements at the USGS Integrated Water Chemistry Assessment Laboratory in Boulder, Colo., using methods from Garbarino and Taylor (1979, 1996) and Taylor (2001). The precision for all methods analyzed by the USGS Integrated Water Chemistry Assessment Laboratory was 4 percent or better depending on the element. Samples were analyzed for PFAS compounds at SGS North America Inc. in Orlando, Fla., by using EPA modified 537.1 method (Shoemaker and Tettenhorst, 2020).
The samples collected for bacteria were analyzed by the USGS staff within 24 hours of sample collection using the colilert method and following manufacturer’s instructions (Standard Methods Committee of the American Public Health Association, American Water Works Association, and Water Environment Federation, 2022; USGS, variously dated). The colilert method reported results as most probable number per 100 milliliters, which has a 1:1 relation to results reported in colony-forming units per 100 milliliters, a common reporting unit for water quality standards (Noble and others, 2004).
Data Analysis Methods
Nonmetric multidimensional scaling (NMDS) was used to reduce the complex data structure (many samples and many elements) to represent the pairwise dissimilarity between objects in a low-dimensional space (Clarke and others, 2014, p. 5–6). U-scores of the data were computed by using the “uscore” function for R (R Core Team, 2023) from Julian and Helsel (2023) with default values to calculate the ranks of the scores (Helsel, 2012; Julian and Helsel, 2023). NMDS was performed on the U-scores by using metaMDS from the vegan package in R (Oksanen and others, 2022) and by using Euclidean distance, where zerodist = add and where autotransform = false (Helsel, 2012). NMDS stress values ≤0.1 are considered fair with good ordination and no real prospect of misleading interpretation; values ≤0.05 indicate good fit, and values ≥0.2 are deemed suspect (Clarke and others, 2014, p. 5–6).
A cluster analysis was completed to identify similar groups of samples by evaluating minimum differences within groups and maximum differences among groups by using the “hclust” function with Euclidian distance matrix for the elements used in the NMDS analysis. The Calinski-Harabasz criterion was applied with the “cascadeKM” function of the vegan package in R (Oksanen and others, 2022) to determine the number of clusters that maximizes the difference between clusters while minimizing the differences within clusters.
For this study, aqueous concentrations of rare earth elements (REEs) were normalized to the North American shale composite (NASC) (Gromet and others, 1984; Piper and Bau, 2013). A positive gadolinium (Gd) anomaly, which is related to the use of Gd-based contrast agents in magnetic resonance imaging (MRI), has been observed worldwide as a distinctive signature of water inputs from WWTPs in areas with MRI facilities (Bau and Dulski, 1996; Verplanck and others, 2005; Rabiet and others, 2009). A Gd anomaly is determined by assessing the relative difference between Gd and nearby REEs after normalization. REE anomalies, including a Gd anomaly, were calculated by using the following equations.
whereREE
is the REE concentration normalized to the NASC, in micrograms per liter, and
n
represents the sequential number of the REE in order of the lanthanide series (modified from Alibo and Nozaki, 1999).
Nd
is neodymium concentration, in micrograms per liter, normalized to the NASC (modified from equation 13 in Rétif and others, 2023), and
Dy
is dysprosium concentration, in micrograms per liter, normalized to the NASC (modified from equation 13 in Rétif and others, 2023).
Sm
is samarium concentration, in micrograms per liter, normalized to the NASC (modified from equation 2 in Garcia-Solsona and others, 2014), and
Dy
is dysprosium concentration, in micrograms per liter, normalized to the NASC (modified from equation 2 in Garcia-Solsona and others, 2014).
Quality Assurance Procedures
Quality control and assurance samples consisted of one field blank for PFAS to ensure the field collection methods and field environment did not introduce contamination into the sampling process, and one replicate to determine the variability in the sample collection process and laboratory methods for PFAS, nutrients, and bacteria. The field blank was collected as described in the USGS National Field Manual (USGS, variously dated) with certified organic and PFAS-free water (Optima). The replicate was collected concurrently, also by using the methods outlined in the USGS National Field Manual (USGS, variously dated).
Water Quality Standards Used for Comparison
The New Mexico Water Quality Standard (NMWQS) 20.6.4.217 (New Mexico Water Quality Control Commission, 2010) designates the Pecos River and Glorieta Creek in the study area for the following uses: domestic water supply, fish culture, high quality cold-water aquatic life, irrigation, livestock watering, wildlife habitat and primary contact, and public water supply. The water quality standards defined in 20.6.900 of the New Mexico Administrative Code for the study area specifies that the specific conductance should be 300 µS/cm or less and the monthly geometric mean of Escherichia coli bacteria should be 126 colony forming units per 100 milliliters (cfu/100 mL) or less or a single sample should have 235 cfu/100 mL or less. Specifically for high quality cold-water use, water quality parameters should be within the following limits: dissolved oxygen, at least 6.0 mg/L; maximum water temperature, 20 °C for four or more consecutive hours in a 24-hour period on more than 3 consecutive days; maximum water temperature, 23 °C; pH, 6.6 to 8.8; and specific conductance, less than 300 µS/cm. (New Mexico Water Quality Control Commission, 2010).
Concentrations of constituents detected in water samples were compared with EPA water-quality standards for drinking water and aquatic life (tables 5 and 6; EPA, 2023a, b). Aquatic-life standards are based on site-specific water-quality values to which the standards are adjusted. Standards for cadmium, chromium, lead, nickel, and zinc were calculated based on hardness values (EPA, 2023b). Copper standards were calculated by using the biotic ligand model, which incorporates water temperature, pH, dissolved organic carbon, humic acid, calcium, magnesium, sodium, potassium, sulfate, chlorine, alkalinity, and sulfite (EPA, 2007). Dissolved organic carbon was not measured during this study, so an average value of 0.4 mg/L was used, based on four samples collected in 2020 and 2021 from the Pecos River near Puerto de Luna (USGS, 2023). Humic acid fraction of dissolved organic carbon also was not measured during the study, so the default value of 10 percent was used. Sulfite was not measured during the study, and water samples had dissolved oxygen; therefore, a small value of 0.01 mg/L was assumed for all samples.
Table 5.
Water-quality standards for drinking water and aquatic life from U.S. Environmental Protection Agency (EPA, 2007, 2023b).[Values are in micrograms per liter; NA, not available; MCL, maximum contaminant level; CMC, criterion maximum concentration (acute); CCC, criterion continuous concentration (chronic)]
Calculated based on hardness (see table 6).
Selenium speciation was needed but was not analyzed for during this study. Additionally, traditional methods for predicting effects based on direct exposure to dissolved concentrations are not appropriate for Se (Chapman and others, 2009).
Table 6.
Sample-specific water-quality standard values for aquatic life in Pecos National Historical Park, 2022.[Aquatic life water standards for freshwater are in micrograms per liter (µg/L); hardness in mg/L, milligrams per liter as calcium carbonate; NA, not available; CMC, criterion maximum concentration (acute); CCC, criterion continuous concentration (chronic)]
Calculated based on hardness (eqs. in EPA, 2023b, appendix B).
Calculated using the biotic ligand model (EPA, 2007).
Aqueous Chemistry
Water-Quality Parameters
Water-quality parameters including water temperature, specific conductance, dissolved oxygen, pH, and turbidity were measured at each of the six sites during the four sampling events (fig. 5). Water temperatures ranged from 1.4 to 18.5 °C, with PWWTP having the highest median water temperature, and G1, G2, and P1 having the lowest median water temperatures. Historically, as reported in the EADRC comprehensive report, the lowest median water temperature was observed on the Pecos River (table 4) (Porter and Longley, 2009). The EADRC report includes data for 15 years and therefore covered a variety of conditions compared to the four samples collected during a single year at each site for this study.
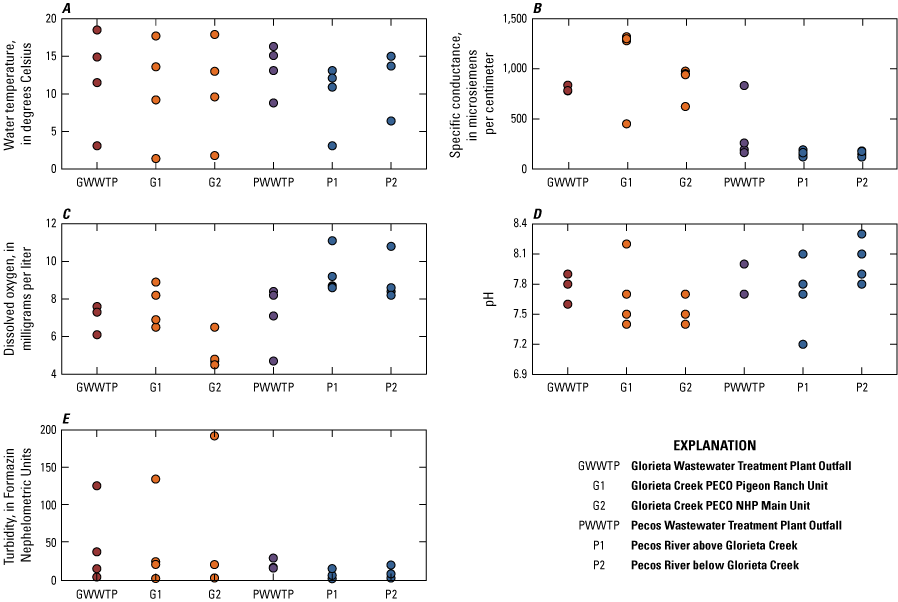
Water-quality parameter data collected during water-quality sampling events within Pecos National Historical Park, New Mexico, February–October 2022.
Specific conductance ranged from 120 to 1,320 µS/cm, with G1 having the highest median specific conductance (1,290 µS/cm); the other sites on Glorieta Creek had slightly lower values (fig. 5B). Median specific conductance values were lower for the Pecos River sites than for the Glorieta sites, with medians of about 160 µS/cm for P1 and P2. Specific conductance values in all samples collected from Glorieta Creek and PWWTP during February 2022 exceeded the State’s water quality standard for specific conductance of 300 µS/cm or less (New Mexico Water Quality Control Commission, 2010). The pattern of higher specific conductance values at sites on Glorieta Creek than at sites on the Pecos River is also indicated in the historical data (table 4) (Porter and Longley, 2009).
Dissolved oxygen values ranged from 4.5 to 11.1 mg/L (fig. 5C). G2 had the lowest median value (4.75 mg/L). The area near G2 was often found to be stagnant during sampling, and this value of 4.75 mg/L is much lower than the historical median value of Site B from the EADRC report (table 4) (Porter and Longley, 2009). For the current study, all concentrations of dissolved oxygen met the standard for high-quality cold-water-use, except for the concentrations measured in samples collected at G2 during February, August, and October and the sample collected at PWWTP in February (New Mexico Water Quality Control Commission, 2010).
The pH values were fairly consistent across the sites, with G2 having the lowest median pH value (7.5) and P2 having the highest median pH value (8.0) (fig. 5D). The pH values were within the limits of 6.6 to 8.8 and therefore met the State’s water quality standard. Historical maximum pH values were greater than the State’s water quality standards, but the median pH values were within the limits (table 4) (Porter and Longley, 2009; New Mexico Water Quality Control Commission, 2010).
Turbidity values varied among sites, with generally higher values at the Glorieta Creek sites relative to the Pecos River sites (fig. 5E). The lowest median turbidity value was 4.7 Formazin Nephelometric Units (FNU) at P1, and the highest median turbidity value was 25.0 FNU at GWWTP.
Major Ions, Trace Elements, and Rare Earth Elements
Major ions (bicarbonate, calcium, chloride, fluoride, magnesium, sodium, potassium, and sulfate) dissolve into water because of water/rock interactions and contributions from anthropogenic sources such as urban runoff and surrounding agriculture. The proportion of the ions provides a distinguishable signature of water that can be visualized on a Piper diagram (fig. 6). Water samples from the Pecos River all had a similar water signature of calcium-bicarbonate type, indicating a well-mixed source with water dissolving the limestone rock. Water samples from Glorieta Creek had a higher proportion of sodium, chloride, and sulfate than the samples from the Pecos River, indicating a mixed calcium-sodium-bicarbonate type water. Two samples collected in February and May from G1, however, had a mixed-anion type water. Glorieta Creek’s main water type indicates a contribution of older groundwater (water that has entered the subsurface as precipitation and has been moving through the ground for a number of years interacting with subsurface materials and dissolving ions—note chemical tracers can be used to quantify groundwater age, but was not done as part of this study) that has undergone cation exchange to replace sodium for calcium or contributions from water interactions with evaporites or septic systems with the addition of sodium and chloride. Glorieta Creek waters may also represent a contribution of groundwater with some gypsum dissolution due to the addition of sulfate.
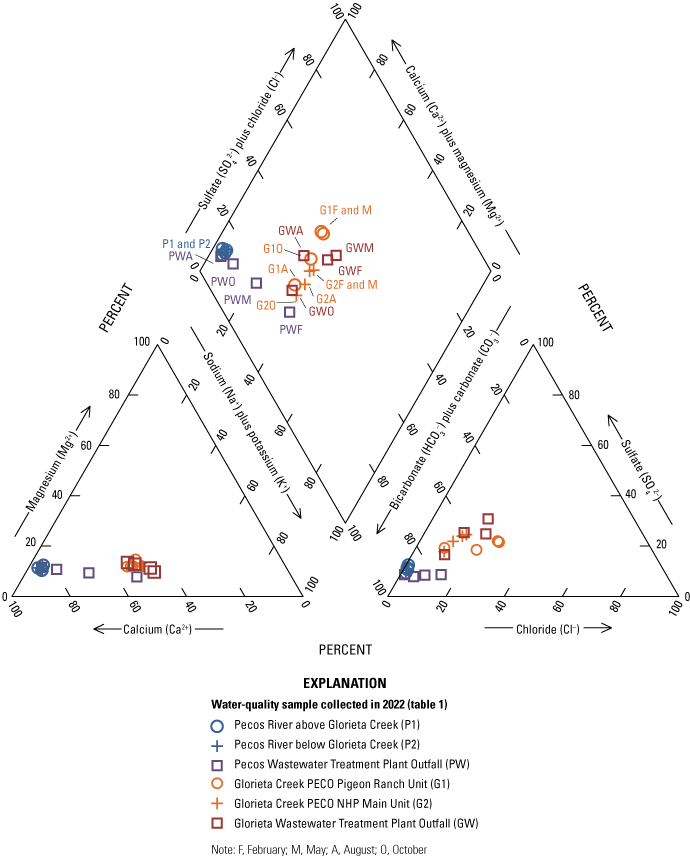
Major ion composition of water samples collected during water quality sampling events within Pecos National Historical Park, New Mexico, February–October 2022.
WWTP effluent represents the chemistry of the water’s use prior to wastewater treatment as well as changes undergone during the treatment process. Groundwater used at the Glorieta Conference Center then treated at the GWWTP is likely similar to the groundwater that supplies water to Glorieta Creek, but additional samples of groundwater and groundwater-level elevations in the area would be needed to understand the groundwater chemistry and groundwater/surface-water interactions in the area.
PWWTP effluent is also similar to Pecos River water, especially for samples collected when the Pecos River discharge was high (fig. 4) and when backwater from the river was present at the effluent discharge location (May, August, and October). The high flows on the Pecos River may have induced the flow of water from the river into the local groundwater system as recharge and may also cause a change in the chemistry of the groundwater used in the water-supply system of Village of Pecos; however, the influence could depend on the depth and screened intervals of the wells pulling groundwater for the water supply. Investigation of that connection is beyond the scope of this study. The chemical signature of the sample collected at the PWWTP in February is likely representative of the groundwater used in the water-supply system that feeds the treatment plant. In February, the Pecos River level was low, and therefore this sample at the PWWTP likely represents more of a source water signature of groundwater used in the distribution system that feeds the treatment plant.
None of the concentrations of trace elements in surface-water samples exceeded drinking water standards. Copper concentrations in only two samples from G2 exceeded aquatic life standards. In May, the copper concentration of 4.8 µg/L exceeded the chronic criterion continuous concentration (CCC) aquatic life standard of 3.14 micrograms per liter (µg/L), and in October, the copper concentration of 4.4 µg/L exceeded the chronic CCC aquatic life standard of 2.56 µg/L and the acute criteria maximum concentration aquatic life standard of 4.12 µg/L (table 6). Aquatic life standards for copper are based on several other water quality parameters, some of which were not measured directly and serve as an estimate of the aquatic life risk. Concentrations of several elements (antimony, arsenic, barium, boron, cadmium, cobalt, copper, lithium, manganese, molybdenum, nickel, strontium, tin, uranium, and vanadium) were higher in samples from Glorieta Creek compared with concentrations in samples from the Pecos River (appendix 1). WWTP effluents also had higher trace element concentrations (boron, bismuth, copper, lead, nickel, phosphorus, rubidium, tin, and zinc) that may represent contributions from anthropogenic sources or from some elements that are elevated in the source groundwater used in the distribution systems feeding the WWTPs. The concentration of phosphorous was also higher in the WWTP effluent compared to concentrations in the surface waters of Glorieta Creek and the Pecos River.
To assess the relation of the numerous trace elements that showed distinct chemical signatures between samples, multivariate statistical analysis was conducted on the data. The following trace elements were included in the NMDS analysis: antimony, arsenic, barium, bismuth, boron, cadmium, cobalt, copper, lead, lithium, manganese, molybdenum, nickel, phosphorus, strontium, rubidium, tin, uranium, vanadium, and zinc. The NMDS had a stress of 0.08, indicating a fair fit with no real prospect for misleading interpretation, and was close to the 0.05 threshold for good fit (Clarke and others, 2014, p. 5–6). Generally, the samples from the Pecos River were distinct from the samples from Glorieta Creek on the primary NMDS axis (fig. 7). WWTP effluent samples generally were distinct from the surface-water samples on the secondary NMDS axis. Samples collected during August from both Glorieta Creek sites were more similar to the GWWTP effluent samples compared to samples collected from the sites during the other 3 months. PFAS analysis from that sampling event also shows the highest concentrations and most compounds present at the Glorieta Creek sites in August. The presence of higher PFAS concentrations as well as trace element anomalies are similar to WWTP effluent samples, indicating that a component of water in Glorieta Creek could have been derived from anthropogenic activities during the August 2022 sampling event.
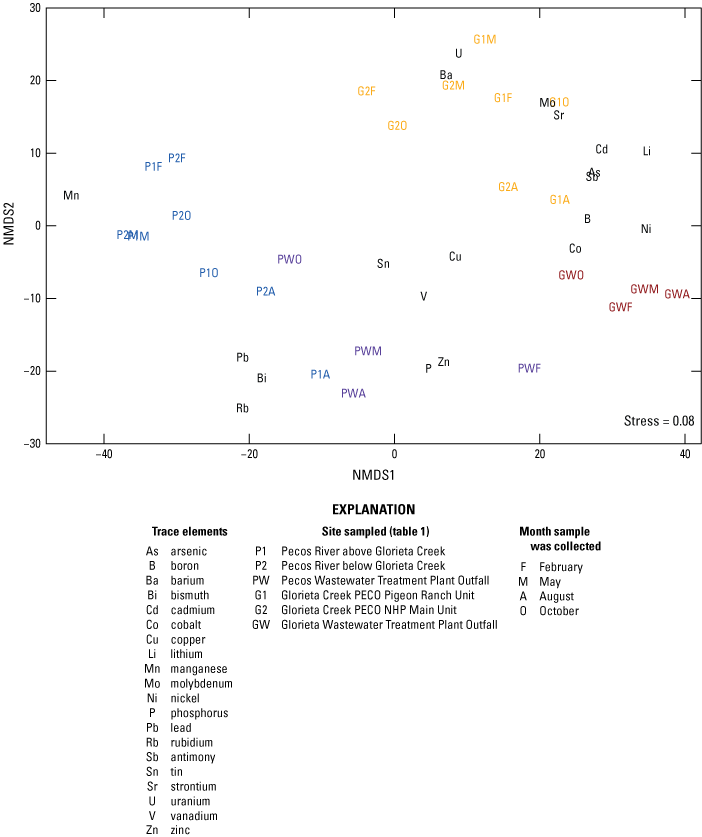
Nonmetric multidimensional scaling (NMDS) analysis results for water samples collected within Pecos National Historical Park, New Mexico, February–October 2022.
During the NMDS analysis, a cluster analysis was computed for samples and constituents to understand groupings of samples based on trace elements. The Calinski-Harabasz criterion indicates four significant groups for the dataset (fig. 8). The cluster analysis separates Glorieta Creek samples into one group; GWWTP samples and the PWWTP sample from February into a second group; Pecos River samples from February, May, and October into a third group; and PWWTP samples from May, August, and October and the Pecos River samples from August into a fourth group (fig. 8). The PWWTP effluent discharge location was inundated by Pecos River water during the May, August, and October sampling events and may represent a mixture of waters rather than the true effluent concentrations.
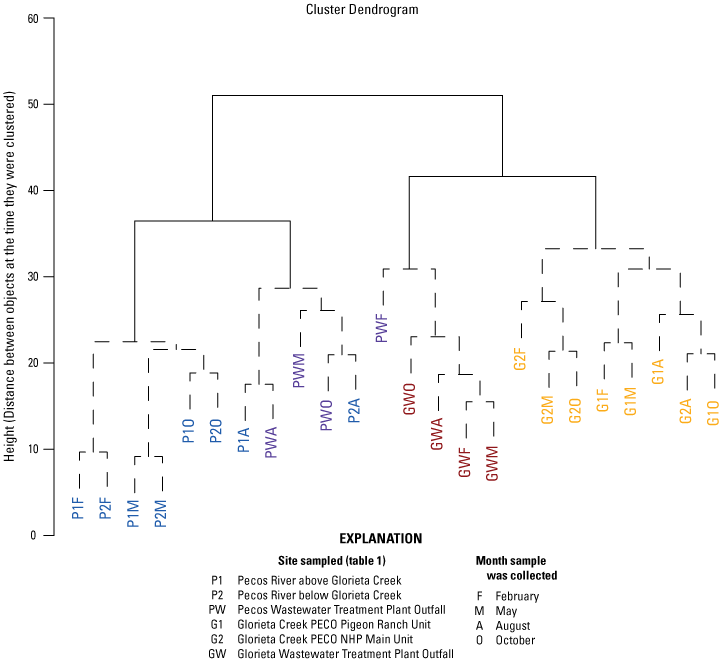
Cluster analysis results for water samples collected within Pecos National Historical Park, New Mexico, February–October 2022.
REEs provide information regarding different sources of water as well as anthropogenic influence. A Gd anomaly related to wastewater will tend toward greater concentration resulting in a graphical peak height, in contrast to other nearby REEs. Multiple equations used to calculate Gd anomalies are summarized by Rétif and others (2023) and were used in this study to assess the robustness of the Gd anomaly relative to various nearby REEs. Only samples from WWTP effluent had Gd anomaly values greater than 1 (table 7) The sample from the PWWTP collected in February had a Gd anomaly when calculated with each method, and the sample collected in May had a Gd anomaly when calculated with two of the methods (table 7). The other samples from the PWWTP were similar to samples from the Pecos River (fig. 9), likely because of the high river discharge that resulted in the inundation of the effluent release area. The samples collected from the GWWTP in May had Gd anomalies when calculated with each method, and samples collected in February and October had a Gd anomaly when calculated with two of the methods; however, the sample collected in August did not have an anomaly (table 7; fig. 9).
Table 7.
Rare earth element anomaly values calculated for wastewater treatment plant effluent samples collected near the Pecos National Historical Park study area, 2022.[Gd, gadolinium; Values greater than 1 indicate a positive anomaly]
| Sample | Gd anomalya | Gd anomalyb | Gd anomalyc |
|---|---|---|---|
| February | 6 | 15 | 15 |
| May | 1 | 2 | 2 |
| August | 1 | 1 | 1 |
| October | 1 | 1 | 1 |
| February | 1 | 5 | 4 |
| May | 2 | 28 | 24 |
| August | 1 | 1 | 1 |
| October | 0 | 2 | 2 |
Calculated by using equation 1.
Calculated by using equation 2.
Calculated by using equation 3.
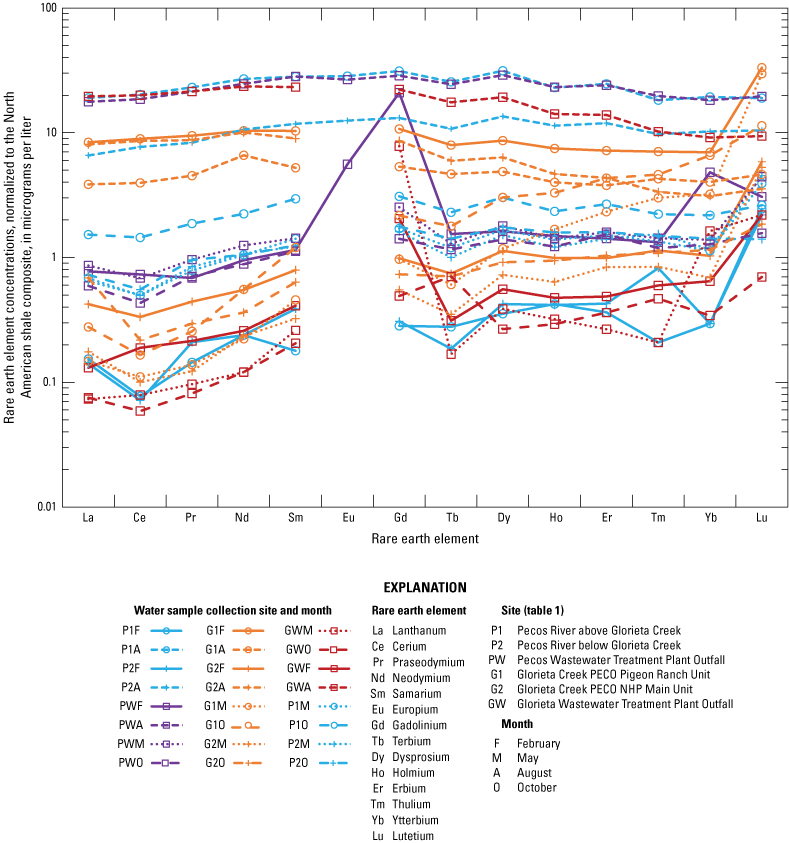
Rare earth elements normalized to the North American shale composite (NASC; Gromet and others, 1984; Piper and Bau, 2013) for water samples collected within Pecos National Historical Park, New Mexico, February–October 2022.
At the time of this study, MRI facilities in New Mexico were only located in Albuquerque and Roswell, so people in the contribution area for the Village of Pecos and Glorieta WWTPs would need to have travelled to an MRI facility then back in a short period of time in order for that to be the source of Gd in the samples. There is evidence that periodic contribution of elevated Gd occurs at both WWTPs, but it may be highly variable and may be best as supporting evidence of wastewater contribution in addition to other wastewater tracers. Gd anomalies were not observed in the Pecos River and Glorieta Creek samples downstream from the WWTP effluent discharge, but they may occur periodically. Additional sampling could help characterize Gd input to the water resources in the study area. Most samples had elevated europium concentrations compared to other REE and only four samples—PWWTP from February and August and Pecos River P1 and P2 from August—had values similar to other REE. The elevated europium values may be related to analytical interference with barium and were removed from the graph (fig. 9). The elevated europium concentrations resulted in lower magnitude Gd anomaly values when using equation 1, so the correspondence of Gd anomalies resulting from the use of multiple elemental comparison methods is helpful to assess which samples had strong evidence of an anomaly (table 7).
Nutrients
To understand nutrients, each sample was analyzed for nitrate, nitrite, ammonia as nitrogen, and orthophosphate as phosphorus. High levels of nutrients are harmful to humans and fish and can lead to eutrophication of rivers (Fernández-Nava and others, 2008). The National Pollutant Discharge Elimination System permits for the GWWTP and PWWTP do not specify specific standards for nutrient concentrations in plant discharge (NMEDSWQB, 2024).
The highest ammonia value was 27.9 mg/L as nitrogen at the PWWTP in February, but most samples were either near or below the detection limit of 0.02 mg/L (USGS, 2023; appendix 1). The February sample was the only sample collected for this study from the PWWTP that was not collected when backwater from the Pecos River was present. Ammonia is a common pollutant detected in effluent samples from WWTPs (Karri and others, 2018); high levels of ammonia are hazardous to aquatic organisms and toxic to fish. Ammonia was not detected in samples from P1, and ammonia was detected only in concentrations slightly greater than the reporting limit in samples from P2. In samples from G1 and G2 at Glorieta Creek, ammonia was either not detected or was only detected at low concentrations. Ammonia was detected in all samples collected at GWWTP, with concentrations ranging from 0.03 to 0.13 mg/L (USGS, 2023; appendix 1)
The EPA’s National Primary Drinking Water Regulation (NPDWR) for nitrate (measured as nitrogen) is 10 mg/L (EPA, 2023a). This standard was exceeded in all samples collected from GWWTP, with the values ranging from 34.9 mg/L in February to 14.8 mg/L in October (USGS, 2023; appendix 1). Samples from the other sites did not have any concentrations of nitrate (measured as nitrogen) that exceeded the NPDWR, and concentrations were either reported as less than the detection limit of 0.04 mg/L or less than 1 mg/L.
The EPA’s NPDWR for nitrite (measured as nitrogen) is 1 mg/L (EPA, 2023a), and no exceedances were observed in samples from any locations. The highest detection of nitrite was 0.095 mg/L at PWWTP in February. Most of the samples collected had nitrite concentrations that were less than or near the detection limit of 0.001 mg/L (USGS, 2023; appendix 1).
Every site had at least one detection of orthophosphate, but most values were close to the detection limit (0.004 mg/L). In samples from the GWWTP, however, higher concentrations of orthophosphate were detected, with a range of 2.01 to 4.57 mg/L (USGS, 2023; appendix 1).
Bacteria
Excessive fecal coliform could indicate WWTP failures or septic system failures and expose humans to pathogens and kill off fish. Fecal indicator bacteria, such as E. coli, are used to determine the presence of potential pathogens. Potential sources of fecal indicator bacteria can include leaking septic systems, WWTPs, stormwater runoff, and domestic animal and wildlife waste (EPA, 2023c). Samples from each site were analyzed for E. coli. Concentrations of E. coli were the greatest at the PWWTP effluent outfall, ranging from 1,100 to greater than 2,400 MPN/100 mL (USGS, 2023; appendix 1). Water was not flowing out of the outfall pipe at the PWWTP site when samples were collected in February, May, and August; therefore, samples were collected from a pool of water that was just below the outfall. Finer sediment and organic matter were present in the pool, making conditions favorable for bacteria, however bacterial growth in the pond was not tested during this study. The May and August samples were collected from the pool at a time when water from the Pecos River was high enough to flow into the pool and may have diluted the discharged effluent. The October sample was collected from the upstream end of the pool where effluent was flowing out of the outfall pipe into the pool.
Samples from sites on the Pecos River had lower E. coli concentrations than those from Glorieta Creek. Samples from P1 had E. coli concentrations ranging from 1 to 47 MPN/100 mL, and samples from P2 had concentrations ranging from less than 1 to 96 MPN/100 mL. The E. coli concentrations in samples collected at the GWWTP outfall were lower than concentrations in samples collected at the PWWTP. Concentrations of E. coli in samples collected at the GWWTP ranged from less than 1 to 34 MPN/100 mL. Concentrations in samples collected from Glorieta Creek ranged from less than 1 to 650 MPN/100 mL at G1 and less than 1 to 920 MPN/100 mL at G2. Generally, the highest E. coli concentrations at all of the sites, except PWWTP and P2, were detected in samples collected during August, which is also when the highest flow occurred during sampling (fig. 4). The August samples were associated with higher turbidity, which has been associated with elevated bacteria concentrations in other areas of the southwest (Paretti and others, 2019).
The NMWQS for E. coli bacteria in the study area is a monthly geometric mean of 126 cfu/100 mL or less or 235 cfu/100 mL for a single sample (New Mexico Water Quality Control Commission, 2010). Samples collected at the PWWTP effluent outfall had E. coli concentrations that exceeded the NMWQS during every sampling event. Concentrations of E. coli in samples collected from G1 and G2 in August exceeded the NMWQS.
Per- and Polyfluoroalkyl Substances (PFAS)
PFAS compounds can be harmful to human and animal health. Some examples of harmful health effects include increased risk of cancer, reduced immunity, increased chance of infertility, and negative development effects in children (EPA, 2023d). Throughout this study, 11 PFAS compounds of the 28 analyzed were detected (appendix 1). The treated wastewater effluent had the highest total PFAS concentrations. Water samples from the GWWTP had the highest total PFAS concentrations, ranging from 30.6 to 155.5 nanograms per liter (ng/L), and the largest number (10) of PFAS compounds detected: perfluorobutanoic acid (PFBA), perfluoropentanoic acid (PFPeA), perfluorohexanoic acid (PFHxA), perfluoroheptanoic acid (PFHpA), perfluorooctanoic acid (PFOA), perfluorononanoic acid (PFNA), perfluorodecanoic acid (PFDA), perfluorobutanesulfonic acid (PFBS), perfluorohexanesulfonic acid (PFHxS), and perfluorooctanesulfonic acid (PFOS) (fig. 10A). Samples from G1 consistently had detections of several PFAS compounds during all four sampling events: PFBA, PFPeA, PFHxA, PFOA, PFBS, PFHxS, and PFOS (fig. 10B). Samples from G2 had detections of PFBA, PFBS, and PFOS during the August and October sampling events (fig. 10C).
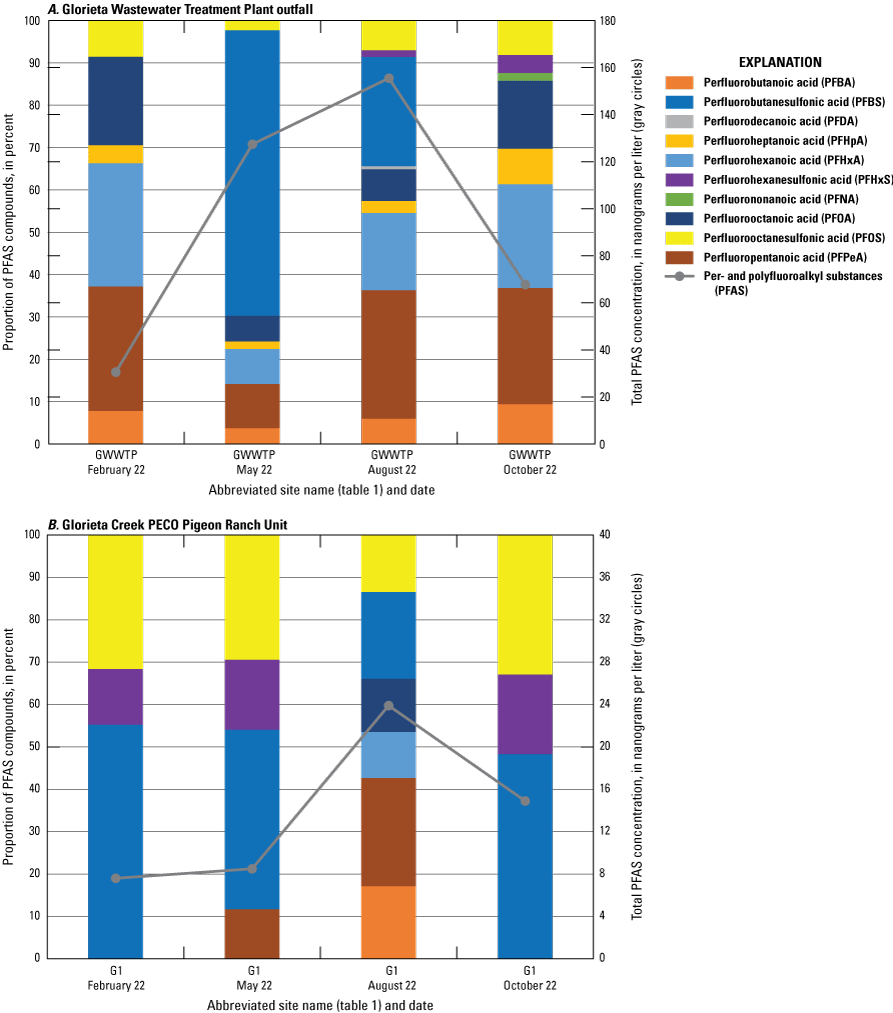

Total concentrations of per- and polyfluoroalkyl substances (PFAS) and relative proportion of PFAS from sites with concentrations detected in water samples collected within Pecos National Historical Park, New Mexico, February–October 2022: A, Glorieta Wastewater Treatment Plant Outfall; B, Glorieta Creek PECO Pigeon Ranch Unit; C, Glorieta Creek PECO NHP Main Unit; and D, Pecos Wastewater Treatment Plant Outfall.
The total PFAS concentration decreased by an order of magnitude with distance downstream along Glorieta Creek (ranging from 23.9 to 3.9 ng/L) (fig. 10), which suggests mixing with other waters in addition to the GWWTP-treated wastewater effluent. Additionally, the water from GWWTP-treated wastewater effluent infiltrates into the subsurface along Glorieta Creek upstream from G1 where the creek is often dry, which may cause sorption of some PFAS compounds to sediments and accumulation at air/water interfaces. These subsurface PFAS sediment accumulations may be remobilized by future wetting events and move PFAS compounds down Glorieta Creek periodically (Balgooyen and Remucal, 2022).
Long-chain compounds PFNA and PFDA were detected in the GWWTP-treated wastewater effluent samples collected during August and October but not in samples from G1 and G2. These two compounds have only been detected at WWTP effluent discharge locations at other sites in the Southwest, but not farther downstream (Beisner and others, 2023; USGS, 2023), which suggests some sorption or breakdown to shorter chain compounds may be occurring. PFHpA was also only detected in the GWWTP-treated wastewater effluent but not at locations downstream on Glorieta Creek. PFBS and PFOS were consistently detected in samples from Glorieta Creek sites G1 and G2, whereas detections of other compounds (PFBA, PFPeA, PFHxA, PFOA, PFHxS) were variable. PFHxS was detected in samples from G1 collected during February and May, but not in samples from the GWWTP in February and May, which could have been caused by variability of the WWTP effluent or another source of PFAS to Glorieta Creek.
Samples from the PWWTP effluent collected during February and May had total PFAS concentrations of 34 and 8.1 ng/L, respectively, and detections of PFBA, PFPeA, PFHxA, PFHpA, PFOA, PFOS, and 8:2 fluorotelomer sulfonate (fig. 10D). No PFAS concentrations were detected in samples collected during August and October. The discharge of the PWWTP-treated wastewater effluent was not constant. When the stage at the Pecos River streamgage was high, the treated effluent discharge location was submerged by Pecos River water, thus possibly diluting the inherent chemical signature of the treated effluent. Only one sample from the Pecos River at the downstream P2 site had a detection of PFBS during the October 2022 sampling event. This site is downstream from where Glorieta Creek enters the Pecos River. At the low flow conditions in October 2022, this detection of PFBS may represent a contribution of PFAS from Glorieta Creek based on the detections of PFBS in samples from G1 and G2 during October. The sample collected from the PWWTP in February was most similar to the GWWTP samples, based on detections of trace elements, a Gd anomaly, and high concentrations and numbers of PFAS compounds, which are likely representations of undiluted effluent.
Quality Assurance Samples
During the October sampling event, a field blank for PFAS was processed at the P2 site, with no detections.
A replicate pair was collected during the August sampling event at the GWWTP to understand variability in nutrients, bacteria, major ions, trace metals, and PFAS compounds. Because only one replicate sample was collected during this study, the relative percent difference (RPD) was used to evaluate the replicate pair (Mueller and others, 2015). RPD is calculated by using the following equation:
The nutrients, major ions, and most of the trace elements had RPD values of less than 10 percent between the environmental sample and the replicate sample. Cobalt, strontium, titanium, and europium had RPD values of less than 13 percent. In the chromium replicate pair, the environmental value was less than the detection limit of 1 microgram per liter (µg/L), and the replicate value was 2 µg/L. The RPD for the E. coli sample was 5.5 percent. Several detections of PFAS compounds in the environmental and replicate samples were above the laboratory detection level (table 8). PFHxS had an RPD of 22.2 percent; however, both samples had PFHxS detections that were slightly greater than the laboratory reporting level of 1.9 ng/L.
Table 8.
Replicate pair analysis results for samples with per- and polyfluoroalkyl substance (PFAS) values greater than the laboratory detection level, Glorieta Wastewater Treatment Plant outfall, New Mexico, August 23, 2022.[ng/L, nanograms per liter; Env, environmental sample; Rep, replicate sample; RPD, relative percent difference]
Influence From Wastewater Treatment Facilities on Glorieta Creek and the Pecos River Within Pecos National Historical Park
Water-quality sampling of Glorieta Creek and the Pecos River in PECO in 2022 provides an update of water quality status after more than a decade without focused research. Overall, the Pecos River sites within PECO did not have any exceedance of the water quality field parameters standards or drinking water or aquatic life standards. There were also no exceedances of E. coli at the Pecos River sites, and there was only one detection of a PFAS compound in all the samples from the Pecos River. Even though there were exceedances of standards in the Pecos WWTP samples, those exceedances were not observed in the Pecos River samples. The samples from Glorieta Creek had exceedances of specific conductance and the downstream G2 site on Glorieta Creek had low dissolved oxygen below the standard for high-quality cold-water-use. There were also exceedances of the copper aquatic life standards at the downstream G2 site on Glorieta Creek, however estimated values were used for some input variables for the aquatic life standard calculation and direct measurement of those values would provide better aquatic life standard values. Glorieta Creek samples in August 2023 exceeded the E. coli single sample New Mexico water quality threshold, the samples were associated with high turbidity likely related to sediment mobilized during monsoon storms, which have been associated with elevated bacteria levels in other areas of the southwest (Paretti and others, 2019). The Glorieta Creek samples also had several detections of PFAS compounds, however the concentrations are low and indicate interaction with human related sources but do not exceed any water quality criteria at this time. The Pecos River sampled sites within the park also meet the standards for high-quality cold-water use, and therefore the stretch of the Pecos River as it flows through the park is consistent with the quality of sites chosen for fish reintroduction. Further studies with site specific habitat assessment for specific fish would provide helpful information beyond the scope of this study.
The treated wastewater effluent contribution to the water resources in the park is variable, and climatic forces affect discharge, thus additional sampling could provide more information about water-quality changes in the park, especially during periods of low flow, which are increasingly more common in the Pecos headwaters watershed. Further evaluations of the seasonally variable surface-water flow patterns, along with precipitation patterns and the relations to WWTP discharge patterns, could provide better understanding of the variability.
Summary
The Pecos River flows through the Pecos National Historical Park (PECO) and is joined by Glorieta Creek within the park boundaries. The park plans to expand access to the Pecos River and create a nature trail that will bring visitors to Glorieta Creek as part of a long-term recreation plan, in addition to reintroducing native fish species. Two wastewater treatment plants (WWTPs) are located upgradient from water resources in the park. More information is needed regarding the water quality of the water resources in the park related to the WWTP effluent contributions to the Pecos River and Glorieta Creek in an effort to inform resource managers that make decisions related to the protection of the health of park visitors and the valuable habitat.
Currently, the portions of the Pecos River and Glorieta Creek in PECO are listed on the 2022 State of New Mexico §303(d) List of Impaired Surface Waters. The Pecos River within the park boundaries is listed as impaired for temperature and dissolved oxygen for high-quality cold-water use. Glorieta Creek within the park boundaries is listed for nutrients and specific conductance exceedances for high-quality cold-water use. The U.S. Geological Survey, in cooperation with the National Park Service, conducted four sampling events during February–October 2022. During this time, the discharge of the Pecos River was generally below the average historical discharge. Also, from April to June 2022, the largest fire in New Mexico history, the Hermit’s Peak/Calf Canyon Fire, burned in the watershed above the Pecos Headwaters watershed as well as in the northeastern portion of the watershed. Samples were analyzed for water-quality field parameters, major ions, trace elements, rare earth elements, nutrients, bacteria, and per- and polyfluoroalkyl substances (PFAS).
Water temperature ranged seasonally at the Glorieta Creek and Pecos River sites from 1.4 to 18.5 degrees Celsius, and waters had circumneutral pH, ranging from 7.2 to 8.3. Specific conductance values ranged from 120 to 1,320 microsiemens per centimeter at 25 degrees Celsius (µS/cm). Specific conductance values in all samples collected from Glorieta Creek and the Pecos WWTP during February 2022 exceeded the New Mexico water quality standard of 300 µS/cm.
Water samples from the Pecos River all had a similar chemical signature of calcium-bicarbonate type, whereas samples from Glorieta Creek had a higher proportion of sodium, chloride, and sulfate, indicating a mixed calcium-sodium-bicarbonate type water. Two samples collected from Glorieta Creek in February and May had a mixed-anion type water, indicating a possible contribution from older groundwater that has undergone cation exchange to replace sodium for calcium or evaporite or septic system contributions with the addition of sodium and chloride. Glorieta Creek waters may also represent a contribution of groundwater with some gypsum dissolution due to the addition of sulfate. The Pecos WWTP effluent is similar to Pecos River water, especially for samples collected when the Pecos River discharge was high and backwater from the river was present at the effluent discharge location (May, August, and October). In February, the Pecos River level was low, and therefore this sample at the PWWTP likely represents more of a source water signature of groundwater used in the distribution systems that feeds the treatment plant.
None of the concentrations of trace elements in surface-water samples exceeded drinking water standards. Copper concentrations in only two samples from Glorieta Creek exceeded aquatic life standards. Concentrations of several trace elements (antimony, arsenic, barium, boron, cadmium, cobalt, copper, lithium, manganese, molybdenum, nickel, strontium, tin, uranium, and vanadium) were higher in samples from Glorieta Creek compared to concentrations in samples from the Pecos River. WWTP effluents also had higher trace element concentrations (boron, bismuth, copper, lead, nickel, phosphorus, rubidium, tin, and zinc) that may represent contributions from anthropogenic sources or from some elements that are elevated in the source groundwater used in the distribution systems feeding the WWTPs. The concentration of phosphorous was also higher in the WWTP effluent compared to concentrations in the surface waters of Glorieta Creek and the Pecos River.
A positive Gd anomaly, which is related to the use of Gd-based contrast agents in magnetic resonance imaging, has been observed worldwide as a distinctive signature of water inputs from WWTPs in areas with magnetic resonance imaging facilities. The Pecos WWTP sample collected in February had a Gd anomaly with all three calculation methods, and the sample from May had a Gd anomaly from two of the calculation methods but values were lower compared to the February sample (table 7). The other samples from this site did not have a Gd anomaly with any of the calculation methods and were more similar to samples from the Pecos River, likely due to the high river level that resulted in the inundation of the effluent release area. The Glorieta WWTP samples collected in February, May, and October had Gd anomalies, but the sample collected in August did not have an anomaly.
Concentrations of nitrate in all samples collected from the Glorieta WWTP exceeded the U.S. Environmental Protection Agency’s National Primary Drinking Water Regulation of 10 milligrams per liter (mg/L) for nitrate (measured as nitrogen), with values ranging from 34.9 mg/L in February to 14.8 mg/L in October. Nitrate concentrations in samples from the other sites were less than 1 mg/L.
Concentrations of E. coli were the greatest at the Pecos WWTP outfall, ranging from 1,100 to greater than 2,400 most probable number per 100 milliliters (MPN/100 mL). Concentrations in samples collected downstream from the WWTP outfall on the Pecos River were low, ranging from less than 1 to 96 MPN/100 mL. The E. coli concentrations in samples collected at the Glorieta WWTP ranged from less than 1 to 34 MPN/100 mL. Concentrations in samples collected downstream from the Glorieta WWTP ranged from less than 1 to 920 MPN/100 mL. Generally, the highest E. coli concentrations at all the sites, except at the Pecos WWTP and a site on the Pecos River, were detected in the samples collected in August when a lot of sediment was in the water due to preceding rain events. Concentrations of E. coli in two samples collected from Glorieta Creek in August exceeded the New Mexico Water Quality Standard of 235 colony-forming units per 100 milliliters, and concentrations in samples from the Pecos WWTP outfall exceeded the standard during every sampling event.
Eleven of the 28 PFAS compounds analyzed were detected during this study. The treated wastewater effluent had the highest total PFAS concentrations. The effluent at the Glorieta WWTP had the highest total PFAS concentrations (ranging from 30.6 to 155.5 nanograms per liter) and the highest number of compounds with detections. Samples from the Glorieta Creek upstream site consistently had concentrations of several PFAS compounds during all four sampling events, whereas samples from the Glorieta Creek downstream site had concentrations of three PFAS compounds during the August and October sampling events. The total PFAS concentration decreased by an order of magnitude with distance downstream along Glorieta Creek, which suggests mixing with other waters in addition to the Glorieta WWTP effluent. Additionally, the water from Glorieta WWTP effluent infiltrates into the subsurface along Glorieta Creek where the creek is often dry, which may cause sorption of some PFAS compounds to sediments and accumulation at air/water interfaces. These subsurface PFAS sediment accumulations may be remobilized by future wetting events and move PFAS compounds down Glorieta Creek periodically.
Samples collected in August at both Glorieta Creek sites were similar to the samples from the Glorieta WWTP, and PFAS analysis from that sampling event also shows the highest concentrations of PFAS compounds and the most compounds present at the Glorieta Creek sites. The presence of higher PFAS as well as trace element anomalies were similar to wastewater treatment plant effluent samples suggesting there is a component of water derived from anthropogenic activities in Glorieta Creek during the August 2022 sampling event.
The Pecos WWTP effluent samples had detections of total PFAS concentrations of 34 and 8.1 nanograms per liter during February and May 2022, respectively. When the Pecos River was at higher stage, the treated effluent discharge location is submerged by Pecos River water and may dilute the true chemical signature of the treated effluent. Only one sample from the Pecos River at the downstream site had a detection of a PFAS compound during the October 2022 sampling event. This site is downstream from where Glorieta Creek enters the Pecos River. At the low flow conditions in October 2022, this detection may represent a contribution of PFAS from Glorieta Creek where there were detections during the October sampling event.
References Cited
Beisner, K.R., Paretti, N.V., Jasmann, J.R., and Barber, L.B., 2023, Utilizing anthropogenic compounds and geochemical tracers to identify preferential structurally controlled groundwater pathways influencing springs in Grand Canyon National Park, Arizona, USA: Journal of Hydrology, Regional Studies, v. 48, accessed July 12, 2023, at https://doi.org/10.1016/j.ejrh.2023.101461.
Bureau of Reclamation, 2021, Pecos River Basin Study—New Mexico—Evaluation of future water supply and demand for irrigated agriculture in the Pecos Basin in New Mexico: Bureau of Reclamation, 253 p., accessed April 26, 2023, at https://www.usbr.gov/watersmart/bsp/docs/finalreport/Pecos/PRNMB-final-9-20-2021.pdf.
Chapman, P.M., Adams, W.J., Brooks, M.L., Delos, C.G., Luoma, S.N., Maher, W.A., Ohlendorf, H.M., Presser, T.S., and Shaw, D.P., 2009, Ecological assessment of selenium in the aquatic environment—Summary of a SETAC Pellston Workshop: Pensacola, Fla., Society of Environmental Toxicology and Chemistry (SETAC), 368 p.
Fernández-Nava, Y., Marañón, E., Soons, J., and Castrillón, L., 2008, Denitrification of wastewater containing high nitrate and calcium concentrations: Bioresource Technology, v. 99, no. 17, p. 7976–7981, accessed June 6, 2023, at https://doi.org/10.1016/j.biortech.2008.03.048.
Garcia-Solsona, E., Jeandel, C., Labatut, M., Lacan, F., Vance, D., Chavagnac, V., and Pradoux, C., 2014, Rare earth elements and Nd isotopes tracing water mass mixing and particle-seawater interactions in the SE Atlantic: Geochimica et Cosmochimica Acta, v. 125, p. 351–372, accessed June 5, 2023, at https://doi.org/10.1016/j.gca.2013.10.009.
Gromet, L.P., Haskin, L.A., Korotev, R.L., and Dymek, R.F., 1984, The “North American shale composite”—Its compilation, major and trace element characteristics: Geochimica et Cosmochimica Acta, v. 48, no. 12, p. 2469–2482, accessed June 5, 2023, at https://doi.org/10.1016/0016-7037(84)90298-9.
Karri, R.R., Sahu, J.N., and Chimmiri, V., 2018, Critical review of abatement of ammonia from wastewater: Journal of Molecular Liquids, v. 261, p. 21–31, accessed June 6, 2023, at https://doi.org/10.1016/j.molliq.2018.03.120.
Julian, P., and Helsel, D., 2023, CRAN—Package NADA2: Comprehensive R Archive Network web page, accessed October 20, 2023, at https://cran.r-project.org/web/packages/NADA2/NADA2.pdf.
Mankin, J.S., Simpson, I., Hoell, A., Fu, R., Lisonbee, J., Sheffield, A., and Barrie, D., 2021, NOAA Drought Task Force report on the 2020–2021 southwestern U.S. drought: National Oceanic and Atmospheric Administration (NOAA) Drought Task Force, Modeling Analysis, Predictions, and Projections (MAPP) program, and National Integrated Drought Information System (NIDIS), 19 p.
Mueller, D.K., Schertz, T.L., Martin, J.D., and Sandstrom, M.W., 2015, Design, analysis, and interpretation of field quality-control data for water-sampling projects: U.S. Geological Survey Techniques and Methods, book 4, chap. C4, 54 p., accessed June 6, 2023, at https://doi.org/10.3133/tm4C4.
National Park Service, 2010, Develop public access to Pigeon’s Ranch Sub-Unit: National Park Service web page, accessed February 21, 2024, at https://parkplanning.nps.gov/projectHome.cfm?ProjectID=28234.
National Park Service, 2015, Foundation document—Pecos National Historical Park: National Park Service, 54 p., accessed January 20, 2023, at http://npshistory.com/publications/foundation-documents/peco-fd-2015.pdf.
New Mexico Environment Department, 2016, State of New Mexico CWA 303(d)/305(b) integrated list and report: New Mexico Environment Department web page, accessed January 25, 2021, at https://www.env.nm.gov/surface-water-quality/303d-305b/.
New Mexico Environment Department Surface Water Quality Bureau [NMEDSWQB], 2022, 2022–2024 Clean Water Act 303(d)/305(b) integrated report: New Mexico Environment Department web page, accessed May 12, 2023, at https://cloud.env.nm.gov/water/pages/view.php?ref=8234&k=c19431341b.
New Mexico Environment Department Surface Water Quality Bureau [NMEDSWQB], 2024, NPDES permits: New Mexico Environment Department web page, accessed January 13, 2024, at https://www.env.nm.gov/surface-water-quality/npdes-permits/.
Noble, R.T., Leecaster, M.K., McGee, C.D., Weisberg, S.B., and Ritter, K., 2004, Comparison of bacterial indicator analysis methods in stormwater-affected coastal waters: Water Research, v. 38, no. 5, p. 1183–1188. [Also available at https://doi.org/10.1016/j.watres.2003.11.038.]
Oksanen, J., Blanchet, F.G., Friendly, M., Kindt, R., Legendre, P., McGlinn, D., Minchin, P.R., O’Hara, R.B., Simpson, G.L., Solymos, P., Henry, M., Stevens, H., Szoecs, E., and Wagner, H., 2022, Package ‘vegan’—Community ecology package (ver. 2.6–4): Comprehensive R Archive Network web page, accessed June 2, 2023, at https://cran.r-project.org/web/packages/vegan/index.html.
Paretti, N.V., Kephart, C.M., Porter, T.J., Hermosillo, E., Cederberg, J.R., Mayo, J.P., Gungle, B., Coes, A.L., Tucci, R.S., and Norman, L.M., 2019, Spatial and temporal distribution of bacterial indicators and microbial-source tracking within Tumacácori National Historical Park and the upper Santa Cruz River, southern Arizona and northern Mexico, 2015–2016: U.S. Geological Survey Scientific Investigations Report 2019–5108, 102 p., accessed November 3, 2023, at https://doi.org/10.3133/sir20195108.
Piper, D.Z., and Bau, M., 2013, Normalized rare earth elements in water, sediments, and wine—Identifying sources and environmental redox conditions: American Journal of Analytical Chemistry, v. 4, no. 10A, p. 69–83, accessed July 13, 2022, at https://doi.org/10.4236/ajac.2013.410A1009.
R Core Team, 2023, R—A language and environment for statistical computing: Vienna, R Foundation for Statistical Computing, accessed June 2, 2023, at https://www.R-project.org.
Rétif, J., Zalouk-Vergnoux, A., Briant, N., and Poirier, L., 2023, From geochemistry to ecotoxicology of rare earth elements in aquatic environments—Diversity and uses of normalization reference materials and anomaly calculation methods: Science of the Total Environment, v. 856, pt. 2, article 158890, accessed June 5, 2023, at https://doi.org/10.1016/j.scitotenv.2022.158890.
Standard Methods Committee of the American Public Health Association, American Water Works Association, and Water Environment Federation, 2022, 9223 Enzyme substrate coliform test, in Lipps, W.C., Baxter, T.E., and Braun-Howland, E., eds., Standard methods for the examination of water and wastewater: Washington, D.C., APHA Press, 4 p., accessed December 28, 2022, at https://www.standardmethods.org/doi/abs/10.2105/SMWW.2882.194?role=tab.
U.S. Environmental Protection Agency [EPA], 2007, Aquatic life ambient freshwater quality criteria—Copper (rev. 2007): U.S. Environmental Protection Agency Office of Water, Office of Science and Technology publication EPA-822-R-07-001, accessed June 5, 2023, at https://www.epa.gov/sites/default/files/2019-02/documents/al-freshwater-copper-2007-revision.pdf.
U.S. Environmental Protection Agency [EPA], 2018, NPDES permit no. NM0028088—Fact sheet: U.S. Environmental Protection Agency, 11 p., accessed July 17, 2023, at https://www.epa.gov/sites/default/files/2018-04/documents/nm0028088_fact_sheet.pdf.
U.S. Environmental Protection Agency [EPA], 2022, NPDES permit no. NM0029041—Fact sheet: U.S. Environmental Protection Agency, 15 p., accessed July 17, 2023, at https://www.epa.gov/system/files/documents/2023-01/Fact%20Sheet%20NM0029041.pdf.
U.S. Environmental Protection Agency [EPA], 2023a, National Primary Drinking Water Regulations: U.S. Environmental Protection Agency database, accessed May 11, 2023, at https://www.epa.gov/ground-water-and-drinking-water/national-primary-drinking-water-regulations.
U.S. Environmental Protection Agency [EPA], 2023b, National recommended water quality criteria tables: U.S. Environmental Protection Agency database, accessed June 5, 2023, at https://epa.gov/wqc/national-recommended-water-quality-criteria-tables.
U.S. Environmental Protection Agency [EPA], 2023c, Indicators—Enterococci: U.S. Environmental Protection Agency web page, accessed June 1, 2023, at https://www.epa.gov/national-aquatic-resource-surveys/indicators-enterococci.
U.S. Environmental Protection Agency [EPA], 2023d, Our current understanding of the human health and environmental risks of PFAS: U.S. Environmental Protection Agency web page, accessed July 17, 2023, at https://www.epa.gov/pfas/our-current-understanding-human-health-and-environmental-risks-pfas.
U.S. Geological Survey [USGS], 2023, USGS water data for the Nation: U.S. Geological Survey National Water Information System database, accessed May 25, 2023, at https://doi.org/10.5066/F7P55KJN.
U.S. Geological Survey [USGS], [variously dated], National field manual for the collection of water-quality data: U.S. Geological Survey Techniques of Water-Resources Investigations, book 9, chaps. A1–A10. [Also available at https://pubs.water.usgs.gov/twri9A.]
Appendix 1. Water Chemistry Data for Samples Collected by the U.S. Geological Survey from Pecos National Historical Park in 2022
Conversion Factors
U.S. customary units to International System of Units
Temperature in degrees Celsius (°C) may be converted to degrees Fahrenheit (°F) as follows:
°F = (1.8 × °C) + 32.
Datums
Vertical coordinate information is referenced to the North American Vertical Datum of 1988 (NAVD 88).
Horizontal coordinate information is referenced to the North American Datum of 1983 (NAD 83).
Supplemental Information
Specific conductance is given in microsiemens per centimeter at 25 degrees Celsius (µS/cm at 25 °C).
Concentrations of chemical constituents in water are given in milligrams per liter (mg/L), micrograms per liter (µg/L), or nanograms per liter (ng/L).
Concentrations of bacterial indicators are given in colony-forming units per 100 milliliters (CFU/100 mL) for water.
Turbidity is given in Formazin Nephelometric Units (FNU).
Abbreviations
EARDC
Edwards Aquifer Research and Data Center
EPA
U.S. Environmental Protection Agency
Gd
gadolinium
MRI
magnetic resonance imaging
NASC
North American shale composite
NMDS
nonmetric multidimensional scaling
NMEDSWQB
New Mexico Environment Department Surface Water Quality Bureau
NMWQS
New Mexico Water Quality Standard
NPDWR
National Primary Drinking Water Regulation (EPA)
PECO
Pecos National Historical Park
PFAS
per- and polyfluoroalkyl substances
REEs
rare earth elements
RPD
relative percent difference
USGS
U.S. Geological Survey
WWTP
wastewater treatment plant
For more information about this publication, contact
Director, New Mexico Water Science Center
U.S. Geological Survey
6700 Edith Blvd. NE
Albuquerque, NM 87113
For additional information, visit
https://www.usgs.gov/centers/nm-water
Publishing support provided by
Lafayette Publishing Service Center
Disclaimers
Any use of trade, firm, or product names is for descriptive purposes only and does not imply endorsement by the U.S. Government.
Although this information product, for the most part, is in the public domain, it also may contain copyrighted materials as noted in the text. Permission to reproduce copyrighted items must be secured from the copyright owner.
Suggested Citation
Wilkins, K., Beisner, K.R., and Travis, R., 2024, Assessing influence from wastewater treatment facilities on Glorieta Creek and the Pecos River within Pecos National Historical Park, New Mexico, February–October 2022: U.S. Geological Survey Open-File Report 2024–1014, 29 p., https://doi.org/10.3133/ofr20241014.
ISSN: 2331-1258 (online)
Study Area
| Publication type | Report |
|---|---|
| Publication Subtype | USGS Numbered Series |
| Title | Assessing influence from wastewater treatment facilities on Glorieta Creek and the Pecos River within Pecos National Historical Park, New Mexico, February–October 2022 |
| Series title | Open-File Report |
| Series number | 2024-1014 |
| DOI | 10.3133/ofr20241014 |
| Publication Date | March 27, 2024 |
| Year Published | 2024 |
| Language | English |
| Publisher | U.S. Geological Survey |
| Publisher location | Reston, VA |
| Contributing office(s) | New Mexico Water Science Center |
| Description | Report: viii, 29 p; 1 Appendix; Dataset |
| Country | United States |
| State | New Mexico |
| Other Geospatial | Glorieta Creek, Pecos National Historical Park, Pecos River |
| Online Only (Y/N) | Y |