

Occupancy Dynamics of the Coastal California Gnatcatcher in Southern California
Links
- Document: Report (15 MB pdf) , HTML , XML
- Data Release: USGS Data Release - Rangewide occupancy and post-fire recovery of California gnatcatchers in southern California (ver 2.0, March 2023)
- Download citation as: RIS | Dublin Core
Acknowledgments
We thank the many partners and cooperators who made this project possible. Susan Wynn, Will Miller, and Hans Sin were instrumental in devising the project and facilitating funding. Property access and logistical support was provided by the following: 4-S Ranch Homeowners Association, Angeles National Forest, Audubon California Starr Ranch, California Department of Fish and Wildlife, California Department of Parks and Recreation, California Department of Transportation, Center for Natural Lands Management, City of Anaheim, City of Carlsbad, City of Chino Hills, City of Chula Vista, City of Escondido, City of Irvine, City of Laguna Niguel, City of Oceanside, City of Poway, City of San Diego Parks Department, City of San Diego Public Utilities, City of Thousand Oaks, City of Vista, City of Whittier, Conejo Open Space Conservation Agency, County of Los Angeles, County of Orange, County of San Diego, Endangered Habitats Conservancy, Fallbrook Land Conservancy, Fallbrook Public Utility, Fond Land Preservation Foundation, Helix Water District, H.G. Fenton Company, Irvine Ranch Water District, Lakeview at Highlands Ranch Homeowners Association, Manzanita Partners LLC, Matt Witman, Mountains Recreation & Conservation Authority, Native Habitat Preservation Authority, Natural Communities Coalition, Olivenhain Municipal Water District, Orange County Transportation Authority, Otay Ranch Preserve, Otay Water District, City of Palos Verdes Preserve, Ramona Municipal Water District, Rancho Mission Viejo, Rancho Santa Fe Lakes Homeowners Association, Rancho Simi Recreation and Park District, Riverside County Habitat Conservation Agency, Riverside County Parks, San Bernardino Water Conservation District, San Dieguito River Park, Sanitation Districts of Los Angeles County, Santa Monica Mountains Conservancy, Sweetwater Authority, The Environmental Trust, The Nature Conservancy, U.C. San Diego, Bureau of Land Management, U.S. Department of Defense, U.S. National Park Service, U.S. Forest Service, U.S. Fish and Wildlife Service, U.S. Geological Survey, Vallecitos Water District, Western Riverside County Regional Conservation Authority, and Western Riverside County Multi-Species Reserve.
We are grateful for the large crew of dedicated field biologists too numerous to list who performed gnatcatcher surveys and spent long, grueling hours sampling vegetation. Emily Perkins created the maps presented in this report. The manuscript was improved with helpful suggestions by Brian Halstead and Jonathan Rose. This work was funded by the San Diego Association of Governments, a Section 6 Grant from the California Department of Fish and Wildlife, and the U.S. Geological Survey Ecosystems Program Area and Western Ecological Research Center.
Executive Summary
The Coastal California Gnatcatcher (Polioptila californica californica: “gnatcatcher”) is a resident species restricted to coastal sage scrub habitat in southern California. Listed as federally threatened, the gnatcatcher is subject to multiple threats, including habitat loss, fragmentation, and degradation, particularly in association with the increasing frequency of large wildfires. The California Gnatcatcher is a focal species under several habitat conservation plans and is monitored to determine population trends and evaluate the success of the plans in protecting the species.
Historically, gnatcatcher monitoring has been limited in geographic scope and has used differing methodologies, limiting the extent to which findings can be generalized across larger spatial scales and multiple populations. In 2015, we completed the first of an intended series of surveys following a standardized protocol designed to address two broad objectives. First, we sought to determine gnatcatcher occupancy at the regional scale, including habitat from throughout the species’ range in southern California, as well as in two subregions: Orange County and San Diego County, to address specific management objectives within those jurisdictions. In addition, we collected vegetation data to better understand gnatcatcher habitat associations that affect occupancy. In a parallel objective, we evaluated the effect of fire on gnatcatchers and their habitat by comparing occupancy and vegetation characteristics across sites varying in the length of time since the last fire. Data collected in 2020 allowed us to expand the study to include analyses of colonization (sites unoccupied in one year and occupied the next) and extinction (sites occupied in one year but not the next).
In 2020, we surveyed 327 regional points and 180 subregional points each in Orange and San Diego Counties. In addition, we surveyed 95–106 points within 4 postfire categories based on the year of the last fire at each point: before or during 2002 (“unburned”), 2003–06, 2007–10, and 2011–14. We surveyed for gnatcatchers during three area searches centered on each point at 2-week intervals commencing in mid-March. Vegetation data were collected during May–June using a modified point-intercept method along fixed transects.
Shrub and tree cover at our plots was dominated by California sagebrush (Artemisia californica), California buckwheat (Eriogonum fasciculatum), laurel sumac (Malosma laurina), sage (including Salvia mellifera and S. leucophylla), and sunflowers (including Encelia californica, E. farinosa, and Bahiopsis laciniata); however, most of the vegetation at plots consisted of non-native grass and herbaceous plants, indicating a high level of disturbance associated with fire. We documented vegetation differences at the subregional scale indicative of differences in fire history: in Orange County, overall shrub/tree cover was higher and herbaceous cover lower than in San Diego, where three large fires had burned within 17 years of this study. Both woody and herbaceous cover increased between 2016 and 2020 at the regional and two subregional scales, likely a response to above-average precipitation during 2 years preceding the 2020 surveys. Herbaceous vegetation also increased at postfire points; however, woody vegetation cover changed little between 2016 and 2020.
We modeled the effects of vegetation and physical (elevation, distance to Pacific coast, slope) covariates on gnatcatcher occupancy, colonization, and extinction probabilities in the regional, subregional, and postfire datasets. Cover of California sagebrush was the strongest predictor of gnatcatcher occupancy and appeared in the top models for every dataset. California buckwheat was another strong positive predictor of gnatcatcher occupancy in all datasets. Cover of sunflowers was a positive predictor of occupancy in the Orange County subregion, and both sunflowers and sage were positive predictors of occupancy at postfire points. In contrast, laurel sumac was negatively related to gnatcatcher occupancy in postfire habitats, with occupancy unlikely when sumac exceeded 50 percent cover. Herbaceous vegetation, including invasive grass, negatively affected gnatcatcher occupancy regionwide.
Covariates that were strong positive predictors of occupancy were also positive predictors of colonization and (or) negative predictors of extinction, and vice versa. Outside of the positive effects of California sagebrush and California buckwheat, and the negative effect of total herbaceous cover, we identified few covariates influencing colonization. In contrast, we identified many more predictors of extinction, including cover of laurel sumac and grass, which increased extinction risk, and cover of California sagebrush, sunflowers, and bare ground, along with time since last fire, which reduced extinction risk.
We used our modelled estimates of colonization and extinction probabilities to derive occupancy in 2020 based on starting occupancy in 2016. Gnatcatcher occupancy increased in 2020 at regional and subregional scales and in unburned habitat, growing by 19–35 percent since 2016. Among burned sites, occupancy tripled from 2016 to 2020 at points burned during 2011–14 but was unchanged at the 2007–10 postfire points and declined by 28 percent at points burned in 2003–06. The slow recovery of the gnatcatcher population in this latter category, which makes up 16 percent of the suitable habitat in San Diego County, is a matter of conservation concern warranting further attention.
Collectively, our rangewide results reveal a widespread and long-term effect of wildfire on California Gnatcatcher habitat, particularly in San Diego County. These data provide a baseline from which future monitoring can be used to evaluate changes in habitat condition over time and to improve our understanding of the factors and processes influencing gnatcatcher occupancy.
Introduction
The Coastal California Gnatcatcher (Polioptila californica californica; “gnatcatcher”) is a resident species restricted to coastal sage scrub habitat throughout its range in southern California (Atwood and Bontrager, 2020). Extensive conversion and fragmentation of sage scrub by urbanization and agriculture during the late 20th century led to the species’ listing as federally threatened in 1993 (U.S. Fish and Wildlife Service, 1993). In addition to extensive habitat loss, wildfire has emerged in the last quarter century as a leading threat to the coastal sage scrub community. In particular, catastrophic fires, such as the Cedar fire in 2003, the Harris fire in 2007, and a complex of fires in May 2014, burned hundreds of thousands of hectares (ha) in San Diego County alone, destroying and degrading habitat required by California Gnatcatchers. The effects of wildfire are exacerbated by postfire invasion of non-native grasses and other herbaceous vegetation (Talluto and Suding, 2008; Fleming and others, 2009; Keeley and others, 2011), which reduces habitat suitability for gnatcatchers (Winchell and Doherty, 2014; Kus and others, 2024) and promotes future fires because of high flammability (D’Antonio and Vitousek, 1992; Minnich and Dezzani, 1998).
The Coastal California Gnatcatcher (hereinafter, California Gnatcatcher) has become established as a “flagship” species for conservation to protect coastal sage scrub habitat and associated species. As a covered species under several regional habitat conservation plans, including the Multiple Species Conservation Program (MSCP; City of San Diego, 1998) and the Multiple Habitat Conservation Program (MHCP; AMEC Earth and Environmental and others, 2003), the Western Riverside County Multiple Species Habitat Conservation Plan (California Department of Fish and Game, 2004), and the Orange County Central and Coastal Subregion Conservation Plan (R.J. Meade Consulting, Inc., 1996), the gnatcatcher warrants periodic monitoring to evaluate population trends indicative of the species’ potential for persistence, and thus the success of conservation plans in achieving their objectives. In particular, rigorous standardized protocols for investigating occupancy, colonization, and extinction are needed to guide management to protect important ecological conditions and processes required for species survival.
In 2016, in cooperation with the San Diego Association of Governments, Natural Communities Coalition, California Department of Fish and Wildlife, and U.S. Fish and Wildlife Service, we completed the first of an intended series of surveys following a standardized protocol designed to address two broad objectives (Kus and others, 2024). First, we sought to determine gnatcatcher occupancy at the regional scale, including habitat from throughout the species’ range in southern California. We also determined occupancy in two subregions, Orange County and San Diego County, to address specific management objectives within those jurisdictions. In addition to documenting occupancy, we collected vegetation data to better understand gnatcatcher-habitat associations that affect occupancy, which when combined with data collected in future years, would allow an evaluation of factors influencing extinction (sites occupied in one period but not the next) and colonization (sites unoccupied in one period and occupied the next). In a parallel objective, begun in 2015, we evaluated the effect of fire on gnatcatchers and their habitat by comparing occupancy and vegetation characteristics across sites varying in the length of time since the last fire.
Here, we report the results of gnatcatcher surveys and vegetation assessments completed in 2020. Building upon the models of gnatcatcher occupancy developed from the 2016 surveys, we focus in this report on extinction and colonization rates and their relationships to habitat characteristics. We describe vegetation changes that occurred during the 4-year interval between surveys and conclude with estimates of occupancy in 2020 derived from initial occupancy, extinction, and colonization.
Methods
Study Area
We surveyed for California Gnatcatchers in coastal sage scrub habitat within the United States’ part of the species’ range in Ventura, Los Angeles, San Bernardino, Riverside, Orange, and San Diego Counties, California. To establish a sampling frame for southern California, we developed a habitat suitability model to use in place of a model (Technology Associates International Corporation, 2002) used in previous California Gnatcatcher surveys of coastal regions (Winchell and Doherty, 2008, 2014), but not designed for inland locations which differ considerably from the coast in climatic and topographic conditions. Full details of the California Gnatcatcher habitat suitability model are available in Preston and others (2020). For details on methods used to determine sample sizes and point selection and distribution, see Kus and others (2024).
We selected points for the regional survey from suitable habitat on conserved and military lands throughout southern California (fig. 1), and for the subregional surveys from suitable habitat in Orange and San Diego Counties (fig. 2). Postfire points were restricted to San Diego County and were selected from within the footprints of wildfires that burned in 2003–06, 2007–10, and 2011–14, periods that bracketed the three major recent fires of 2003, 2007, and 2014, respectively (fig. 3). A fourth category in the postfire study, that of “unburned” consisted of points selected from suitable habitat in San Diego County that had last burned between 1878 (the earliest year for which digital fire records are available) and 2002. The median year of the last fire in the unburned category was 1878.
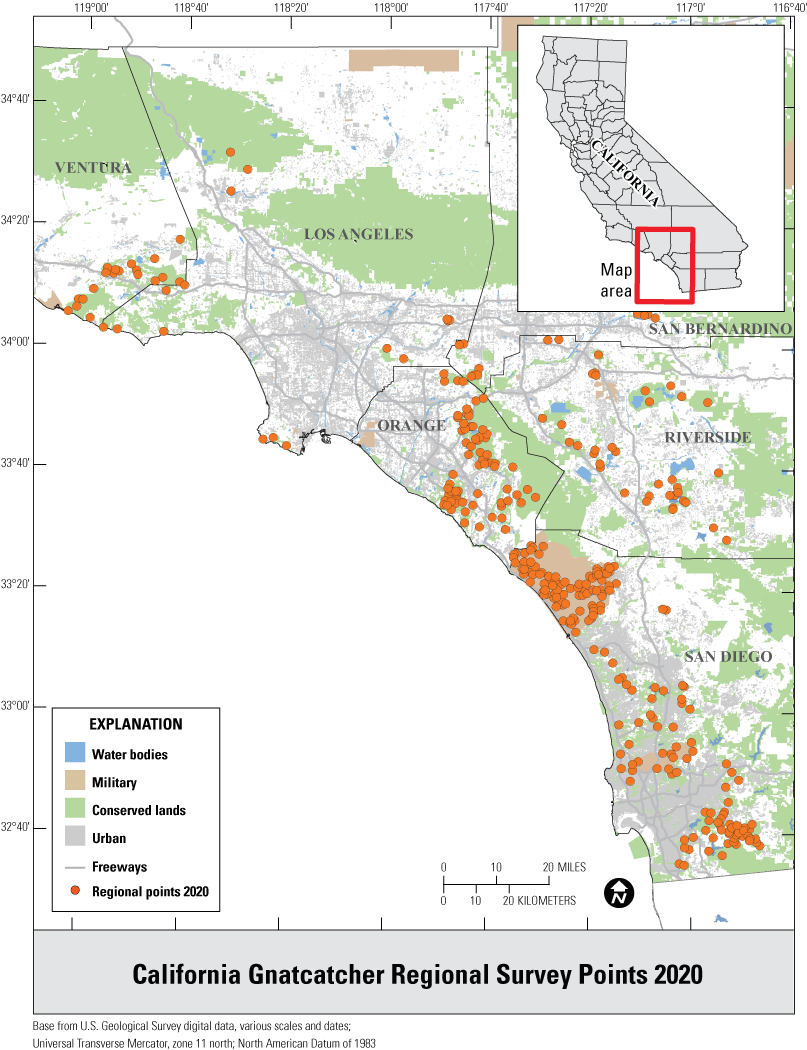
Distribution of California Gnatcatcher survey points at the regional scale in Ventura, Los Angeles, San Bernardino, Orange, Riverside, and San Diego Counties, California, in 2020.
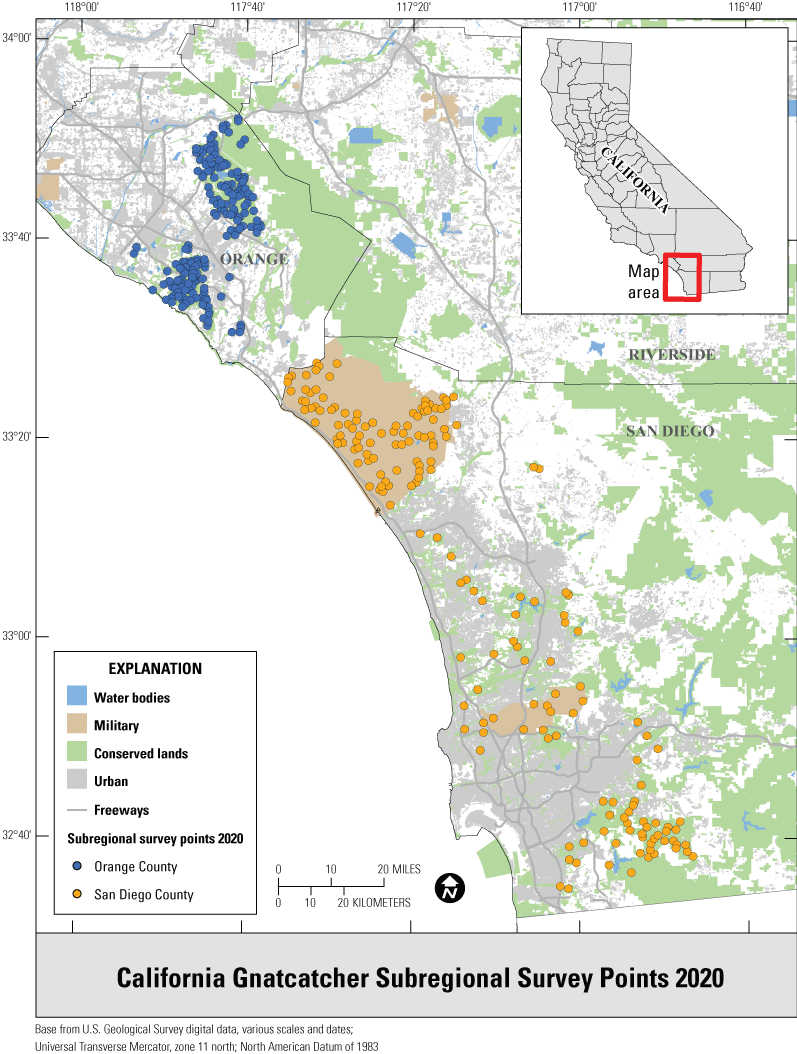
Distribution of California Gnatcatcher survey points at the subregional scale in San Diego and Orange Counties, California, in 2020.
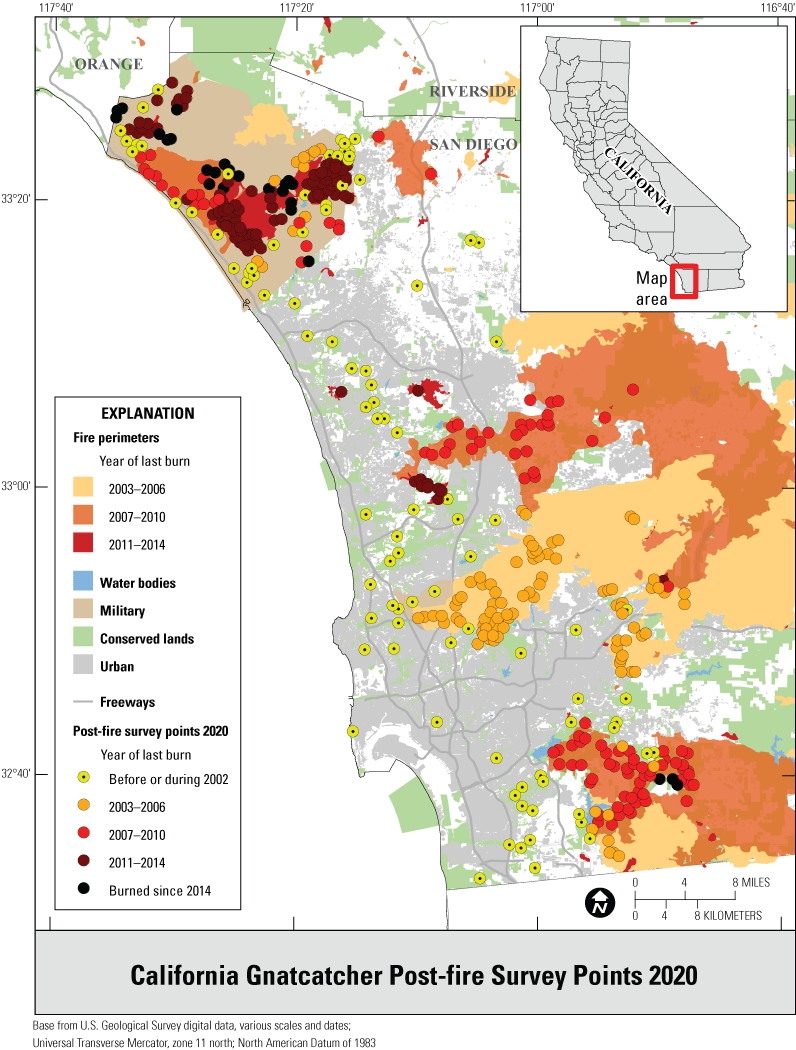
Distribution of California Gnatcatcher survey points by year of last fire in San Diego County, California, in 2020.
Data Collection
Bird Surveys
We surveyed each point three times at 2-week intervals between March 15 and April 30, 2016, and 2020, coinciding with the pre-breeding and early breeding season when gnatcatcher vocal detectability is at a seasonal high (Preston and others, 1998). Points burned in 2003–06, 2007–10, and 2011–14 were also surveyed during the same timeframe in 2015 in a pilot study of postfire plots. Gnatcatcher detection-non-detection surveys were done within 150-meter (m) by 150-m (2.25 ha) plots centered on each sampling point (Miller and Winchell, 2016). Surveys were performed between dawn and late morning/early afternoon depending on weather, avoiding conditions of excessive wind (less than 20 kilometers per hour [kph]), temperatures below 4.5 degrees Celsius (°C) or above 32 degrees °C, or precipitation greater than a drizzle. Upon arriving at the plot, surveyors recorded date and start time, and accessed imagery on hand-held devices displaying their location and the plot boundaries in ArcGIS (Geographic Information System) Collector (Environmental Systems Research Institute, 2024). After allowing time for activity at the plot to settle, surveyors walked slowly and methodically through the entire plot, looking and listening for gnatcatchers. Playbacks of gnatcatcher “mew” vocalizations were broadcast in a standardized manner (Miller and Winchell, 2016) from each of the four cardinal quadrants of the plot (northwest, northeast, southeast, southwest). A single bout of songs lasting approximately 20 seconds was played in each quadrant, with no more than four bouts per plot. Broadcasts were directed toward the center of the plot to avoid attracting birds from outside the plot. Surveys ended after 45 minutes, or when an adult California Gnatcatcher was detected within the plot, at which time the surveyor recorded the location of any birds detected, the number of song broadcasts (0–4), and the survey end time.
Gnatcatcher data collection by U.S. Geological Survey staff was authorized under U.S. Fish and Wildlife Service permit TE-829554-18.1.
Vegetation Sampling
Vegetation data were collected at each survey plot between April 28 and August 2, 2016, and between April 27 and July 30, 2020. We used a modified point intercept method to record data at 2-m intervals along 2 perpendicular 30-m transects centered within each of the 4 cardinal quadrants of the plot, for a total of 128 vegetation sampling points per plot. Field surveyors used high resolution digital aerial imagery and a compass to navigate to transects and estimate sampling locations along their length. At each sampling point, surveyors placed a 2-m-long measuring pole perpendicular to the ground and recorded “hits” of shrubs, trees, and herbs. Shrubs and trees were defined by their height at the location of the measuring pole, with shrubs being less than 2 m and trees greater than or equal to 2 m tall. In addition to hits of shrubs and trees, surveyors recorded the associated height of the tallest shrub and tree at the point. Based on preliminary analysis of vegetation data collected previously in suitable gnatcatcher habitat (Winchell and Doherty, 2018), we recorded species for hits of 26 shrub, tree, and herbaceous species thought to affect gnatcatcher occupancy and habitat suitability (table 1); all other species were combined into “other shrub/tree” or “other herbaceous” categories, and the species for woody vegetation was noted under comments. In 2020, we added six additional species (chamise [Adenostoma fasciculatum], thick-leaved yerba santa [Eriodictyon crassifolium], toyon [Heteromeles arbutifolia], Menzies’ goldenbush [Isocoma menziesii], snapdragon penstemon [Keckiella antirrhinoides], and chaparral bushmallow [Malacothamnus fasciculatus]) based on results of the 2016 vegetation assessments. We recorded “Dead” for hits of woody vegetation where the entire plant was dead. At points where no vegetation occurred, substrate was recorded as bare ground, boulder (large rock too heavy to lift), or pavement.
Table 1.
Vegetation species, heights, and unvegetated substrates recorded at California Gnatcatcher survey plots in 2020.[Trees: height great than or equal to 2 meters (m). Shrubs: height less than 2 m. Substrate only recorded when no vegetation present at sampling point. Abbreviation: —, no data]
Data Analysis
We calculated percent cover for each vegetation variable (table 1) as the percentage of the 128 sampling points in each plot at which the species or substrate occurred. Similarly, we calculated average shrub and tree heights for each gnatcatcher survey plot. In 16 plots for which shrub height was missing, we used the average shrub height calculated for the rest of the plots in that dataset as the value for shrub height.
We created a composite variable combining ecologically similar species. “Sunflowers” (SUNFL) included bush sunflower, brittlebush, San Diego sunflower, and Menzies’ goldenbush. We created a variable called “Total shrub/tree” (TOTSHRTRE) that represented cover of all shrub/tree species (in other words, the 21 individual species plus “other” species) and one called “Total herbaceous” (TOTHRB) that represented the total cover of herbaceous vegetation. In calculating total shrub/tree and total herbaceous cover, each point received a maximum of 1 “hit,” regardless of how many species occurred there.
In addition to analyzing vegetation variables, we used ArcGIS to extract physical variables for each gnatcatcher survey plot in the regional and subregional datasets, including distance to the Pacific coast (DISTCOAST), elevation (ELEV), and slope (SLOPE) of the plot location. We did not analyze physical variables for the postfire dataset because points were distributed nonrandomly with regard to these variables; recent fires were concentrated at lower elevations near the coast while older fires were inland at higher elevations. We also calculated an index of time since the last fire at each regional and subregional plot (LASTFIRE) relative to 1878. LASTFIRE was calculated by subtracting 1877 from the year of the most recent fire at each plot to generate values that ranged from 1 (last fire in or before 1878) to 137 (last fire in 2014). Structuring the index as increasing with recency of fire rather than decreasing eliminated the need to recalculate LASTFIRE in future survey datasets while retaining the ability to update the variable for any plots that burned subsequent to the initial survey in 2016.
We modeled dynamic occupancy for California Gnatcatcher to estimate colonization and extinction separately for the regional, two subregional, and postfire datasets. We used the hierarchical logistic modeling package Unmarked (v1.1.1, Fiske and Chandler, 2011) in R (R Core Team, 2018) to evaluate the effects of vegetation cover, vegetation structure, time since last fire, and topography on initial (2016) occupancy, colonization, and extinction, and evaluated support for models using Akaike’s Information Criterion corrected for small sample size (AICc; Burnham and Anderson, 2002). We analyzed both linear and quadratic functions of TOTSHRTRE and LASTFIRE to evaluate possible threshold effects. We estimated initial occupancy using models identified in analyses of the 2016 data (Kus and others, 2024) and used covariates in those models to build and evaluate models of colonization and extinction. We included fire category (unburned, burned 2003–06, 2007–10, 2011–14) as a categorical variable (FIRE) in the postfire dataset to obtain estimates of occupancy, colonization, and extinction for each fire category. We tested for goodness-of-fit using the parametric bootstrapping approach of MacKenzie and Bailey (2004) in Package Unmarked (Fiske and Chandler, 2011), and present adjusted estimates of the overdispersion parameter (ĉ) and Quasi-AICc (QAICc) values for overdispersed datasets. Detection probability (p) was modeled as a constant, which we considered justified by duration and number of visits made to each plot, and the use of audio playbacks to elicit gnatcatcher response. All variables were scaled for analysis.
Starting with the existing model of occupancy for each dataset, we modeled colonization and extinction individually while holding the other parameters constant. We built models using the covariates that were identified in the occupancy analysis of the 2016 data (Kus and others, 2024). From these full models, we removed covariates and evaluated support for subsets of covariates, removing models with uninformative parameters (in other words, where addition or removal of a covariate had a negligible effect on deviance; Arnold 2010). We narrowed the resulting models to a set we considered best-supported, which we defined as those with AICc or QAICc within 2 units of the top-ranked model.
Once we had identified the best-supported models for each parameter, we systematically built global model sets creating all possible combinations of the best-supported models for occupancy (Kus and others, 2024), colonization, and extinction. For example, if we had two models for occupancy, three for colonization, and two for extinction, we created a total of 2x3x2=12 global models that were evaluated following the information-theoretic approach (Burnham and Anderson, 2002). We present the final set of global models that are within 2 AICc or QAICc units of the top model for each of the datasets (regional, subregional, and postfire). We estimated occupancy, colonization, and extinction for each dataset using the top model. Relationships between covariates and estimated occupancy, colonization, and extinction are plotted based on the top model for each dataset, or the best-supported model in which that particular covariate appears.
Data analyzed in this report are available in a U.S. Geological Survey data release (Kus and Houston, 2021).
Results
We surveyed for gnatcatchers at 327 regional points in 2020 (table 2). Seven points that were surveyed in 2016 were dropped between years, and two points were excluded from analysis because they lacked vegetation data for 2016. In Orange County, 180 subregional points were surveyed; a landslide at 1 point prevented collection of vegetation data in 2016, so 179 points were analyzed. The San Diego subregional dataset included 180 points in 2020 after 2 points were dropped after 2016 surveys. All 180 were included in the analysis. Between 2016 and 2020, we lost 24 points from the postfire datasets because they burned during the intervening years. In the unburned dataset, five points were lost to fire, and an additional two points were dropped after the 2016 surveys. We lost five points in the unburned dataset to fire, and an additional two points were dropped after the 2016 surveys. We surveyed and analyzed 102 points burned in 2003–06, losing 3 to recent fires, 1 dropped in 2016, and 1 dropped after the initial visit in 2020. From the points burned in 2007–10, we lost 5 to fire, resulting in a total of 106 points analyzed. We surveyed 95 points that were burned in 2011–14 after losing 11 points from that category to the more recent fires. From 80 to 100 percent of the points in each dataset were surveyed three times (table 2). Of the 58 points that were only surveyed twice in 2020, 31 (53 percent) were a result of landowner coronavirus disease 2019 access restrictions.
Table 2.
Sample sizes for points surveyed and analyzed in 2016 and 2020 in regional, subregional, and postfire datasets.[#, number; n, sample size; OC, Orange County; SD, San Diego; —, no data]
Vegetation Composition
Regional and Subregional Points
We compared vegetation structure in 2020 to that in 2016 to describe habitat changes that might affect gnatcatcher occupancy, colonization, and extinction. Both woody and herbaceous vegetation cover increased at the regional, San Diego, and Orange County subregional points (fig. 4). However, individual species and cover types differed in the degree and direction of change during the 4-year period.
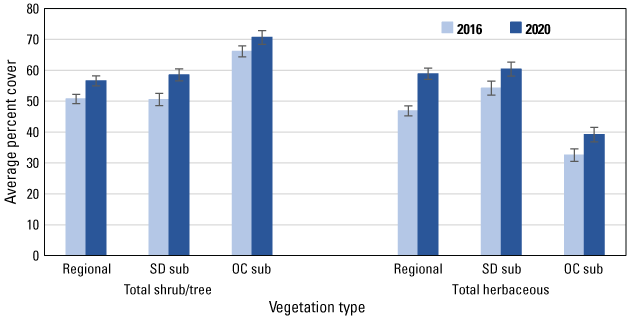
Average percent cover of total shrubs and trees, and total herbaceous vegetation, across regional, San Diego subregional (SD sub), and Orange County subregional (OC sub) points in 2016 and 2020. Bars are standard errors.
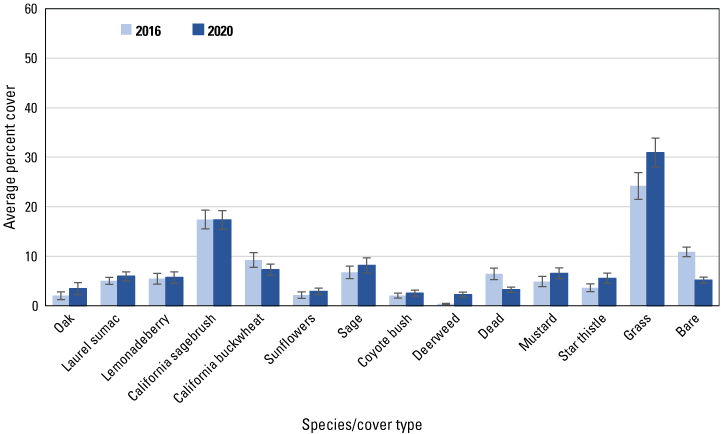
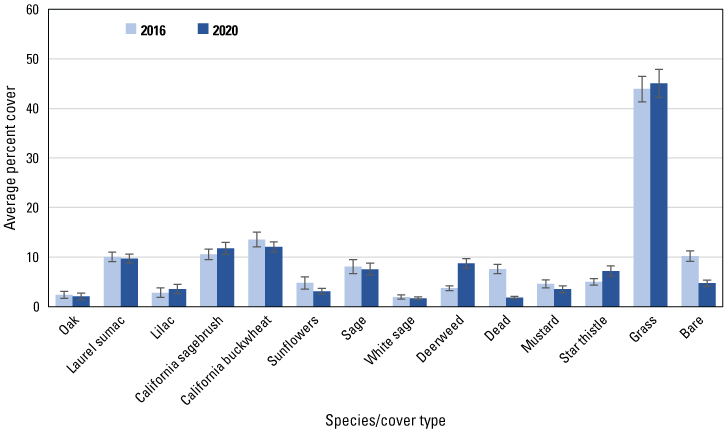
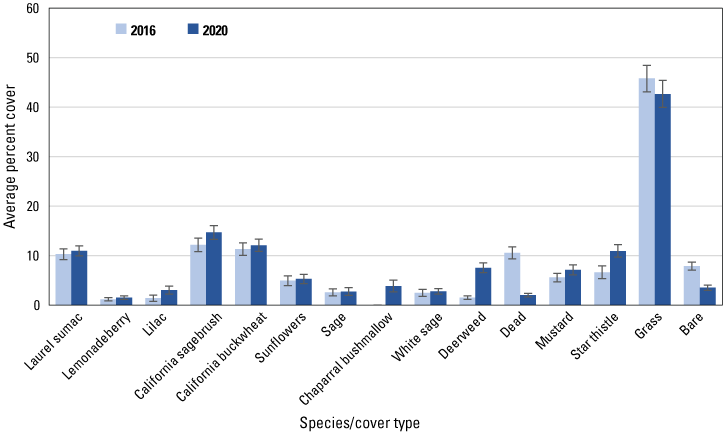
We analyzed 19 species and cover types that averaged at least 1 percent of the cover in each dataset in either 2016 or 2020. Among herbaceous species, cover of deerweed and star thistle increased significantly (based on non-overlapping standard errors) in all three datasets, including the regional (fig. 5), San Diego (fig. 6) and Orange County (fig. 7) subregional points, whereas mustard cover increased at the regional, and in particular, the Orange County subregional points. Increased cover of grass contributed to the overall increase in herbaceous cover at the regional points. Associated with the increase in herbaceous cover was a decline in cover of bare ground in all three datasets, and of dead vegetation at all points except those in the Orange County subregion.
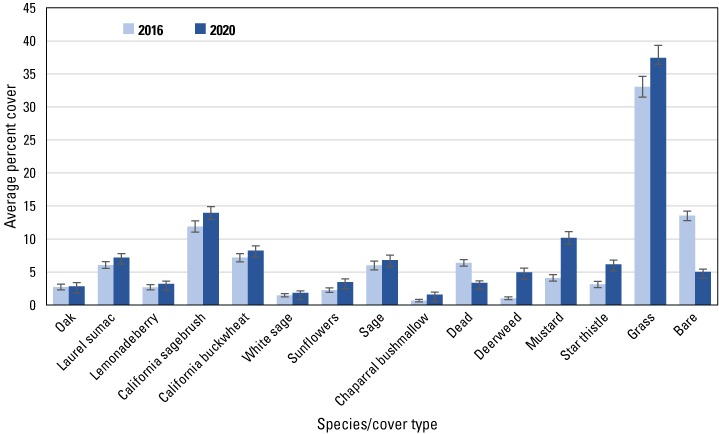
Average percent cover of vegetation species and cover types at regional points in 2016 and 2020. Bars are standard errors.
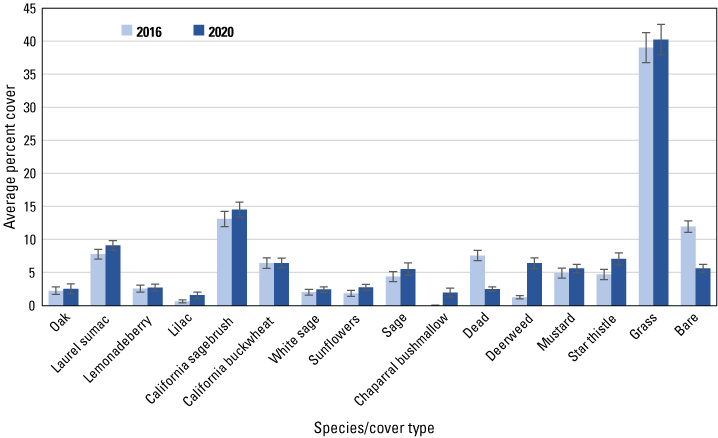
Average percent cover of vegetation species and cover types at San Diego subregional points in 2016 and 2020. Bars are standard errors.
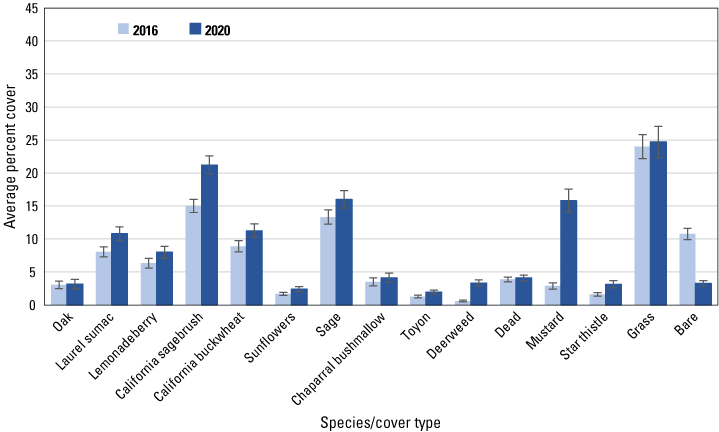
Average percent cover of vegetation species and cover types at Orange County subregional points in 2016 and 2020. Bars are standard errors.
Among woody species, California sagebrush cover increased at the regional (fig. 5) and both subregional points (figs. 6, 7). California buckwheat increased at the regional and Orange County subregional points, and laurel sumac increased in both subregions. In the Orange County subregion, lemonadeberry and sage increased as well.
Postfire Points
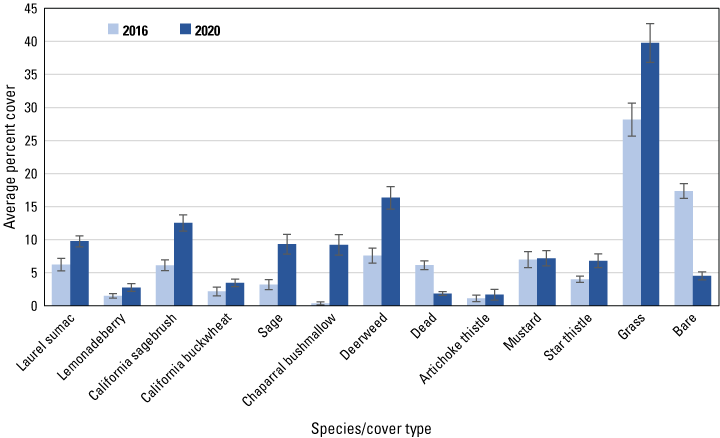
Similar to the regional and subregional points, herbaceous vegetation cover increased at the unburned and burned points (fig. 8) between 2016 and 2020, with increased cover of deerweed and star thistle and decreased cover of bare ground and dead vegetation evident at all points (figs. 9–12). However, unlike at the regional and subregional points, woody vegetation cover at the unburned points did not change between 2016 and 2020, and increases were slight at the burned points, with the exception of the most recently burned (2011–14) points, where total tree/shrub cover increased by 32 percent. With the exception of an increase in California sagebrush at points in the 2007–10 postfire category (fig. 11), none of the individual woody species at unburned points (fig. 9), or at points burned before 2011 (figs. 10, 11), increased in cover. In contrast, nearly every woody species at points burned in 2011–14 increased in cover, including California sagebrush, California buckwheat, laurel sumac, lemonadeberry, sage, and chaparral bushmallow (fig. 12).
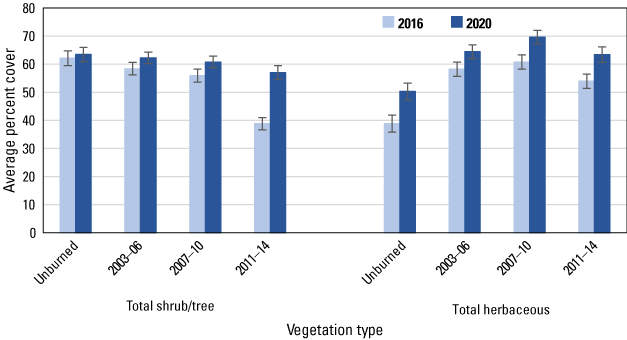
Average percent cover in 2016 and 2020 of total shrubs and trees, and total herbaceous vegetation, at unburned points and points burned in 2003–06, 2007–10, and 2011–14. Bars are standard errors.
Average percent cover in 2016 and 2020 of vegetation species and cover types at unburned points. Bars are standard errors.
Average percent cover in 2016 and 2020 of vegetation species and cover types at points burned in 2003–06. Bars are standard errors.
Average percent cover in 2016 and 2020 of vegetation species and cover types at points burned in 2007–10. Bars are standard errors.
Average percent cover in 2016 and 2020 of vegetation species and cover types at points burned in 2011–14. Bars are standard errors.
Gnatcatcher Habitat Use
Despite differences in habitat structure across the regional, subregional, and postfire sites, gnatcatcher occurrence at points in 2020 was non-random with regard to vegetation composition. As illustrated by the regional dataset (fig. 13), cover of California sagebrush, California buckwheat, and sunflowers was higher on average at points with gnatcatcher detections than at points without detections. Points without gnatcatcher detections supported higher cover of grass and laurel sumac than points where gnatcatchers were detected. These differences were observed in both the Orange County and San Diego subregions, as well as at the unburned points, with the exception that laurel sumac cover did not differ between points with and without gnatcatcher detections in Orange County.
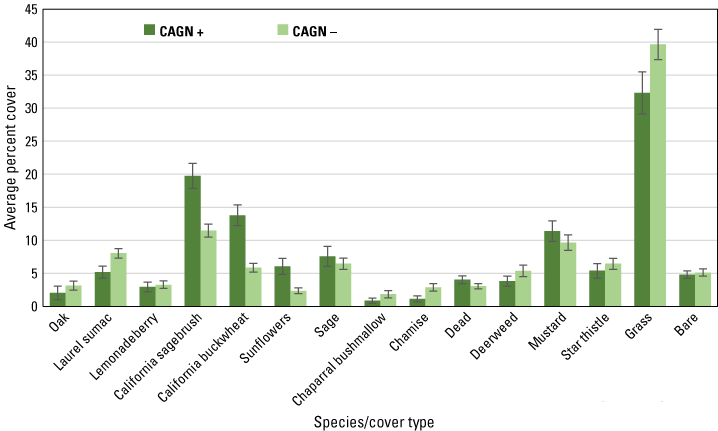
Average percent cover of vegetation and cover types at regional points with and without detections of California Gnatcatchers (CAGN) in 2020. Bars are standard errors.
Among burned points, gnatcatcher occurrence was associated with higher cover of California sagebrush and California buckwheat, and lower cover of laurel sumac, at only the 2007–10 postfire points. At points in the 2003–06 and 2011–14 postfire categories, sage cover was higher at occupied versus unoccupied points, with lemonadeberry an additional species at 2011–14 points for which cover was higher at occupied points.
California Gnatcatcher Occupancy
Detectability
Detectability (p) of California Gnatcatchers under our survey protocol was high, ranging from 0.65 at the San Diego subregional points to 0.74 at the Orange County subregional points. Detectability at postfire points was estimated at 0.69.
Dynamic Occupancy Models
Regional
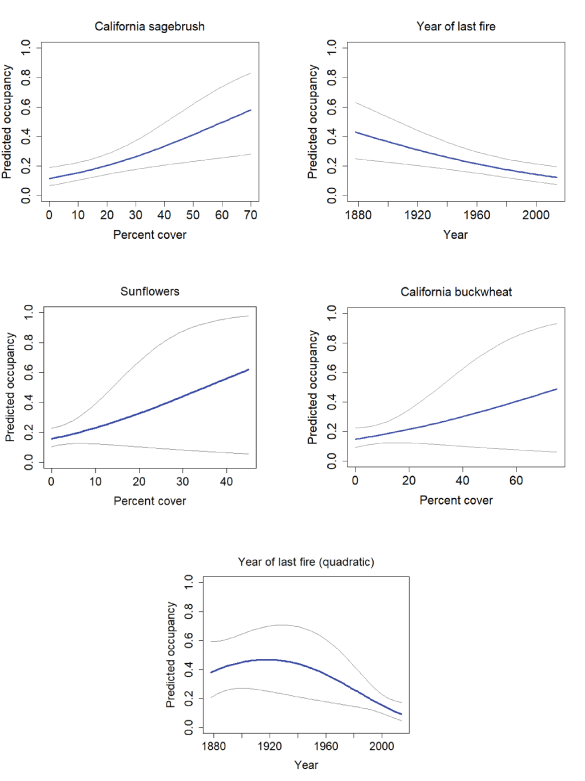
Six global models predicting gnatcatcher occupancy, colonization, and extinction at the regional scale were well-supported (change in AICc relative to best model [∆AICc]≤ 2; table 3). The occupancy component for all six of the top models was the same. Cover of California sagebrush and California buckwheat were positive predictors of occupancy. Total shrub and tree cover was associated with a threshold response, where occupancy increased with increasing cover of shrubs and trees up to about 30–40 percent, then declined thereafter. Total herbaceous cover was negatively related to occupancy. Time since the last fire had a threshold effect, with occupancy increasing with time since fire up to about 70 years postfire, after which occupancy generally plateaued (fig. 14).
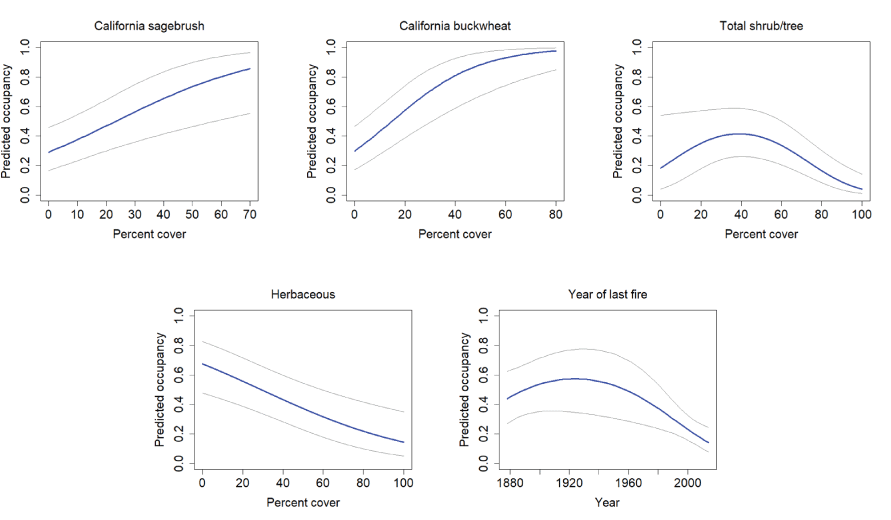
California Gnatcatcher occupancy in relation to vegetation cover and time since last fire (quadratic function; plotted as year of last fire) at regional points in 2016. Gray lines represent 95-percent confidence interval. From model 1; table 3.
Table 3.
Logistic regression models of California Gnatcatcher occupancy (psi), colonization (col), and extinction (ext) in 2016–20 as a function of habitat covariates at the regional scale.[Detection probability (p) constant across models. Models are ranked from best to worst based on Akaike’s Information Criterion adjusted for small sample sizes (AICc), the difference between the model’s AICc and the highest-ranked model’s AICc (ΔAICc), and AICc weights. AICc is based on −2×loge likelihood (logLik) and the number of parameters in the model. Minimum AICc=1,172.0. Only models with ΔAICc ≤2 presented. Abbreviations: df, degrees of freedom; ARCA, California sagebrush; ERFA, California buckwheat; TOTSHRTRE, total shrub/tree cover; TOTHRB, total herbaceous cover; LASTFIRE, time since last fire; SHRBHT, shrub height]
Three models predicting colonization were well-supported (table 3). Time since fire was included in all three models as a threshold effect, with colonization increasing for approximately 70 years after the last fire, after which it decreased. Total herbaceous cover was also included in all three models, with the best-supported model indicating a threshold response where colonization increased slightly with herbaceous cover up to about 30 percent, after which it declined. California buckwheat was included in one model, with colonization increasing with increasing cover, but the confidence interval for the beta estimate overlapped zero (fig. 15).
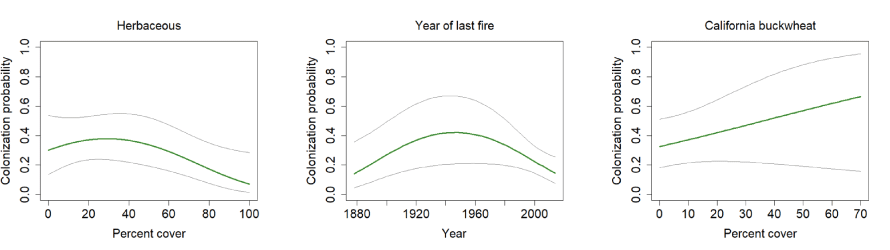
California Gnatcatcher colonization in relation to vegetation cover and time since last fire (quadratic function; plotted as year of last fire) at regional points 2016–20. Gray lines represent 95-percent confidence interval. Figures for herbaceous cover and year of last fire from model 1, figure for California buckwheat from model 4; table 3.
Extinction probability was affected by the cover of California sagebrush and the total cover of trees and shrubs (table 3). Extinction probability decreased with increasing cover of California sagebrush. Total tree and shrub cover had a threshold effect on extinction, with extinction probability decreasing with increasing tree and shrub cover up to about 50 percent, after which extinction probability increased. A positive effect of shrub height received some support, with extinction probability increasing with shrub height above 1 m, but the confidence interval for the beta estimate overlapped zero in every model in which it appeared (fig. 16).
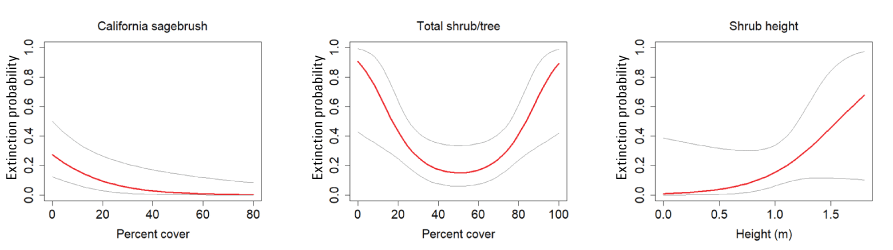
California Gnatcatcher extinction in relation to vegetation cover and shrub height at regional points in 2016–20. Total shrub/tree cover plotted as quadratic function. Gray lines represent 95-percent confidence interval. From model 1; table 3.
San Diego Subregion
There were seven well-supported models of occupancy, colonization, and extinction for the San Diego subregion (table 4). For initial occupancy, California sagebrush was included in six out of seven of the top models, with occupancy increasing with increased cover of sagebrush (fig. 17). Time since last fire was positively associated with occupancy and was included in all seven of the well-supported models. Cover of sunflowers and California buckwheat were less well supported as predictors, but appeared in two and one model, respectively, and were both positively related to initial occupancy (fig. 17).
Table 4.
Logistic regression models of California Gnatcatcher occupancy (psi), colonization (col), and extinction (ext) in 2016–20 as a function of habitat covariates in the San Diego subregion.[Detection probability (p) constant across models. Variance inflation factor (ĉ)=2.3. Models are ranked from best to worst based on Akaike’s Information Criterion adjusted for small sample sizes (AICc), the difference between the model’s QAICc and the highest-ranked model’s QAICc (ΔQAICc), and AICc weights. QAICc is based on −2×loge likelihood (logLik) and the number of parameters in the model. Minimum QAICc=264.1. Only models with ΔQAICc ≤2 presented. Abbreviations: df, degrees of freedom; ARCA, California sagebrush; LASTFIRE, time since last fire; —, no data; “.”, constant; MALA, laurel sumac; SUNFL, sunflowers; ERFA, California buckwheat]
California Gnatcatcher occupancy in relation to vegetation cover and time since last fire (plotted as year of last fire) at San Diego subregional points in 2016. Gray lines represent 95-percent confidence interval. Figures for California sagebrush and year of last fire from model 1, figure for sunflowers from model 3, figure for California buckwheat from model 4, and figure for year of last fire (quadratic) from model 2; table 4.
The best model for colonization was the constant model; however, there was some support for a model that included a positive effect of sunflowers (fig. 18). Laurel sumac was the covariate with the strongest effect on extinction probability, with extinction risk increasing to 100 percent with cover of sumac above 20 percent. However, although sumac was included in all of the well-supported models, the confidence interval for the beta overlapped zero. Time since last fire received some support, with extinction probability increasing with recency of fire (fig. 19).
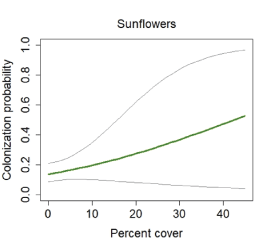
California Gnatcatcher colonization in relation to cover of sunflowers at San Diego subregional points during 2016–20. Gray lines represent 95-percent confidence interval. Figure from model 5; table 4.
California Gnatcatcher extinction in relation to cover of laurel sumac and time since fire (plotted as year of last fire) at San Diego subregional points in 2016–20. Gray lines represent 95-percent confidence interval. Figure for laurel sumac from model 1, figure for year of last fire from model 6; table 4.
Orange County Subregion
Eight models were well-supported for gnatcatcher occupancy, colonization, and extinction in the Orange County subregion (table 5). Initial occupancy was positively associated with cover of California sagebrush, California buckwheat, and sunflowers, and was negatively associated with elevation (fig. 20). There was also support for a positive effect of bare ground on occupancy, although the confidence interval for the beta estimate for bare ground overlapped zero.
Table 5.
Logistic regression models of California Gnatcatcher occupancy (psi), colonization (col), and extinction (ext) in 2016–20 as a function of habitat covariates in the Orange County subregion.[Detection probability (p) constant across models. Models are ranked from best to worst based on Akaike’s Information Criterion adjusted for small sample sizes (AICc), the difference between the model’s AICc and the highest-ranked model’s AICc (ΔAICc), and AICc weights. AICc is based on −2×loge likelihood (logLik) and the number of parameters in the model. Minimum AICc=756.1. Only models with ΔAICc ≤2 presented. Abbreviations: df, degrees of freedom; ARCA, California sagebrush; ERFA, California buckwheat; SUNFL, sunflowers; BARE, bare ground; ELEV, elevation; “.”, constant]
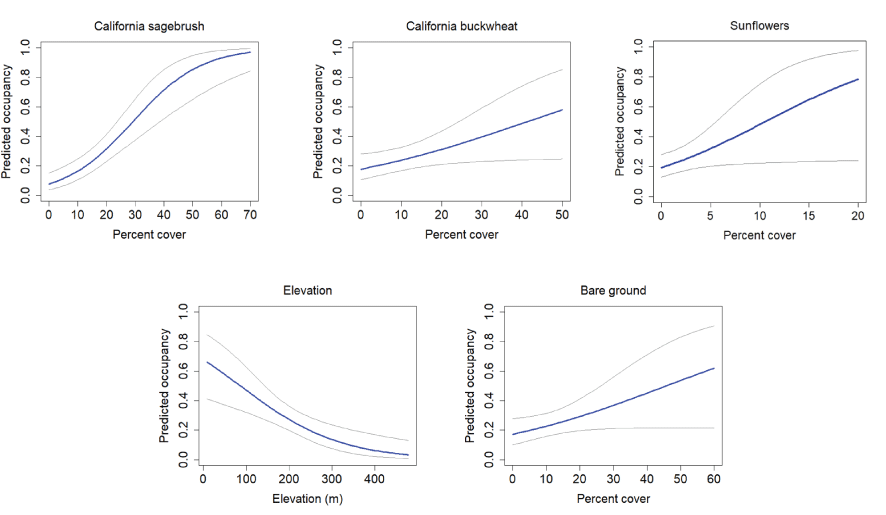
California Gnatcatcher occupancy in relation to vegetation cover at Orange County subregional points in 2016. Gray lines represent 95-percent confidence interval. From model 1; table 5.
The top models for colonization included a positive effect of California sagebrush (fig. 21); however, there was also some support for constant colonization and for a positive effect of California buckwheat in the Orange County subregion. California sagebrush was also an important contributor to all well-supported models for extinction probability, with extinction probability declining with increasing cover of sagebrush up to about 50 percent, and then approaching an asymptote near zero. There was also some support for an effect of sunflower cover, with extinction risk increasing with cover below 30–40 percent, and for bare ground, with extinction increasing below about 40–50 percent (fig. 22).
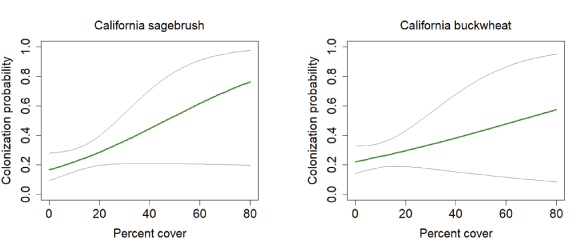
California Gnatcatcher colonization in relation to vegetation cover at Orange County subregional points in 2016–20. Gray lines represent 95-percent confidence interval. Figure for California sagebrush from model 1, figure for California buckwheat from model 7; table 5.
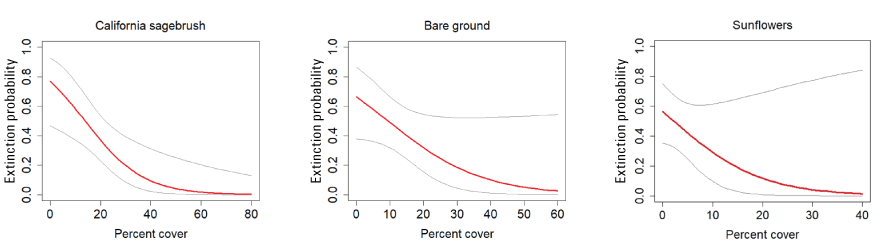
California Gnatcatcher extinction in relation to vegetation cover at Orange County subregional points in 2016–20. Gray lines represent 95-percent confidence interval. Figures for California sagebrush and bare ground from model 1, figure for sunflower from model 2; table 5.
Postfire
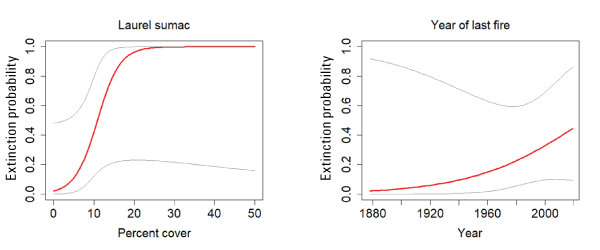
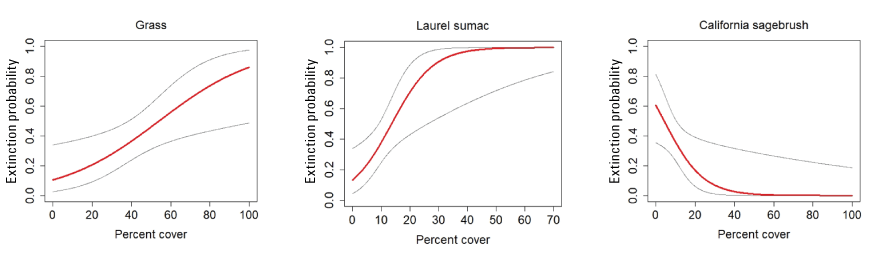
Four models for occupancy, colonization, and extinction in postfire habitat received strong support (table 6). California sagebrush and sunflowers appeared in all models with a positive effect on occupancy. In contrast, laurel sumac, also in all models, had a negative effect on occupancy. There was additional support for a positive effect of California buckwheat and sage and a negative effect of grass and cover of other herbaceous vegetation (fig. 23). The relationships between vegetation covariates and occupancy, colonization, and extinction were similar across the fire categories; figures presented are for the unburned category.
Table 6.
Logistic regression models of California Gnatcatcher occupancy (psi), colonization (col), and extinction (ext) in 2016–20 as a function of habitat covariates in postfire habitat.[Fire category (unburned, burned 2003–06, 2007–10, 2011–14) was included as a categorical variable (FIRE) in each model to obtain estimates of occupancy, colonization, and extinction for each fire category. Detection probability (p) constant across models. Models are ranked from best to worst based on Akaike’s Information Criterion adjusted for small sample sizes (AICc), the difference between the model’s AICc and the highest-ranked model’s AICc (ΔAICc), and AICc weights. AICc is based on −2×loge likelihood (logLik) and the number of parameters in the model. Minimum AICc=1,392.1. Only models with ΔAICc ≤2 presented. Abbreviations: df, degrees of freedom; ARCA, California sagebrush; MALA, laurel sumac; SAGE, sage (=black sage in this dataset); SUNFL, sunflowers; OTHHRB, other herbaceous; GRASS, non-native grass; ERFA, California buckwheat]
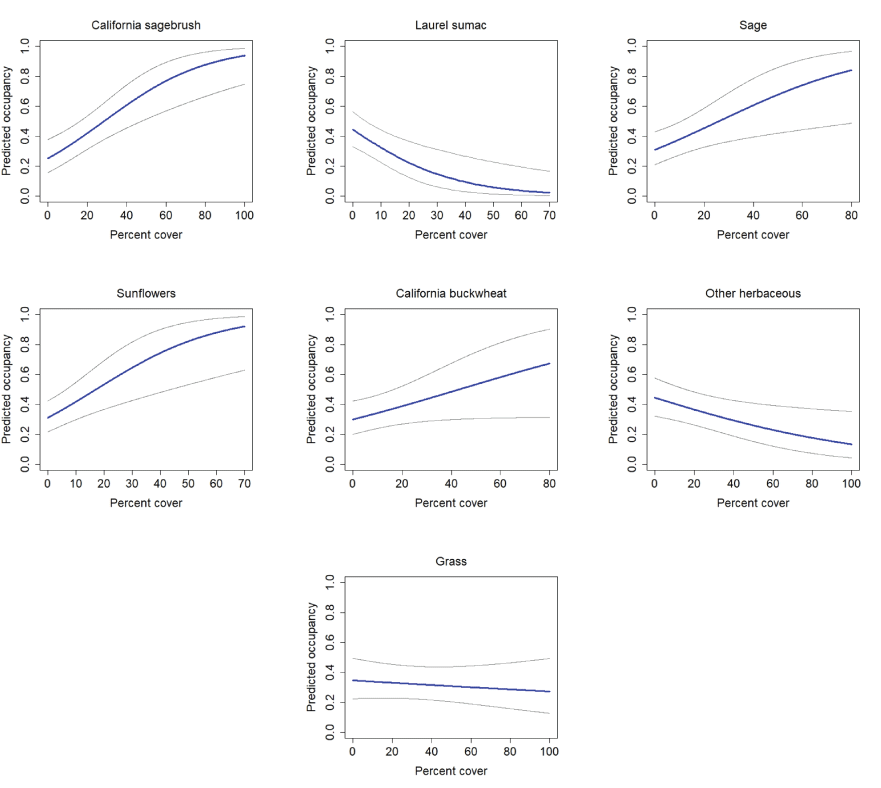
California Gnatcatcher occupancy in relation to vegetation cover at unburned points in 2016. Gray lines represent 95-percent confidence interval. Figures for California sagebrush, laurel sumac, sage, and sunflowers from model 1, figures for California buckwheat and other herbaceous from model 2, and figure for grass from model 3; table 6.
Cover of other herbaceous vegetation was the only vegetation covariate predicting colonization at postfire points, where colonization declined with increasing herbaceous cover (fig. 24). Cover of grass, laurel sumac, and California sagebrush were included in all models predicting extinction. Cover of grass and laurel sumac were associated with increased extinction risk, whereas extinction risk declined with increasing cover of California sagebrush up to 40 percent, and then approached an asymptote near zero (fig. 25).
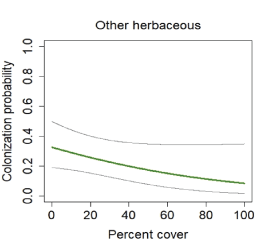
California Gnatcatcher colonization in relation to cover of other herbaceous vegetation at unburned points in 2016–20. Gray lines represent 95-percent confidence interval. Figure from model 1; table 6.
California Gnatcatcher extinction in relation to vegetation cover at unburned points in 2016–20. Gray lines represent 95-percent confidence interval. Figures from model 1; table 6.
A comparison of the covariates in the best supported models predicting occupancy, colonization, and extinction in the regional, subregional, and postfire datasets is presented in table 7.
Table 7.
Comparison of covariates in best supported models (∆AICc or ∆QAICc≤2) predicting California Gnatcatcher occupancy (psi), colonization (col), and extinction (ext) in 2016–20 in the regional, San Diego (SD) subregional, Orange County (OC) subregional, and postfire datasets.[+ indicates a positive effect, − a negative effect, +/− indicates a threshold effect where the initial effect is positive, and −/+ indicates a threshold effect where the initial effect is negative. Abbreviation: “.”, not applicable]
The 95-percent confidence interval of the beta estimate for covariate does not include 0 in the top model in which it appears; see tables 3–6 and figures 14–25.
Occupancy
Gnatcatcher occupancy differed across regional and subregional scales and was higher in the Orange County subregion than in the San Diego subregion and the region as a whole (fig. 26). Occupancy increased by 21 (Orange County) to 35 (San Diego) percent between 2016 and 2020.
Gnatcatcher occupancy in burned habitat varied with time since fire (fig. 27). In 2015, occupancy was highest in habitat burned the longest ago (2003–06), where gnatcatchers occupied 24 percent of points. Occupancy of points burned in 2007–10 was lower, at 15 percent, while just 2 percent of points last burned in 2011–14 were occupied. By 2016, occupancy had doubled in the two most recent burn categories but was unchanged in the oldest burn category. Occupancy of points burned in 2011–14 continued to increase, tripling between 2016 and 2020; in contrast, occupancy remained stable at points burned in 2007‒10, and declined at points burned in 2003–06. Occupancy in unburned habitat increased by 19 percent between 2016 and 2020 and was higher than that in any other dataset in both years.
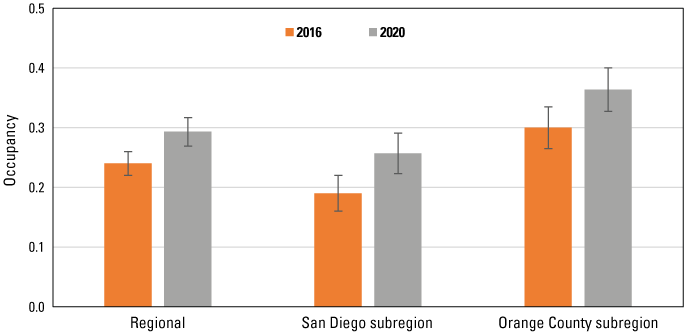
Occupancy of California Gnatcatchers at regional and subregional points in 2016 and 2020. Bars are standard errors. Occupancy estimated from the top model for each dataset; see tables 3‒5.
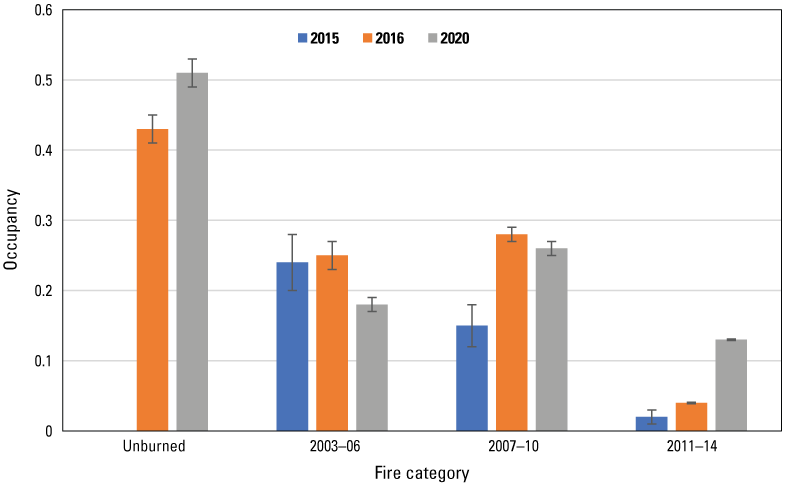
Occupancy of California Gnatcatchers in 2015, 2016, and 2020 as a function of time since fire. Bars are standard errors. Occupancy in 2015 estimated from model with constant occupancy and detection probabilities (Kus and others, 2024). Occupancy in 2016 and 2020 estimated from the top model in the postfire dataset; see table 6. Unburned points were not surveyed in 2015.
Discussion
Coastal sage scrub habitat underwent changes between the last rangewide gnatcatcher surveys in 2016 and those in 2020. Cover of both woody and herbaceous vegetation increased at regional, subregional, and postfire sites, probably a reflection of above-average precipitation during two years (2017, 2019) preceding the 2020 surveys. Precipitation in 2017 interrupted a period of prolonged drought in southern California that had adverse effects on coastal sage scrub habitat and likely contributed to comparatively low occupancy in 2016. The most dramatic increase in vegetation cover in 2020 occurred at points in the most recently burned (2011–14) areas, an encouraging sign that postfire habitat recovery is underway. In contrast, woody vegetation cover changed little in unburned habitat, although herbaceous cover increased.
Among species, most of the increase in woody cover was attributable to increases in California sagebrush and California buckwheat, species favored by gnatcatchers, and laurel sumac, which is negatively associated with gnatcatcher occupancy (Winchell and Doherty, 2018; Kus and others, 2024). Vegetation growth was documented for more woody species in Orange County than in San Diego County and the region as a whole, with increases not only in California sagebrush and California buckwheat, but in sage and lemonadeberry as well. Similarly, virtually every shrub species sampled at the 2011–14 postfire points increased in cover, contributing to the large overall increase in woody vegetation at those points.
As in 2016 (Kus and others, 2024), gnatcatchers occupied habitat non-randomly, selecting sites with higher cover of California sagebrush and California buckwheat, and lower cover of laurel sumac and non-native grass. These habitat preferences were evident in 2020 even with increased vegetation cover. Cover of sunflowers was also positively associated with gnatcatcher presence at regional, subregional, and unburned points. Gnatcatchers in habitat burned in 2003–06 preferentially used points with higher sage cover, as did birds in recently burned habitat. Sage cover averaged 2–3 times higher at the 2003–06 and 2011–14 postfire points, respectively, than at the 2007–10 points. At the recently burned sites, sage and lemonadeberry appeared to replace California sagebrush and California buckwheat as correlates of gnatcatcher occurrence, even though cover of California sagebrush (although not California buckwheat) was comparable to that at other postfire points by 2020.
Accompanying increases in vegetation cover were increases in gnatcatcher occupancy at regional and subregional scales, where occupancy increased by 21–35 percent since 2016. Occupancy also increased in unburned habitat, where changes in woody vegetation were slight. It is likely that both increased habitat suitability and high gnatcatcher productivity after wet years contributed to population growth at these sites. The greatest increase in occupancy was documented for points that burned in 2011–14, where gnatcatcher occupancy increased by 225 percent, from 4 percent in 2016 to 13 percent in 2020. Although occupancy remains low at these recently burned points, the increase is a positive indication that gnatcatchers are responding to favorable changes in habitat associated with precipitation. In contrast, occupancy remained essentially stable at points burned in 2007–10 and declined by 28 percent at the 2003–06 postfire points. Although overall woody vegetation increased at these sites, the increases generally did not include species favored by gnatcatchers, such as California sagebrush, California buckwheat, and sage.
Modelling occupancy using covariates generally reflected the bird-habitat associations detected in examination of the vegetation data and allowed us to incorporate physical variables into our analyses (Kus and others, 2024). Cover of California sagebrush was the strongest predictor of occupancy in every dataset. Previous studies have documented the association of gnatcatchers with sagebrush-dominated sage scrub (Atwood and others, 1998; Atwood and Bontrager, 2020), and modelling of gnatcatcher occupancy in unburned habitat in San Diego County (Winchell and Doherty, 2018) identified California sagebrush as a positive predictor. California buckwheat was also a predictor of occupancy in every dataset, and sunflowers were a predictor in the two subregional and postfire datasets. At the regional scale, total herbaceous cover was a negative predictor of occupancy, whereas total shrub/tree cover produced a threshold response where occupancy increased up to about 40 percent cover and then declined. Similarly, we detected a threshold response of gnatcatchers at regional points to time since last fire, with occupancy increasing with time since fire up to about 70 years and then plateauing. Time since fire was a top predictor of occupancy in the San Diego subregion, reflecting the effect of multiple fires during the last 20 years on gnatcatcher habitat; this effect was reflected in the regional model as well.
Cover of laurel sumac and black sage were additional strong predictors of occupancy in postfire habitats. Previously hypothesized to be a positive predictor of occupancy because its thermal tolerance coincides with that of the gnatcatcher (Mock, 1998), laurel sumac was determined instead to be a negative predictor in San Diego County (Winchell and Doherty, 2018; Kus and others, 2024). Laurel sumac resprouts readily after fire (Kirkpatrick and Hutchinson, 1980), and at our burned plots, co-dominated the recovering woody vegetation along with California sagebrush and California buckwheat. Although providing shrub cover initially, rapid spread of laurel sumac may inhibit the recovery of species more favored by gnatcatchers and reduce habitat suitability long-term. At our plots, laurel sumac cover exceeded that in unburned habitat within 5 years postfire and was more than twice as high by 9 years postfire (Kus and others, 2024). Our results showed declining occupancy as cover of laurel sumac increased to about 50–60 percent, above which the probability of occupancy was minimal. Black sage, in contrast, was determined to be a positive predictor of occupancy at postfire points. Like laurel sumac, black sage resprouts quickly after fire, providing a shrub component to the recovering vegetation. However, unlike laurel sumac, at our plots, sage cover remained comparable to that in unburned habitat even 17 years postfire and did not appear to be excluding other shrubs favored by gnatcatchers (Kus and others, 2024).
Non-native grass and other herbaceous cover were also strong negative predictors of gnatcatcher occupancy at postfire points, making more explicit the relationship between occupancy and total herbaceous cover seen at the regional scale. Postfire invasion of grass may inhibit seedling establishment of shrubs preferred by gnatcatchers (Eliason and Allen, 1997), changing the structure and composition of coastal sage scrub, and in extreme cases, leading to type conversion to grasslands (Minnich and Dezzani, 1998; Keeley and others, 2005; Talluto and Suding, 2008; Fleming and others, 2009). At our burned plots, grass and other herbaceous vegetation not only established quickly after fires but increased with time since fire (Kus and others, 2024), although unexpectedly, grass was not a significant contributor to increased total herbaceous cover between 2016 and 2020 outside of the regional, unburned, and 2011–14 burned points.
We found little support for effects of physical variables on occupancy outside of a negative effect of elevation in the Orange County subregion. There, occupancy declined with increasing elevation over a range of 8–450 m, consistent with findings by Atwood and Bolsinger (1992), who determined that all of 68 gnatcatcher occurrences in coastal Orange County between 1960 and 1990 were below 500 m in elevation. Bare ground received some support for an effect on occupancy in Orange County, where occupancy increased with cover of bare ground up to about 60 percent.
Covariates that were strong positive predictors of occupancy were also positive predictors of colonization and (or) negative predictors of extinction, and vice versa. For example, California sagebrush, a significant positive predictor of occupancy in all four datasets, was a negative predictor of extinction at regional, Orange County subregional, and postfire points, and a positive predictor of colonization at Orange County points. Similarly, California buckwheat was a positive predictor of both occupancy and colonization at regional and Orange County points. Among regional points, the effects of total herbaceous cover and time since last fire were similar for occupancy and colonization, whereas the threshold effect of total shrub and tree cover on occupancy was opposite that on extinction.
Outside of California sagebrush, California buckwheat, and total herbaceous cover, we found few covariates influencing colonization. Cover of other herbaceous vegetation was a negative predictor of colonization and occupancy at postfire points. Cover of sunflowers received some support as a predictor of both parameters in the San Diego subregion; however, most models for that dataset indicated that colonization was constant across points and unrelated to vegetation. In contrast, we identified many more determinants of extinction risk. Cover of laurel sumac and time since last fire had positive and negative effects, respectively, on extinction in the San Diego subregion. At postfire points, laurel sumac and grass cover were positive contributors to extinction risk, in addition to the negative effect of California sagebrush stated earlier. In the Orange County subregion, cover of sunflowers and bare ground reduced extinction, opposite to their effects on occupancy. The relationship with bare ground may reflect the absence of herbaceous vegetation, which is lower overall in Orange County than in San Diego County and the region as a whole. Shrub height received some support as a predictor of extinction at the regional scale, where extinction increased with increasing shrub height above 1 m.
Winchell and Doherty (2018) analyzed gnatcatcher occupancy, colonization, and extinction in unburned high and very high-quality habitat in San Diego County in 2004–09, evaluating several of the species we analyzed in our study. They determined California sagebrush to be a positive predictor of occupancy and colonization, and laurel sumac to be a negative predictor of occupancy and a positive predictor of extinction, consistent with our findings. Winchell and Doherty (2018) also documented a slight negative effect of “openness” (lack of shrub and tree cover) on occupancy and a stronger negative effect on extinction probability. Although not directly comparable to openness, bare ground in our study received some support as a negative predictor of extinction, but a positive predictor of occupancy, in just one dataset (Orange County subregion). Black sage was a predictor of occupancy at our postfire points, but not of colonization or extinction in either our study or that of Winchell and Doherty (2018) in unburned habitat. Winchell and Doherty (2018) found no support for an effect of invasive non-native grasses and herbs on gnatcatcher occupancy, colonization, or extinction, in contrast to our findings of effects on all three parameters, particularly in burned habitats. The focus of the Winchell and Doherty (2018) study on unburned habitat may have restricted their sites to those with a narrow range of non-native vegetation cover relative to the sites in our study.
Gnatcatcher status in areas that burned in 2003–06 is a matter of conservation concern. Not only is occupancy a third of that in unburned habitat and two-thirds of that in areas that burned 4 years more recently, it declined in 2020 despite favorable precipitation conditions that enhanced other sites. California sagebrush, sunflowers, sage, and California buckwheat, the strongest positive predictors of occupancy at postfire points, did not change in cover between 2016 and 2020, unlike at other sites. Cover of California buckwheat, sage, and sunflowers at 2003–06 points is higher than or comparable to cover of these species at other postfire points, unburned points, and the San Diego subregion, so it is unlikely that low cover of these preferred species is limiting occupancy. However, cover of California sagebrush at the 2003–06 points is somewhat lower than at these other sites and may be playing a role in limiting occupancy. Conditions during the 1–2 years postfire, when re-sprouting and seedling establishment of California sagebrush typically occurs, differed between the 2003 and 2007 fires, and may explain differences in postfire vegetation composition. The 2007 fire was followed by a year of below-average precipitation and a subsequent year of average precipitation. Although the 2003 fire was similarly followed by a drought year, the second year postfire was the third wettest year on record for San Diego since 1850 (Climatestations.com, 2024). Although precipitation promotes germination of California sagebrush seedlings, the benefit is essentially negated by the competitive effects of non-native herbaceous vegetation that flourishes during wet years (Thomson and others, 2021). Low recruitment of California sagebrush during the critical postfire window may have limited the long-term potential for sagebrush recovery at sites burned in 2003–06.
Given the large footprint of the 2003 fire, which burned 16 percent of the suitable gnatcatcher habitat in San Diego County, it is possible that recolonization is occurring slowly because much of the recovering habitat is remote from sources of colonizers. Winchell and Doherty (2008) proposed that recolonization of burned areas proceeds from the perimeter inward and is dependent on proximity to a source of colonizers. Burned areas close to occupied habitat are likely to be recolonized faster than those more distant from a source of colonizers (Bontrager and others, 1995). Further examination of birds and vegetation in postfire sites will be important to understanding patterns of recovery and the processes underlying them.
Conclusion
Our rangewide surveys for California Gnatcatchers reveal spatial and temporal patterns in occupancy that reflect the effects of wildfire and precipitation. Geographically, occupancy is higher in Orange County than in fire-ravaged San Diego County, where time since last fire is the most significant predictor of occupancy. Occupancy at regional and subregional points increased over time in association with increased cover of woody vegetation attributable to above-average annual precipitation. However, occupancy at postfire points did not respond uniformly to precipitation, indicating that additional factors are at play. Although increased occupancy at recently burned points (2011–14) is an encouraging sign of recovery, static or declining occupancy at older postfire points raises questions regarding the mechanisms of recolonization and how these might vary geographically and temporally. Further examination of birds and vegetation in postfire sites will be important to understanding patterns of recovery and the processes underlying them.
Surveys done in 2016 and repeated in 2020 allowed us to begin exploring occupancy dynamics of California Gnatcatchers throughout their range. In general, factors that promoted occupancy also promoted colonization and reduced the probability of extinction; however, these should be viewed as preliminary assessments that will be improved with data from future surveys.
References Cited
Arnold, T.W., 2010, Uninformative parameters and model selection using Akaike’s Information Criterion: The Journal of Wildlife Management, v. 74, no. 6, p. 1175–1178. [Available at https://doi.org/10.1111/j.1937-2817.2010.tb01236.x.]
Atwood, J.L., and Bontrager, D.R., 2020, California Gnatcatcher (Polioptila californica), version 1.0 in Poole, A.F., and Gill, F.B., eds., Birds of the world: Ithaca, N.Y., Cornell Lab of Ornithology, accessed August 14, 2023, at https://doi.org/10.2173/bow.calgna.01.
Bontrager, D.R., Erickson, R.A., and Hamilton, R.A., 1995, Impacts of the October 1993 Laguna Canyon Fire on California gnatcatchers and cactus wrens in Keeley, J.E., and Scott, T., eds., Brushfires in California wildlands—Ecology and resource management: Fairfield, Wash., International Association of Wildland Fire, p. 69–76.
California Department of Fish and Game, 2004, Findings of fact under the California Environmental Quality Act and the Natural Community Conservation Planning Act and Natural Community Conservation Plan permit for the Western Riverside Multiple Species Habitat Conservation Plan: California Department of Fish and Game, 125 p. [Available at https://nrm.dfg.ca.gov/FileHandler.ashx?DocumentID=34027&inline.]
ClimateStations.com, 2024, San Diego, CA, accessed February 29, 2024, at https://www.climatestations.com/san-diego-ca/.
Eliason, S.A., and Allen, E.B., 1997, Exotic grass competition in suppressing native shrubland re-establishment: Restoration Ecology, v. 5, no. 3, p. 245–255. [Available at https://doi.org/10.1046/j.1526-100X.1997.09729.x.]
Environmental Systems Research Institute, 2024, Collector for ArcGIS: Redlands, Calif., Environmental Systems Research Institute, accessed January 9, 2024, at https://doc.arcgis.com/en/collector-classic.
Fiske, I., and Chandler, R., 2011, Unmarked—An R package for fitting hierarchical models of wildlife occurrence and abundance: Journal of Statistical Software, v. 43, no. 10, p. 1–23. [Available at https://doi.org/10.18637/jss.v043.i10.]
Fleming, G.M., Diffendorfer, J.E., and Zedler, P.H., 2009, The relative importance of disturbance and exotic-plant abundance in California coastal sage scrub: Ecological Applications, v. 19, no. 8, p. 2210–2227. [Available at https://doi.org/10.1890/07-1959.1.]
Keeley, J.E., Fotheringham, C.J., and Baer-Keeley, M., 2005, Determinants of postfire recovery and succession in Mediterranean-climate shrublands of California: Ecological Applications, v. 15, no. 5, p. 1515–1534. [Available at https://doi.org/10.1890/04-1005.]
Kirkpatrick, J.B., and Hutchinson, C.F., 1980, The environmental relationships of Californian coastal sage scrub and some of its component communities and species: Journal of Biogeography, v. 7, no. 1, p. 23–38. [Available at https://doi.org/10.2307/2844545.]
Kus, B.E., and Houston, A., 2021, Rangewide occupancy and post-fire recovery of California gnatcatchers in southern California (ver. 2.0, March 2023): U.S. Geological Survey data release. [Available at https://doi.org/10.5066/F7PC30JX.]
Kus, B.E., Preston, K.L., and Houston, A., 2024, Rangewide occupancy of a flagship species, the Coastal California Gnatcatcher (Polioptila californica) in southern California—Habitat associations and recovery from wildfire: PLoS ONE, v. 19, no. 7, article e0306267, 35 p. [Available at https://doi.org/10.32942/X2J611.]
MacKenzie, D.I., and Bailey, L.L., 2004, Assessing the fit of site-occupancy models: Journal of Agricultural, Biological, and Environmental Statistics, v. 9, no. 3, p. 300–318. [Available at https://doi.org/10.1198/108571104X3361.]
R.J. Meade Consulting, Inc., 1996, Central and coastal subregion natural community conservation plan/habitat conservation plan, parts I & II—NCCPO/HCP, final (administrative record copy): Prepared for County of Orange Environmental Management Agency and United States Fish and Wildlife Service, California Department of Fish and Game.
Miller, W.B., and Winchell, C.S., 2016, A comparison of point-count and area-search surveys for monitoring site occupancy of the coastal California Gnatcatcher (Polioptila californica californica): The Condor, v. 118, no. 2, p. 329–337. [Available at https://doi.org/10.1650/CONDOR-15-67.1.]
Preston, K.L., Perkins, E.E., and Kus, B.E., 2020, Coastal California gnatcatcher habitat suitability model for southern California (2015): U.S. Geological Survey data release, accessed August 14, 2023, at https://doi.org/10.5066/P9SJRU51.
R Core Team, 2018, R—A language and environment for statistical computing: Vienna, Austria, R Foundation for Statistical Computing, accessed August 14, 2023, at http://www.R-project.org.
Talluto, M.V., and Suding, K.N., 2008, Historical change in coastal sage scrub in southern California, USA in relation to fire frequency and air pollution: Landscape Ecology, v. 23, p. 803–815. [Available at https://doi.org/10.1007/s10980-008-9238-3.]
Thomson, D.M., Meyer, W.M., III, and Whitcomb, I.F., 2021, Non-native plant removal and high rainfall years promote post-fire recovery of Artemisia californica in southern California sage scrub: PLoS ONE, v. 16, no. 7, article no. e0254398. [Available at https://doi.org/10.1371/journal.pone.0254398.]
Winchell, C.S., and Doherty, P.F., Jr., 2008, Using California Gnatcatcher to test underlying models in habitat conservation plans: The Journal of Wildlife Management, v. 72, no. 6, p. 1322–1327. [Available at https://doi.org/10.2193/2006-356.]
Winchell, C.S., and Doherty, P.F., Jr., 2014, Effects of habitat quality and wildfire on occupancy dynamics of Coastal California Gnatcatcher (Polioptila californica californica): The Condor, v. 116, no. 4, p. 538–545. [Available at https://doi.org/10.1650/CONDOR-13-156.1.]
Winchell, C.S., and Doherty, P.F., Jr., 2018, Restoring habitat for coastal California Gnatcatchers (Polioptila californica californica): The Condor, v. 120, no. 3, p. 581–595. [Available at https://doi.org/10.1650/CONDOR-17-221.1.]
Conversion Factors
Datum
Horizontal coordinate information is referenced to the World Geographic System of 1984 (WGS 84) unless otherwise noted.
For more information concerning the research in this report, contact the
Director, Western Ecological Research Center
U.S. Geological Survey
3020 State University Drive East
Sacramento, California 95819
https://www.usgs.gov/centers/werc
Publishing support provided by the U.S. Geological Survey
Science Publishing Network, Sacramento Publishing Service Center
Disclaimers
Any use of trade, firm, or product names is for descriptive purposes only and does not imply endorsement by the U.S. Government.
Although this information product, for the most part, is in the public domain, it also may contain copyrighted materials as noted in the text. Permission to reproduce copyrighted items must be secured from the copyright owner.
Suggested Citation
Kus, B.E., Houston, A., and Preston, K.L., 2024, Occupancy dynamics of the Coastal California Gnatcatcher in southern California: U.S. Geological Survey Open-File Report 2024–1015, 34 p., https://doi.org/10.3133/ofr20241015.
ISSN: 2331-1258 (online)
Study Area
| Publication type | Report |
|---|---|
| Publication Subtype | USGS Numbered Series |
| Title | Occupancy dynamics of the California Gnatcatcher in southern California |
| Series title | Open-File Report |
| Series number | 2024-1015 |
| DOI | 10.3133/ofr20241015 |
| Publication Date | August 26, 2024 |
| Year Published | 2024 |
| Language | English |
| Publisher | U.S. Geological Survey |
| Publisher location | Reston, VA |
| Contributing office(s) | Western Ecological Research Center |
| Description | Report: viii, 34 p.; Data Release |
| Country | United States |
| State | California |
| Online Only (Y/N) | Y |