

Groundwater, Surface-Water, and Water-Chemistry Data, Black Mesa Area, Northeastern Arizona—2019–2021
Links
- Document: Report (10 MB pdf) , HTML , XML
- NGMDB Index Page: National Geologic Map Database Index Page (html)
- Download citation as: RIS | Dublin Core
Abstract
The Navajo (N) aquifer is an extensive aquifer and the primary source of groundwater in the 5,400-square-mile Black Mesa area in northeastern Arizona. Water availability is an important issue in the Black Mesa area because of the arid climate, past industrial water use, and continued water requirements for municipal use by a growing population. Precipitation in the area typically ranges from less than 6 to more than 16 inches per year, depending on location.
The U.S. Geological Survey water-monitoring program in the Black Mesa area began in 1971 and provides information about the long-term effects of groundwater withdrawals from the N aquifer for industrial and municipal uses. This report presents the results of data collected as part of the monitoring program in the Black Mesa area from calendar years 2020–2021 and, additionally, uses streamflow statistics from November and December 2019. The monitoring program includes measurements of (1) groundwater withdrawals (pumping), (2) groundwater levels, (3) spring discharge, (4) surface-water discharge, and (5) groundwater chemistry.
In calendar year 2020, total groundwater withdrawals were estimated to be 2,680 acre-feet (acre-ft), and, in 2021, total withdrawals were estimated to be 2,570 acre-ft. Total withdrawals during 2021 were about 65 percent less than total withdrawals in 2005 because the Peabody Western Coal Company discontinued its use of water to transport coal in a coal slurry pipeline after 2005 and ceased mining operations in 2019.
Owing to Navajo Nation and Hopi Reservation access restrictions during the Coronavirus pandemic, water levels were not collected from municipal wells in 2020 or 2021. Water levels measured in 2021 from wells completed in the unconfined areas of the N aquifer within the Black Mesa area showed a decline in 7 of 13 wells when compared with water levels from the prestress period (prior to 1965). The changes in water levels across all 13 wells ranged from +8.4 feet (ft) to −42.4 ft, and the median change was −0.4 ft. Water levels also showed decline in 11 of 12 wells measured in the confined area of the aquifer when compared to the prestress period. The median change for the confined area of the aquifer was −25.9 ft, with changes across all 12 wells ranging from +17.3 ft to −133.7 ft.
Spring flow was measured at four springs between 2020 and 2021. Flow fluctuated during the period of record for Burro Spring and Pasture Canyon Spring, but a decreasing trend was statistically significant (p<0.05) at Moenkopi School Spring and Unnamed Spring near Dennehotso, Arizona. Discharge at Burro Spring has remained relatively constant since it was first measured in the 1980s, and discharge at Pasture Canyon Spring has fluctuated for the period of record.
Continuous records of surface-water discharge in the Black Mesa area were collected from streamflow-gaging stations at the following sites: Moenkopi Wash at Moenkopi 09401260 (1976–2021), Dinnebito Wash near Sand Springs 09401110 (1993–2020), Polacca Wash near Second Mesa 09400568 (1994–2020), and Pasture Canyon Springs 09401265 (2004–2021). Median winter flows (November through February) of each winter were used as an estimate of the amount of groundwater discharge at the above-named sites. For the period of record, the median winter flows have generally remained constant at Polacca Wash and Pasture Canyon Springs, whereas a decreasing trend was observed at Moenkopi Wash and Dinnebito Wash.
In 2020 and 2021, water samples were collected from a total of four springs in the Black Mesa area and analyzed for selected chemical constituents. Results from the four springs were compared with previous analyses from the same springs. Dissolved solids, chloride, and sulfate concentrations increased at Moenkopi School Spring during the more than 30 years of record at that site. Concentrations of dissolved solids and sulfate at Pasture Canyon Spring have not varied significantly (p>0.05) since the early 1980s, and there is no increasing or decreasing trend in those data. However, concentrations of chloride from Pasture Canyon Spring show a diminishing trend. Concentrations of dissolved solids, chloride, and sulfate at Unnamed Spring near Dennehotso have varied for the period of record, but there is no statistical trend in the data. Concentrations of dissolved solids at Burro Spring have varied for the period of record, but there is no statistical trend in the data. However, concentrations of chloride and sulfate from Burro Spring show a trend towards lower concentrations.
Introduction
The 5,400-square-mile (mi2) Black Mesa study area is enclosed fully within the Navajo Nation and partially within the Hopi Reservation in northeastern Arizona (fig. 1). It contains diverse topography that includes flat plains, elevated mesas, and incised drainages (fig. 1). Black Mesa, a topographic high at the center of the study area, encompasses about 2,000 mi2. It has cliffs that reach 2,000 feet (ft) in height on its north and northeast sides, and it slopes gradually down to the south and southwest. Availability of water is an important issue in the study area because of continued groundwater withdrawals, the growing population, and an arid to semiarid climate.
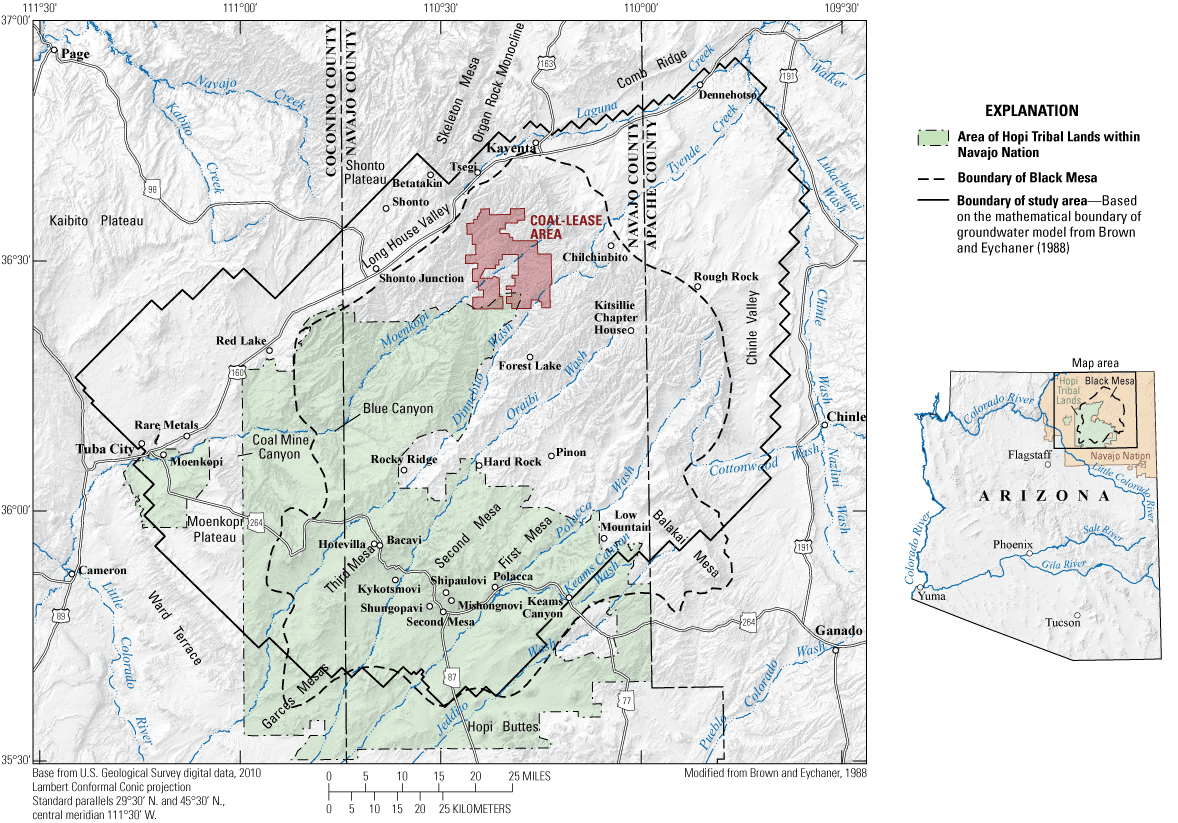
Map showing location of the Black Mesa study area, northeastern Arizona. Boundary of study area is based on boundary of groundwater model from Brown and Eychaner (1988).
Aquifers that are used in the Black Mesa area include the Toreva (T), Dakota (D), and Navajo (N) aquifers (fig. 2). Shallow aquifers composed of surficial sediments or volcanic rock are also used locally to supply small quantities of water. Water from the T and D aquifers is not used in significant quantities in the Black Mesa area. Water from the T aquifer is used locally for livestock watering and to irrigate small plots of land, but it likely cannot produce enough water for municipal or industrial use. Water from the D aquifer is used locally for livestock watering and has contributed to some wells at the Peabody Western Coal Company (PWCC) industrial well field, but water from this aquifer has elevated dissolved solids concentrations that make it unsuitable for municipal use. The deeper Coconino (C) aquifer is present throughout the Black Mesa area, but it is deeply buried and likely has dissolved solids concentrations above what can be used without treatment. The N aquifer, lying between the D and C aquifers, is the major source of water for industrial and municipal uses in the Black Mesa area. For this reason, groundwater data collected for this report were exclusively from the N aquifer.
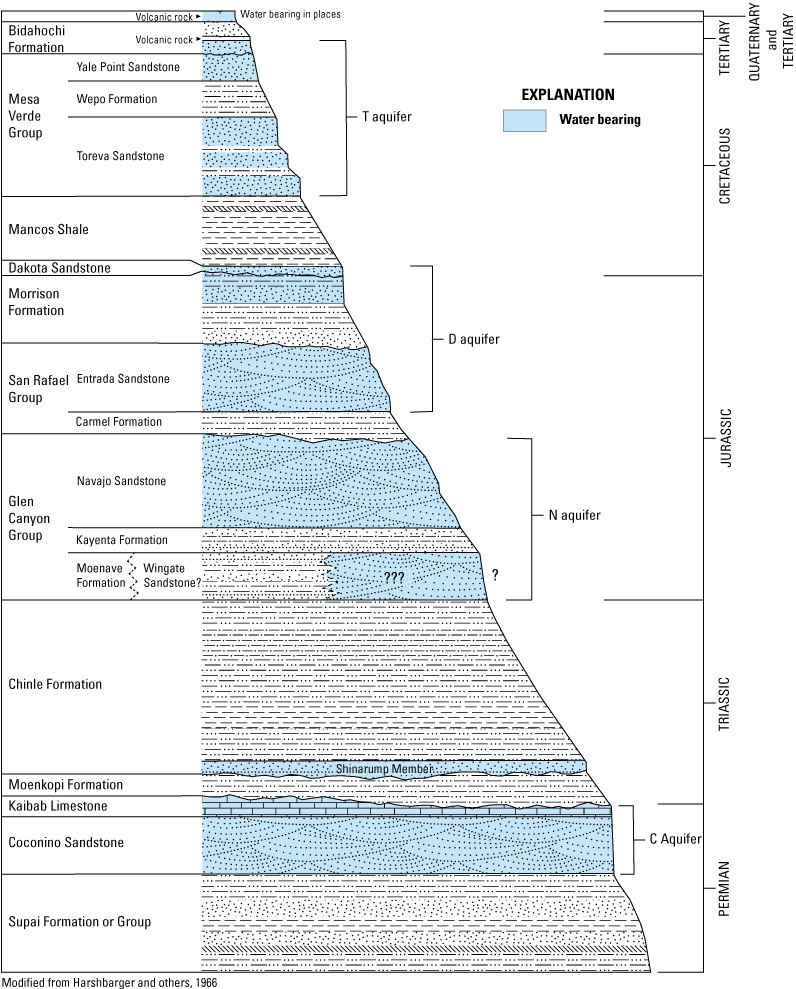
Stratigraphic section showing rock formations and hydrogeologic units of the Black Mesa area, northeastern Arizona (not to scale). Queries mark the stratigraphic extent of the Wingate Sandstone, because some outcrops formerly mapped as Wingate are now considered part of the Moenave Formation (Billingsley and others, 2012; 2013). The Navajo (N) aquifer is approximately 1,000 feet thick. T, Toreva; D, Dakota; C, Coconino.
According to Eychaner (1983), the N aquifer comprises three hydraulically connected formations—the Navajo Sandstone, the Kayenta Formation, and the Wingate Sandstone—that function as a single aquifer (fig. 2). However, more recent geologic mapping indicates the Wingate Sandstone is absent from much of the Black Mesa area. Outcrops of sandstone previously mapped as Wingate Sandstone in the Black Mesa area are now considered to be part of the Moenave Formation (Billingsley and others, 2012, 2013). Based on this recent geologic mapping, it is unclear if the Wingate Sandstone is present at all in the Black Mesa area. If present, it would be deeply buried in the northeastern part of the study area. The N aquifer is confined under most of Black Mesa, and the overlying stratigraphy limits recharge to this part of the aquifer. The N aquifer is unconfined in most areas surrounding Black Mesa, and most recharge occurs where the Navajo Sandstone is exposed in the area near Shonto, Ariz. (fig. 1) (Lopes and Hoffmann, 1997). Groundwater moves radially from the recharge areas near Shonto to the southwest toward Tuba City, Ariz., to the south toward the Hopi Reservation, and to the east toward Rough Rock and Dennehotso, Ariz. (Eychaner, 1983).
Within the Black Mesa study area, the Navajo Nation and the Hopi Tribe are the principal municipal water users, and the PWCC is the principal industrial water user. Withdrawals from the N aquifer in the Black Mesa area increased fairly consistently from 1965 to 2005 and then decreased markedly in 2006 (table 1). The PWCC began operating a strip mine in the northern part of the study area in 1968 (fig. 1). The PWCC’s mining operation consisted of two mines on Black Mesa: the Kayenta mine, which transported coal to the Navajo Generating Station by train, and the Black Mesa mine, which transported coal 275 miles (mi) to the Mohave Generating Station by a water-based coal slurry pipeline.
Table 1.
Withdrawals from the N aquifer, Black Mesa area, northeastern Arizona, 1965–2021.[Values are rounded to nearest 10 acre-feet (acre-ft). Data for 1965–79 from Eychaner (1983). Total withdrawals in Littin and Monroe (1996) were for the confined area of the aquifer]
Includes estimated pumpage 1965–73 and metered pumpage 1974–79 at Tuba City; metered pumpage at Kayenta and estimated pumpage at Chilchinbito, Rough Rock, Piñon, Keams Canyon, and Kykotsmovi before 1980; metered and estimated pumpage furnished by the Navajo Tribal Utility Authority and the Bureau of Indian Affairs and collected by the U.S. Geological Survey, 1980–85; and metered pumpage furnished by the Navajo Tribal Utility Authority, the Bureau of Indian Affairs, various Hopi Village Administrations, and the U.S. Geological Survey, 1986–2021
The PWCC operated both mines on Black Mesa from the 1970s until about 2005, when the Mohave Generating Station ceased operations. On December 31, 2005, the PWCC reduced pumping of the N aquifer by approximately 70 percent as a result of discontinued use of the coal slurry pipeline that delivered water, in addition to coal, to the Mohave Generating Station. The two mines at the PWCC were then combined into the Black Mesa Complex and continued to deliver coal to the Navajo Generating Station by electric train until 2019. In August 2019, coal-mining operations at the Black Mesa Complex ceased, due to the planned closure of the Navajo Generating Station, which permanently closed in November 2019. The PWCC continued to pump about 1,100–1,600 acre-feet (acre-ft) per year between 2006 and 2018, primarily for dust control. Since cessation of mining in 2019, the PWCC reduced its annual pumping to 200 acre-ft in 2020 and 160 acre-ft in 2021 (table 1).
Four major stream systems provide surface drainage for the Black Mesa area. They are Moenkopi Wash, Dinnebito Wash, Oraibi Wash, and Polacca Wash. All four stream systems have headwaters high on Black Mesa and eventually drain into the Little Colorado River to the south and southwest of the study area (fig. 1). Most reaches of these streams are ephemeral, flowing only in response to runoff from precipitation events, but a few short reaches flow at least part of each year as a result of groundwater discharge.
The members of the Navajo Nation and the Hopi Tribe have been concerned about the long-term effects of withdrawals from the N aquifer on available groundwater supplies, on stream and spring discharge, and on groundwater chemistry. In 1971, these water-supply concerns led to the establishment of a monitoring program for the water resources in the Black Mesa area by the U.S. Geological Survey (USGS) in cooperation with the Arizona Water Commission, which was the predecessor to the present Arizona Department of Water Resources. In 1983, the Bureau of Indian Affairs (BIA) joined the cooperative effort. Since 1983, the Navajo Tribal Utility Authority (NTUA); the PWCC; the Hopi Tribe; and the Western Navajo, Chinle, and Hopi Agencies of the BIA have assisted in the collection of hydrologic data.
Purpose and Scope
This report presents results of groundwater, surface-water, and water-chemistry monitoring in the Black Mesa area from January 2020 to December 2021. Additionally, the report uses surface-water statistics from November and December 2019. Continuous and periodic groundwater and surface-water data are collected to monitor the possible effects of industrial and municipal withdrawals from the N aquifer on groundwater levels, stream and spring discharge, and groundwater chemistry. Groundwater data include groundwater withdrawals (pumping), water levels, spring-discharge rates, and water chemistry. Surface-water data include discharge rates at four continuous-record streamflow-gaging stations. Recent groundwater and surface-water data are compared with groundwater and surface-water data from 1965 to 2021 to describe the overall status—and change over time—of groundwater conditions in the N aquifer, as well as to provide information on how the aquifer responds to groundwater-development stresses. Some statistical analyses of the data are included in this report to examine trends in the data that characterize groundwater conditions in the N aquifer.
Previous Investigations
The USGS has prepared progress reports on the Black Mesa monitoring program since 1978, and these progress reports are summarized in table 2. The groundwater-level, surface-water discharge, and water-chemistry data from the Black Mesa monitoring program are contained in these progress reports and in the USGS National Water Information System (NWIS) database (https://waterdata.usgs.gov/az/nwis/). Water-withdrawal data are presented in tables in the progress reports.
Table 2.
Tabulated list of progress reports for the Black Mesa monitoring program, 1978–2022.[USGS, U.S. Geological Survey]
Stream-discharge and periodic water-quality data collected from Moenkopi Wash before the 1982 water year were published by the USGS (1963–64a, b; 1965–74a, b; 1976–83). Stream-discharge data from water years 1983 to 2005 for Moenkopi Wash at Moenkopi (station 09401260), Dinnebito Wash near Sand Springs (station 09401110), Polacca Wash near Second Mesa (station 09400568), Laguna Creek at Dennehotso (station 09379180), and Pasture Canyon Springs (station 09401265) in the Black Mesa area were published in White and Garrett (1984, 1986, 1987, 1988), Wilson and Garrett (1988, 1989), Boner and others (1989, 1990, 1991, 1992), Smith and others (1993, 1994, 1995, 1996, 1997), Tadayon and others (1998, 1999, 2000, 2001), McCormack and others (2002, 2003), and Fisk and others (2004, 2005, 2006), and were published online for water years 2006 to present (http://wdr.water.usgs.gov). Before the monitoring program, a large data-collection effort in the 1950s resulted in a compilation of well and spring data for the Navajo Nation and Hopi Reservation (Davis and others, 1963).
Many interpretive studies have investigated the hydrology of the Black Mesa area. Cooley and others (1969) made the first comprehensive evaluation of the regional hydrogeology of the Black Mesa area. Eychaner (1983) developed a two-dimensional numerical model of groundwater flow in the N aquifer. Brown and Eychaner (1988) recalibrated Eychaner’s earlier model by using a finer grid and by using revised estimates of selected aquifer characteristics. GeoTrans, Inc. (1987) also developed a two-dimensional numerical model of the N aquifer in the 1980s. In the late 1990s, HSIGeoTrans, Inc., and Waterstone Environmental Hydrology and Engineering, Inc. (1999) developed a three-dimensional numerical model of the N aquifer and the overlying D aquifer.
Kister and Hatchett (1963) made the first comprehensive evaluation of the chemistry of water collected from wells and springs in the Black Mesa area. HSIGeoTrans, Inc. (1993) evaluated the major-ion and isotopic chemistry of the D and N aquifers. Lopes and Hoffmann (1997) analyzed groundwater ages, recharge, and hydraulic conductivity of the N aquifer by using geochemical techniques. Zhu and others (1998) estimated groundwater recharge in the Black Mesa area by using isotopic data and flow estimates from the N-aquifer model developed by GeoTrans, Inc. (1987). Zhu (2000) estimated recharge using advective transport modeling and the same isotopic data from the GeoTrans model. Truini and Longsworth (2003) described the hydrogeology of the D aquifer and the movement and ages of groundwater in the Black Mesa area by using data from geochemical and isotopic analyses. Truini and Macy (2005) looked at possible leakage through the confining unit between the D aquifer and the N aquifer as part of an investigation of the Carmel Formation.
Description of Study Area
The availability and chemistry of water resources within the Black Mesa area are directly related to physiography, climate, and geology. Physiography affects the movement of both surface water and groundwater in the area, and climate affects the water budget. The complex geologic history of the area has resulted in the accumulation of abundant coal resources and influences the movement and chemistry of surface water and groundwater.
Physiography
The Black Mesa area is located in the Colorado Plateaus physiographic province of the Intermontane Plateaus Region (Raisz, 1972). The dominant physiographic feature in the study area is Black Mesa itself, but several smaller features play important roles in the movement of surface water and groundwater (fig. 1). Black Mesa is the remnant of a large sedimentary basin that has undergone significant tectonic uplift during the past 70 million years. Parts of Black Mesa, which were once below sea level, now rise more than 6,000 ft above sea level. As a result of this uplift, the region has gone from a depositional cycle to an erosional cycle. Much of the erosion responsible for present-day topography likely occurred in the past 10 million years (Lazear and others, 2013). Since uplift occurred, Black Mesa has been dissected by streams, resulting in the formation of several smaller mesas such as the First, Second, and Third Mesas (informally called the Hopi mesas).
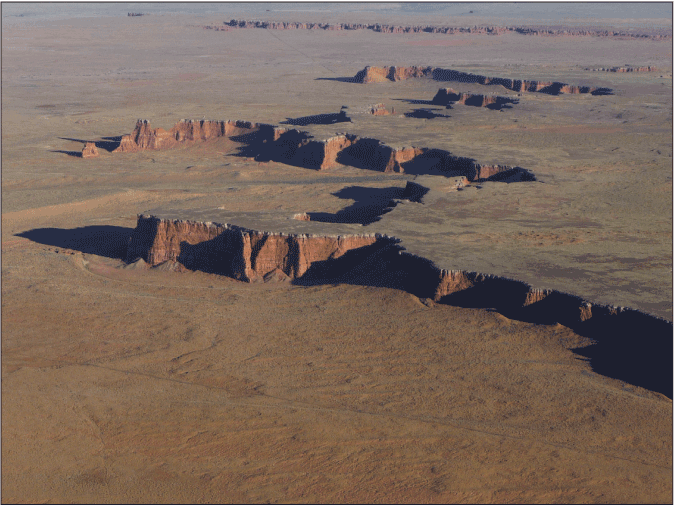
The geologic units that compose the N aquifer occur at or near the land surface in a large extent around the periphery of Black Mesa. In these areas, the aquifer is generally unconfined. West of Kayenta, Ariz., exposed N aquifer units form Skeleton Mesa and the Shonto Plateau. At the southeast edges of these features, the aquifer units are folded in the Organ Rock Monocline (fig. 3) and plunge steeply to the southeast below the younger Cretaceous rocks of Black Mesa to form Long House Valley. The N-aquifer units continue to the southeast under Black Mesa and eventually reappear south of the Hopi mesas. The aquifer units pinch out within a few miles from where they reappear. In general, the confined portion of the N aquifer occurs where the aquifer units are deeply buried beneath Black Mesa.
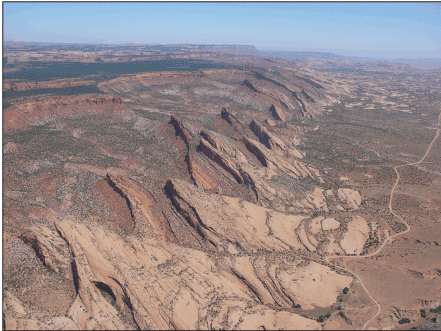
Aerial photograph showing the Organ Rock Monocline and folding strata of Skeleton Mesa near Kayenta, Arizona. Photograph by Jodi Norris, used with permission.
The paths of stream channels are also influenced by physiography. Geologic structural folds, joint patterns, rock types, and topography all affect the flow of surface water in the study area. Major streams of the study area are shown in figure 1. The surface topography of Black Mesa slopes downhill from northeast to southwest. Likewise, the major streams that drain Black Mesa flow from northeast to southwest toward the Little Colorado River.
Climate
The climate in most of the Black Mesa area is broadly classified by Hendricks (1985) as steppe, which is characterized by limited amounts of precipitation. Much of the precipitation in steppe regions evaporates before it can infiltrate to groundwater. As a result, the vegetation cover consists mostly of mesquite, pinyon-juniper, and various grasses (Hendricks, 1985). A small area around Tuba City, Ariz., is classified by Hendricks (1985) as desert. This classification signifies even less annual rainfall and indicates a vegetative cover consisting mostly of creosote bush, cacti, and sagebrush.
Mean annual precipitation for the Black Mesa area was estimated using spatial-regression methods that incorporated precipitation data from traditional weather stations and high-altitude meteorological sites (Daly and others, 1994). Annual precipitation in the Black Mesa area, which is based on 30-year averages from 1981 to 2010, ranges from less than 6 inches (in) in the lower elevation regions around the mesa to more than 16 in at the highest elevations on the mesa (fig. 4; PRISM Climate Group, 2018).
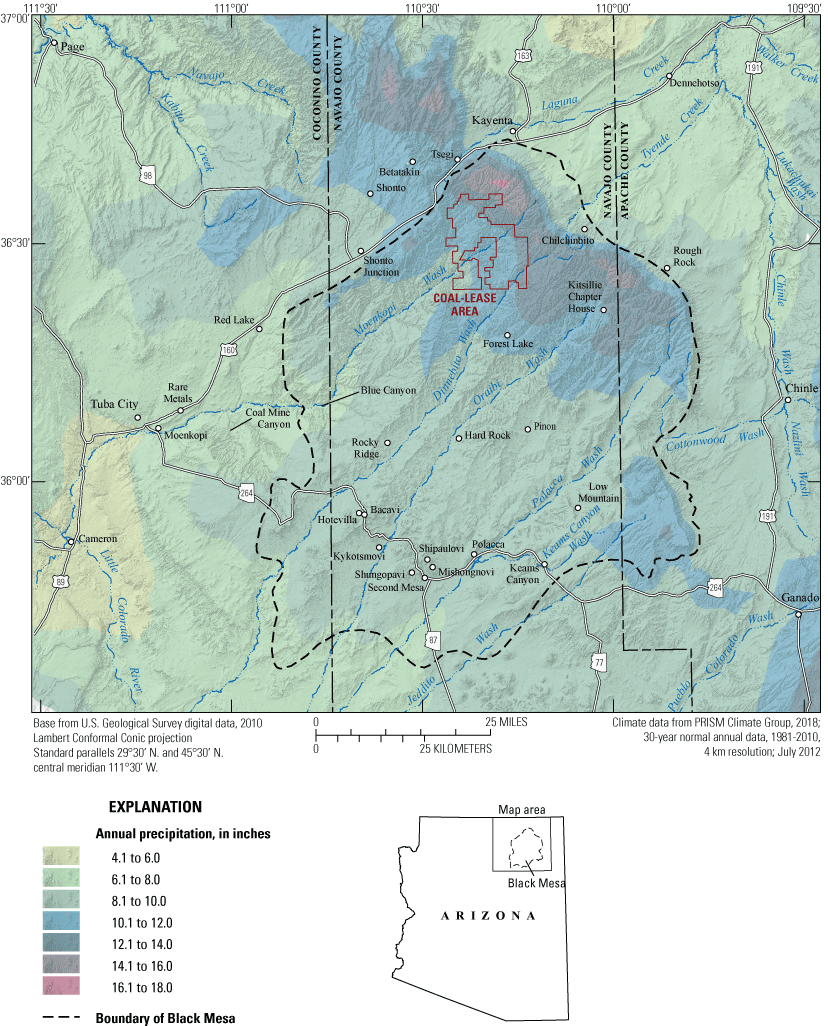
Map showing mean annual precipitation, Black Mesa area, Ariz., 1981–2010.
According to Sellers and Hill (1974), about 60 percent of average annual precipitation in northeastern Arizona falls between the months of May and October (primarily in July and August). The authors report that, on average, the plateaus and mesas of northeastern Arizona are the driest part of the state during the colder half of the year and rarely receive heavy winter precipitation. However, much of the groundwater contained in the N aquifer was recharged during the late Pleistocene when the temperature was cooler and precipitation amounts were higher (Zhu and Kipfer, 2010).
Geology
Rocks of Triassic age and older are not discussed in detail in this report because they are not significant sources of groundwater in the Black Mesa area. Instead, this section focusses on Jurassic and younger rocks that are part of hydrologic systems used in this area.
The stratigraphic section (fig. 2) used in the current and previous Black Mesa monitoring reports was modified from Harshbarger and others (1966). The original stratigraphic section showed the Wingate Sandstone between the Chinle Formation and the Kayenta Formation, and it did not show the Moenave Formation. More recently, Billingsley and others (2012, 2013) concluded that sandstones in the Black Mesa area formerly mapped in outcrop as Wingate Sandstone are, in fact, part of the Moenave Formation. It is unclear if the Wingate Sandstone could be present in the subsurface under parts of the Black Mesa area. Since the two geologic units are considered coeval, the Moenave Formation is shown as present and possibly intertongued with the Wingate Sandstone in figure 2. Harshbarger and others (1966) considered the eolian facies of the Wingate Sandstone to be a water-bearing unit of the N aquifer. It is unclear if any of the sandstones now mapped as Moenave Formation could be water bearing.
The Black Mesa area is the remnant of a large sedimentary basin that has been uplifted and dissected by streams since its original formation. When the sediments of the sedimentary rock units (fig. 2) in the Black Mesa area were deposited, the region had a much lower surface elevation nearer to, and sometimes below, sea level. As the thick sequence of sediment was being deposited, the basin was slowly subsided and allowed more sediments from nearby highlands to be deposited. The entire Colorado Plateau, including Black Mesa, was then tectonically uplifted a mile above sea level during the Tertiary by processes that are still not fully understood. According to Flowers (2010, p. 671), Colorado Plateau “elevation gain could have occurred in the early Tertiary associated with Sevier-Laramide contraction, the middle Tertiary synchronous with the proposed demise of the Laramide flat slab, [or] the late Tertiary coeval with regional extensional tectonism in adjacent provinces.”
Geologic Units Below the N Aquifer
The geologic units below the N-aquifer system are Triassic and older in age (fig. 2) and generally are not suitable as a water supply in the Black Mesa area and will not be discussed in detail. The Permian Coconino Sandstone and Kaibab Formation (fig. 2) probably could produce adequate quantities of water in the Black Mesa area, but they are deeply buried and likely have total-dissolved solids concentrations above what can be used without treatment.
Geologic Units of the N Aquifer
The geologic units associated with the N aquifer are members of the Glen Canyon Group and include the Moenave Formation, Wingate Sandstone, Kayenta Formation, and Navajo Sandstone (fig. 2). The group is named after Glen Canyon of the Colorado River in southeastern Utah, where these units are typically exposed (Harshbarger and others, 1957). The Glen Canyon Group was originally thought to be Late Triassic to Early Jurassic in age (Harshbarger and others, 1957), but more recent paleontological and stratigraphic discoveries indicate the group is largely Early Jurassic in age (Peterson and Pipiringos, 1979). According to Blakey and Ranney (2008), the Black Mesa basin was slightly above sea level, and the climate was windy and dry when the Glen Canyon Group was deposited. This led to widespread deposition of eolian and fluvial deposits (Blakey and Ranney, 2008) that now compose the sandstone units of the N aquifer.
Where the N aquifer is confined it is capped by the Carmel Formation (fig. 2), which is considered part of the San Rafael Group; the Carmel Formation is discussed in this section because it both confines the aquifer in places and hydraulically separates the N aquifer from the overlying D aquifer in locations where the D aquifer is present.
Moenave Formation
The Moenave Formation (fig. 2) contains several members; the most prominent one in the Black Mesa area is the Dinosaur Canyon Member. According to Tanner and Lucas (2007), the Moenave Formation was deposited in a mosaic of fluvial, lacustrine, and eolian subenvironments. They described trough cross-bedded sands deposited on floodplains by ephemeral streams flowing north-northwest (relative to modern geographic position) and silt deposited by sheet flow across broad interchannel flats. Tanner and Lucas (2007) further described deposits from perennial lakes that formed on terminal floodplains and experienced episodic desiccation, along with dune and sand sheet deposits that were emplaced by dominant east to south-southeast winds. Billingsley and others (2012) described the lithology of the formation as reddish-brown, thin-bedded, flat-bedded, and crossbedded fine- to coarse-grained fluvial siltstone and silty sandstone.
The Moenave Formation forms distinctive orange-red cliffs along the southwest edge of the Moenkopi Plateau and west of Oraibi Wash on Garces Mesas (figs. 1, 5). The Moenave Formation is not known to yield economic quantities of water in the Black Mesa area.
Aerial photograph showing the Moenave Formation outcropping on Garces Mesas, northeastern Arizona. White caprock on top of the Moenave Formation is silicified sandstone of the Kayenta Formation. Photograph by Jon Mason, U.S. Geological Survey.
Wingate Sandstone
It is uncertain if the Wingate Sandstone is present in the Black Mesa area. Billingsley and others (2012, 2013) considered the Wingate Sandstone to be absent from the Moenkopi Plateau and the Hopi Buttes area and concluded that sandstones in these areas formerly mapped as Wingate are, in fact, part of the Moenave Formation. The Wingate Sandstone is considered coeval to the Moenave Formation, and the two units intertongue where both are present (Clemmensen and others, 1989). The Wingate Sandstone may be present deep in the subsurface of the northeastern part of the Black Mesa area, but there is insufficient corroborating information to verify this. Historically, the Wingate Sandstone was divided into two members. The upper unit was the Lukachukai Member, which consisted mostly of eolian, large-scale crossbedded sandstone, whereas the lower Rock Point Member mainly consisted of flat-bedded fluvial and lacustrine sediments (McKee and MacLachlan, 1959). More recently, the Rock Point Member has been assigned to the underlying Chinle Formation and the Lukachukai Member has been dropped, leaving the name Wingate Sandstone (Dubiel, 1989). At its type locality near Fort Wingate, New Mexico, Harshbarger and others (1957, p. 10) described the Wingate Sandstone as “pale-reddish-brown fine- to very fine-grained quartz sandstone.” Harshbarger and others (1966) considered the eolian facies of the Wingate Sandstone to be a water-bearing unit of the N aquifer where present.
Kayenta Formation
According to Luttrell (1993), the Kayenta Formation was mainly deposited by low- to moderately sinuous streams flowing into a back-arc basin from adjacent highlands. Luttrell reported that sedimentary deposits in the north half of the formation’s extent were likely deposited by perennial to intermittent streams and contain courser material than deposits in the south half, which were interpreted as being deposited by intermittent to ephemeral streams. Sand dune and sand sheet deposits are present to a lesser extent, mainly in the southern and western extents of the formation (Luttrell, 1993). Imlay (1980) reported that the Kayenta Formation consists of light gray to reddish-orange sandstone and siltstone. The sandstone layers in the Kayenta Formation often form ledges, whereas the siltstone layers form slopes. Wilson (1965) described the thickness of the Kayenta Formation in south-central Utah as increasing progressively from east to west in part owing to intertonguing with the overlying Navajo Sandstone. Intertonguing of the Kayenta Formation and Navajo Sandstone can be seen clearly in outcrops of the two units along Moenkopi Wash near Tuba City, Ariz. The Kayenta Formation is not known to yield economic quantities of water in the Black Mesa area, although sandstone layers within the formation may contribute some water to the N aquifer.
Navajo Sandstone
The Navajo Sandstone is the principal water-bearing unit of the N aquifer (fig. 2). According to Harshbarger and others (1957), it is an eolian deposit composed of sediments derived in part from fluvial deposits of the underlying Kayenta Formation. Beitler and others (2005, p. 551) described the Navajo Sandstone as a “subrounded, fine- to medium grained, well-sorted, quartz arenite to subarkose sandstone.” The type and amount of cement in the sandstone varies considerably and includes quartz, calcite, dolomite, kaolinite, goethite, and hematite. It is characterized by high-angle, large-scale cross-stratification and striking red to white color variations. The red pigment in Navajo Sandstone comes from thin hematite grain coatings. When these coatings are chemically reduced by hydrocarbons migrating through pore spaces, the sandstone is bleached to a lighter color (Beitler and others, 2003). Bedding features in the Navajo Sandstone are identical to those in modern dunes of the transverse and barchan types. In the Black Mesa area, the Navajo Sandstone contains many lenticular beds of cherty limestone deposited in interdune lakes that can be seen between Tuba City, Ariz., and the Hopi Buttes (Harshbarger and others, 1957).
The thickness of the Navajo Sandstone was reported by Harshbarger and others (1957) as 950 ft near Shonto, Ariz., 478 ft near Dennehotso, Ariz., 335 ft at Rock Point, Ariz., and 15 ft northwest of Chinle, Ariz. Well-log data indicate that the top of the Navajo Sandstone is about 2,500 ft below the Black Mesa Complex and has a thickness in the mine area of around 700 ft. In the Tuba City area, where the Navajo Sandstone and Kayenta Formation are intertongued, well-log data indicate the combined thickness of the intertongued portion to be greater than 500 ft. Interpretation of the well log from Black Mesa observation well 3 (BM 3) located in Kayenta, Ariz., indicates that the top of the Navajo Sandstone is about 155 ft below land surface and that the unit is about 700 ft thick. In the Keams Canyon area, well logs indicate the top of the Navajo Sandstone is about 900 ft below land surface and has a thickness of about 150 ft. Well logs from Kykotsmovi Village indicate the top of the Navajo Sandstone is about 850 ft below land surface with a thickness of more than 200 ft.
Carmel Formation
The Carmel Formation (fig. 2) is part of the San Rafael Group. Harshbarger and others (1957) reported the formation in northeastern Arizona as Middle and Late Jurassic in age and consisting of resistant ledge-forming sandstone beds 1–3 ft thick separated by slope-forming siltstone strata 5–20 ft thick. They further described the siltstone beds as weakly cemented grayish red, weathering to pale reddish brown in color, and described the sandstone beds as light greenish gray, weathering to pale yellow (Harshbarger and others, 1957). In most places in northeastern Arizona, the Carmel Formation is 100–200 ft thick, but the Formation is thinner at the limits of its deposition (Harshbarger and others, 1957).
According to Blakey and others (1983), the Carmel Formation was deposited in two major transgressive-regressive cycles of the Jurassic Western Interior Seaway, resulting in varied depositional facies including fluvial, eolian, coastal sabkha, and marine. Where present in the Black Mesa area, the Carmel Formation overlies the Navajo Sandstone, forming a confining layer when the Navajo is fully saturated. The Carmel Formation is absent in most of the study area where the N aquifer is unconfined.
The Carmel Formation also hydraulically separates the N aquifer from the overlying D aquifer in areas where both aquifers are present. In the southern part of Black Mesa, there may be some leakage from the D aquifer through the Carmel Formation into the N aquifer (Truini and Macy, 2005). Because the D aquifer has higher total-dissolved solids concentrations than the N aquifer, leakage between the two could increase the total-dissolved solids concentrations of the N aquifer thereby degrading its water quality.
Geologic Units of the D Aquifer
Entrada Sandstone
The Entrada Sandstone (fig. 2) is part of the San Rafael Group and was deposited during the Middle Jurassic in widespread eolian sand seas that were adjacent to and inland from a restricted marine seaway (Peterson, 1988; Blakey, 2008). Harshbarger and others (1957) described two general facies of the Entrada Sandstone in the Black Mesa area. The first is a red, silty, spheroidally weathered sandstone that often weathers into hoodoos. The second is a clean, sandy facies that weathers into rounded, massive cliffs. Where resistant cap rocks are present, the Entrada Sandstone weathers into prominent cliffs. Billingsley and others (2012) described the sediments in the Entrada Sandstone as crossbedded, white, and interbedded white and red in color.
Harshbarger and others (1951) named a unit that overlies the Entrada Sandstone near the Navajo community of Cow Springs the Cow Springs Sandstone. Peterson (1988) reported that the Cow Springs Sandstone is closely related to the Entrada Sandstone and is often difficult to differentiate from it but clarified that the Cow Springs Sandstone can serve as a useful stratigraphic marker. For this reason, Peterson (1988) reduced the rank of the Cow Springs Sandstone to a member of the Entrada Sandstone. The Entrada Sandstone is a water-bearing unit of the D aquifer in the Black Mesa area.
Morrison Formation
The Morrison Formation (fig. 2) was deposited in the Late Jurassic by streams draining a magmatic arc developed along the western edge of the North American continent (Turner and Peterson, 2004). Harshbarger and others (1957) described the Morrison Formation as primarily fluvial, consisting of alternating flood-plain and channel deposits. There are several recognized members within the Morrison Formation, but only a general description of the formation will be presented here. The Morrison Formation is colorful. Cooley and others (1969) reported formation colors of white, gray, green, red, orange, purple, tan, yellow, and brown. They also reported mudstone, siltstone, sandstone, conglomerate, and limestone lithologies (Cooley and others, 1969). The extent of the Morrison Formation is not fully known in the Black Mesa area. On the west side of Black Mesa, there are areas such as Coal Mine Canyon and Blue Canyon where the stratigraphically adjacent units of Entrada Sandstone and Dakota Sandstone (fig. 2) crop out, but the Morrison Formation is missing. Cooley and others (1969) show the Morrison Formation present in a band along and to the north and northeast of Black Mesa. Where present, sandstone beds in the Morrison Formation can compose a water-bearing part of the D aquifer in the Black Mesa area (Cooley and others, 1969).
Dakota Sandstone
According to Aubrey (1992), the Dakota Sandstone (fig. 2) represents a complex variety of continental, marginal-marine, and marine environments, and was deposited during the Late Cretaceous in response to the westward transgression of the Cretaceous Interior Seaway. Blakey and Ranney (2008) described the Dakota Sandstone as comprising beach and coastal plain deposits. Billingsley and others (2012) described three previously identified informal units within the Dakota Sandstone. In ascending order, they are the lower sandstone member, the middle carbonaceous member, and the upper sandstone member. O’Sullivan and others (1972) described the lower sandstone member, along with some lenticular sandstone beds in the middle carbonaceous member, as having relatively high permeability, but they concluded that the upper sandstone member has low permeability in most areas because of a high silt content.
The general lithology of the Dakota Sandstone is described by Billingsley and others (2012, p. 16) as “medium-to light-gray, slope-forming, laminated to thin-bedded mudstone, siltstone, and sandstone.” Cooley and others (1969) reported that the Dakota Sandstone was the chief unit of the D aquifer system.
Mancos Shale
Kirkland (1991) reported that exposures of Mancos Shale (fig. 2) around Black Mesa represent an open marine environment of the Cretaceous Interior Seaway. According to Blakey and Ranney (2008), the Mancos Shale is drab gray and can form odd, moonlike badlands. A good example of badlands weathering of the Mancos Shale can be seen in Blue Canyon along Moenkopi Wash on the Hopi Reservation. Presumably, the canyon takes its name from the blueish-gray hue of the Mancos Shale in this location. The Mancos Shale is a thick aquiclude that separates groundwater in the underlying Dakota Sandstone from that in the overlying sandstone aquifers of the Mesaverde Group (Cooley and others, 1969).
Geologic Units of the T Aquifer
Mesaverde Group
According to Franczyk (1988), units of the Mesaverde Group (fig. 2) in the Black Mesa area (Toreva Formation, Wepo Formation, and Yale Point Sandstone) were deposited during the Late Cretaceous by further transgressions and regressions of the Cretaceous Interior Seaway. Sandstone units in the Mesaverde Group can be water-bearing units of the T aquifer. Many small contact springs issue from Mesaverde sandstones around the perimeter of Black Mesa and in canyons where the sandstones have been truncated.
The Toreva Formation is likely a fluvial and deltaic deposit laid down as the Cretaceous Interior Seaway regressed after depositing the Mancos Shale (Franczyk, 1988). The formation has multiple members that represent the different depositional environments associated with coastal deposition. The lithology of the Toreva Formation is varied. Franczyk (1988) reported that the formation includes sandstone, siltstone, mudstone, and shale, with some carbonaceous beds.
Page and Repenning (1958) reported the Wepo Formation is of mostly continental origin and consists of a thick series of intercalated siltstone, mudstone, sandstone, and coal. According to Franczyk (1988), the Wepo Formation was deposited while the Cretaceous Interior Seaway was located to the northeast of Black Mesa. Coal beds mined at the Black Mesa Complex occur in the Wepo Formation.
Molenaar (1983) described the Yale Point Sandstone as a coastal-barrier sandstone deposited during one of the last transgressions of the Cretaceous Interior Seaway. According to O’Sullivan and others (1972, p. 40), the Yale Point Sandstone is “yellowish gray, weathers grayish orange, and is composed of coarse- to fine-grained subrounded to subangular clear quartz.” Bedding in the formation is lenticular, and individual units are crossbedded (O’Sullivan and others, 1972).
Bidahochi Formation
According to a distribution map of the Bidahochi Formation by Repenning and Irwin (1954), the only place the formation is present in the Black Mesa area is around, and east of, the Hopi Buttes. The Hopi Buttes themselves are part of the Bidahochi Formation. Repenning and Irwin (1954) described the formation as consisting of fluvial and lacustrine deposits and basaltic volcanic rock. Williams (1936) concluded that the lacustrine sediments were deposited in a historical “lake of great extent” which he called Hopi Lake. The proposed Hopi Lake (also called Lake Bidahochi) and other proposed lakes of similar age have been used to support a theory that basin spillover may have helped create the Grand Canyon (Ranney, 2012). However, the extent of this ancient lake is unknown, and the basin spillover theory requires it to have been large. The Bidahochi Formation comprises several units with an overall extent of about 10,000 mi2 (Love, 1989), but the actual known extent of the lacustrine deposits is much smaller. It is possible some of the lacustrine deposits have either eroded away or are hidden below younger deposits, but this remains unresolved. Harshbarger and others (1966) reported that the lower part of the Bidahochi Formation, along with the volcanic deposits, can be water bearing.
Hydrologic Data
Groundwater data collected for this report were exclusively from the N aquifer. Water from the T and D aquifers is not used in significant quantities in the Black Mesa area. Water from the T aquifer is used locally for livestock watering and to irrigate small plots of land, but it probably cannot produce enough water for municipal or industrial use. Water from the D aquifer is used locally for livestock watering and in the past contributed to some wells at the PWCC industrial well field, but water from the aquifer generally has total-dissolved solids concentrations that make it unsuitable for municipal use.
From 2019 to 2021, activities of the Black Mesa monitoring program included metered groundwater withdrawals, measurements of groundwater levels, spring-discharge measurements, streamflow gaging, and the collection of water-chemistry samples from springs. All data were collected by the USGS except withdrawal data from NTUA wells, which were compiled by NTUA personnel. Discharge measurements were made at 4 springs, and groundwater-level measurements were made at 25 of the 34 wells in the Black Mesa monitoring network. The nine municipal wells in the network were not measured in 2020 or 2021 because of access restrictions during the Coronavirus pandemic. Of the 25 wells measured, 6 are continuous-recording observation wells that have been outfitted for real-time data telemetry (denoted to as “BM observation well” in table 3 and “BM” in text). The water-level data from these 6 continuous-recording observation wells are available on the NWIS website (https://waterdata.usgs.gov/az/nwis/gw).
Groundwater-withdrawal data were compiled in February 2022. Annual groundwater levels were typically measured during the spring. Water-chemistry samples and discharge measurements were collected from four springs either in the fall of 2020 or in December 2021 (1 spring was sampled in both fall 2020 and in December 2021). Annual groundwater-withdrawal data are usually collected from 36 well systems within the BIA, NTUA, and Hopi Reservation municipal systems, as well as from the PWCC industrial well field. Water meters from the BIA and Hopi Reservation wells were not read at the end of 2020 because of the Coronavirus pandemic. Therefore, the 2021 meters readings from these wells represented 2 years of groundwater withdrawal. To estimate the annual withdrawals from these wells, the reading was divided by 2; half of the withdrawal was assigned to 2020 and half was assigned to 2021. Well-identification information for wells normally used in the Black Mesa monitoring network is shown in table 3 (only 19 of these wells were used in 2020 and 25 were used in 2021). Streamflow data are collected at four USGS gaging stations and are available online (https://waterdata.usgs.gov/az/nwis/rt). All annual data reported in this document are for calendar years beginning January 1 and ending December 31. Median winter streamflow is reported as the year in which the winter season began, which, for this report, is 2019 and 2020. The period before appreciable groundwater withdrawals began for mining or municipal purposes (about 1965) is referred to in this report as the “prestress period.”
Table 3.
Identification numbers and names of monitoring program study wells used for water-level measurements, 2020–21, Black Mesa area, northeastern Arizona.[Water levels from several wells in this table were unable to be measured in 2020 and 2021. “BM observation well” denotes continuous-recording observation wells that have been outfitted for real-time data telemetry. —, no data; NTUA, Navajo Tribal Utility Authority]
Kendall’s tau trend analyses were applied to streamflow data, spring-discharge measurements, and water-chemistry samples by using R Project for Statistical Computing (R Development Core Team, 2022). The Kendall’s tau correlation coefficient was computed between the measured data and time. The null hypothesis was that no correlation existed between time and the measured data; the alternate hypothesis was that time and the measured data were correlated. A significance level of 0.05 was chosen to determine whether the result of the test for importance of Kendall’s tau correlation coefficient was statistically significant. A two-sided p-value that was less than or equal to 0.05 indicated that there was a statistically significant correlation in the data, and the null hypothesis would be rejected. If a significant correlation existed, the sign of the slope would indicate whether there was an increasing or decreasing trend. P-values greater than 0.05 indicated that there was no statistically significant correlation between time and concentration, and the null hypothesis would be accepted.
In addition, the Theil-Sen slope estimator was calculated and plotted for streamflow data, spring-discharge measurements, and water-chemistry data using the NADA R package (Lee, 2020). Closely related to Kendall’s tau, the Theil-Sen slope estimator provides a slope for trends similar to ordinary least-squares regression, but is less affected by outliers (Helsel and others, 2020).
Withdrawals from the N Aquifer
Total annual withdrawals from the N aquifer are monitored on a continuing basis to help determine the effects from industrial and municipal pumping. Withdrawals from the N aquifer are separated into three categories: (1) industrial withdrawals from the confined area, (2) municipal withdrawals from the confined area, and (3) municipal withdrawals from the unconfined areas. There are no industrial withdrawals from the unconfined areas within the study area. The industrial category includes eight wells in the PWCC industrial well field in the northern Black Mesa area. The BIA, NTUA, and Hopi Tribe operate about 70 municipal wells that are combined into 36 well systems. Information about withdrawals from the N aquifer is compiled primarily based on metered data from individual wells operated by the BIA, NTUA, and Hopi Tribe (table 4). Meter readings from BIA and Hopi Tribe facilities were not collected for 2020 because of the Coronavirus pandemic. For this reason, the readings collected for 2021 represented a 2-year period (2020 and 2021). The withdrawal amounts for this period were divided in two and half of the withdrawal was assigned to 2020 and half to 2021.
Table 4.
Withdrawals from the N aquifer by well system, Black Mesa area, northeastern Arizona, calendar years 2020 and 2021.[Well systems include one or more wells. Withdrawals, in acre-feet, are from flowmeter measurements. —, no data; BIA, Bureau of Indian Affairs; USGS, U.S. Geological Survey; NTUA, Navajo Tribal Utility Authority; PWCC, Peabody Western Coal Company; Hopi, Hopi Village Administrations]
Withdrawals from wells equipped with windmills are not measured in this monitoring program and are not included in total withdrawal values reported here. About 270 windmills in the Black Mesa area withdraw water from the N, D, T, and alluvial aquifers, primarily for livestock. The estimated total withdrawal by the windmills from the N aquifer is about 65 acre-ft per year (HSIGeoTrans, Inc. and Waterstone Environmental Hydrology and Engineering, Inc., 1999). The total withdrawal by the windmills is less than 3 percent of the total annual withdrawal from the N aquifer.
Withdrawals in Calendar Years 2020 and 2021 Compared to Previous Years
In 2020 and 2021, total groundwater withdrawal from the N aquifer was estimated to be about 2,680 and 2,570 acre-feet (acre-ft), respectively (table 1). Total withdrawals for municipal use in 2020 were estimated to be about 2,480 acre-ft, and about 2,410 acre-ft were estimated in 2021. Municipal withdrawals from the confined area averaged about 1,340 acre-ft per year, while withdrawals from the unconfined areas averaged about 1,100 acre-ft. Withdrawals for industrial use in 2020 and 2021 were about 200 and 160 acre-ft, respectively (tables 1, 5).
Table 5.
Total, industrial, and municipal withdrawals from the N aquifer for discrete time periods from 1965 to 2021, Black Mesa area, northeastern Arizona.Withdrawals from the N aquifer have varied annually from 1965 to the present but amounts generally increased from 1965 to 2005 and decreased from 2006 to 2021. Beginning in 2006, the PWCC reduced their pumping by about 70 percent. This reduction in industrial pumping is reflected by a decrease in total annual withdrawals of about 44 percent from 2005 (tables 1, 5; fig. 6). Total withdrawals for the period of record (1965–2021) was 278,990 acre-ft; industrial withdrawals made up 56 percent and municipal withdrawals composed 44 percent of total withdrawals (table 5). Total withdrawals in 2021 were 2,570 acre-ft (tables 1, 5; fig. 7), with 6 percent from industrial withdrawals and 94 percent from municipal withdrawals (table 5). Industrial pumping decreased about 86 percent between 2018 and 2021. As discussed earlier, the PWCC stopped producing coal from the Black Mesa Complex in August 2019 due to the planned closure of the Navajo Generating Station. Groundwater continues to be used at the Black Mesa Complex for the reclamation process, but at a much-diminished rate.
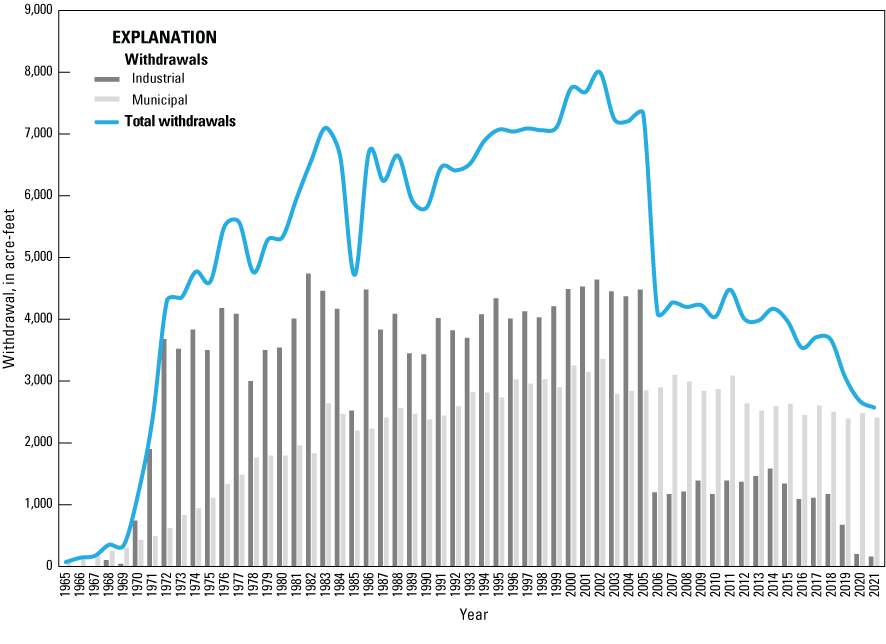
Plot of annual withdrawals from the N aquifer, Black Mesa area, northeastern Arizona, 1965–2021.
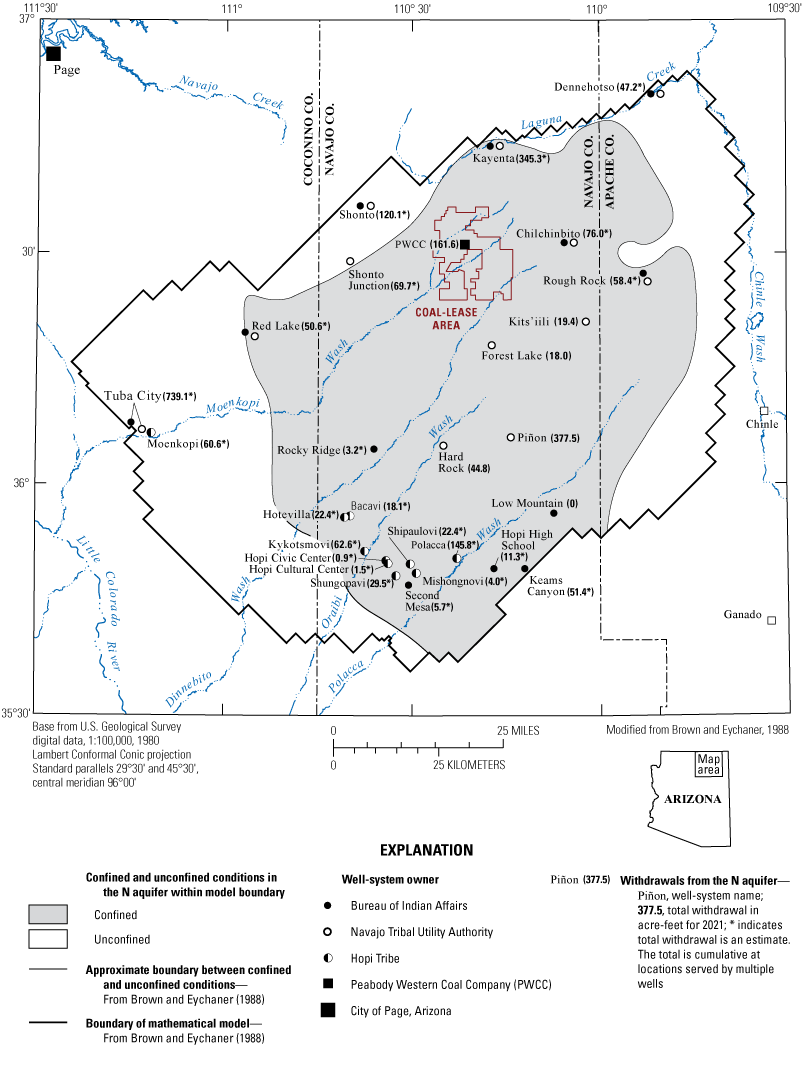
Map showing well systems monitored for annual withdrawals from the N aquifer, Black Mesa area, northeastern Arizona, calendar year 2021, and showing confined and unconfined zones of the N aquifer.
Groundwater Levels in the N Aquifer
Groundwater levels are monitored at wells that are screened in the N aquifer to help understand the effects of withdrawals on the potentiometric surface of the aquifer. Groundwater in the N aquifer is under confined conditions in the central part of the study area and under unconfined or water-table conditions around the periphery (fig. 7). Because of the different ways groundwater is released from storage, confined and unconfined aquifers respond dissimilarly to groundwater withdrawal. When the same volume of water is withdrawn from both confined and unconfined aquifers by pumping, the water-level decline in wells within the confined aquifer will usually be much greater than the decline seen in wells within the unconfined aquifer. This is one reason water levels have generally declined more in wells screened in the confined portion of the N aquifer than in the unconfined portion within the monitoring area. A corollary to this phenomenon is that water levels in confined aquifer wells also tend to recover more quickly if pumping is decreased or stopped than they would in unconfined aquifer wells.
Direct comparison between water levels from confined aquifer wells and unconfined aquifer wells is of limited value. The two sets of data are distinct populations that are best considered individually. For this reason, a distinction is made between water level changes from confined aquifer wells and unconfined aquifer wells in this section of the report.
Water levels were measured in 19 wells during spring 2020 and in 25 wells during spring 2021. Normally, 34 wells are measured annually as part of the Black Mesa monitoring network, but because of access restrictions during the Coronavirus pandemic, not all wells could be measured. The 2021 water levels were compared to prestress levels (table 6) to identify long-term changes. Of the 34 wells in the network, 6 are continuous-recording observation wells. Water levels were measured quarterly using an electric tape in these six wells during 2020 and 2021 to verify or update instrument calibration. Only water levels from municipal and stock wells that were not considered to have been recently pumped, affected by nearby pumping, or blocked or obstructed are compared.
Table 6.
Water-level changes in monitoring program wells completed in the N aquifer, Black Mesa area, northeastern Arizona, from the prestress period (prior to 1965) to calendar year 2021.[“BM observation well” denotes continuous-recording observation wells that have been outfitted for real-time data telemetry. The unit of measure for the “Water level, 2020, Water level, 2021, and Change in water level” columns is in feet below land surface. —, no data; BIA, Bureau of Indian Affairs; NTUA, Navajo Tribal Utility Authority; R, reported from driller’s log]
Continuous recorder. Prestress levels were estimated from a groundwater model, except for well BM observation well 3 (Brown and Eychaner, 1988)
The wells used for water-level measurements are distributed throughout the study area (fig. 8). The wells were constructed between 1934 and 2018, and the well depths range from 107 ft near Rough Rock, Ariz., (8A-180) to 2,674 ft at Forest Lake, Ariz. (Forest Lake NTUA 1). Depths to the top of the N aquifer range from 0 ft near Tuba City, Ariz., to 2,205 ft at Kitsillie Chapter House on top of Black Mesa (wells Tuba City NTUA 1R and Kitʻsiili NTUA 2 in table 7, respectively).
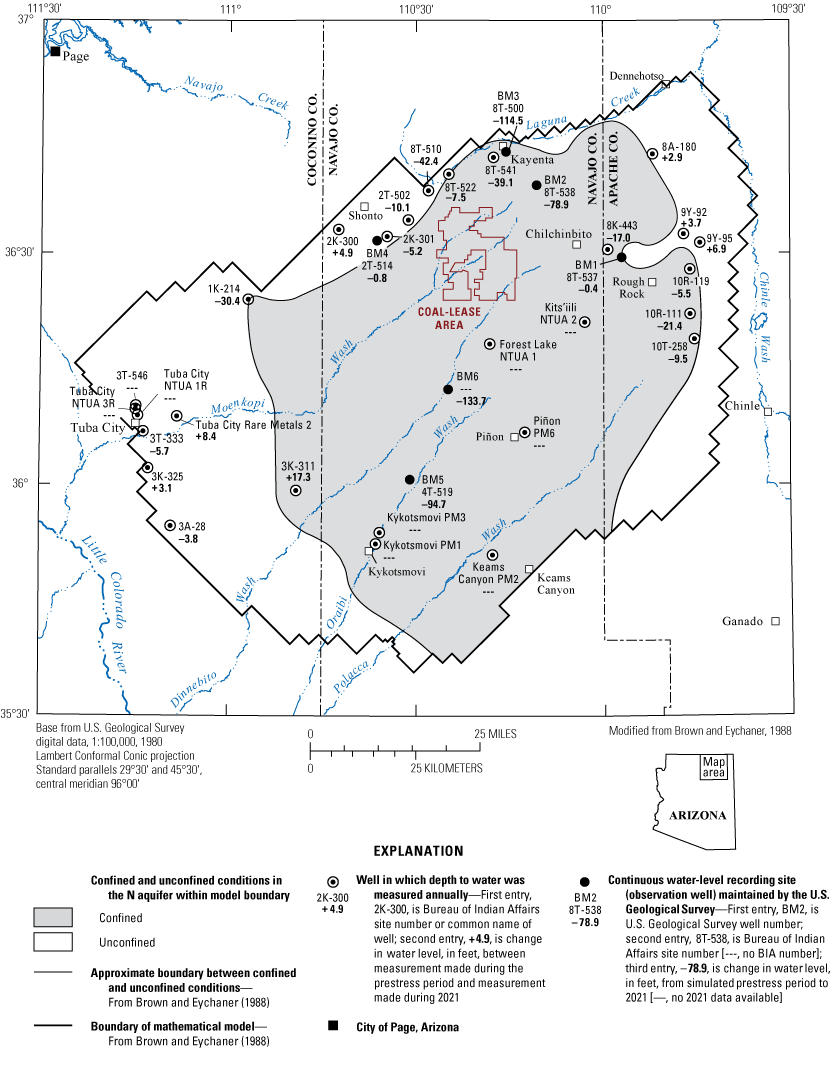
Map showing water-level changes in wells completed in the N aquifer, Black Mesa area, northeastern Arizona, from the prestress period (prior to 1965) to 2021. (NTUA, Navajo Tribal Utility Authority).
Table 7.
Well-construction characteristics, depth to top of N aquifer, and 2021 static water level for wells used in annual water-level measurements and for continuous-record observation wells, 2019–2021, Black Mesa area, northeastern Arizona.[“BM observation well” denotes continuous-recording observation wells that have been outfitted for real-time data telemetry. —, no data; BIA, Bureau of Indian Affairs; ft, feet; ft bls, feet below land surface; NTUA, Navajo Tribal Utility Authority]
Depth to top of N aquifer from Eychaner (1983) and Brown and Eychaner (1988)
Water levels measured in 2020 and 2021, and changes in water levels from the prestress period to 2021, are shown in table 6. The 34 wells in table 6 are grouped by location in the unconfined or confined area of the aquifer. From the prestress period to 2021, water levels in the 13 wells measured in the unconfined part of the aquifer had a median change of −0.4 ft (table 8), and water-level changes ranged from −42.4 ft at Long House Valley (8T-510) to +8.4 ft at Tuba City Rare Metals (fig. 8 and table 6). Water levels in the 12 wells measured in the confined part of the aquifer had a median change of −25.9 ft (table 8), and water-level changes ranged from −133.7 ft at BM 6 to +17.3 ft at Howell Mesa (3K-311) (fig. 8 and table 6). The well that usually shows the largest decline in water level since predevelopment (Keams Canyon PM2) was not measured in 2021. In 2020, it showed a 181.4 ft decline since predevelopment.
Table 8.
Median changes in water levels in monitoring-program wells from the prestress period (prior to 1965) to 2021, N aquifer, Black Mesa area, northeastern Arizona.Hydrographs of groundwater levels in the network of wells observed annually show the temporal changes from the 1950s to present (figs. 9, 10). In most of the unconfined areas, water levels have changed only slightly (generally less than 10 ft). Near Shonto, Ariz., however, the water level in well 8T-510 (Longhouse Valley) has declined by 42.4 ft (fig. 8; table 6). Water levels have declined in most of the confined area, but the magnitudes of declines are varied. Larger declines have occurred near the municipal pumping centers (wells Piñon PM6 and Keams Canyon PM2) and near the well field for the PWCC (BM6). Smaller declines occurred away from the pumping centers in or near towns in the study area (wells 10T-258, 10R-119, 8T-522; figs. 8, 9, 10).
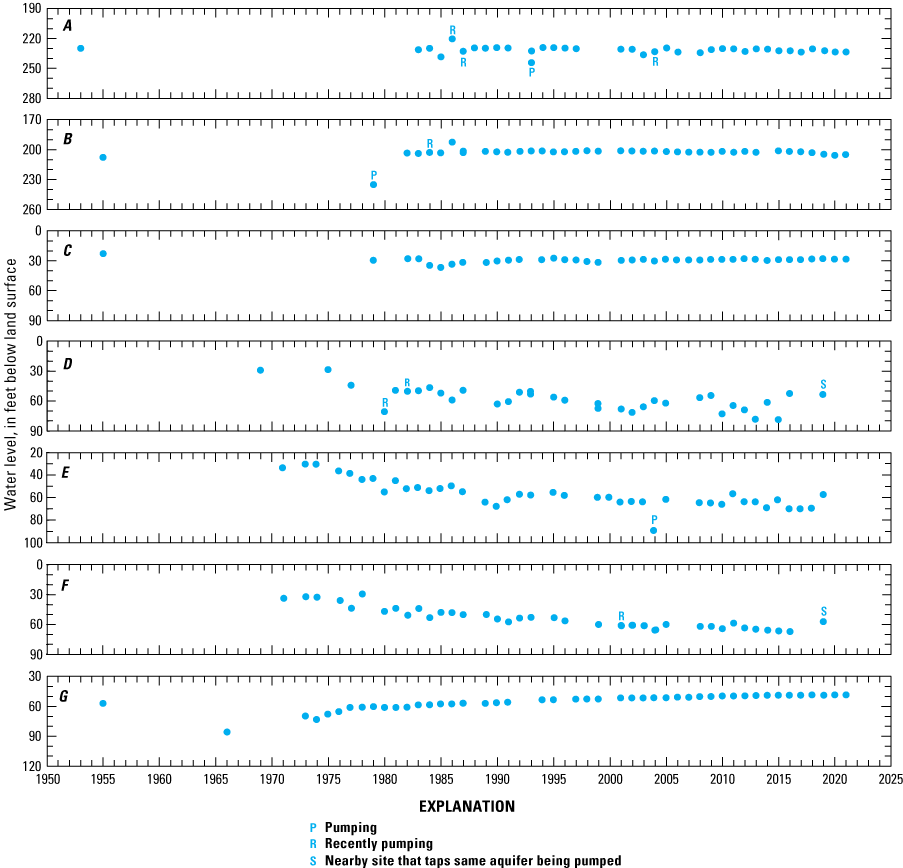
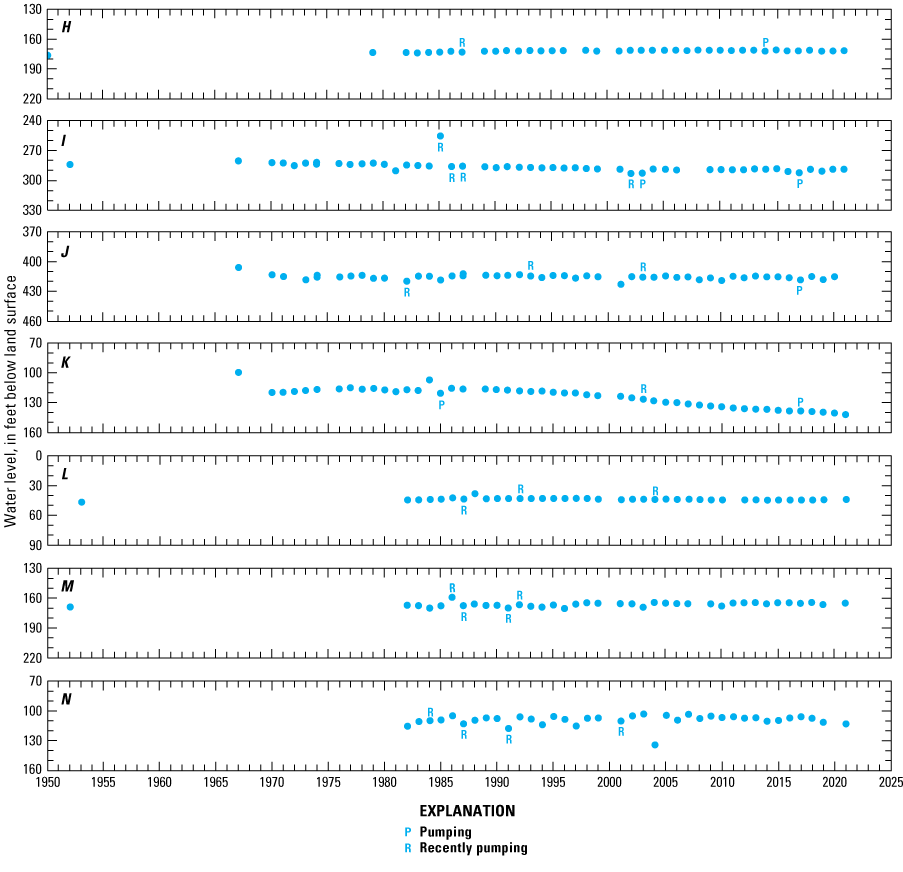
Plots of observed water levels in annual observation wells 3A-28 (A), 3K-325 (B), 3T-333 (C), Tuba City NTUA 1R (D), 3T-546 (NTUA 4) (E), Tuba City NTUA 3R (F), Rare Metals 2 (G), 2K-300 (H), 2K-301 (I), 2T-502 (J), 8T-510 (K), 8A-180 (L), 9Y-92 (M), and 9Y-95 (N) in unconfined areas of the N aquifer, Black Mesa area, northeastern Arizona, 1950–2021. Replacement wells NTUA 1R and NTUA 3R were drilled in 2018 to replace wells NTUA 1 and NTUA 3. NTUA, Navajo Tribal Utility Authority.
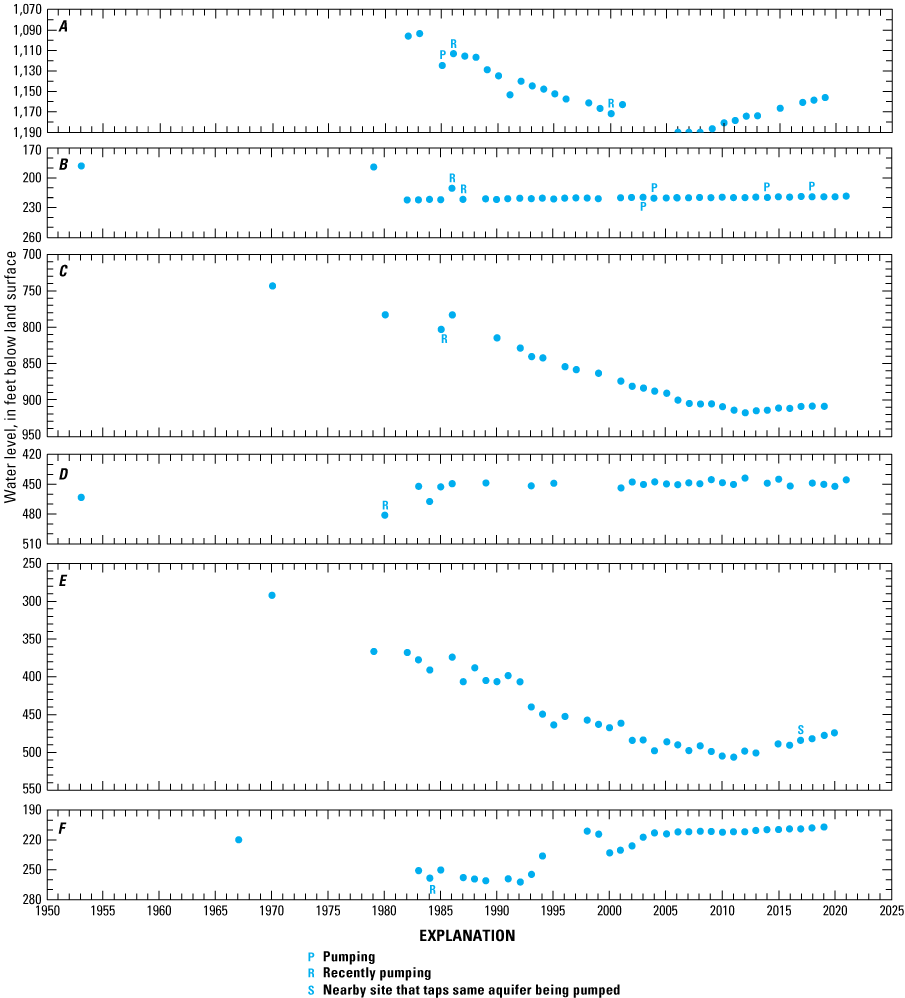
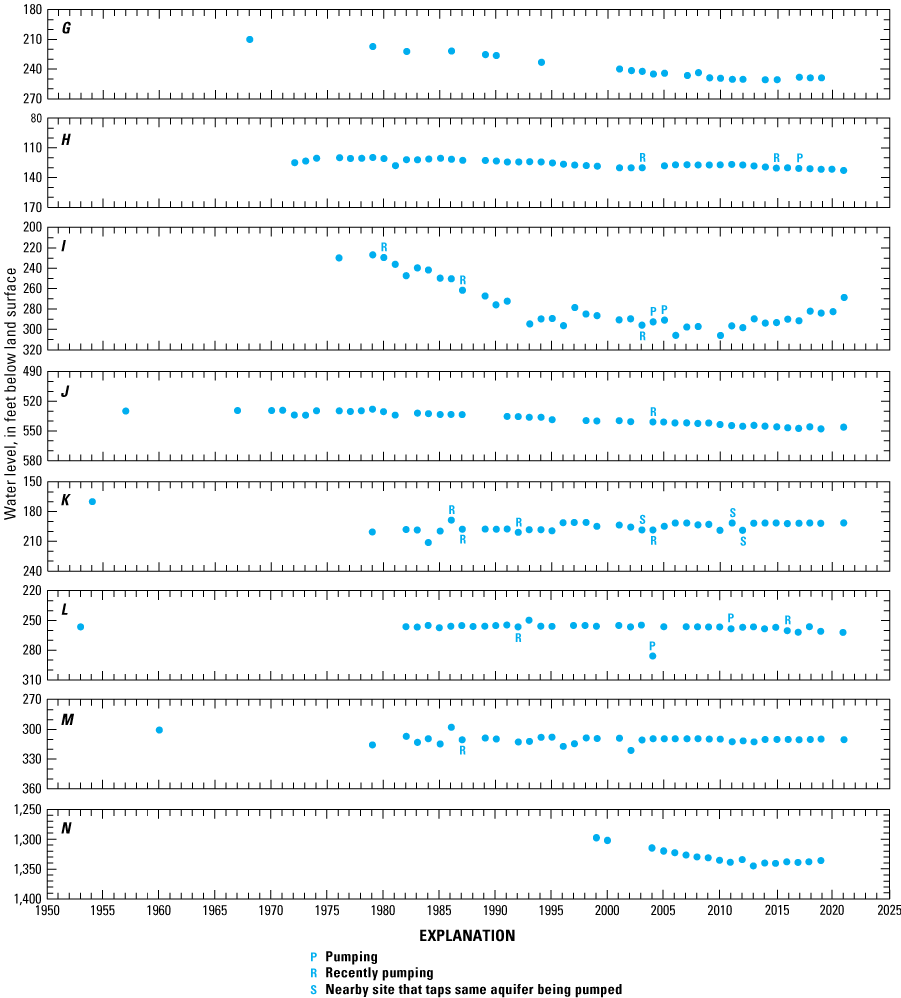
Plots of observed water levels in annual observation wells 4T-523 (Forest Lake NTUA 1) (A), 1K-214 (B), Piñon PM6 (C), 3K-311 (D), Keams Canyon PM2 (E), Kykotsmovi PM1 (F), Kykotsmovi PM3 (G), 8T-522 (H), 8T-541 (I), 8K-443 (J), 10R-111 (K), 10R-119 (L), 10T-258 (M), and Kitsʻiili NTUA 2 (N) in confined areas of the N aquifer, Black Mesa area, northeastern Arizona, 1953–2021. NTUA, Navajo Tribal Utility Authority.
Hydrographs for the Black Mesa continuous-record observation wells (fig. 11) show water levels since the early 1970s. The two wells in the unconfined areas (BM1 and BM4) have shown small seasonal or year-to-year variation since 1972 but show no apparent long-term decline. In the confined area, water levels (not corrected for barometric pressure effects or seasonal effects) in wells BM2, BM3, BM5, and BM6 consistently declined from the 1970s to the mid-2000s (fig. 11). After the mid-2000s, water levels in BM2, BM5, and BM6 began to level off and then to rise. The water-level recoveries in BM2, BM5, and BM6 since the mid-2000s have been 15.7 ft, 9.6 ft, and 32.4 ft, respectively. Water levels in BM3 are more variable because of nearby municipal pumping. After the mid-2000s, water levels in BM3 continued to vary, but the overall trend flattened out by around 2010 (fig. 11).
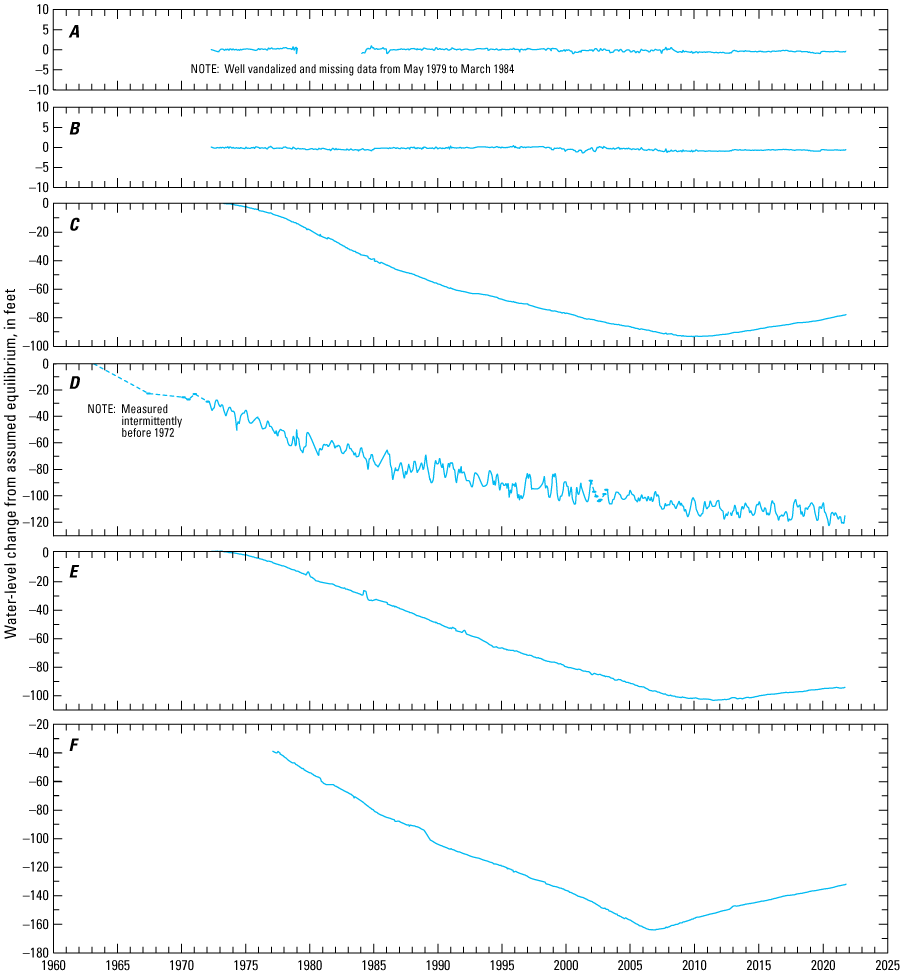
Plots of observed groundwater levels in continuous-record observation wells BM1–BM6 (A–F) in the N aquifer, Black Mesa area, northeastern Arizona, 1963–2021.
Spring Discharge from the N Aquifer
Groundwater in the N aquifer discharges from many springs around the margins of Black Mesa, and changes to the discharge from those springs could indicate effects of withdrawals from the N aquifer. Moenkopi School Spring (360632111131101), Burro Spring (354156110413701), Pasture Canyon Spring (361021111115901), and Unnamed Spring near Dennehotso (364656109425400) have been measured intermittently since the late 1980s. Three of the springs were measured for discharge in 2020 and the fourth was measured in 2021. Additionally, trend analyses were performed on the flow data from the four springs.
Moenkopi School Spring, also called Susunova Spring by the Hopi Tribe, is in the western part of the Black Mesa area (fig. 12). Discharge from Moenkopi School Spring was measured in December 2021 using the volumetric method and was compared to discharge data from previous years to determine changes over time (fig. 13A). The trend for discharge measurements at this spring is not corrected for seasonal variability. In 2021, the measured discharge from Moenkopi School Spring was 9.1 gallons per minute (gal/min) (table 9). A Kendall’s tau analysis, using the Theil-Sen slope estimator, indicated a decreasing trend (p<0.05) of about 0.3 gal/min per year during the period of record (fig. 13A).
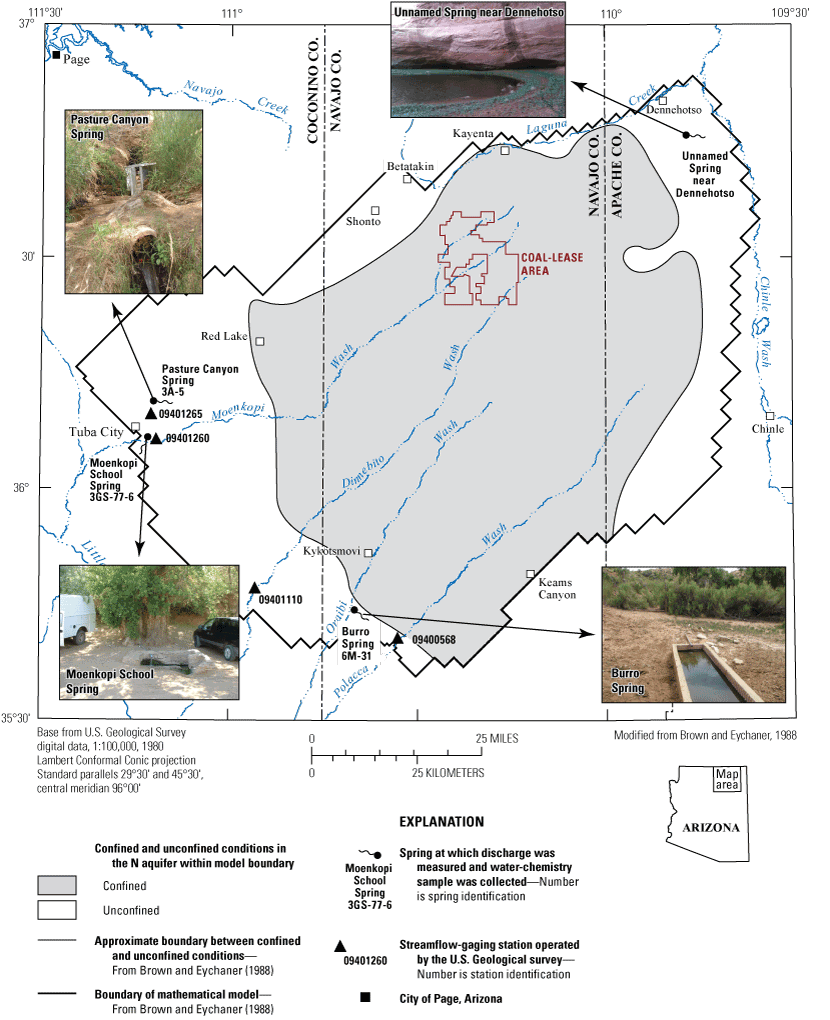
Map of surface-water and water-chemistry data-collection sites in the N aquifer, Black Mesa area, northeastern Arizona, 2019–2021. Photographs by the U.S. Geological Survey.
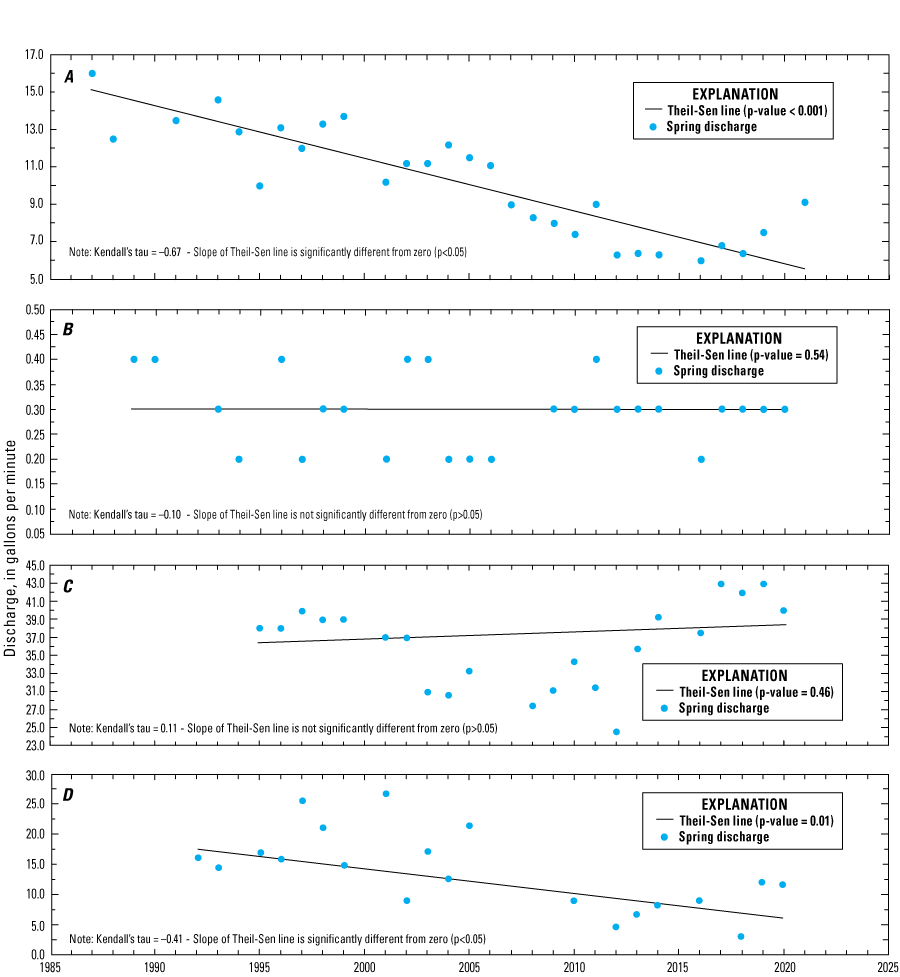
Plots of discharge from Moenkopi School Spring (360632111131101) (A); Burro Spring (354156110413701) (B); Pasture Canyon Spring (361021111115901) (C); and Unnamed Spring near Dennehotso (364656109425400) (D), N Aquifer, Black Mesa area, northeastern Arizona, 1987–2021. Moenkopi School Spring data from 1952 and Pasture Canyon Spring data from 1988 to 1993 are not shown because they were taken from different measuring locations.
Table 9.
Discharge from Moenkopi School Spring, N aquifer, Black Mesa area, northeastern Arizona, 1952–2021.[Discharges are measured volumetrically and do not represent the total discharge from the springs. Geologic unit and Bureau of Indian Affairs site number (in parentheses) listed above dates and measured discharge]
Burro Spring is in the southwestern part of the study area and discharges from the Navajo Sandstone and alluvium (fig. 12). Burro Spring discharges from the aquifer through a metal pipe and into a cement trough for livestock. As in previous years, the 2020 discharge measurement point was from the end of the metal pipe before the livestock trough. Discharge at Burro Spring has fluctuated since 1989 between 0.2 and 0.4 gal/min, but there is no significant (p>0.05) trend from a Kendall’s tau analysis (fig. 13B). In 2020, the measured discharge was 0.3 gal/min (table 10). The spring was visited in 2021 as well, but the discharge pipe was plugged, so a discharge measurement could not be collected.
Table 10.
Discharge from Burro Spring, N aquifer, Black Mesa area, northeastern Arizona, 1989–2021.[Discharges are measured volumetrically and do not represent the total discharge from the springs. Geologic unit and Bureau of Indian Affairs site number (in parentheses) listed above dates and measured discharge]
Pasture Canyon Spring is in the western part of the study area and discharges from the Navajo Sandstone and alluvium (fig. 12). This report refers to Pasture Canyon Spring when referencing the spring where water chemistry samples are collected and where spring discharge is measured, whereas the name Pasture Canyon Springs refers to the streamflow gaging station. Discharge is measured at two locations: where the spring issues from the Navajo Sandstone (also the water-quality sampling point) and farther down the canyon at the USGS gaging station (Pasture Canyon Springs 09401265). The USGS gaging station at Pasture Canyon measures the discharge from Pasture Canyon Spring as well as additional discharge from seeps in Pasture Canyon. As in previous years, discharge was measured at Pasture Canyon Spring at its emergence point in October 2020 using the volumetric method. The measured discharge was 40.3 gal/min (table 11), which indicated a decrease in discharge of about 2.7 gal/min from the 2019 measurement. Since 1995, discharge at Pasture Canyon Spring has fluctuated between 26.5 and 43.0 gal/min, but there is no significant (p>0.05) trend from a Kendall’s tau analysis (fig. 13C). The discharge data measured at this spring are not corrected for seasonal variability.
Table 11.
Discharge from Pasture Canyon Spring, N aquifer, Black Mesa area, northeastern Arizona, 1988–2021.[Discharges are measured volumetrically and do not represent the total discharge from the springs. Geologic unit, lithology, and Bureau of Indian Affairs site number (in parentheses) listed above dates and measured discharge]
Unnamed Spring near Dennehotso, also called Black Water spring by local residents, is the only spring located in the northeastern part of the study area (fig. 12), and it discharges from the Navajo Sandstone. As in previous years, measurements at Unnamed Spring near Dennehotso are made using a flume. Discharge has decreased markedly at Unnamed Spring near Dennehotso since 2005. That year, the discharge at the spring was 21.5 gal/min. The discharge was not measured again until 2010, when it was 9.0 gal/min. In 2020, discharge was 11.6 gal/min (table 12). For the period of record, which includes a gap in data from 2005 to 2010, a decreasing trend (p<0.05) is evident from a Kendall’s tau analysis (fig. 13D). The discharge data measured at this spring are not corrected for seasonal variability.
Table 12.
Discharge from Unnamed Spring near Dennehotso, N aquifer, Black Mesa area, northeastern Arizona, 1954–2021.[Discharges are measured volumetrically and do not represent the total discharge from the springs. Geologic unit and Bureau of Indian Affairs site number (in parentheses) listed above dates and measured discharge]
Surface-Water Discharge, Calendar Years 2020–2021
Continuous surface-water discharge data have been collected for various time periods at selected streams since the monitoring program began in 1971. Surface-water discharge in the study area generally originates as groundwater that discharges to streams or as surface runoff from rainfall or snowmelt. Groundwater discharges to some stream reaches at a fairly constant rate throughout the year; however, the amount of groundwater discharge that results in surface flow is affected by seasonal fluctuations in evapotranspiration (Thomas, 2002a). In contrast, the amount of rainfall or snowmelt runoff varies widely throughout the year. In winter and spring, the amount and timing of snowmelt runoff are a result of the temporal variation in factors such as snow accumulation, air temperatures, and rate of snowmelt. However, snowmelt usually does not lead to large runoff events on any of the main four washes in the Black Mesa area. Rainfall can occur throughout the year but occurs more typically during the summer months than during other times of the year. The amount and timing of rainfall depends on the intensity and duration of thunderstorms during the summer and on mid-latitude, low-pressure systems during the fall, winter, and spring.
In 2020, discharge data were collected at four continuous-recording streamflow-gaging stations. However, in 2021, discharge data were only collected at Moenkopi Wash at Moenkopi, Ariz., (09401260) and Pasture Canyon Springs near Tuba City, Ariz., (09401265) owing to a reduction in funding (fig. 14). Data collection at these stations began in July 1976 (Moenkopi Wash at Moenkopi, Ariz., 09401260), June 1993 (Dinnebito Wash near Sand Springs, Ariz., 09401110), April 1994 (Polacca Wash near Second Mesa, Ariz., 09400568), and August 2004 (Pasture Canyon Springs near Tuba City, Ariz., 09401265) (table 13). Most of the daily mean discharge values highlighted as estimated (red lines) in figure 14 were either estimated because the streamflow record was affected by ice during the winter months or because the stage recorder was damaged during high-flow conditions. Estimated daily values are based on adjacent good records, records from comparable stations, and discrete discharge measurements. Areas of hydrographs in figure 14 where no line is present represent periods when mean daily discharge was zero or near zero. The hydrographs present mean daily discharge using a logarithmic axis, which cannot have a zero value. The geologic and hydrologic settings, along with trend analyses of base flow at the four streamflow sites, are described briefly below.
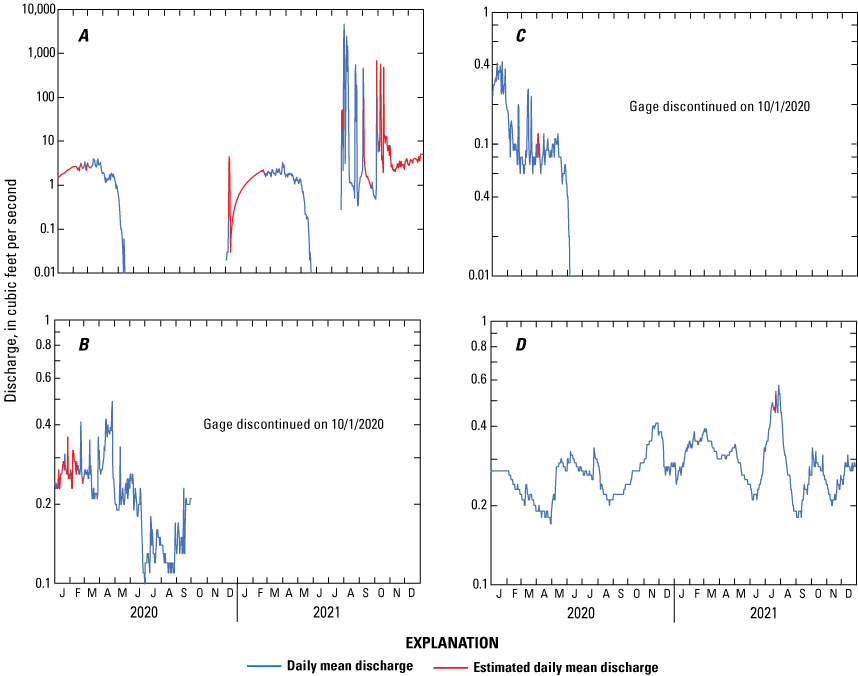
Plots of daily mean discharge for Moenkopi Wash at Moenkopi, Ariz. (09401260) (A); Dinnebito Wash near Sand Springs, Ariz. (09401110) (B); Polacca Wash near Second Mesa, Ariz. (09400568) (C); and Pasture Canyon Springs near Tuba City, Ariz. (09401265) (D), Black Mesa area, northeastern Arizona, calendar years 2020–2021. Most daily mean discharge values highlighted as estimated were either estimated because the streamflow record was affected by ice during the winter months or because the stage recorder was damaged during high-flow conditions.
Table 13.
Streamflow-gaging stations used in the Black Mesa monitoring program, their periods of record, and drainage areas.[—, not determined]
Moenkopi Wash
Moenkopi Wash has a drainage area of 1,629 mi2 and drains a large portion of the western part of Black Mesa. The streamflow gage is located near the village of Moenkopi in a portion of the wash that cuts down into interbedded Navajo Sandstone and Kayenta Formation. During the period of streamflow gage operation, there has generally been continuous flow at the gage except for the summer months, when the stream is often dry at the gage (fig. 14). Monsoon rain events occurring between July and September can result in large, sediment-laden flows in Moenkopi Wash. The maximum instantaneous discharge recorded at the gage was 10,100 cubic feet per second (ft3/s) on September 30, 1983.
There are no observed N-aquifer springs issuing directly from the Navajo Sandstone near the streamflow gage. During base-flow conditions, flow seems to initiate from Moenkopi Wash alluvium, but it is assumed this flow is supplied by the N aquifer from below and through the alluvium.
Dinnebito Wash
Dinnebito Wash has a drainage area of 473 mi2 and drains some of the middle part of Black Mesa. The streamflow gage is located in a part of the wash that is cut down into the Navajo Sandstone. Dinnebito Wash is an intermittent stream with small sections that flow year-round, though most of the stream is dry much of the year. The streamflow gaging station is in a perennial reach (fig. 14). From July through September, monsoon rain events can result in large, sediment-laden flows in Dinnebito Wash, although no high flows were recorded during the summer of 2020. The maximum instantaneous discharge recorded at the gage was 3,970 ft3/s on September 20, 2004. The minimum daily mean discharge recorded at the gage was 0.05 ft3/s on August 16, 23, and October 1–6, 2002.
There are no observed N-aquifer springs issuing directly from the Navajo Sandstone near the streamflow gage. During base-flow conditions, flow seems to initiate from Dinnebito Wash alluvium, but it is assumed this flow is supplied by the N aquifer from below and through the alluvium.
Polacca Wash
Polacca Wash has a drainage area of 905 mi2 and drains a large section of the eastern part of Black Mesa. The streamflow gage is in a part of the wash that is cut down into the Kayenta Formation. Much of Polacca Wash is ephemeral, remaining dry except during and after precipitation runoff events. However, the streamflow gage is in a stream reach that often has flow. During the period of streamflow-gage operation, there has been continuous flow at the gage for most months of the year with the exception of the summer months, when the stream is often dry at the gage (fig. 14). From July through September, monsoon rain events can result in large, sediment-laden flows in Polacca Wash. The maximum instantaneous discharge recorded at the gage was 2,140 ft3/s on July 30, 2017. Most of the base flow at the Polacca Wash streamflow gage is likely provided by a spring issuing from the base of the Navajo Sandstone located about 1 mi upstream from the gage.
Pasture Canyon Spring
Pasture Canyon Spring discharges to a small perennial stream that begins near the head of Pasture Canyon, a narrow box canyon carved into the Navajo Sandstone. Base flow begins near the head of the canyon from a piped spring. Discharge from that spring accounts for around 20 percent of the total flow measured at the streamflow gage, located approximately 0.25 mi downstream from the spring. The remaining base flow measured at the streamflow gage comes from additional springs issuing through the alluvium between the head of the canyon and the gage. Because the drainage area is small, very little surface runoff from rainstorms or snowmelt occurs above the Pasture Canyon Springs streamflow gage (fig. 14). In addition, most of the alluvium in the wash is composed of reworked dune sand, so precipitation tends to infiltrate rather than run off. During the operational period of record for the gage, the minimum daily mean discharge recorded was 0.14 ft3/s on September 5–8, 2017, and the maximum instantaneous discharge was 4.96 ft3/s on October 3, 2018.
Surface-Water Base Flow
Trends in the groundwater-discharge component of total flow at the four streamflow-gaging stations were evaluated on the basis of the median of 120 consecutive daily mean flows for four winter months (November through February) and used as a surrogate measure for base flow (fig. 15). Median winter streamflow is reported for the year in which the winter season began. For example, the period from November 2019–February 2020 is reported as winter 2019. Groundwater discharge was assumed to be constant throughout the year, and the median winter flow was assumed to represent constant annual groundwater discharge. Most flow that occurs during the winter is groundwater discharge; rainfall and snowmelt runoff are infrequent, and evapotranspiration is at a minimum during the winter. Not all groundwater discharge ends up as surface-water flow; during summer months, some or all groundwater discharge can be taken up by plants or can evaporate directly to the atmosphere. Rather than the average flow, the median flow for November, December, January, and February is used to estimate groundwater discharge because the median is less affected by occasional winter runoff. Nonetheless, the median flow for November, December, January, and February is an estimate of groundwater discharge rather than a calculation of base-flow groundwater discharge. A more rigorous and accurate calculation of base-flow would involve detailed evaluations of streamflow hydrographs, flows into and out of bank storage, gain and loss of streamflow as it moves down the stream channel, and interaction of groundwater in the N aquifer with groundwater in the shallow alluvial aquifers in the stream valleys. The median winter flow, however, is useful as a consistent, easily measurable index for evaluating possible temporal trends in groundwater discharge.
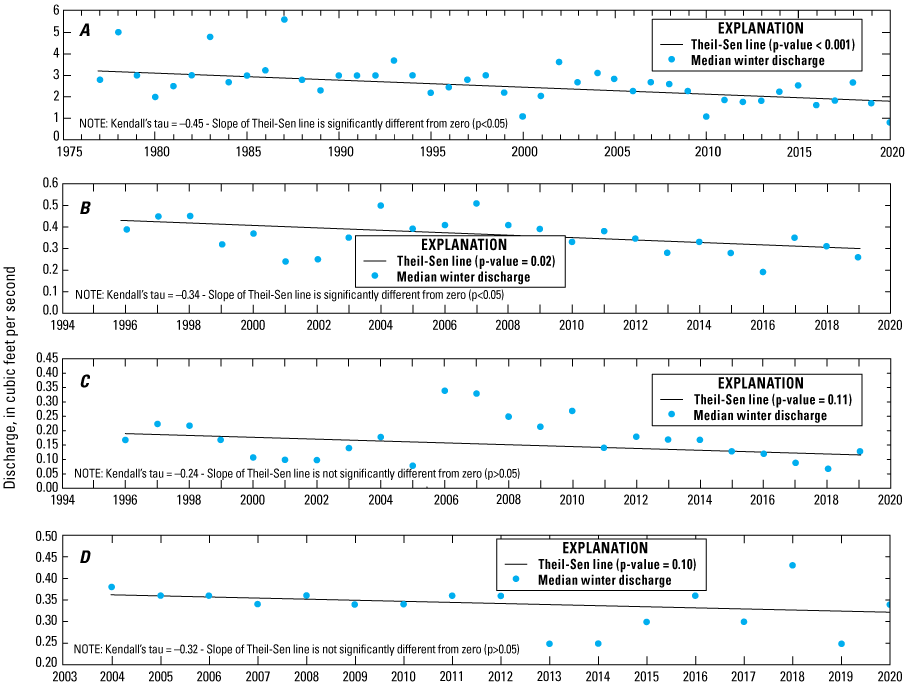
Plots of median winter discharge for November through February for Moenkopi Wash at Moenkopi, Ariz. (09401260) (A); Dinnebito Wash near Sand Springs, Ariz. (09401110) (B); Polacca Wash near Second Mesa, Ariz. (09400568) (C); and Pasture Canyon Springs near Tuba City, Ariz. (09401265) (D), Black Mesa area, northeastern Arizona, winter 1977–2020. Median winter flow is calculated by computing the median flow for 120 consecutive daily mean flows for the winter months of November, December, January, and February.
Median winter flows calculated for winter 2019 were 1.72 ft3/s for Moenkopi Wash at Moenkopi, 0.26 ft3/s for Dinnebito Wash near Sand Springs, 0.13 ft3/s for Polacca Wash near Second Mesa, and 0.25 ft3/s for Pasture Canyon Springs near Tuba City (fig. 15A–D). The median winter flows calculated for winter 2020 for Moenkopi Wash at Moenkopi and Pasture Canyon Springs near Tuba City were 0.82 and 0.34 ft3/s, respectively. Median winter flows were not calculated for winter 2020 for Dinnebito Wash and Polacca Wash because the streamflow gages were discontinued in October 2020. A significant decreasing trend in median winter flows, calculated using Kendall’s tau (p<0.05), is indicated at the Moenkopi Wash and Dinnebito Wash streamflow-gaging stations, but no significant trends are indicated at the Polacca Wash and Pasture Canyon Springs streamflow-gaging stations (fig. 15A–D).
Water Chemistry
Between 2020 and 2021, water samples for water-chemistry analyses were collected from four springs as part of the Black Mesa monitoring program. Field measurements were made, and water samples were analyzed for major ions; nutrients; and the trace elements arsenic, boron, and iron. Field measurements were made in accordance with standard USGS protocols as documented in the USGS National Field Manual for the Collection of Water-Quality Data (U.S. Geological Survey, variously dated). Field measurements include pH, specific conductance, temperature, dissolved oxygen, alkalinity, and discharge rates at springs. Field alkalinities were determined using incremental equivalence. Dissolved constituent samples were filtered through a 0.45-micron pore size filter and preserved according to sampling and analytical protocols. Laboratory analyses for samples were done at the USGS National Water Quality Laboratory (NWQL) according to techniques described in Fishman and Friedman (1989), Fishman (1993), Struzeski and others (1996), and Garbarino and others (2006).
Quality assurance for this study was maintained using standard USGS training of field personnel, use of standard USGS field protocols (U.S. Geological Survey, variously dated), collection of quality control (QC) samples, and thorough review of the analytical results. All USGS scientists involved with this study have participated in the USGS National Field Quality Assurance Program.
A QC sample was collected as part of the water-quality sampling of the Black Mesa monitoring program in 2020. A field blank sample was gathered during collection of field water-quality samples. The field blank was processed at Pasture Canyon Spring during the collection of an environmental sample. Concentrations of analytes in the field blank were below the NWQL detection limit (table 14).
Table 14.
Chemical analyses of a field blank water sample processed at Pasture Canyon Spring, Black Mesa area, northeastern Arizona, 2020.[mg/L, milligrams per liter; <, less than; μg/L, micrograms per liter; °C, degrees Celsius]
In past years, water-chemistry samples were systematically collected from as many as 12 different wells as part of the Black Mesa monitoring program. No wells were sampled in 2020 or 2021 owing to budgetary constraints. Since 1989, samples have been collected from the same four springs: Moenkopi School Spring, Burro Spring, Pasture Canyon Spring, and Unnamed Spring near Dennehotso, and between 2020 and 2021, all four springs were sampled. Long-term data for specific conductance, dissolved solids, chloride, and sulfate for the wells and springs sampled each year are shown in the annual reports (table 2). These constituents are monitored on an annual basis because an increase in the concentration of these constituents in the N aquifer could indicate leakage from the overlying D aquifer. On average, the concentration of dissolved solids in water from the D aquifer is about 7 times greater than that of water from the N aquifer, the concentration of chloride ions is about 11 times greater, and concentration of sulfate ions is about 30 times greater (Eychaner, 1983). Historical data for other constituents for all the wells and springs in the Black Mesa study area are available from the USGS National Water Information System Web Interface for water-quality data (https://waterdata.usgs.gov/nwis/qw), and they can also be found in monitoring reports cited in the “Previous Investigations” section of this report and listed in table 2.
Water-Chemistry Data for Springs that Discharge from the N Aquifer
Between 2020 and 2021, water samples were collected from Moenkopi School Spring, Burro Spring, Pasture Canyon Spring, and Unnamed Spring near Dennehotso (figs. 12, 16). Geologic maps and field observations indicate that these four springs discharge water from the unconfined part of the N aquifer. At Moenkopi School Spring, samples were collected from a horizontal metal pipe built into the hillside to collect water from the spring. At Burro Spring, samples are usually collected from the end of a pipe that fills a trough for cattle, but in 2020 and 2021, the samples were collected directly from the stone spring box. At Pasture Canyon Spring, samples were collected from a pipe at the end of a channel that is approximately 50 ft away from the spring. At Unnamed Spring near Dennehotso, samples were collected from a pool along the bedrock wall from which the spring discharges.
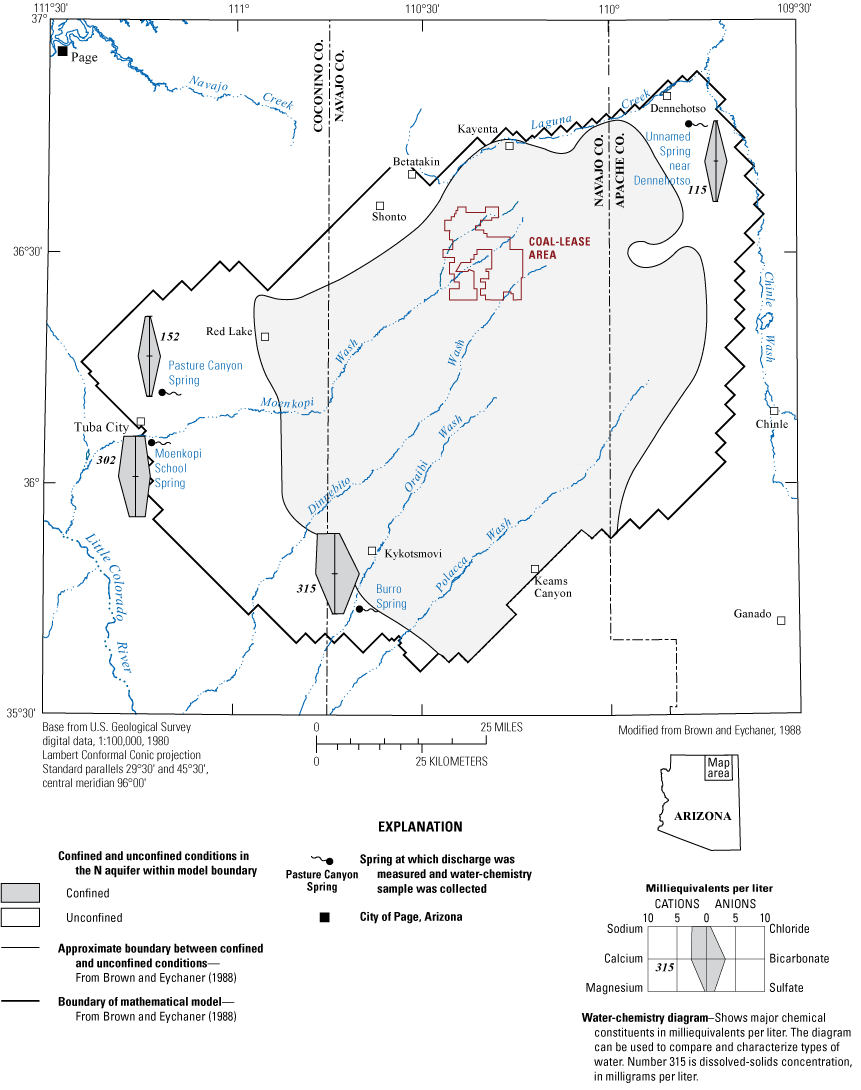
Map showing water chemistry and distribution of dissolved solids at springs in the N aquifer, Black Mesa area, northeastern Arizona, 2020–2021.
Samples from all springs yielded a calcium bicarbonate-type water, except Burro Spring, which had a sodium-calcium bicarbonate-type water (fig. 16, table 15). Dissolved solid concentrations measured 302 milligrams per liter (mg/L) at Moenkopi School Spring, 313 and 315 mg/L at Burro Spring in 2020 and 2021, respectively, 152 mg/L at Pasture Canyon Spring, and 115 mg/L at Unnamed Spring near Dennehotso (tables 15 and 16). Chloride concentration was highest at Moenkopi School Spring (45.1 mg/L; tables 15 and 16). Concentration of sulfate also was highest at Moenkopi School Spring (63.6 mg/L; tables 15 and 16).
Table 15.
Physical properties and chemical analyses of water samples from four springs in the Black Mesa area, northeastern Arizona, 2020–2021.[—Left][Specific cond., specific conductance; μS/cm, microsiemens per centimeter at 25 °C; temp., temperature; °C, degree Celsius; TDS, total dissolved solids; mg/L, milligrams per liter; Ca, calcium; diss., dissolved; Mg, magnesium; K, potassium; Na, sodium; Cl, chloride; F, fluoride; SiO2, silica; SO4, sulfate; N, nitrate + nitrite; Fe, iron; μg/L, micrograms per liter; As, arsenic; B, boron; <, less than]
Table 16.
Specific conductance and concentrations of selected chemical constituents in N-aquifer water samples from four springs in the Black Mesa area, northeastern Arizona, 1948–2021.[μS/cm, microsiemens per centimeter at 25°C; °C, degrees Celsius; mg/L, milligrams per liter; —, no data]
Chemical constituents analyzed from the four springs were compared to the U.S. Environmental Protection Agency (EPA) primary and secondary drinking water standards (EPA, 2023a, b). Maximum contaminant levels (MCLs), which are the primary regulations, are legally enforceable standards that apply to public water systems. They protect drinking-water quality by limiting the levels of specific contaminants that can adversely affect public health. Secondary maximum contaminant levels (SMCLs) provide guidelines for the control of contaminants that may cause cosmetic effects (such as skin or tooth discoloration) or aesthetic effects (such as taste, odor, or color) in drinking water. The EPA recommends compliance with SMCLs for public water systems; however, compliance is not enforced. Concentrations of all the analyzed constituents in samples from all four springs were less than current EPA MCLs and SMCLs.
Concentrations of dissolved solids, chloride, and sulfate in water from Moenkopi School Spring show significant increasing trends (p<0.05) (table 16, fig. 17). Concentrations of the same constituents from Burro Spring, Pasture Canyon Spring, and Unnamed Spring near Dennehotso either showed no significant trends or showed decreasing trends (table 16, fig. 17). At Burro Spring, no significant trend was present in dissolved solids, while both chloride and sulfate had a decreasing trend. At Pasture Canyon Spring, both dissolved solids and sulfate showed no significant trend while chloride showed a decreasing trend. The magnitude of the change in chloride concentrations at Pasture Canyon Spring is small, and, because of the scaling used on the y axis in figure 17B to allow plotting results from other springs with higher concentrations of chloride, the trend is difficult to see. Significant trends were not detected in any of the three constituents at Unnamed Spring near Dennehotso. However, in 2010, 2011, and 2012, Unnamed Spring near Dennehotso showed an increase in dissolved solids concentrations; this trend may be a result of sampling from an alternate sample location. Since then, Unnamed Spring near Dennehotso has been sampled from the same location that was used prior to 2010, and the results for dissolved-solids analysis returned to levels observed prior to 2010 (fig. 17).
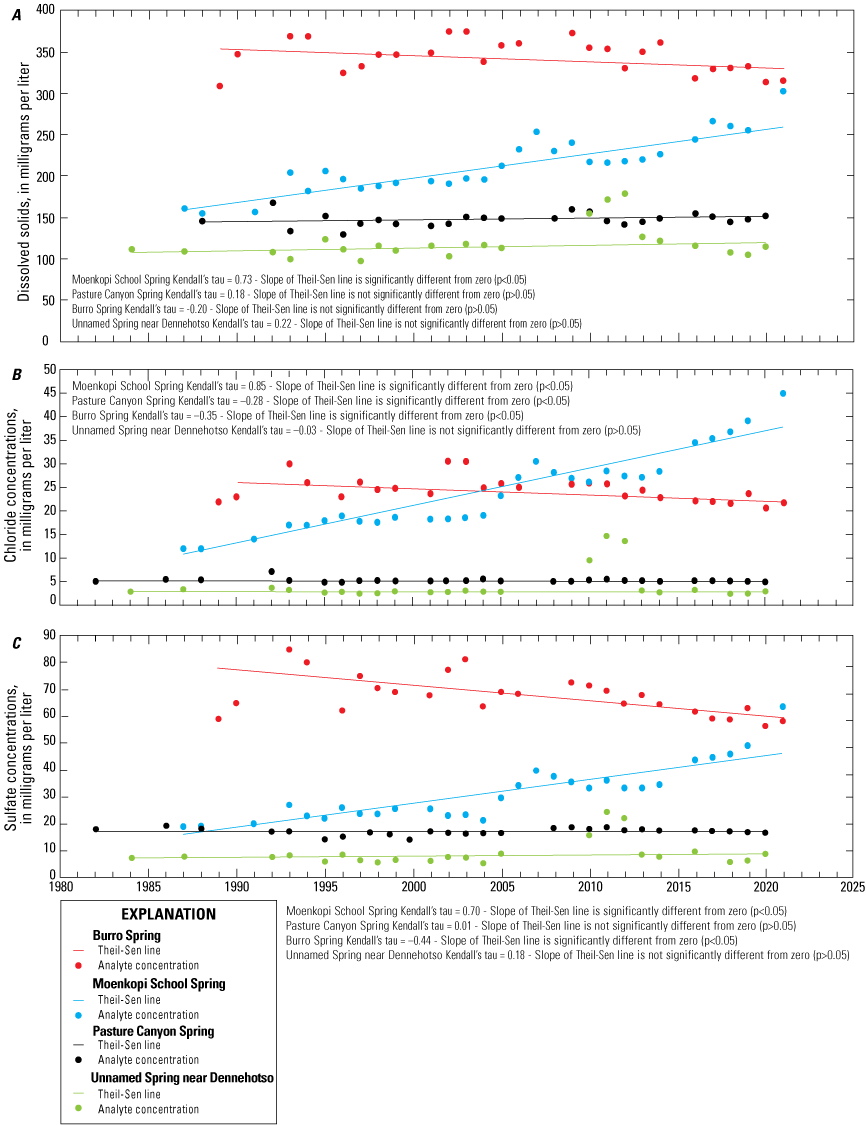
Plots of concentrations of dissolved solids (A), chloride (B), and sulfate (C) for water samples from Moenkopi School Spring, Burro Spring, Pasture Canyon Spring, and Unnamed Spring near Dennehotso, which discharge from the N aquifer, Black Mesa area, northeastern Arizona, 1982–2021.
Summary
The Navajo (N) aquifer is extensive and serves as the primary source of groundwater for industrial and municipal users in the Black Mesa area of northeastern Arizona. Availability of quality water is an important issue in the Black Mesa area because of past industrial use and continued municipal use, a growing population, and limited precipitation. This report presents results of groundwater, surface-water, and water-chemistry monitoring in the Black Mesa area from January 2020 to December 2021, and, additionally, uses streamflow statistics from November and December 2019. These monitoring data are compared to historical data from the 1950s through December 2021.
In 2021, total groundwater withdrawals were about 2,570 acre-feet (acre-ft), industrial withdrawals were about 160 acre-ft, and municipal withdrawals were about 2,410 acre-ft. From the prestress period (before 1965) to 2021, water levels in the unconfined areas of the N aquifer had a median change of −0.4 feet (ft), and the changes ranged from −42.4 ft to +8.4 ft. Water levels in the confined area of the N aquifer had a median change of −25.9 ft, and the changes ranged from −133.7 ft to +17.3 ft. However, the well in the confined area that has shown the largest declines in water level since predevelopment (Keams Canyon PM2) was not measured in 2021. In 2020, it showed a 181.4 ft decline since predevelopment.
Discharge has been measured intermittently at Moenkopi School Spring, Pasture Canyon Spring, Burro Spring, and Unnamed Spring near Dennehotso. For the period of record, discharge at Moenkopi School Spring and Unnamed Spring near Dennehotso has fluctuated, and the data indicate a decreasing trend in discharge for both springs; however, no trend is apparent for either Burro Spring or Pasture Canyon Spring.
Streamflow was measured continuously during calendar years 2020 and 2021 at the Moenkopi Wash at Moenkopi and Pasture Canyon Springs near Tuba City streamflow-gaging stations and was measured continuously through September 30, 2020, at the Dinnebito Wash near sand springs and Polacca Wash near Second Mesa streamflow-gaging stations. Median flows for November through February of each winter are used as an indicator of groundwater discharge to those streams. For the period of record at Moenkopi Wash and Dinnebito Wash, winter flows indicate a decreasing trend in discharge. Winter flows at Polacca Wash and Pasture Canyon Springs have fluctuated but show neither a significant increase nor decrease.
Between 2020 and 2021, water samples were collected at four springs and were analyzed for selected chemical constituents. A field blank was collected at Pasture Canyon Spring during the collection of an environmental sample. Concentrations of analytes in the field blank were below the National Water Quality Laboratory method detection limit. Dissolved-solids concentrations in water samples from Moenkopi School Spring, Burro Spring, Pasture Canyon Spring, and Unnamed Spring near Dennehotso were 302 milligrams per liter (mg/L), 315 mg/L, 152 mg/L, and 115 mg/L, respectively. From the mid-1980s to 2021, long-term data from Moenkopi School Spring indicate increasing concentrations of dissolved solids, chloride, and sulfate. Concentrations of the same constituents from Burro Spring, Pasture Canyon Spring, and Unnamed Spring near Dennehotso either showed no significant trends or showed decreasing trends.
References Cited
Beitler, B., Parry, W.T., and Chan, M.A., 2003, Bleaching of Jurassic Navajo Sandstone on Colorado Plateau Laramide highs—Evidence of exhumed hydrocarbon supergiants?: Geology, v. 31, no. 12, p. 1041–1044, https://doi.org/10.1130/G19794.1.
Beitler, B., Parry, W.T., and Chan, M.A., 2005, Fingerprints of fluid flow—Chemical diagenetic history of the Jurassic Navajo Sandstone, southern Utah, U.S.A.: Journal of Sedimentary Research, v. 75, no. 4, p. 547–561, https://doi.org/10.2110/jsr.2005.045.
Billingsley, G.H., Block, D., and Hiza Redsteer, M., 2013, Geologic map of the Winslow 30’ × 60’ quadrangle, Coconino and Navajo Counties, northern Arizona: U.S. Geological Survey Scientific Investigations Map 3247, pamphlet 25 p., 3 sheets, scale 1:50,000, accessed June 2018, at https://pubs.usgs.gov/sim/3247/.
Billingsley, G.H., Stoffer, P.W., and Priest, S.S., 2012, Geologic map of the Tuba City 30’ × 60’ quadrangle, Coconino County, northern Arizona: U.S. Geological Survey Scientific Investigations Map 3227, pamphlet 31 p., 3 sheets, scale 1:50,000, accessed November 2017, at https://pubs.usgs.gov/sim/3227/.
Blakey, R.C., 2008, Pennsylvanian-Jurassic sedimentary basins of the Colorado Plateau and Southern Rocky Mountains, in Miall, A.D., ed., The sedimentary basins of the United States and Canada: Amsterdam, Elsevier, p. 245–296, https://doi.org/10.1016/S1874-5997(08)00007-5.
Blakey, R.C., Peterson, F., Caputo, M.V., Geesaman, R.C., and Voorhees, B.J., 1983, Paleogeography of Middle Jurassic continental, shoreline, and shallow marine sedimentation, southern Utah, in Reynolds, M.W., and Dolly, E.D., eds., Mesozoic paleogeography of west-central United States—Rocky Mountain Paleogeography Symposium 2: Denver, Colo., Society of Economic Paleontologists and Mineralogists, Rocky Mountain Section, p. 77–100.
Clemmensen, L.B., Olsen, H., and Blakey, R.C. 1989, Erg-margin deposits in the Lower Jurassic Moenave Formation and Wingate Sandstone, southern Utah: Geologic Society of America Bulletin, v. 101, no. 6, p. 759–773, https://doi.org/10.1130/0016-7606(1989)101<0759:EMDITL>2.3.CO;2.
Cooley, M.E., Harshbarger, J.W., Akers, J.P., and Hardt, W.F., 1969, Regional hydrogeology of the Navajo and Hopi Indian Reservations, Arizona, New Mexico, and Utah: U.S. Geological Survey Professional Paper 521–A, 61 p., https://doi.org/10.3133/pp521A.
Daly, C., Neilson, R.P., and Phillips, D.L., 1994, A statistical-topographic model for mapping climatological precipitation over mountainous terrain: Journal of Applied Meteorology, v. 33, p. 140–158, https://doi.org/10.1175/1520-0450(1994)033<0140:ASTMFM>2.0.CO;2.
Dubiel, R.F., 1989, Sedimentology and revised nomenclature for the upper part of the Upper Triassic Chinle Formation and the Lower Jurassic Wingate Sandstone, northwestern New Mexico and northeastern Arizona, in Anderson, O.J., Lucas, S.G., Love, D.W., and Cather, S.M., eds., Southeastern Colorado Plateau—40th Annual Fall Field Conference Guidebook: New Mexico Geological Society, p. 213–223.
Fishman, M.J., ed., 1993, Methods of analysis by the U.S. Geological Survey National Water Quality Laboratory—Determination of inorganic and organic constituents in water and fluvial sediments: U.S. Geological Survey Open-File Report 93–125, 217 p., https://doi.org/10.3133/ofr93125.
Flowers, R.M., 2010, The enigmatic rise of the Colorado Plateau: Geology, v. 38, no. 7, p. 671–672, https://doi.org/10.1130/focus072010.1.
Harshbarger, J.W., Repenning, C.A., and Irwin, J.H., 1957, Stratigraphy of the uppermost Triassic and the Jurassic rocks of the Navajo country: U.S. Geological Survey Professional Paper 291, 74 p., https://doi.org/10.3133/pp291.
Hart, R.J., and Sottilare, J.P., 1988, Progress report on the ground-water, surface-water, and quality-of-water monitoring program, Black Mesa area, northeastern Arizona—1987–88: U.S. Geological Survey Open-File Report 88–467, 27 p., https://doi.org/10.3133/ofr88467.
Hart, R.J., and Sottilare, J.P., 1989, Progress report on the ground-water, surface-water, and quality-of-water monitoring program, Black Mesa area, northeastern Arizona—1988–89: U.S. Geological Survey Open-File Report 89–383, 33 p., https://doi.org/10.3133/ofr89383.
Helsel, D.R., Hirsch, R.M., Ryberg, K.R., Archfield, S.A., and Gilroy, E.J., 2020, Statistical methods in water resources: U.S. Geological Survey Techniques and Methods, book 4, chap. A3, 458 p., https://doi.org/10.3133/tm4a3.
Hill, G.W., 1985, Progress report on Black Mesa monitoring program—1984: U.S. Geological Survey Open-File Report 85–483, 24 p., https://doi.org/10.3133/ofr85483.
Hill, G.W., and Sottilare, J.P., 1987, Progress report on the ground-water, surface-water, and quality-of-water monitoring program, Black Mesa area, northeastern Arizona—1987: U.S. Geological Survey Open-File Report 87–458, 29 p., https://doi.org/10.3133/ofr87458.
Hill, G.W., and Whetten, M.I., 1986, Progress report on Black Mesa monitoring program—1985–86: U.S. Geological Survey Open-File Report 86–414, 23 p., https://doi.org/10.3133/ofr86414W.
HSIGeoTrans, Inc., and Waterstone Environmental Hydrology and Engineering, Inc., 1999, A three-dimensional flow model of the D and N aquifers, Black Mesa Basin, Arizona: Peabody Western Coal Company, 75 p., report prepared by HSIGeoTrans, Inc., and Waterstone Environmental Hydrology and Engineering, Inc.
Imlay, R.W., 1980, Jurassic paleobiogeography of the conterminous United States in its continental setting: U.S. Geological Survey Professional Paper 1062, 134 p., https://doi.org/10.3133/pp1062.
Lazear, G., Karlstrom, K., Aslan, A., and Kelly, S., 2013, Denudation and flexural isostatic response of the Colorado Plateau and southern Rocky Mountains region since 10 Ma: Geosphere, v. 9, no. 4, p. 792–814, https://doi.org/10.1130/GES00836.1.
Lee, L., 2020, NADA—Nondetects and data analysis for environmental data, package (ver. 1.6-1.1): the Comprehensive R Archive Network web page, accessed December 16, 2020, at https://cran.r-project.org/package=NADA.
Littin, G.R., Baum, B.M., and Truini, M., 1999, Ground-water, surface-water, and water-chemistry data, Black Mesa area, northeastern Arizona—1997: U.S. Geological Survey Open-File Report 98–653, 27 p., https://doi.org/10.3133/ofr98653.
Littin, G.R., and Monroe, S.A., 1996, Ground-water, surface-water, and water-chemistry data, Black Mesa area, northeastern Arizona—1995: U.S. Geological Survey Open-File Report 96–616, 22 p., https://doi.org/10.3133/ofr96616.
Littin, G.R., and Monroe, S.A., 1997, Ground-water, surface-water, and water-chemistry data, Black Mesa area, northeastern Arizona—1996: U.S. Geological Survey Open-File Report 97–566, 27 p., https://doi.org/10.3133/ofr97566.
Luttrell, P.R., 1993, Basinwide sedimentation and the continuum of paleoflow in an ancient river system—Kayenta Formation (Lower Jurassic), central portion Colorado Plateau, in Fielding, C.R., ed., Current research in fluvial sedimentology: Sedimentary Geology, v. 85, p. 411–434, https://doi.org/10.1016/0037-0738(93)90096-N.
Macy, J.P., 2009, Groundwater, surface-water, and water-chemistry data, Black Mesa area, northeastern Arizona—2007–2008: U.S. Geological Survey Open-File Report 2009–1148, 43 p., https://doi.org/10.3133/ofr20091148.
Macy, J.P., 2010, Groundwater, surface-water, and water-chemistry data, Black Mesa area, northeastern Arizona—2008–2009: U.S. Geological Survey Open-File Report 2010–1038, 43 p., https://doi.org/10.3133/ofr20101038.
Macy, J.P., Brown, C.R., and Anderson, J.R., 2012, Groundwater, surface-water, and water-chemistry data, Black Mesa area, northeastern Arizona—2010–2011: U.S. Geological Survey Open-File Report 2012–1102, 41 p., https://doi.org/10.3133/ofr20121102.
Macy, J.P., and Mason, J.P., 2017, Groundwater, surface-water, and water-chemistry data, Black Mesa area, northeastern Arizona—2013–2015: U.S. Geological Survey Open-File Report 2017–1127, 49 p., https://doi.org/10.3133/ofr20171127.
Macy, J.P., and Truini, M., 2016, Groundwater, surface-water, and water-chemistry data, Black Mesa area, northeastern Arizona—2012–2013: U.S. Geological Survey Open-File Report 2015–1221, 43 p., https://doi.org/10.3133/ofr20151221.
Macy, J.P., and Unema, J.A., 2014, Groundwater, surface-water, and water-chemistry data, Black Mesa area, northeastern Arizona—2011–2012: U.S. Geological Survey Open-File Report 2013–1304, 42 p., https://doi.org/10.3133/ofr20131304.
Mason, J.P., 2021, Groundwater, surface-water, and water-chemistry data, Black Mesa area, northeastern Arizona—2016–2018: U.S. Geological Survey Open-File Report 2021–1124, 50 p., https://doi.org/10.3133/ofr20211124.
Mason, J.P., 2022, Groundwater, surface-water, and water-chemistry data, Black Mesa area, northeastern Arizona—2018–2019: U.S. Geological Survey Open-File Report 2022–1086, 47 p., https://doi.org/10.3133/ofr20221086.
Mason, J.P., and Macy, J.P., 2018, Groundwater, surface-water, and water-chemistry data, Black Mesa area, northeastern Arizona—2015–2016: U.S. Geological Survey Open-File Report 2018–1193, 60 p., https://doi.org/10.3133/ofr20181193.
McKee, E.D., and MacLachlan, M.E., 1959, Stratigraphic problems of the Wingate sandstone, Moenave formation, and related units, in McKee, E.D., Oriel, S.S., Ketner, K.B., MacLachlan, M.E., Goldsmith, J.W., MacLachlan, J.C., and Mudge, M.R., Paleotectonic maps of the Triassic System: U.S. Geological Survey Miscellaneous Geologic Investigations Map I-300, p. 22, pl. 8, figs. 4–6.
Molenaar, C.M., 1983, Major depositional cycles and regional correlations of Upper Cretaceous rocks, southern Colorado Plateau and adjacent areas, in Reynolds, M.W., and Dolly, E.D., eds., Mesozoic paleogeography of west-central United States: Society for Sedimentary Geology, Rocky Mountain Section, p. 201–224.
O’Sullivan, R.B., Repenning, C.A., Beaumont, E.C., and Page, H.G., 1972, Stratigraphy of the Cretaceous rocks and the Tertiary Ojo Alamo Sandstone, Navajo and Hopi Indian reservations, Arizona, New Mexico, and Utah: U.S. Geological Survey Professional Paper 521–E, 65 p., https://doi.org/10.3133/pp521E.
Page, H.G., and Repenning, C.A., 1958, Late Cretaceous stratigraphy of Black Mesa, Navajo and Hopi Indian reservations, Arizona, in Anderson, R.Y., and Harshbarger, J.W., eds., New Mexico Geological Society Fall Field Conference Guidebook—9—Black Mesa Basin (Northeastern Arizona): New Mexico Geological Society, 9th Annual Field Conference, p. 115–122.
PRISM Climate Group, 2018, Norm81m: Corvallis, Oreg., Oregon State University, PRISM Climate Group, accessed March 1, 2018, at http://prism.oregonstate.edu.
R Development Core Team, 2022, R—A language and environment for statistical computing: Vienna, Austria, R Foundation for Statistical Computing, accessed August 2022, at https://www.r-project.org/.
Struzeski, T.M., DeGiacomo, W.J., and Zayhowski, E.J., 1996, Methods of analysis by the U.S. Geological Survey National Water Quality Laboratory—Determination of dissolved aluminum and boron in water by inductively coupled plasma-atomic emission spectrometry: U.S. Geological Survey Open-File Report 96–149, 17 p., https://doi.org/10.3133/ofr96149.
Tanner, L.H., and Lucas, S.G., 2007, The Mojave Formation—Sedimentologic and stratigraphic context of the Triassic–Jurassic boundary in the Four Corners area, southwestern U.S.A: Palaeogeography, Palaeoclimatology, Palaeoecology, v. 244, p. 111–125, https://doi.org/10.1016/j.palaeo.2005.06.039.
Thomas, B.E., 2002b, Ground-water, surface-water, and water-chemistry data, Black Mesa area, northeastern Arizona—2001–02: U.S. Geological Survey Open-File Report 02–485, 43 p., https://doi.org/10.3133/ofr02485.
Thomas, B.E., and Truini, M., 2000, Ground-water, surface-water, and water-chemistry data, Black Mesa area, northeastern Arizona–1999: U.S. Geological Survey Open-File Report 00–453, 42 p., https://doi.org/10.3133/ofr00453.
Truini, M., Baum, B.M., Littin, G.R., and Shingoitewa-Honanie, G., 2000, Ground-water, surface-water, and water-chemistry data, Black Mesa area, northeastern Arizona—1998: U.S. Geological Survey Open-File Report 00–66, 37 p., https://doi.org/10.3133/ofr0066.
Truini, M., and Macy, J.P., 2005, Lithology and thickness of the Carmel Formation as related to leakage between the D and N aquifer, Black Mesa, Arizona: U.S. Geological Survey Scientific Investigations Report 2005–5187, 7 p., https://doi.org/10.3133/sir20055187.
Truini, M., and Macy, J.P., 2006, Ground-water, surface-water, and water-chemistry data, Black Mesa area, northeastern Arizona—2004–05: U.S. Geological Survey Open-File Report 2006–1058, 42 p., https://doi.org/10.3133/ofr20061058.
Truini, M., and Macy, J.P., 2007, Ground-water, surface-water, and water-chemistry data, Black Mesa area, northeastern Arizona—2005–06: U.S. Geological Survey Open-File Report 2007–1041, 42 p., https://doi.org/10.3133/ofr20071041.
Truini, M., and Macy, J.P., 2008, Ground-water, surface-water, and water-chemistry data, Black Mesa area, northeastern Arizona—2006–07: U.S. Geological Survey Open-File Report 2008–1324, 33 p., https://doi.org/10.3133/ofr20081324.
Truini, M., Macy, J.P., and Porter, T.J., 2005, Ground-water, surface-water, and water-chemistry data, Black Mesa area, northeastern Arizona—2003–04: U.S. Geological Survey Open-File Report 2005–1080, 44 p., https://doi.org/10.3133/ofr20051080.
Truini, M., and Thomas, B.E., 2004, Ground-water, surface-water, and water-chemistry data, Black Mesa area, northeastern Arizona—2002–03: U.S. Geological Survey Open-File Report 03–503, 43 p., https://doi.org/10.3133/ofr2003503.
Turner, C.E., and Peterson, F., 2004, Reconstruction of the Upper Jurassic Morrison Formation extinct ecosystem—A synthesis: Sedimentary Geology, v. 167, p. 309–355, https://doi.org/10.1016/j.sedgeo.2004.01.009.
U.S. Environmental Protection Agency [EPA], 2023a, National primary drinking water regulations: U.S. Environmental Protection Agency website, accessed January, 2023, at https://www.epa.gov/ground-water-and-drinking-water/national-primary-drinking-water-regulations.
U.S. Environmental Protection Agency [EPA], 2023b, Secondary drinking water standards—Guidance for nuisance chemicals: U.S. Environmental Protection Agency website, accessed January, 2023, at https://www.epa.gov/sdwa/secondary-drinking-water-standards-guidance-nuisance-chemicals.
U.S. Geological Survey, [variously dated], National field manual for the collection of water-quality data: U.S. Geological Survey Techniques of Water-Resources Investigations, book 9, chaps. A1–A10, accessed January 2018, at https://pubs.water.usgs.gov/twri9A.
Williams, H., 1936, Pliocene volcanoes of the Navajo-Hopi Country: Geological Society of America Bulletin, v. 47, no. 1, p. 111–172, https://doi.org/10.1130/GSAB-47-111.
Zhu, C., 2000, Estimate of recharge from radiocarbon dating of groundwater and numerical flow and transport modeling: Water Resources Research, v. 36, no. 9, p. 2607–2620, https://doi.org/10.1029/2000WR900172.
Zhu, C., and Kipfer, R., 2010, Noble gas signatures of high recharge pulses and migrating jet stream in the late Pleistocene over Black Mesa, Arizona, United States: Geology, v. 38, no. 1, p. 83–86, https://doi.org/10.1130/G30369.1.
Zhu, C., Waddell, R.K., Jr., Star, I., and Ostrander, M., 1998, Responses of ground water in the Black Mesa basin, northeastern Arizona, to paleoclimatic changes during the late Pleistocene and Holocene: Geology, v. 26, no. 2, p. 127–130, https://doi.org/10.1130/0091-7613(1998)026<0127:ROGWIT>2.3.CO;2.
Conversion Factors
U.S. customary units to International System of Units
International System of Units to U.S. customary units
Temperature in degrees Celsius (°C) may be converted to degrees Fahrenheit (°F) as °F = (1.8 × °C) + 32.
Temperature in degrees Fahrenheit (°F) may be converted to degrees Celsius (°C) as follows: °C = (°F – 32) / 1.8.
Datum
Vertical coordinate information is referenced to the National Geodetic Vertical Datum of 1929 (NGVD 29).
Horizontal coordinate information is referenced to the North American Datum of 1927 (NAD 27).
Supplemental Information
Specific conductance is given in microsiemens per centimeter at 25 degrees Celsius (µS/cm at 25 °C).
Concentrations of chemical constituents in water are given in either milligrams per liter (mg/L) or micrograms per liter (µg/L).
Abbreviations
BIA
Bureau of Indian Affairs
C aquifer
Coconino aquifer
D aquifer
Dakota aquifer
EPA
U.S. Environmental Protection Agency
MCL
maximum contaminant level
N aquifer
Navajo aquifer
NTUA
Navajo Tribal Utility Authority
NWIS
National Water Information System
NWQL
National Water Quality Laboratory
PWCC
Peabody Western Coal Company
QC
quality control
SMCL
secondary maximum contaminant level
T aquifer
Toreva aquifer
USGS
U.S. Geological Survey
Publishing support provided by the Moffett Field Publishing Service Center
Manuscript approved for publication March 15, 2024
Edited by Phil Frederick
Illustration support by Cory Hurd and Kimber Petersen
Layout by Cory Hurd
Disclaimers
Any use of trade, firm, or product names is for descriptive purposes only and does not imply endorsement by the U.S. Government.
Although this information product, for the most part, is in the public domain, it also may contain copyrighted materials as noted in the text. Permission to reproduce copyrighted items must be secured from the copyright owner.
Suggested Citation
Mason, J.P., 2024, Groundwater, surface-water, and water-chemistry data, Black Mesa area, northeastern Arizona—2019–2021: U.S. Geological Survey Open-File Report 2024–1019, 47 p., https://doi.org/10.3133/ofr20241019.
ISSN: 2331-1258 (online)
Study Area
| Publication type | Report |
|---|---|
| Publication Subtype | USGS Numbered Series |
| Title | Groundwater, surface-water, and water-chemistry data, Black Mesa area, northeastern Arizona—2019–2021 |
| Series title | Open-File Report |
| Series number | 2024-1019 |
| DOI | 10.3133/ofr20241019 |
| Publication Date | June 14, 2024 |
| Year Published | 2024 |
| Language | English |
| Publisher | U.S. Geological Survey |
| Publisher location | Reston, VA |
| Contributing office(s) | Arizona Water Science Center |
| Description | vii, 48 p. |
| Country | United States |
| State | Arizona |
| Other Geospatial | Black Mesa Area |
| Online Only (Y/N) | Y |