

Using Structured Decision Making to Assess Management Alternatives to Inform the 2024 Update of the Minnesota Invasive Carp Action Plan
Links
- Document: Report (1.3 MB pdf) , HTML , XML
- Table: Table 1.1
- Download citation as: RIS | Dublin Core
Acknowledgments
We thank all of the participants in this process for their time and effort in providing input, reviewing documents, and completing all of the offline work. We also thank the Minnesota Department of Natural Resources for funding this work. Lastly, we thank C. Aldredge with the U.S. Fish and Wildlife Service, K. Filer Robinson with the U.S. Geological Survey, and G. Loppnow with the Minnesota Department of Natural Resources for providing constructive reviews of this report.
Abstract
This report summarizes the results of a structured decision making process started by the Minnesota Department of Natural Resources to develop and evaluate various invasive carp management strategies to inform a 2024 update of the Minnesota Invasive Carp Action Plan. The Minnesota Department of Natural Resources invited State, Federal, Tribal, and nongovernmental organization partners to participate in online and in-person workshops to elicit concerns and perform an expert-based assessment of potential invasive carp management strategies to address those concerns. The participatory group divided into two subgroups: the values team and the technical team. The values team specified 12 management objectives that captured the major interest group concerns. The technical and values teams developed 18 different invasive carp management strategies to compare. The technical team then scored each strategy in terms of how well it met each management objective. The values team weighted the management objectives to assess where tradeoffs might need to be made. The results of this process captured the wide range of partner concerns and technical opinions using a transparent, repeatable, and rigorous method. The analyses suggest that tradeoffs between management efficacy and cost are likely. Furthermore, considerable uncertainty exists among the technical experts regarding which strategy is likely to be most effective or cost-efficient. Followup analyses were done to assess how resolving uncertainty among experts could affect decision making and guide future monitoring efforts.
Introduction
The Minnesota Department of Natural Resources (MNDNR) Invasive Carp Action Plan (hereafter “plan”) guides management actions to control bighead carp (Hypophthalmichthys nobilis), black carp (Mylopharyngodon piceus), grass carp (Ctenopharyngodon idella), and silver carp (H. molitrix; hereafter “invasive carp” refers to the four carp species collectively). The plan was first developed in 2011 by the MNDNR, Federal and State management partners, and interest groups (for example, advocacy organizations) to limit the spread and effect of invasive carp in Minnesota waters. The plan was revised in 2014, and an addendum was added in 2020 to provide additional detail on the status of invasive carp in Minnesota waters and recent scientific developments.
The original plan was written when invasive carp captures numbered less than (<) 10 individuals yearly. In recent years, captures of invasive carp in Minnesota have increased, likely because of hydrological events in the Mississippi River. For example, flooding in 2019 likely facilitated the upstream movement of invasive carp in the Mississippi River, and recent captures indicate that many of these fish are now sexually mature. However, no reproduction has been detected in Minnesota waters, but aggressive management actions may be needed to prevent reproduction from occurring and populations becoming established in Minnesota waters.
The MNDNR would like input from decision makers from other management agencies, interest groups, and the public about how to enhance their current efforts to control invasive carp. Developments in invasive carp monitoring and control techniques provide new opportunities that should be considered for application by the MNDNR in Minnesota waters. Because of the changing status of invasive carp in Minnesota waters and the potential availability of new invasive carp management actions, the plan urgently needs updating. This report outlines the results of a structured decision making (SDM) process that incorporates diverse values and expert opinion about invasive carp from within and outside of the MNDNR to evaluate options for managing invasive carp in Minnesota in a transparent and repeatable process. The result of this process was a synthesis of input from MNDNR partners and a set of analyses that the MNDNR can use as they update the plan.
Structured Decision Making Process
The MNDNR coordinated the workshops and invited more than 60 participants from 27 State, Federal, Tribal, or nongovernmental organizations:
-
○ Commercial fishing businesses
-
○ Friends of Pool 2
-
○ Friends of the Mississippi Rvier
-
○ Great Lakes Fishery Commission, Michigan State University
-
○ Goodhue County
-
○ Iowa Department of Natural Resources
-
○ Iowa State University
-
○ Lake City, Minnesota
-
○ Lake Pepin Legacy Alliance
-
○ Lower Sioux Indian Community
-
○ Minnesota Conservation Federation
-
○ Minnesota Department of Natural Resources
-
○ Minnesota House of Representatives
-
○ Minnesota State Senate
-
○ Minnesota Sportfishing Foundation Coalition
-
○ National Park Service
-
○ Prairie Island Indian Community
-
○ Shakopee Mdewakanton Sioux Community
-
○ Stop Carp Coalition
-
○ University of Minnesota
-
○ University of Minnesota, Minnesota Aquatic Invasive Species Research Center
-
○ University of Minnesota-Duluth
-
○ Upper Sioux Community
-
○ U.S. Army Corps of Engineers
-
○ U.S. Fish and Wildlife Service
-
○ U.S. Geological Survey
-
○ Wild Rivers Conservancy
-
○ Wisconsin Department of Natural Resources.
The workshop coordinators divided participants into two working groups based on their expertise and reason for involvement. The first group, the “values team,” represented the concerns of various interest groups, rightsholders, and regulatory agencies. The second group, called the “technical team,” consisted of people with technical expertise in invasive carp biology and control but did not represent regulatory or interest groups. The MNDNR coordinators invited two U.S. Geological Survey (USGS) decision analysts (the authors of this report) to facilitate the workshops. The coordinators and decision analysts made up the “core team.” See table 1 for the meeting schedule used in this process.
Table 1.
The timeline of virtual and in-person meetings needed to scope the problem, elicit objectives, develop invasive carp management strategies, and present preliminary findings.[Dates shown as year-month-day]
We used the SDM process outlined by Keeney (1992), Gregory and Keeney (2002), and Runge and others (2020), which breaks a decision down into components, analyzes the components, and reassembles the components into a more coherent structure. The first step in the process is for the decision makers and stakeholders to develop a consensus statement of the decision to be made and the considerations that should be included when making the decision. After developing the statement, the interest groups, rightsholders, and decision makers specify the objectives they would like to achieve by making the decision and assign measureable attributes to the objectives. Next, the participants develop a set of alternative actions or combinations of actions (strategies) to meet their objectives. The consequences of the alternative actions are then expressed in terms of the measureable attributes. The final step is to formally analyze tradeoffs and uncertainty regarding the best set of management strategies. In the following sections of this report, we detail how we used this process to help the MNDNR with soliciting input for updating their invasive carp management plan.
The process we used is a recognized method for enagaing with multiple values in the context of group decision making (Kurth and others, 2017). Furthermore, others have concluded that intensive engagement in processes, like SDM, improves decision quality because it provides a framework for integrating new ideas and provides others access to technical information (Beierle, 2002).
Problem Statement
All workshop participants had input into the formation of a coherent description of the decision problem to solve with this SDM process.
Problem Trigger and Background
The plan was developed in 2011 by the MNDNR, partners, and stakeholders to limit the spread and effects of invasive carp. The plan was revised in 2014, and an addendum was added in 2020 to document invasive carp status in Minnesota and scientific developments. An updated plan was triggered because of an increase in invasive carp abundance in Minnesota, the availability of new invasive carp monitoring and control techniques, political interest in the issue, and additional funding opportunities. The geographic scope of the plan includes the Upper Mississippi River Basin in Minnesota and watersheds at risk of invasion through high streamflow connections (fig. 1). The plan aims to guide MNDNR’s implementation of invasive carp management actions over the next 10 years by doing the following:
-
○ evaluating potential management actions;
-
○ considering uncertainties associated with the effectiveness of an action, current invasive carp status, implementation logistics, implementation authority, and public perception; and
-
○ identifying and acknowledging constraints associated with funding, permitting, long-term operation and maintenance, and personnel.
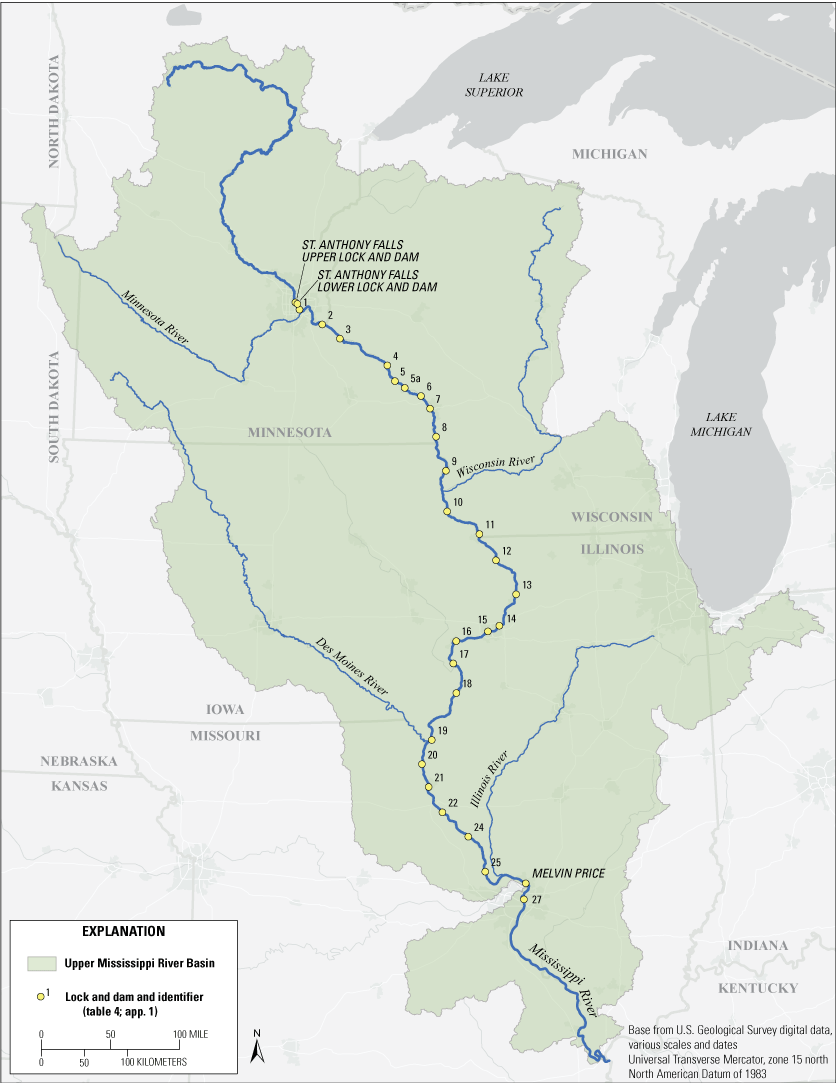
The Upper Mississippi River Basin and the location of lock and dam systems.
Supporting Action Plan Development
The SDM process detailed in this report was used to (1) determine the values of interest groups (values group), (2) identify potential management actions (technical group), (3) identify key uncertainties (values and technical groups), (4) evaluate the expected consequences of implementing a management action, and (5) evaluate tradeoffs among values elicited from the interest groups. The SDM process aims to be inclusive and to build trust among the many interested parties through facilitated virtual and in-person meetings. The process also aims to provide a transparent and repeatable science-based decision making process that can be used to inform subsequent updates of the plan. Additionally, the SDM process usually requires evaluation of potential decisions given interest group values framed as management objectives, makes clear the role of constraints like management action cost, and helps identify decision-relevant uncertainties and monitoring efforts. MNDNR authors plan to use the outcomes of the SDM process to draft a revised plan.
Process Goals
The goals that participants hoped to achieve include the following:
-
1. Evaluate potential management actions that may be implemented by nearby and downstream natural resource agencies and that may effect the tradeoffs between non-target species, ecological considerations, recreational activities, and short-term and long-term costs.
-
2. Consider uncertainties associated with inaction, action effectiveness and implementation (including logistics and authority), species history, location-specific invasive carp population status, invasion risk, and public perception.
-
3. Identify tradeoffs and uncertainties associated with implementing management actions in aquatic systems that are unoccupied by invasive carp; occupied by invasive carp where reproduction is not occurring (invaded); or are occupied by invasive carp and reproduction occurs consistently (established).
-
4. Determine invasive carp management action implementation constraints associated with, but not limited to, funding, permitting, long-term operation and maintenance, personnel, and agency capacity to execute available funds, and how these constraints could be overcome.
Management Objectives
We began the process of developing objectives by asking the values team to list their main concerns about choosing an invasive carp strategy. We then worked with the values team to reframe each concern as a desired outcome (noun) and a direction of preference (that is, “increase” or “decrease”). Next we sorted the objectives into means, which specify how a decision maker would like to influence their objectives, and ends, which are the outcomes that the decision maker is ultimately trying to influence. From this point forward, when we refer to “objectives” we are referring to the ends we elicited in this exercise.
The values team developed 12 objectives that spanned a range of concerns about the ecological, social, and financial consequences of taking action (table 2).
Table 2.
Values team objectives, descriptions of the effects they represent, and how they are measured.The technical team discussed developing metrics to measure how strategies would influence these outcomes, but due to a lack of data and time, the group felt it necessary to develop a scoring rubric to conduct the invasive carp strategy assessment. The technical team used this rubric to assess how effective alternative invasive carp management strategies may be at achieving management objectives using expert opinion. The scale was intended to represent a gradation of potential effect with 10 being the best, 5 being moderate or minor, and 0 being the worst.
Alternative Invasive Carp Management Strategies
Before the in-person workshop, we worked with the technical team to generate a wide-ranging list of alternative actions to be considered by the group and then organized these actions into themes. Table 3 shows how we organized the alternative actions and is often referred to as a “strategy generation table” (Clemen and Reilly, 2001). Participants can use this table to explore different combinations of actions, which we refer to as “strategies.”
Table 3.
Table used to generate strategies for managing invasive carp.[USACE, U.S. Army Corps of Engineers; eDNA, environmental DNA; BAFF, bioacoustic fish fence; MNDNR, Minnesota Department of Natural Resources]
At the in-person workshop, the group developed a set of invasive carp management strategies to be assessed by the technical team. Participants in the workshop included members from the values and technical teams; however, those who could attend the in-person workshop were a subset of all the participants in the virtual component of the process. Workshop participants began by identifying a “no action” alternative, assuming nothing was done to monitor or control invasive carp abundance or movement in Minnesota waters. They next identified the “current strategy,” which describes the actions the MNDNR is currently taking. For comparison, they developed an “unconstrained” strategy including all the management actions the group considered worthwhile regardless of feasibility or other tradeoffs. Lastly, they developed a “targeted investment” strategy, which includes only the basic management actions needed to begin controlling invasive carp movement and abundance within State waters. The “targeted investment” strategy has more actions than the current strategy (app. 1), and several of the strategies considered also contained the application of deterrent technologies at lock and dam systems to prevent invasive carp movement through the Mississippi River system (fig. 1). For the purposes of this effort, we did not specify a type of deterrent technology. We built the remaining 14 strategies out of the components of the first 4 strategies and the combination of deterrents (table 4; app. 1).
Table 4.
Strategies considered in the structured decision making process.Evaluating Consequences and Tradeoffs Among Strategies
After the in-person workshop, we asked the technical team to use their expertise to apply the rubric in table 2 to the 18 invasive carp management strategies in table 4. In total, we received scores from eight technical team experts (mean scores are in table 5). We highlighted the best-performing strategy under each objective in yellow and the worst-performing strategy in red. When inspecting the highlighted cells, it became clear that there were tradeoffs between the first 7 and the last 5 objectives. The tradeoffs suggested that selecting a single preferred strategy may involve balancing these tradeoffs. To assess this balance, we asked the values team to perform a swing weighting exercise for the objectives (Clemen and Reilly, 2001). For the swing weighting exercise, we used the range of values from the experts to construct two hypothetical strategies that resulted in the worst and best performance for each objective. We then asked members of the values team to imagine that they could pick one objective, which they could “swing” from worst to best performance. The swing they preferred the most was assigned a rank score of 1. The values team members then ranked the remaining objectives 2–12 in descending order in terms of how much they preferred improving performance on each objective. Next, they assigned their top-ranked objective 100 points and the rest of the objectives a value between 0 and 100 to reflect their relative preference for each remaining objective. These points were then normalized to weights, which summed up to 1, by dividing the points assigned to each objective by the total points for each respondent. These weights can be interpreted as relative preference for or strength of an objective. We received input for the swing weighting exercise from six values team members. Mean weights (in other words, averaged over all values team participants) are shown in table 5. Next, we developed a scoring function that took the form of a weighted sum. We multiplied an objective’s score by its corresponding weight for each invasive carp management strategy. We then summed the weighted scores into a total score for each invasive carp management strategy (table 5). From an optimization point of view, the invasive carp management strategy that best meets the objectives is the one with the highest total score. The optimal strategy given the scoring was strategy 11, closely followed by strategies 3, 14, and 15.
Table 5.
Consequences table showing the average objective weights, average performance scores, and average total scores for the structured decision-making analysis of strategies for managing invasive carp.[Refer to table 4 for descriptions of strategies. The strategy columns are sorted from left to right in order of increasing total scores]
Analysis of Uncertainty
Score and objective variability among technical and values team respondents could affect the consequences and tradeoff analysis results. Figure 2 illustrates the coefficient of variation (CV) for the scores associated with each strategy and management objective. The CV is a normalized measure of the standard deviation of the scores calculated as the standard deviation divided by the mean. The CV can be interpreted as the percentage of variation relative to the mean. For instance, a CV of 0.5 means that the variation is 50 percent of the mean, whereas a CV of 2 means that the variation is 200 percent greater than the mean. Another way to interpret the CV is the amount of spread around the mean. A lower CV value means less spread and a greater CV value means more spread. Scores with more spread indicate disagreement among technical experts about the presumed effects of the invasive carp management strategy.
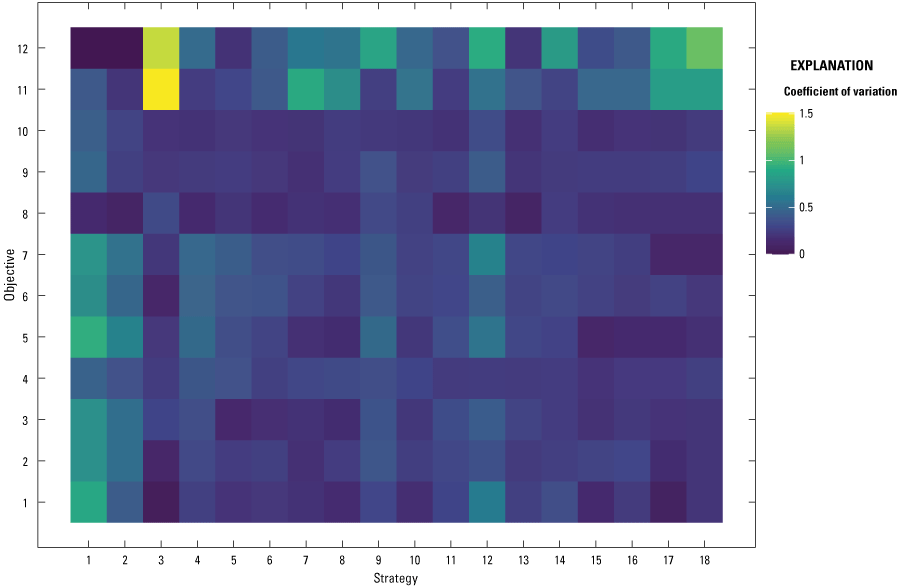
Coefficient of variation value for technical team expert scores on each invasive carp management strategy and objective.
Strategy three, which is one of the top three strategies (11, 3, and 15; table 5), had more score variation on average compared with other strategies. This is likely due to the considerable variation in expert opinion associated with costs and time to implementation with strategy 3. These comparisons also suggest that although strategy 11 seems to marginally outperform similar strategies, experts expressed uncertainty about how well these strategies would perform.
The uncertainty in assessing these strategies is important. Suppose we assumed each expert’s opinion was a hypothesis or prediction of what may happen when each invasive carp management strategy is implemented. In that case, we are interested in whether resolving the correct expert would result in a different strategy being optimal. However, resolving uncertainty does not always result in making a different decision (Runge and others, 2011). Generally, although scientific value likely reduces uncertainty, sensitivity analyses in decision models help identify decision-relevant uncertainties (Moore and Runge, 2012). If resolving an uncertainty does not change the ranking of the invasive carp management strategies from table 5, then that uncertainty is not decision relevant.
Decision-Relevant Uncertainties—Value of Information
Value of information (VOI) analyses can be thought of as sensitivity analyses that measure the decision relevance of an uncertainty and assist decision makers in discerning what information is worth obtaining (Runge and others, 2011). However, we were interested in how sensitive the invasive carp management strategy rankings were to uncertainty about each expert score. We cast the problem as one in which we are resolving which expert scores are closer to the truth and whether this results in a different invasive carp management strategy being optimal.
The first VOI analysis we performed was the expected value of perfect information (EVPI; Clemen and Reilly, 2001). In this analysis, we iteratively assumed each expert’s scores were correct. For each set of expert scores, we determined the optimal strategy and its associated score. We then averaged those scores together to get the average optimal score given certainty about each set of expert scores. Next, we averaged all the sets of expert scores and arrived at the optimal strategy and its associated score, as reported in table 5. We refer to this value as the optimal score under uncertainty. The difference between the average score under certainty and uncertainty is the EVPI. A value greater than zero indicates the value in resolving uncertainty about which set of expert scores is closer to truth. For this analysis, the EVPI value was 0.79, suggesting that resolving uncertainty about the expert scores is likely to affect which strategy is optimal.
EVPI is a general measurement that gives an initial indication of whether further analysis is warranted. For example, if the EVPI value is zero, this would indicate no value in resolving uncertainties. Because our analysis indicates there would be value, we performed an additional analysis of the expected value of partial information (EVPXI; Moore and Runge, 2012). This analysis evaluates whether resolving only a select set of uncertainties affects a choice and is performed similarly to the EVPI analysis. However, instead of assuming that all scores given by an expert were certain, we assumed that some scores were certain and the others were uncertain. We began the analysis by cycling through each set of expert scores assuming certainty for each set, but only on the first objective (decreasing carp abundance). We assumed that scores on the other objectives were uncertain. We then found the optimal strategy and the associated score for each set of expert scores, as we did before, and averaged the scores. We then calculated the difference between the averaged scores and optimal score under uncertainty. The difference represents the amount of the EVPI we can account for by resolving only one source of uncertainty at a time. We expressed EVPXI as the percentage of the EVPI we could account for by resolving a single uncertainty. Table 6 shows these percentages. The yellow highlighted rows show the top three most important single uncertainties. We then asked how much of the EVPI we could account for if we resolved the top three uncertainties simultaneously. This is represented by the orange highlighted row in table 6.
Table 6.
The percentage of the expected value of perfect information (EVPI) that is accounted for by the expected value of partial information (EVPXI).[EVPI, expected value of perfect information]
From an adaptive management perspective, decision makers often cannot afford to wait for new information to become available before deciding on a strategy (Williams and others, 2009). However, if they are engaged in an adaptive management process, the EVPI and EVPXI analyses suggest that learning about the effectiveness of an invasive carp management strategy on decreasing invasive carp abundance, reducing negative effects to native fish, and the time it takes to implement a strategy could improve the ability to select an effective invasive carp management strategy. Note that improving the ability to select the most effective action does not necessarily mean that new information will improve the performance of a particular action. Rather, learning may only help the decision maker better distinguish between decision alternatives.
As a reminder, values team members varied regarding how they weighted their objectives. Figure 3 shows the CV among the objective weights. Overall, variation was less than we expected. We also examined whether using a particular set of weights from a member of the values team resulted in choosing a different strategy. Regardless of which set of weights were used, the same strategy was chosen, indicating that variation among objective weights had little effect on the choice of a strategy.
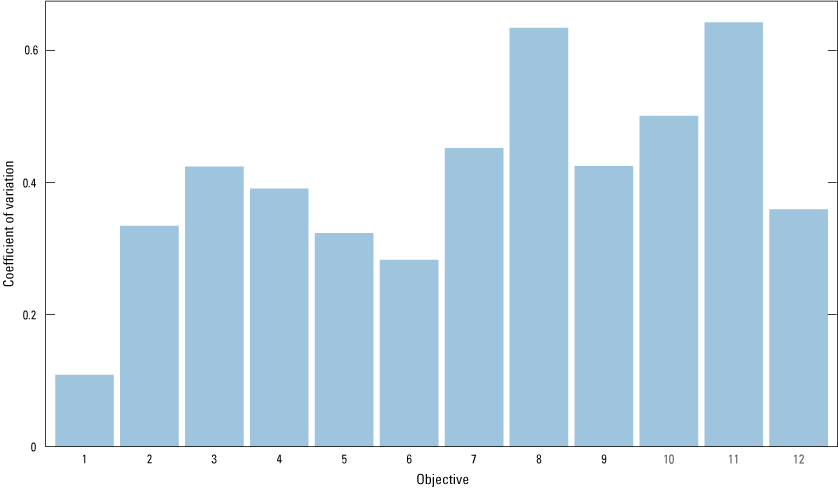
Coefficient of variation of objective weights set by the values team.
Assessing Robustness to Uncertainty
VOI analyses provide insight into which uncertainties are most important to resolve in the context of choosing an optimal strategy. However, optimal strategies are typically based on single values (such as, means or individual scores) and usually do not factor error into the calculation of those scores. Furthermore, errors may exist in the assumptions that technical team experts made, that may have exacerbated the differences among experts. These errors call into question whether the optimal strategy per our analysis will provide the benefits expected by the technical team experts. One solution to this problem is to focus less on the optimal strategy and focus more on finding a strategy that is robust to uncertainty. In other words, focus on finding a strategy that is expected to perform well across a wide range of uncertainty.
We used an approach known as information gap decision theory (also known as info-gap decision theory; Ben Haim, 2023). Info-gap analyses tend to focus on measuring how the choice of strategy changes as uncertainty is increased. Under an info-gap analysis, uncertainty can either positively or negatively affect performance; the goal of a decision maker in this context is to select the strategy with the highest performance after accounting for the effects of uncertainty. Here, we focus on the negative affect of uncertainty; in other words, the case where the actual performance might be worse than our experts were assuming. In info-gap terms, we refer to this measurement as “robustness.”
To perform an info-gap analysis, the following are needed: a model that describes the performance of a strategy, a model that describes how uncertainty affects model parameters, and a horizon of uncertainty over which performance will be evaluated. In our case, the model of performance was our consequences table. Our model of uncertainty can be summarized as:
whereis the average score for strategy i and objective j,
σ
is the standard deviation of the score, and
α
is the horizon of uncertainty.
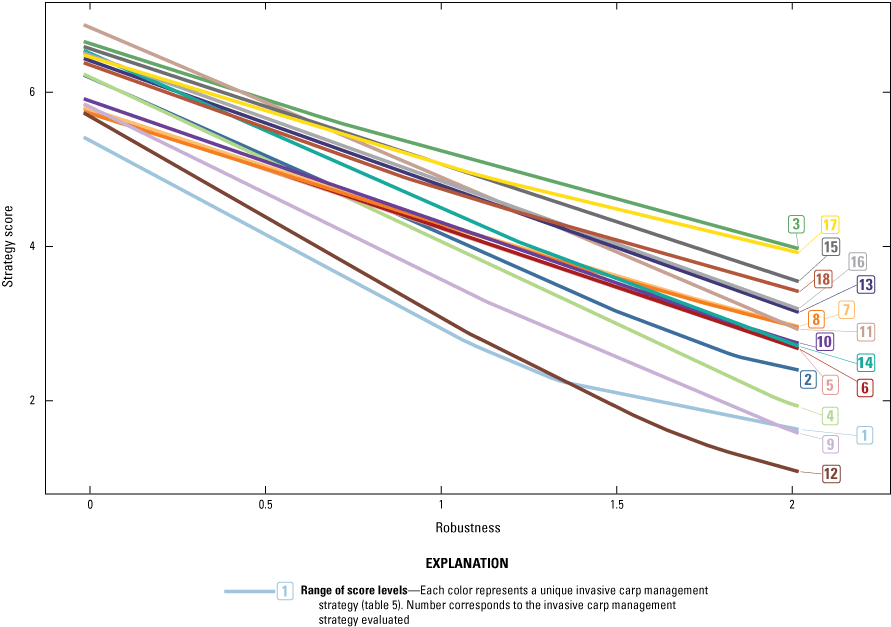
Strategy scores computed for a range of levels of robustness.
Our robustness analysis suggests that strategy 11, the optimal strategy, is not as robust to uncertainty as strategies 3, 17, or 15. However, strategy 11 does seem to fall within a group strategies that are somewhat similar in terms of robustness. Still, overall, it would seem that strategies that add some level of deterrent in addition to maximizing removals is more robust than either one alone.
Conclusions
Our initial consequences analysis found that strategy 11 was optimal when considering tradeoffs between the objectives. We determined that strategy 3 had the second-highest score because it likely outperformed the other strategies on several ecological and interest group objectives. However, strategy 3 scored low in terms of cost and time to implement. Other strategies that ranked near the optimal strategy included some actions of the optimal strategy (that is, maximizing removals) but mixed additional actions like deterrents at varying lock and dam systems.
Our VOI analysis indicated that if strategy selection was based on a single set of expert scores, then a different ranking for invasive carp management strategies may be expected. This implies that there is uncertainty in terms of which strategy is actually optimal. Resolving this uncertainty could be key to determining which strategy will be best in the long term. How MNDNR will go about resolving this uncertainty still needs to be developed, but one possible approach would be to develop an adaptive management program (Williams and others, 2009; Runge and others, 2011).
Setting up such a program would be possible if each set of expert scores could be conceptualized as one of many competing hypotheses describing how invasive carp populations will respond to a management strategy. At least two different approaches to implementing an adaptive management program exist (McFadden and others, 2011). Under the decision-theoretic school of adaptive management, one could adopt a top-ranking invasive carp management strategy given uncertainty (table 5) and then implement the strategy’s actions. One would then need to monitor metrics associated with key uncertainties needed to determine which hypothesis (that is, the set of expert scores) is closer to the truth. As more evidence accrues in favor of one or more hypotheses (that is, learning), one may need to adjust or adapt to a different strategy. Another way to implement adaptive management is through the experimentalist-resilience approach. Under the experimentalist-resilience approach, one would design a management experiment in which attributes of disparate strategies are tested in the field with an aim toward maximizing learning, rather than management performance, per se. The information gained from the experiments could be used to test critical hypotheses and help resolve which invasive carp management strategy performs better. Both adaptive management approaches advocate for collective learning rather than allowing a single set of expert scores to drive the invasive carp management strategy selection. There are also additional complications related to the permanence and scale of different actions that the MNDNR would ideally be aware of when implementing an adaptive management program. For instance, it would be relatively easy for the MNDNR to adapt their carp removal strategies if they discover that a particular course of action is not working. Installing barriers or other deterrents, on the other hand, requires high upfront costs and placement of infrastructure that is considerably more difficult to adapt. We suggest that a deeper analysis of this tradeoff that provides more explicit guidance about managing these risks is likely warranted before implementing such an action. It is also possible that future experimental or field assessments of barrier technologies could also be folded into such an analysis.
Irrespective of the approach, both adaptive management schools require a method to collect data, monitor the outcomes of implemented management actions, and test critical uncertainties. Often, little thought is given to which uncertainties are most critical to resolve, and many programs develop a “shotgun approach” to monitoring and data collection (Johnson, 1999). Such an approach can be inefficient, especially if limited funding induces tradeoffs between management and monitoring. Our analysis suggests that it may be unnecessary to resolve all uncertainties to improve decision making and management performance. Although other uncertainties are potentially scientifically interesting, those uncertainties do not necessarily help a manager reduce uncertainty associated with selecting an invasive carp management strategy. In particular, the analysis identified that resolving uncertainty about the effects of invasive carp management strategies on carp abundance and native fish populations, as well as the time needed to implement an effective invasive carp management strategy, may be critical to making better carp management decisions in the state of Minnesota.
If such a program is not feasible, other options for moving forward might be available. Our info-gap analysis provides an example of how one might consider making a decision under uncertainty about future performance. In this case, a decision maker needs to take into account the potential tradeoff between a strategy that maximizes expected performance, and one the remains robust over a wide range of uncertainty. Our analysis suggested that a strategy based on physically removing carp maximizes average expected performance, but when variation in expert scores and potential errors in reasoning were introduced, that strategy was not as robust. Instead, strategies that combined removals with deterrents on lock and dam systems in the Mississippi River appeared more robust over a wide range of uncertainty.
References Cited
Beierle, T.C., 2002, The quality of stakeholder‐based decisions: Risk Analysis, v. 22, no. 4, p. 739–749, accessed March 11, 2024 at https://doi.org/10.1111/0272-4332.00065.
Ben-Haim, Y., 2023, Managing uncertainty in decision-making for conservation science: Conservation Biology, v. 37, no. 6, 13 p., accessed March 11, 2024, at https://doi.org/10.1111/cobi.14164.
Gregory, R.S., and Keeney, R.L., 2002, Making smarter environmental management decisions: Journal of the American Water Resources Association, v. 38, no. 6, p. 1601–1612, accessed March 11, 2024, at https://doi.org/10.1111/j.1752-1688.2002.tb04367.x.
Johnson, B.L., 1999, The role of adaptive management as an operational approach for resource management agencies: Conservation Ecology, v. 3, no. 2, art. 8., accessed March 11, 2024, at https://doi.org/10.5751/ES-00136-030208.
Kurth, M.H., Larkin, S., Keisler, J.M., and Linkov, I., 2017, Trends and applications of multi-criteria decision analysis—Use in government agencies: Environment Systems & Decisions, v. 37, p. 134–143, accessed March 11, 2024, at https://doi.org/10.1007/s10669-017-9644-7.
McFadden, J.E., Hiller, T.L., and Tyre, A.J., 2011, Evaluating the efficacy of adaptive management approaches—Is there a formula for success?: Journal of Environmental Management, v. 92, no. 5, p. 1354–1359, accessed March 11, 2024, at https://doi.org/10.1016/j.jenvman.2010.10.038.
Moore, J.L., and Runge, M.C., 2012, Combining structured decision making and value-of-information analyses to identify robust management strategies: Conservation Biology, v. 26, no. 5, p. 810–820, accessed March 11, 2024, at https://doi.org/10.1111/j.1523-1739.2012.01907.x.
Runge, M.C., Converse, S.J., and Lyons, J.E., 2011, Which uncertainty? Using expert elicitation and expected value of information to design an adaptive program: Biological Conservation, v. 144, no. 4, p. 1214–1223, accessed March 11, 2024, at https://doi.org/10.1016/j.biocon.2010.12.020.
Runge, M.C., Converse, S.J., Lyons, J.E., and Smith, D.R., eds., 2020, Structured decision making—Case studies in natural resource management: Baltimore, Md., Johns Hopkins University Press, 288 p., accessed March 11, 2024, at https://doi.org/10.1353/book.74951.
Appendix 1. Detailed Descriptions of Invasive Carp Management Strategies
For more information about this publication, contact:
Director, USGS Northern Prairie Wildlife Research Center
8711 37th Street Southeast
Jamestown, ND 58401
701–253–5500
For additional information, visit: https://www.usgs.gov/centers/npwrc
Publishing support provided by the Rolla Publishing Service Center
Disclaimers
Any use of trade, firm, or product names is for descriptive purposes only and does not imply endorsement by the U.S. Government.
Although this information product, for the most part, is in the public domain, it also may contain copyrighted materials as noted in the text. Permission to reproduce copyrighted items must be secured from the copyright owner.
Suggested Citation
Post van der Burg, M., and Colvin, M.E., 2024, Using structured decision making to assess management alternatives to inform the 2024 update of the Minnesota Invasive Carp Action Plan: U.S. Geological Survey Open-File Report 2024–1020, 19 p., https://doi.org/10.3133/ofr20241020.
ISSN: 2331-1258 (online)
Study Area
| Publication type | Report |
|---|---|
| Publication Subtype | USGS Numbered Series |
| Title | Using structured decision making to assess management alternatives to inform the 2024 update of the Minnesota Invasive Carp Action Plan |
| Series title | Open-File Report |
| Series number | 2024-1020 |
| DOI | 10.3133/ofr20241020 |
| Publication Date | April 05, 2024 |
| Year Published | 2024 |
| Language | English |
| Publisher | U.S. Geological Survey |
| Publisher location | Reston, VA |
| Contributing office(s) | Columbia Environmental Research Center, Northern Prairie Wildlife Research Center |
| Description | Report: vi, 19 p; 1 Table |
| Country | United States |
| State | Illinois, Indiana, Iowa, Minnesota, Missouri, South Dakota, Wisconsin |
| Other Geospatial | Upper Mississippi River basin |
| Online Only (Y/N) | Y |
| Additional Online Files (Y/N) | Y |