

Report of the River Master of the Delaware River for the Period December 1, 2016–November 30, 2017
Links
- Document: Report (10.8 MB pdf) , HTML , XML
- NGMDB Index Page: National Geologic Map Database Index Page (html)
- Download citation as: RIS | Dublin Core
Acknowledgments
The Office of the Delaware River Master’s (ODRM) daily operation records were prepared from hydrologic data collected daily. Data for these records were collected and computed by the ODRM or provided by the following agencies and utilities. Data for streamflow of the Delaware River at Montague, New Jersey, and other locations and tributaries were provided by the U.S. Geological Survey (USGS). Data for the Pepacton, Cannonsville, and Neversink Reservoirs were provided by the New York City Department of Environmental Protection. Data for Lake Wallenpaupack were provided by Brookfield Renewable U.S. Data for Rio Reservoir were provided by Eagle Creek Renewable Energy, LLC. The National Weather Service offices in Binghamton, New York, and State College, Pennsylvania, provided quantitative precipitation forecasts and some precipitation data. Amy Shallcross of the Delaware River Basin Commission provided information about 2017 activities, including the lower basin drought watch. Amy McHugh of the USGS contributed to this report by collecting, organizing, and reviewing data.
River Master Letter of Transmittal and Special Report
Office of the Delaware River Master
U.S. Geological Survey
415 National Center
Reston, VA 20192
July 24, 2024
The Honorable
John G. Roberts, Jr.
Chief Justice of the United States
The Honorable
John Carney
Governor of Delaware
The Honorable
Phil Murphy
Governor of New Jersey
The Honorable
Kathy Hochul
Governor of New York
The Honorable
Josh Shapiro
Governor of Pennsylvania
The Honorable
Eric Adams
Mayor of the City of New York
No. 5, Original—October Term, 1950
State of New Jersey, Complainant,
v.
State of New York and City of New York, Defendants,
Commonwealth of Pennsylvania and State of Delaware, Intervenors.
To the Chief Justice of the United States:
For the record, and in compliance with the provisions of the Amended Decree of the Supreme Court of the United States entered June 7, 1954, I hereby transmit the 64th Annual Report of the River Master of the Delaware River for December 1, 2016, to November 30, 2017. In this report, this period is referred to as the River Master “report year.”
During the 2017 River Master report year, monthly precipitation in the upper Delaware River Basin ranged from 30 percent of the long-term average in November 2017 to 167 percent of the long-term average in October 2017. Precipitation from December to May, when reservoirs typically refill, was 23.37 inches. Precipitation was below normal in December, June, September, and November and above normal in the other 8 months.
When the report year began on December 1, 2016, combined useable storage in the New York City reservoirs in the upper Delaware River Basin was 110.115 billion gallons or 40.7 percent of combined storage capacity. The reservoirs were at about 100 percent of useable capacity on May 31, 2017. The combined usable storage was 193.463 billion gallons (71.4 percent of storage at spillway levels) at the end of the report year on November 30, 2017. A lower basin drought watch issued by the Delaware River Basin Commission (DRBC) extended from the beginning of the report year to January 18, 2017. The drought watch was ended due to increased precipitation during December 2016. During the report year, operations in the basin were conducted as stipulated by the Decree and the 2016 and 2017 Flexible Flow Management Programs (FFMPs).
During the report year, the following individuals served as members of the Advisory Committee:
In addition to the management of releases from the New York City-owned reservoirs and streamflow in the upper Delaware River Basin, an issue of particular interest to the River Master was the expiration of the 2016 FFMP on May 31, 2017. Upon expiration of the FFMP without a unanimously approved successor agreement to guide River Master operations, requirements for flow targets and diversions reverted to those specified by the Decree, and reservoir conservation release requirements reverted to the lower flows established by provisions in the Delaware River Basin Commission (DRBC) Docket No. D–77–20 CP (Revised). The Montague flow target continued as 1,750 cubic feet per second (ft3/s), and, beginning June 15—as specified by the Decree (paragraph III–B–1 (d))—was increased to incorporate the excess quantity based on data provided by New York City.
As required by the Decree (paragraph III–B–1 (c)), New York City estimated its anticipated consumption of water from all sources during 2017 as 597.676 billion gallons, and the safe yield from all sources obtainable without pumping as 607.725 billion gallons. The excess release quantity was computed as 8.341 billion gallons, and the excess release rate was computed as 108 ft3/s. The increased Montague flow target was set as 1,858 ft3/s from June 15, 2017, to March 15, 2018, or until the excess release quantity was reached, and 1,750 ft3/s thereafter, absent a new FFMP.
While the reservoir conservation release requirements reverted to lesser flows established by provisions included in DRBC Docket No. D–77–20 CP (Revised), New York City, at its discretion, continued a program of releases consistent with the 2016 FFMP conservation release requirements through September 5, 2017, when it began ramping down the conservation releases to those required of DRBC Docket No. D–77–20 CP (Revised).
Throughout the summer of 2017, the Decree Party Principals, aided by the River Master and staff from the DRBC, continued efforts to draft a new FFMP. Those discussions resulted in a proposed 10-year, two-part agreement. The advisory committee, staff of the DRBC, and the River Master met on September 5, 2017, to finalize the draft. The draft was briefed to the DRBC Regulated Flow Advisory Committee by the River Master at a public meeting in Trenton, New Jersey (N.J.), on September 28, 2017. Subsequently, the Decree Parties signed the new FFMP for 2017 (FFMP2017), which went into effect on October 23, 2017. Upon approval of the FFMP2017, releases of the excess release quantity terminated, the Montague flow target reverted to 1,750 ft3/s, and the reservoir conservation release requirements were set to levels required in the FFMP2017. The FFMP2017 expires May 31, 2023, or, pending successful execution of some of its various provisions, May 31, 2028.
River Master operations were executed through the U.S. Geological Survey (USGS) Office of the Delaware River Master (ODRM) in Milford, Pennsylvania. Robert R. Mason, Jr., the Delaware River Master, was in charge of the office and was assisted by hydrologist Vincent DiFrenna.
During the year, the ODRM continued the weekly distribution of a summary hydrologic report. These reports contain provisional data on precipitation in the upper Delaware River Basin, releases and spills from the New York City reservoirs to the Delaware River, diversions to the New York City water supply system, reservoir contents, daily segregation of flow of the Delaware River at the USGS streamgaging site at Montague, N.J., and diversions by the State of New Jersey. The reports were distributed to members of the Advisory Committee and other parties interested in Delaware River operations. A monthly summary of hydrologic conditions was also provided to Advisory Committee members. The weekly hydrologic reports are available through the ODRM website (https://webapps.usgs.gov/odrm/data/data.html).
The first section of this report documents Delaware River operations during the report year. During the year, New York City diverted 184.156 billion gallons from the Delaware River Basin and released 133.710 billion gallons from the Pepacton, Cannonsville, and Neversink Reservoirs to the Delaware River. A total of 67.096 billion gallons was spilled from the Pepacton, Cannonsville, and Neversink Reservoirs. The ODRM directed releases from these reservoirs to the Delaware River that totaled 28.815 billion gallons. The second section of this report describes water quality at various monitoring sites on the Delaware River estuary and includes basic data on chemical properties and the physical characteristics of the water and presents summary statistics.
Throughout the year, diversions to New York City’s water supply system and releases designed to maintain the flow of the Delaware River at the Montague site were made as directed by the ODRM. Diversions by New York City from its reservoirs in the Delaware River Basin did not exceed the limits stipulated by the Decree. Diversions by the State of New Jersey were also within stipulated limits.
The River Master and staff are grateful for the continued cooperation and support of the Decree Parties. Also, the contributions of Brookfield Renewable U.S. and Eagle Creek Renewable Energy, LLC, in informing the ODRM of plans for power generation and providing data on reservoir releases and elevations are greatly appreciated.
Sincerely yours,
/Signed/
Kendra Russell, P.E.
Delaware River Master
Executive Summary
A Decree of the Supreme Court of the United States, entered June 7, 1954 (New Jersey v. New York, 347 U.S. 995), established the position of Delaware River Master within the U.S. Geological Survey. In addition, the Decree authorizes the diversion of water from the Delaware River Basin and requires compensating releases from certain reservoirs owned by New York City be made under the supervision and direction of the River Master. The Decree stipulates that the River Master provide reports to the Court, not less frequently than annually. This report is the 64th annual report of the River Master of the Delaware River. The report covers the 2017 River Master report year, from December 1, 2016, to November 30, 2017.
During the report year, precipitation in the upper Delaware River Basin was 47.85 inches or 108 percent of the long-term average. On December 1, 2016, combined useable storage in the New York City reservoirs in the upper Delaware River Basin was 110.115 billion gallons or 40.7 percent of combined storage capacity, the lowest combined storage of the 2017 report year. The reservoirs were at about 100 percent of useable capacity on May 31, 2017. Combined storage remained above 80 percent of combined capacity until September 2017.
A lower basin drought watch issued by the Delaware River Basin Commission in 2016 extended from the beginning of this report year to January 18, 2017. The drought watch was ended on January 18, 2017, due to increased precipitation in December 2016. River Master operations during the year were conducted as stipulated by the Decree and the Flexible Flow Management Programs.
Diversions from the Delaware River Basin by New York City and New Jersey fully complied with the Decree. Reservoir releases were made as directed by the River Master at rates designed to meet the flow objective for the Delaware River at Montague, New Jersey (N.J.), on 52 days during the report year. Interim Excess Release Quantity and conservation releases, designed to relieve thermal stress and protect the fishery and aquatic habitat in the tailwaters of the reservoirs, were made during the report year. Excess Release Quantity and Interim Excess Release Quantity Bank releases were also made during the report year.
The water quality in the Delaware River estuary between the streamgages at Trenton, N.J., and Reedy Island Jetty, Delaware, was monitored at various locations. The data on water temperature, specific conductance, dissolved oxygen, and pH were collected continuously by electronic instruments at four sites.
Introduction
An amended Decree of the Supreme Court of the United States entered June 7, 1954 (New Jersey v. New York, 347 U.S. 995; available at https://webapps.usgs.gov/odrm/about/decree), which superseded a 1931 Decree, authorizes the diversion of water from the Delaware River Basin and provides for releases of water from three New York City reservoirs—Pepacton, Cannonsville, and Neversink—to the upper Delaware River. The Decree stipulates that these diversions and releases be made under the supervision and direction of the Office of the Delaware River Master (ODRM). The Decree also stipulates that reports on Delaware River operations be made to the Court not less frequently than annually. The reports can be accessed at https://webapps.usgs.gov/odrm/publications/publications.
This report documents operations from December 1, 2016, to November 30, 2017, or the 2017 River Master report year, hereafter referred to as the “report year.” This report also presents information on water quality in the Delaware River estuary during the report year.
Since 2007, the Decree Parties (Delaware, New Jersey, New York, New York City, and Pennsylvania) have unanimously approved a series of Flexible Flow Management Program (FFMP) agreements (available at https://webapps.usgs.gov/odrm/ffmp/flexible-flow-management-program) to manage the shared waters of the Delaware River Basin. The June 1, 2016, FFMP was an extension of the June 1, 2011, Agreement and incorporates the edits from the previous four extensions of the 2011 Agreement (2012–16), with no additional program modifications other than dates (Russell and others, 2024).
On May 31, 2017, the 2016 FFMP expired without a unanimously approved successor agreement to guide ODRM operations. Upon the expiration of the 2016 FFMP, operational requirements for flow targets and diversions reverted to those specified by the Decree, and reservoir conservation releases reverted to the lower flows established by provisions included in Delaware River Basin Commission (DRBC) Docket No. D–77–20 CP (Revised) (DRBC, 2023). Under the Decree, the Montague flow target continued as 1,750 cubic feet per second (ft3/s) and, beginning June 15, 2017, as specified by the Decree (paragraph III–B–1 (d)), was increased to incorporate the excess quantity based on data provided by New York City. As required by the Decree (Paragraph III–B–1 (c)), New York City estimated its anticipated consumption of water from all sources during the 2017 report year as 597.676 billion gallons, and the safe yield from all sources obtainable without pumping as 607.725 billion gallons (Paul V. Rush, New York City Department of Environmental Protection [NYCDEP], written commun., 2017). The excess release quantity was computed as 8.341 billion gallons, and the excess release rate, based on a release spanning 120 days, was computed as 108 ft3/s. The increased Montague flow target was set as 1,858 ft3/s from June 15, 2017, to March 15, 2018, or until the accumulated excess release quantity was reached, and 1,750 ft3/s thereafter, absent a new FFMP.
When the reservoir conservation release requirements reverted to the lesser flows established by provisions of DRBC Docket No. D–77–20 CP (Revised), New York City, at its discretion, continued a program of releases consistent with the 2016 FFMP conservation release requirements (app. 1) through September 5, 2017, when it began ramping down the conservation releases to those required under DRBC Docket No. D–77–20 CP (Revised) (DRBC, 2023).
Throughout the summer of 2017, the Decree party principals, aided by the ODRM and the DRBC, continued efforts to draft a new FFMP. Those discussions resulted in a proposed 10-year, two-part agreement. The advisory committee, staff of the DRBC, and the ODRM met on September 5, 2017, to finalize the draft. The draft was briefed to the DRBC Regulated Flow Advisory Committee by the River Master at a public meeting in Trenton, New Jersey (N.J.) on September 28, 2017. Subsequently, the new FFMP for 2017 (FFMP2017; app. 2) was signed by all Decree Parties by October 23, 2017. Upon approval of the FFMP2017, release of the excess release quantity was terminated, the Montague flow target reverted to 1,750 ft3/s, and the reservoir conservation release requirements were set to the levels required in FFMP2017 (which were the same as those established in the 2016 FFMP). FFMP2017 expires on May 31, 2023, or, pending successful execution of some of its provisions, on May 31, 2028.
Some hydrologic data in this report are records of streamflow and water quality data collected at U.S. Geological Survey (USGS) water-quality streamgages. The USGS collected and computed these data in cooperation with the States of New York and New Jersey, the Commonwealth of Pennsylvania, and the City of New York. The locations of major streams and reservoirs, and selected USGS streamgaging sites in the Delaware River Basin, are shown in figure 1.
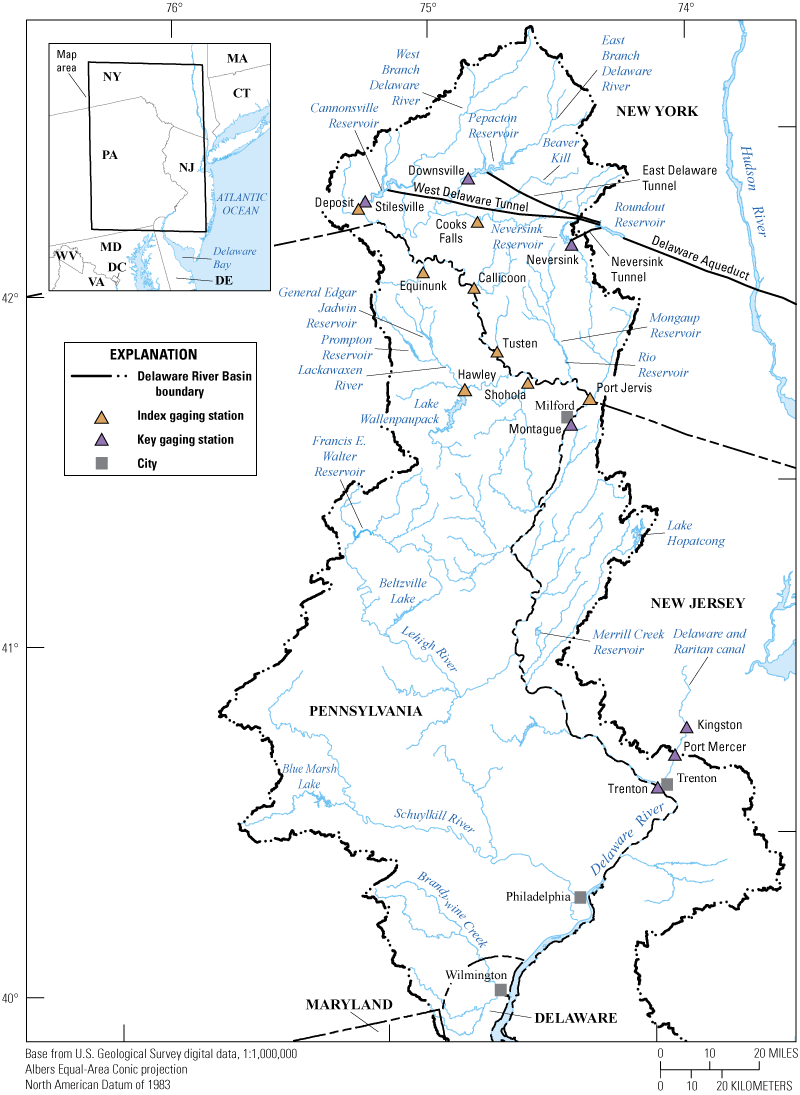
Map showing the Delaware River Basin upstream from Wilmington, Delaware. The Delaware River Basin boundary is shown along with “key gaging stations” and “index gaging stations;” refer to the “Glossary” section for definitions.
Method to Determine Directed Releases From New York City Reservoirs
The data and computations of the various streamflow components form the operational record used by the ODRM to carry out specific responsibilities related to the Montague flow objective (app. 2). The operational record has two parts: (1) segregating the streamflow components of the current daily mean discharge at the USGS streamgage at Montague, N.J. (site number 01438500), to compute the uncontrolled runoff and (2) forecasting the uncontrolled runoff and using forecasted information from other sources to predict the flow at the Montague site with adequate advance time to direct releases. The forecasting process determines whether the ODRM directs the New York City reservoirs to release water to maintain, at a minimum, the Montague flow objective at the Montague site, which is defined in table 1 of appendix 2.
Segregating Streamflow Components—Delaware River at Montague, New Jersey
The segregation of streamflow at the Montague site involves determining flow components, including releases from the New York City reservoirs, releases from Lake Wallenpaupack and Rio Reservoir for hydroelectric power generation, and uncontrolled runoff. For the segregation of components of daily mean flow at the Montague site, the following data are used:
-
1. controlled releases from the Pepacton, Cannonsville, and Neversink Reservoirs of New York City;
-
2. controlled releases from Lake Wallenpaupack on Wallenpaupack Creek to produce hydroelectric power; and
-
3. controlled releases from Rio Reservoir on the Mongaup River to produce hydroelectric power.
To determine the contributions of each of these releases, the amount of time it takes the water to travel from the release point to the USGS streamgage at the Montague site is required. The traveltimes are used to determine the appropriate time-delayed flow contributions from the previously named sources. The time-adjusted controlled flows of these sources are subtracted from the total streamflow measured at the Montague site to determine the uncontrolled runoff (including reservoir spills and groundwater) from the drainage area upstream from the Montague site.
The traveltimes were computed from the reservoir and powerplant operations data and historical streamflow records. The traveltimes are adequate for ODRM operations. Occasionally, however, significant exceptions are observed. For example, during a large increase in a directed release from the Cannonsville Reservoir, the arrival time of the water at the Montague site can be delayed as long as 1.5 days because a substantial amount of water must first fill the channel before a steady flow arrives at the Montague site. During winter, ice formation and lower streamflow gradually increase the resistance to water flow, resulting in increased traveltimes. Because ice-affected traveltimes increase gradually across several days and releases were not directed to meet the Montague flow objective during periods of ice, no adjustments were made to compensate for these increased traveltimes during the report year.
The following list gives the average times for the effective travel of water from the various sources of controlled supply to the Montague site. These traveltimes, in hours, were used for flow routing during the 2017 report year: Pepacton Reservoir, 60; Cannonsville Reservoir, 48; Neversink Reservoir, 33; Lake Wallenpaupack, 24; and Rio Reservoir, 8. The traveltime used for Lake Wallenpaupack controlled releases, in 2016, changed from 16 hours to 24 hours based on data from Brookfield Renewable U.S.
Forecasting Streamflow—Delaware River at Montague, New Jersey
The releases from New York City’s reservoirs necessary for meeting the Montague flow objective were computed based on the forecasted streamflow at the Montague site, exclusive of releases from New York City’s Delaware River Basin reservoirs. The flow must be forecast 3 days in advance to account for the longest traveltime needed for the flow to reach the Montague site from the New York City reservoirs.
The electric utilities Brookfield Renewable U.S. and Eagle Creek Renewable Energy, LLC, provided daily forecasts of power generation and releases to the Delaware River from Lake Wallenpaupack and Rio Reservoir, respectively, to the ODRM. Because the hydroelectric powerplants were primarily used for meeting rapidly varying peak power demands, the forecasts were subject to various modifying factors, including the vagaries of weather on electricity demand. In addition, because the power companies are members of regional transmission organizations, demands for power outside of the local service area can unexpectedly affect power-generation schedules. Consequently, the actual use of water for power generation can differ from the forecasts used in the design of reservoir releases.
For computational purposes during periods of low flow, estimates of uncontrolled runoff at the Montague site were treated as two components: (1) current runoff and (2) forecasted runoff from precipitation. An estimate of uncontrolled runoff was computed using a recession procedure. A recession curve of uncontrolled inputs was developed using the discharge at the Montague site and is used to forecast the uncontrolled portion of flow at the Montague site 3 days in advance. Forecasted runoff was determined from data provided by the National Weather Service office in Binghamton, New York (N.Y.), which provided quantitative forecasts of average precipitation and air temperatures for the 3,480-square-mile (mi2) drainage basin upstream from Montague, N.J. During winter, runoff was estimated based on the status of snow and ice, along with forecasted precipitation and temperature. During other periods, forecasted precipitation was used to estimate runoff.
The forecasted flow at the Montague site, exclusive of releases from New York City’s Delaware River Basin reservoirs, is computed as the sum of forecasted releases from hydroelectric power reservoirs, estimated uncontrolled runoff (including conservation releases from Rio Reservoir), and estimated runoff from predicted rainfall. Each of these inputs is adjusted for traveltime. If the computed total flow is less than the Montague flow objective, the deficiency comprises releases from New York City’s reservoirs, as directed by the ODRM.
The balancing adjustment is applied to the following day’s release design based on the previous day’s provisional data. The balancing adjustment is computed as 10 percent of the difference between the cumulative directed release and the cumulative directed release required for exact forecasting and is limited to a maximum of 50 ft3/s magnitude. The balancing adjustment calls for more water to be released when previous directed releases (or a lack of releases) were insufficient to meet the Montague flow objective. The adjustment calls for less water to be released when previous directed releases were higher than required to meet the Montague flow objective.
When updated forecasts of precipitation or powerplant releases showed significant changes after a release was directed, the release required from New York City’s reservoirs was recomputed based on updated forecasts. Commonly, this procedure resulted in a reduced release requirement for the New York City reservoirs that day. Only the final values for releases from the New York City reservoirs are presented in this report.
Hydrologic Conditions
Precipitation
The sum of the average monthly precipitation in the Delaware River Basin upstream from Montague, N.J., was 47.85 inches (in.) during the 2017 report year and was 108 percent of the long-term (76-year) average (table 1, in back of report). Monthly precipitation ranged from 30 percent of the long-term average in November 2017 to 167 percent of the long-term average in October 2017 (table 1). Precipitation data for the report year were computed from records from eight geographically distributed stations operated by the National Weather Service; the New York City Department of Environmental Protection (NYCDEP) Bureau of Water Supply; and the ODRM.
The seasonal period from December to May is typically when surface-water and groundwater reservoirs refill. During this period for 2016–2017, total precipitation was 23.37 in., which is 115 percent of the 76-year long-term average. During the June–November period, total precipitation was 24.48 in., which is about 102 percent of the 76-year long-term average.
Reservoir Storage
Table 2 summarizes the “point of maximum depletion” and other pertinent levels and contents of the Pepacton, Cannonsville, and Neversink Reservoirs. This information was provided by the NYCDEP.
Daily storage in the Pepacton, Cannonsville, and Neversink Reservoirs, above the point of maximum depletion or minimum full-operating level, is given in tables 3, 4, and 5 (all in back of report), respectively, and combined storage during the report year is shown in figure 2. On December 1, 2016, combined useable storage in the three reservoirs was 110.115 billion gallons or 40.7 percent of combined capacity. From December to May, inflow to the New York City reservoirs typically exceeds outflow, consequently increasing storage. Combined storage increased during the first half of the report year, and the reservoirs were at about 100 percent of usable capacity on May 31, 2017. Combined storage remained high (above 80 percent combined capacity) until September 2017. The lowest combined storage was 110.115 billion gallons (40.7 percent) on December 1, 2016.
Table 2.
Elevation and capacities of structures of the Pepacton, Cannonsville, and Neversink Reservoirs.[ft, foot; Mgal, million gallons; —, not applicable]
The three reservoirs spilled a total of 67.096 billion gallons during the year when reservoirs reached maximum capacity. The Pepacton Reservoir spilled during the following periods: April 6–15, 2017; April 23–26, 2017; May 1–23, 2017; May 27, 2017; May 30–June 2, 2017; June 5–12, 2017; and June 19–20, 2017. The Cannonsville Reservoir spilled during the following periods: April 4–29, 2017; and May 1–June 12, 2017. The Neversink Reservoir spilled during the following periods: April 6–14, 2017; April 25–26, 2017; May 4–7, 2017; May 11–16, 2017; May 29–30, 2017; June 1–13, 2017; and June 19–20, 2017.
The combined storage reached a maximum for the report year on April 8, 2017, at 278.287 billion gallons. The reservoirs’ storage decreased from that point, and the combined storage was 193.463 billion gallons (71.43 percent of combined capacity) on November 30, 2017.
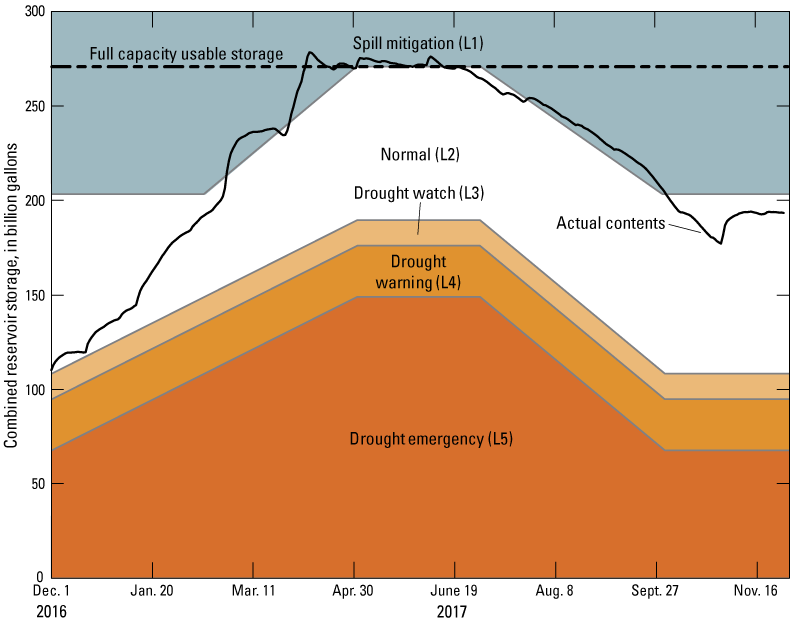
Graph showing rule curves and actual stored water for New York City reservoirs in the Delaware River Basin from December 1, 2016, to November 30, 2017. Full capacity usable storage line and the five conservation release rate zones (L1–5) are shown. The conservation release rate zones are defined in the “conservation release” definition in the “Glossary” section.
Operations
Operations from December 1, 2016, through November 30, 2017, were conducted as described by the FFMPs (revised, effective June 1, 2016–May 31, 2017, and October 23, 2017–November 30, 2017), and interim operations absent a signed FFMP as defined by DRBC Docket No. D–77–20 CP (Revised) (DRBC, 2023). The allowable diversion to New York City was 800 million gallons per day (Mgal/d) throughout the year. The allowable diversion to New Jersey was 100 Mgal/d monthly, with an average not exceeding 120 Mgal/d.
The DRBC issued a lower basin drought watch on November 23, 2016, for the portion of the watershed downstream from Montague, N.J. (DRBC, 2016). During the drought watch, the Trenton flow objective was decreased from 3,000 ft3/s to 2,700 ft3/s. The Montague flow objective was reduced to 1,650 ft3/s on December 1, 2016, and remained so until January 18, 2017, when the drought watch was ended. Increased precipitation in December 2016 led to termination of the drought watch on January 18, 2017. The Montague flow objective was 1,750 ft3/s from January 19, 2017, until June 15, 2017, when the flow objective was increased to 1,858 ft3/s to account for excess release flows. The Montague flow objective returned to 1,750 ft3/s on October 23, 2017, when FFMP2017 became effective. Conservation releases from New York City reservoirs were made at the rates shown in tables 4a–g in the June 1, 2016, FFMP (app. 1 in Russell and others, 2024) and FFMP2017 (app. 2 of this report). The following tables were used: table 4a of both FFMPs from December 2016 through early February 2017, table 4c in mid-February, tables 4f and 4g for late February–March, tables 4a–d in April, tables 4f and 4g in early May, table 4c in mid-May, table 4e for June–August, and table 4g for October–November 2017 (see “Archived OST [Operational Support Tool] Summary Data” at https://webapps.usgs.gov/odrm/data/data.html).
Diversions to New York City Water Supply
The 1954 amended Decree authorizes New York City to divert water from the Delaware River Basin at a rate not to exceed the equivalent of 800 Mgal/d. The Decree specifies that the diversion rate shall be computed as the aggregate total diversion beginning June 1 of each year divided by the total number of days elapsed since the preceding May 31.
The records of daily diversions through the East Delaware, West Delaware, and Neversink Tunnels (fig. 1) were provided to the ODRM by the NYCDEP. These records were obtained from calibrated instruments belonging to New York City that were connected to Venturi meters installed in the tunnel conduits. The flow measurements were transmitted electronically on a 15-second interval to New York City computers; 5-minute interval release and diversion quantities for the preceding 5-minute period were computed using the instantaneous rate-of-flow data from each instrument. These 5-minute quantities were then summed to compute daily total flows, which were reported daily to the ODRM. Each week, the computed diversion values were checked against the flow-meter totalizer readings by the NYCDEP and corrected when necessary.
Daily diversions during the report year from the Pepacton, Cannonsville, and Neversink Reservoirs to the New York City water supply system (Rondout Reservoir) are given in table 6 (in back of report). A running account of the average rates of combined diversions from the three reservoirs from June 1, 2016, computed as stipulated by the Decree, is shown in table 6. A total of 184.157 billion gallons of water was diverted to New York City water supply system during the year ending May 31, 2016, with an average of 505 Mgal/d, which is below the maximum diversion rate. The maximum daily diversion from a single reservoir was 474 million gallons (Mgal) on March 7, 2017, from the Cannonsville Reservoir. The maximum daily combined diversion from all three reservoirs was 905 Mgal on November 16, 2017. The diversions by New York City did not exceed the limits stipulated by the Decree and the FFMPs. The data on water consumption by New York City for each calendar year since 1950, from all sources of supply, are presented in table 7 (in back of report).
The East Delaware Tunnel is used to divert water from the Pepacton Reservoir to the Rondout Reservoir. The hydroelectric powerplant at the downstream end of the East Delaware Tunnel operated most days of the report year. When the powerplant was not operating, some water leaked through the wicket gates and was not recorded on the totalizer. A current-meter measurement made in 1989 showed that the (assumed constant) rate of leakage is about 12.4 ft3/s (8.0 Mgal/d). Because the powerplant was not in operation for the equivalent of 63 days during the report year, the estimated quantity of unmeasured leakage (diverted but not recorded) was about 0.5 billion gallons.
The West Delaware Tunnel is used to divert water from the Cannonsville Reservoir to Rondout Reservoir. When the valves were closed, an inspection of the channel below the outlet revealed negligible leakage. A hydroelectric powerplant uses water diverted through the West Delaware Tunnel, but the plant operates only when diversions are less than 300 Mgal/d. When the powerplant is not operating, the valves on the pipelines to the plant are closed, and there is no leakage through the system.
The Neversink Tunnel is used to divert water from Neversink Reservoir to Rondout Reservoir. A hydroelectric powerplant uses water diverted through Neversink Tunnel. When the powerplant is not operating and the main valve on the diversion tunnel is open, leakage occurs that is not recorded by the Venturi instruments. One current-meter measurement made in 1999 showed a leakage rate of 16.2 ft3/s (10.5 Mgal/d). When the powerplant is operating, the leakage is included in the recorded flow. No leakage occurs when the main valve on the tunnel is closed. During the report year, the powerplant operated part of the day on most days and was not operated for the equivalent of 222 days. About 2.3 billion gallons of water was diverted but not recorded, according to the leakage rate noted above and records of powerplant operation.
Diversions by New Jersey
The Decree authorizes New Jersey to divert water from the Delaware River and its tributaries in New Jersey to areas outside of the Delaware River Basin without compensating releases. Under the FFMPs, New Jersey diversions shall not exceed 100 Mgal/d as a monthly average, and the daily mean diversion shall not exceed 120 Mgal/d. When the lower part of the Delaware River Basin is in a drought emergency, diversions shall not exceed 85 Mgal/d as a running average. The Delaware River Basin was in drought watch from December 1, 2016, to January 18, 2017 (DRBC, 2017).
The USGS streamgage on the Delaware and Raritan Canal at Port Mercer, N.J. (site number 01460440) (fig. 1), is used as the official control point for measuring these diversions by New Jersey. Based on data collected by the USGS at this site, the maximum monthly average diversions were 102.1 Mgal/d during October and 103.6 Mgal/d in November 2017 (table 8, in back of report) (USGS, 2019e). The maximum daily mean diversions were 107 million gallons (Mgal/d) on October 8 and 21, 2017 (table 8). The data in this report are the approved gage data rather than the provisional data used for real-time decisions. Diversions by New Jersey exceeded the limits stipulated by the FFMP in October and November 2017 based on the approved data. However, the diversions fell within the allowable limits based on provisional data at the time of operation and, therefore, did not exceed the limits stipulated by the FFMP.
Montague Flow Objective
The components of forecasted flow at the Montague site during low flow—forecasted releases from hydroelectric power reservoirs, estimated uncontrolled runoff including conservation releases from Rio Reservoir, and forecasted increases in runoff from precipitation—and the sums of flows exclusive of releases from New York City’s reservoirs are given in table 9 (in back of report). If the computed sum of the components is less than the Montague flow objective, then the deficiency is made up by releases from New York City’s reservoirs, as directed by the ODRM. Table 10 (in back of report) presents the ODRM daily operations record of reservoir releases and segregation of the various components contributing to the flow of the Delaware River at the Montague site.
The Montague flow objective was reduced to 1,650 ft3/s on December 1, 2016, and remained so until January 18, 2017, when the drought watch was ended. The Montague flow objective was 1,750 ft3/s from January 19, 2017, until June 15, 2017, when the flow objective was increased to 1,858 ft3/s to account for the excess release flows. The Montage flow objective returned to 1,750 ft3/s on October 23, 2017, when FFMP2017 became effective.
The forecasted flow of the Delaware River at the Montague site, based on provisional data and exclusive of water released from the New York City reservoirs, was greater than the flow objective on all days from December 1, 2016, to August 8, 2017, after which the forecasted flow of the Delaware River at the Montague site was less than the flow objective for 55 days from early August through late October, and the ODRM directed releases for 52 of those days (table 9). The observed daily mean discharge at the Montague site was greater than the applicable flow objectives on all days of the report year, except for September 2 and 3, September 20–23, October 14–16, and October 22, 2017 (table 11, in back of report) (USGS, 2019d). Only two of those observed daily mean flows—1,660 ft3/s on September 22, and 1,600 ft3/s on October 15—were less than 90 percent of the flow objective (table 11) (USGS, 2019d).
The components of the total flow observed at the Montague site from August 1 through October 31, 2017, are shown in figure 3. The flow is segregated into the portion derived from the New York City reservoirs, the portion contributed by the powerplant reservoirs, and the uncontrolled runoff from the drainage area below the reservoirs. As previously described, the uncontrolled runoff was computed as the residual of observed flow minus releases and was subject to errors in the observations, transit times, and routings of the flow components. The conservation release from Rio Reservoir was included in the uncontrolled runoff component. The effect of these uncertainties is incorporated into the computation of uncontrolled runoff.
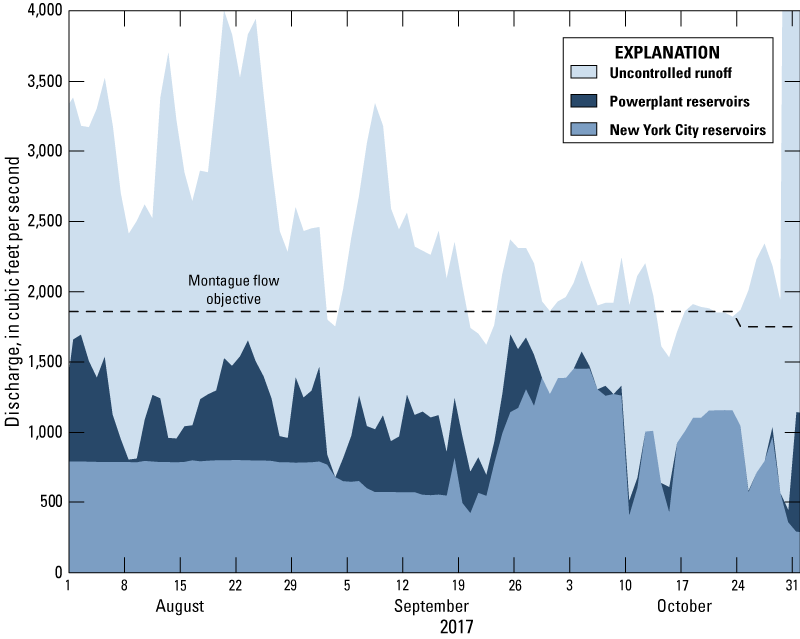
Graph showing flow components—uncontrolled runoff, powerplant reservoirs, and New York City reservoirs—for the Delaware River at Montague, New Jersey, August 1–October 31, 2017. The Montague flow objective is also shown.
Excess Release Quantity and Interim Excess Release Quantity
In the absence of an FFMP, the calculation of the excess release quantity and its use, as specified by the Decree (paragraph III–B–1 (c) and (d)), became effective. New York City estimated its anticipated consumption of water from all of its sources during 2017 as 597.676 billion gallons, and the safe yield from all sources obtainable without pumping as 607.725 billion gallons (Paul V. Rush, New York City Department of Environmental Protection, written commun., 2017). The excess release quantity was computed to be 8.341 billion gallons, and based on a release spanning 120 days, the excess release rate was computed to be 108 ft3/s, yielding a Montague flow target of 1,858 ft3/s. The flow target was applied for June 15–October 23, 2017, when FFMP2017 became effective. The total daily excess release credits accumulated for June 15–October 23, 2017, was 7.385 billion gallons, or 11,425 cubic feet per second accumulated daily ([ft3/s]-d) (table 10, column 14).
A total of 6,000 (ft3/s)-d of special thermal stress releases are allowed per DRBC Docket No. D–77–20 CP (Revised), “Reservoir Release Program, Section C—Special Thermal Stress Releases” (DRBC, 2023). Calls for releases occurred between June 12, 2017, and October 21, 2017, which resulted in a total use of 4,947 (ft3/s)-d (table 10, column 12). The reported values are the portion of reservoir releases greater than the conservation release rates established in D–77–20–CP (Revised), on days when a request for additional water was made.
On October 23, 2017, when FFMP2017 became effective, the Interim Excess Release Quantity (IERQ) Banks were established (app. 2). The Rapid Flow Mitigation Bank was used on October 22, 26, and 27, 2017. A total of 634 (ft3/s)-d was used, and a remaining volume of 366 (ft3/s)-d was still available. No other FFMP2017 IERQ Banks were used during the report year.
Tailwaters Habitat Protection and Discharge Mitigation Program
The FFMP established a Tailwaters Habitat Protection and Discharge Mitigation Program (THPDMP), which consists of (1) conservation releases designed to protect the ecology in the tailwaters below the New York City reservoirs and (2) discharge mitigation releases designed to help mitigate the effects of spilling immediately below the New York City reservoirs. Controlled releases were made from the New York City Delaware River Basin reservoirs under the FFMP until it expired on May 31, 2017. From December 1, 2016, through May 31, 2017, the total of reservoir conservation-releases from the Pepacton, Cannonsville, and Neversink Reservoirs was 75.502 billion gallons. The reservoir conservation-release requirements reverted to lesser flows established by provisions of DRBC Docket No. D–77–20 CP (Revised); New York City, at its discretion, continued a program of releases consistent with the 2016 FFMP conservation-release requirements through September 5, 2017, when it began ramping down the conservation releases to those required of Dockett No. D–77–20 CP (Revised) (DRBC, 2023). From June 1, 2017, when the 2016 FFMP expired, through October 23, 2017, when FFMP2017 was signed, the total of conservation releases from the Pepacton, Cannonsville, and Neversink Reservoirs was 48.568 billion gallons. On October 23, 2017, the New York City reservoirs began making controlled releases for the THPDMP under FFMP2017. The total of conservation releases from the Pepacton, Cannonsville, and Neversink Reservoirs from October 24 through November 30, 2017, was 6.033 billion gallons.
A total of 130.103 billion gallons was released from the New York City Delaware River Basin reservoirs, under the THPDMP, from December 1, 2016, to November 30, 2017.
Comparison of River Master Operations Data With Other Records
The ODRM operations are conducted on a daily basis and, by necessity, use preliminary data on streamflow. This section compares records used in the ODRM operations with the final data published for selected USGS streamgages. The data on releases were reported in million gallons per day and converted to cubic feet per second for comparisons.
Analysis of Forecasts
Based on anticipated contributions from the flow components described previously but excluding releases from New York City reservoirs, the forecasted streamflow at the Montague site differed from observed flow on most days. Occasionally, variations in the components were partially compensating, and observed flows are comparable to forecasted flows.
The forecasted flow of the Delaware River at the Montague site, exclusive of releases from the New York City reservoirs, was less than the flow objective on 55 days from early August through late October 2017; directed releases were made on 52 of those days (table 9). Table 12 compares forecasted and actual flow from hydroelectric powerplant releases for August 7–October 31, 2017.
For August 7–October 31, 2017, as shown in table 12, actual releases from Lake Wallenpaupack and Rio Reservoir averaged 2.4 and 165 percent more, respectively, than the forecasted releases. Powerplant forecasted volumes were calculated from columns 1 and 2 in table 9; powerplant actual releases were calculated from columns 5 and 6 in table 10. Observed runoff (column 10 in table 10) from the uncontrolled area was about 17 percent more than the forecasted runoff (columns 3 and 4 in table 9).
Table 12.
Cumulative forecasted and actual release volume from Lake Wallenpaupack, Rio Reservoir, and uncontrolled runoff from August 7 to October 31, 2017.[(ft3/s)-d, cubic foot per second accumulated daily]
Forecasted and actual releases from Lake Wallenpaupack and Rio Reservoir can differ considerably on any given day. The differences between the actual and forecasted daily releases from August 7 to October 31, 2017, are as follows: actual releases at Lake Wallenpaupack differed from forecasted releases by 839 ft3/s less than forecasted releases to 461 ft3/s greater than forecasted releases, and daily releases at Rio Reservoir differed by 106 ft3/s less than forecasted releases to 851 ft3/s greater than forecasted releases. Based on the measured streamflow at the Montague site, total directed releases from the New York City reservoirs during the report year (column 9 in table 9) were about 9 percent more than required for exact forecasting (column 11 in table 9).
A comparison of forecasted and computed runoff hydrographs from the uncontrolled area (fig. 4) indicated that the forecasts were suitable for use in designing releases from the New York City Delaware River Basin reservoirs. Numerical adjustments to the designs were made when needed to compensate for forecast errors. However, because of traveltimes, the effects of the adjustments on flows at the Montague site were not evident until several days after the design date.
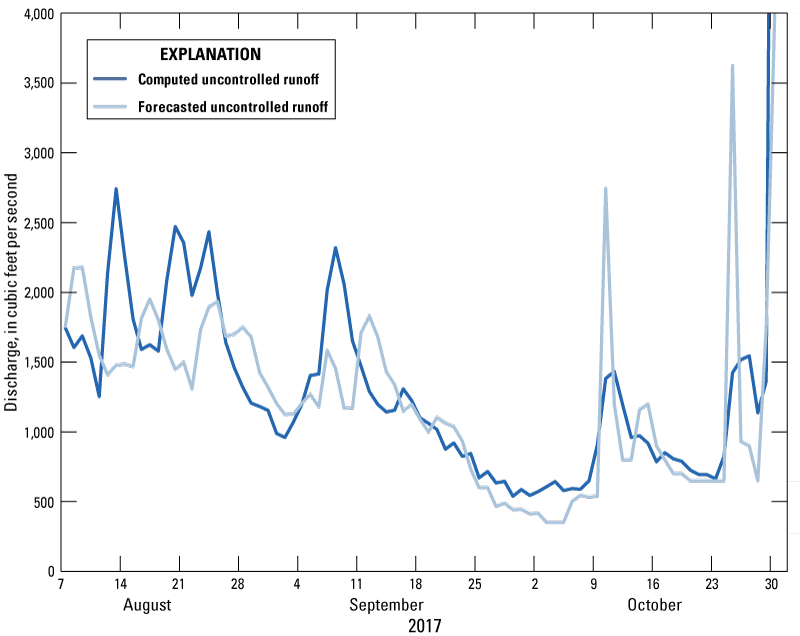
Hydrographs of computed and forecasted uncontrolled runoff components, Delaware River at Montague, New Jersey (U.S. Geological Survey site number 01460440), from August 7 to October 31, 2017. Discharge is shown in cubic feet per second.
Releases From New York City Reservoirs
The ODRM operations data on controlled releases from the Pepacton, Cannonsville, and Neversink Reservoirs to the Delaware River were provided by the NYCDEP to the ODRM. These data were collected from calibrated instruments connected to Venturi meters installed in the outlet conduits of the reservoirs.
The USGS streamgage on the East Branch Delaware River at Downsville, N.Y. (site number 01417000; fig. 1), is 0.5 miles (mi) downstream from Downsville Dam. Discharge measured at this site includes releases from Pepacton Reservoir and a small amount of seepage and any runoff that enters the channel between the dam and the streamgage. The drainage area is 371 mi2 at the dam and 372 mi2 at this site. The streamgage’s records are rated “good,” meaning that about 95 percent of the measured daily mean discharges are within 10 percent of the actual discharge.
Figure 5A shows the measured flow from the Pepacton Reservoir, including spillway, conservation, and directed releases reported by New York City compared with records for the USGS streamgage on the East Branch Delaware River at Downsville, N.Y. (table 13, in back of report) (USGS, 2019a), from December 1, 2016, to November 30, 2017. The average difference is 7.7 percent, and 95 percent of the daily differences between the streamgage readings and New York City records are within 17.3 percent of the actual discharge. Larger differences rarely occur and can be due to rainfall. Instruments connected to Venturi meters were recalibrated periodically by New York City to improve the accuracy of the recorded flow data.
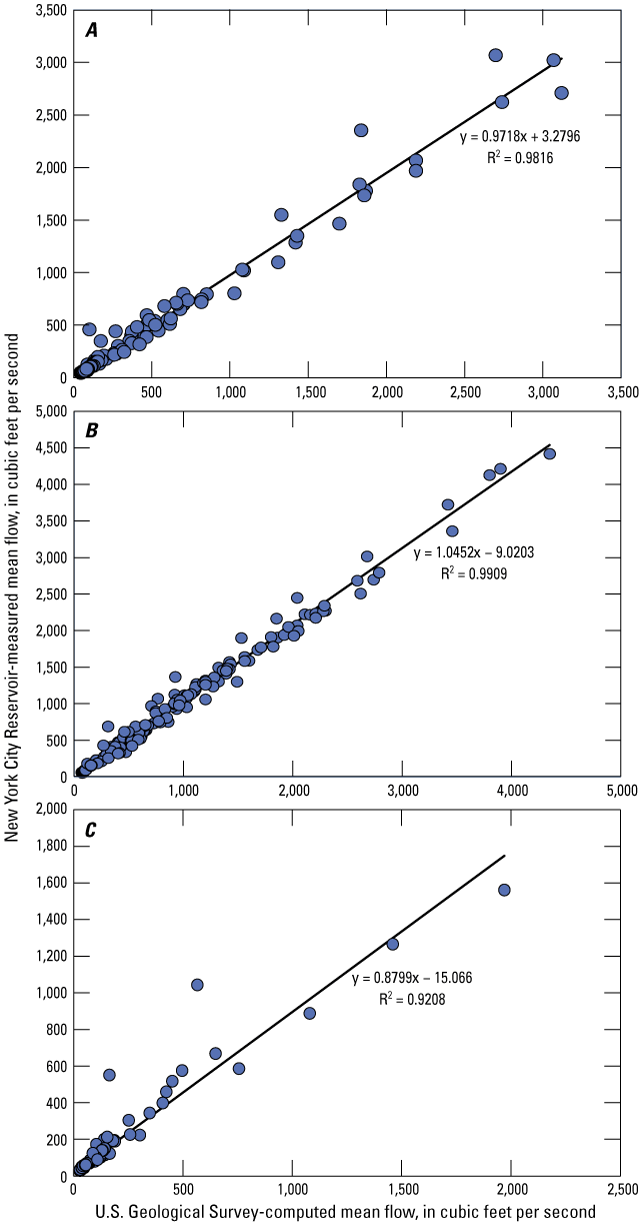
Graphs showing New York City-measured mean flow, in cubic feet per second, compared with computed mean flow records for U.S. Geological Survey (USGS) streamgaging sites downstream from their respective reservoirs: (A) East Branch Delaware River at Downsville, New York (N.Y.) (site number 01417000), downstream from Pepacton Reservoir (data from USGS, 2019a); (B) West Branch Delaware River at Stilesville, N.Y. (site number 01425000), downstream from Cannonsville Reservoir (data from USGS, 2019b); and (C) Neversink River at Neversink, N.Y. (site number 01436000), downstream from Neversink Reservoir (data from USGS, 2019c), for December 1, 2016–November 30, 2017.
The USGS streamgage on the West Branch Delaware River at Stilesville, N.Y. (site number 01425000; fig. 1), is 1.4 mi downstream from the Cannonsville Dam. The discharge measured at this site includes releases from the Cannonsville Reservoir and runoff from 2 mi2 of drainage area between the dam and the streamgage. The drainage area is 454 mi2 at the dam and 456 mi2 at the streamgage. The streamgage records are rated “fair,” which means that about 95 percent of the daily mean discharges are within 15 percent of the actual discharge. The records include runoff from the area between the dam and the streamgage and seepage near the base of the dam.
Figure 5B shows releases from the Cannonsville Reservoir (including spillway, conservation, and directed releases) reported by New York City compared with records for the USGS streamgage on the West Branch Delaware River at Stilesville, N.Y. (table 14, in back of report) (USGS, 2019b), from December 1, 2016, to November 30, 2017. The mean difference is 11.8 percent, and 95 percent of the daily differences between the streamgage readings and New York City records are within 29.2 percent of the actual discharge. The largest differences between the released and measured flow are primarily at lower flow rates.
The USGS streamgage on the Neversink River at Neversink, N.Y. (site number 01436000; fig. 1), is 1,650 feet (ft) downstream from Neversink Dam. The discharge measured at this site includes releases from Neversink Reservoir and, during storms, a small amount of runoff that originates from between the dam and the streamgage. The drainage area is 92.5 mi2 at the dam and 92.6 mi2 at the streamgage. The streamgage records are rated “good,” meaning that about 95 percent of the measured daily mean discharges are within 10 percent of the actual discharge.
Figure 5C shows releases from the Neversink Reservoir, including spillway, conservation, and directed releases reported by New York City compared with the records for the USGS streamgage on the Neversink River at Neversink, N.Y. (table 15, in back of report) (USGS, 2019c), from December 1, 2016, to November 30, 2017. The mean difference between the released flow and measured flow is 7.4 percent, and 95 percent of the daily differences between the streamgage readings and New York City records are within 19 percent of the actual discharge.
Delaware River at Montague, New Jersey
The ODRM’s operations record for the streamgage at the Delaware River at Montague, N.J. (table 10), showed about 0.96 percent less discharge for the report year than the published USGS record for the streamgage (table 11). Daily values for the two records agreed closely, except during ice-affected periods and the summer vegetation-growth season.
Conformance of Operations Under the Amended Decree of the Supreme Court of the United States Entered June 7, 1954
From December 1, 2016, to November 30, 2017, operations of the ODRM were conducted as stipulated by the Decree and the FFMPs. The diversions from the Delaware River Basin to the New York City water supply system did not exceed those the Decree and the FFMPs authorized. New York City released water from its reservoirs at rates directed by the ODRM to meet the applicable Montague flow objectives. During the report year, New York City complied fully with all directives and requests of the ODRM. Diversions from the Delaware River Basin by New Jersey were within limits stipulated by the Decree. New Jersey complied fully with all directives and requests of the ODRM. The IERQ and excess release quantity were used under the FFMPs and agreements completed throughout the report year.
Quality of Water in the Delaware River Estuary
This section describes water-quality monitoring programs for the Delaware River estuary during the report year. Selected data are presented, and water-quality conditions are summarized.
Water-Quality Monitoring Programs
U.S. Geological Survey Continuous Water-Quality Monitoring Program
As part of a long-term program, in cooperation with the DRBC, the USGS operates continuous water-quality monitors at four locations in the Delaware River estuary between Trenton, N.J., and Reedy Island Jetty, Delaware (Del.) (fig. 6).
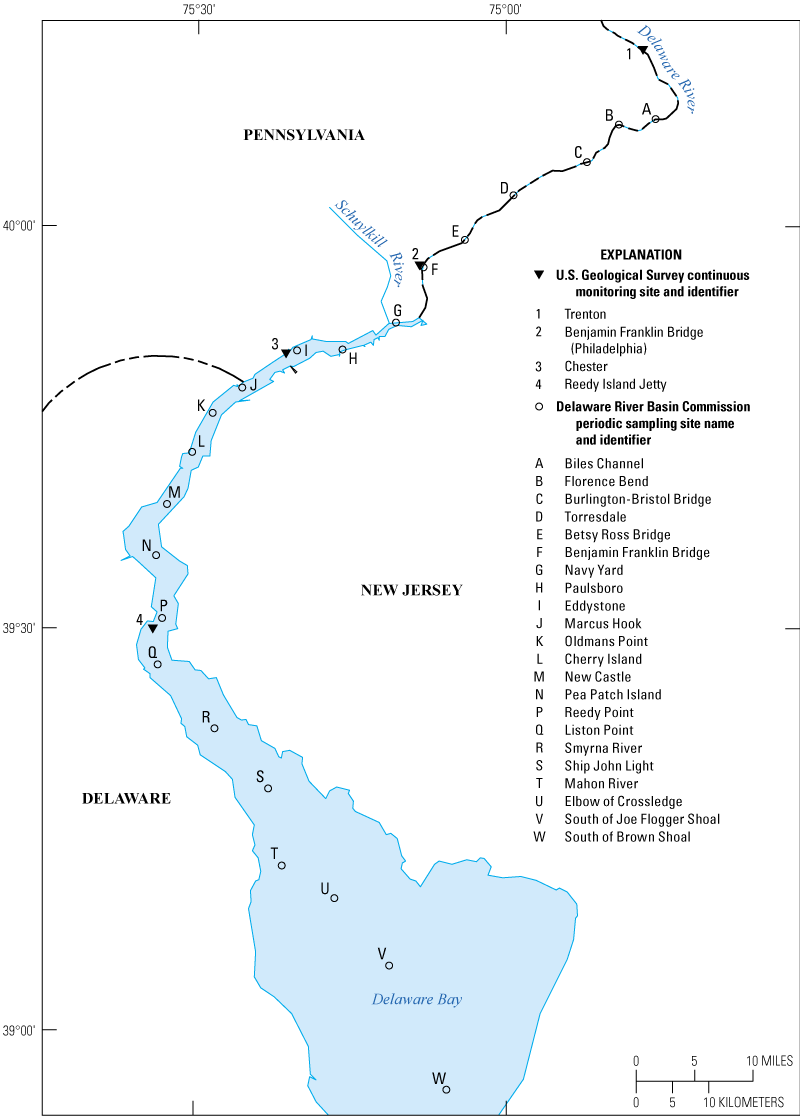
Map showing location of water-quality monitoring sites on the Delaware River estuary. U.S. Geological Survey streamgaging sites (1–4) and Delaware River Basin Commission (DRBC) sampling sites (A–N, P–W) are listed. Modified from DRBC (2021).
Continuous water temperature, specific conductance, dissolved oxygen, and pH data were collected at four USGS monitoring sites: the Delaware River at Trenton, N.J. (site number 01463500); the Delaware River at Benjamin Franklin Bridge at Philadelphia, Pennsylvania (Pa.) (site number 01467200); the Delaware River at Chester, Pa. (site number 01477050); and the Delaware River at Reedy Island Jetty, Del. (site number 01482800). Continuous turbidity data were also collected at the Trenton and Reedy Island Jetty sites. The DRBC and others use these data to assess water-quality conditions and track the “salt front” movement in the Delaware River estuary. Continuous monitoring data are processed and stored in the USGS National Water Information System web database (NWIS; https://waterdata.usgs.gov/nwis). Selected monitoring data from the report year are included in this section.
For this report, USGS site number 01467200 is referred to as “Delaware River at Benjamin Franklin Bridge at Philadelphia, Pa.” The gage was located there during the report period (from December 1, 2016, to November 30, 2017). In January 2020, the gage was moved 150 ft upstream and renamed “Delaware River at Penn’s Landing, Philadelphia, Pa.” The updated name is used in the “References Cited” section to refer to the data listed in the NWIS database at the time of publication.
Delaware River Estuary Boat Run Monitoring Program
Each year, the DBRC contracts with the Delaware Department of Natural Resources and Environmental Control to collect water samples at 22 locations in the Delaware River estuary from Biles Channel to South Brown Shoal (fig. 6, sites A–N, P–W; DRBC, 2021). Samples are collected monthly from April to October. This program intends to provide accurate, precise, and defensible estimates of the surface-water quality of the Delaware River estuary and allow assessments of compliance with the water-quality criteria. Sample analyses include routine and bacterial parameters, nutrients, heavy metals, chlorophyll-a, dissolved silica, and volatile organics. This report does not present water-quality data for these DBRC sampling sites, but the data are accessible from the DRBC Boat Run Water Quality Data Explorer (https://www.nj.gov/drbc/programs/quality/boat-run.html).
Water Quality During the 2017 Report Year
Streamflow
Streamflow significantly affects water quality in the Delaware River estuary. High freshwater inflows commonly result in improved water quality by limiting the upstream movement of seawater and reducing the concentration of dissolved substances. High inflows also aid in maintaining lower water temperatures during warm weather and support higher concentrations of dissolved oxygen. Under certain conditions, however, high streamflows can transport large quantities of nutrients to the estuary, which could result in excessive algae levels.
Streamflow from the Delaware River Basin upstream from the Trenton site is the primary source of freshwater inflow to the Delaware River estuary. During the report year, monthly mean streamflow measured at the USGS streamgage at the Delaware River at Trenton, N.J. (site number 01463500), was highest during April 2017 (27,900 ft3/s) and lowest during October 2017 (4,576 ft3/s; table 16, in back of report) (USGS, 2019f). Long-term monthly mean streamflow was computed for October 1912–November 2016. Monthly average streamflows were less than the long-term mean monthly flows from December 2016 through March 2017, May 2017, and from September through November 2017. The greatest percentage of flow deficiency was in December 2016, when monthly average streamflow was about 50 percent of the long-term average monthly flow. The highest daily mean streamflow during the report year was 54,500 ft3/s on April 1, 2017, and the lowest was 3,170 ft3/s on October 23, 2017 (table 16).
Water Temperature
Water temperature influences water quality, as it affects various physical, chemical, and biological properties of water (USGS, 2020c). Increases in water temperature usually have detrimental effects on water quality by decreasing the saturation level of dissolved oxygen and by increasing the biological activity, such as aerobic respiration, of aquatic organisms. Although the primary factors that affect water temperature in the Delaware River estuary are climatic, various kinds of water use, especially powerplant cooling, can also have substantial effects.
Water temperature data for the site at the Benjamin Franklin Bridge, Philadelphia, Pa., were collected almost continuously from April to November 2017. The procedures used to create figure 7 of this report were started for the 2011 report (DiFrenna and others, 2020). The available long-term average daily temperature data were retrieved from the USGS NWIS database for April through November; the average value was computed for each month from 1964 to 2016 (fig. 7). The monthly average temperatures were greater than the long-term average monthly temperature in April, July, October, and November 2017 (fig. 7). Monthly average temperatures were less than the respective long-term averages in May, June, August, and September 2017 (fig. 7). The maximum daily mean water temperature of 28.0 degrees Celsius was recorded on July 22 and 23, 2017 (USGS, 2020d).
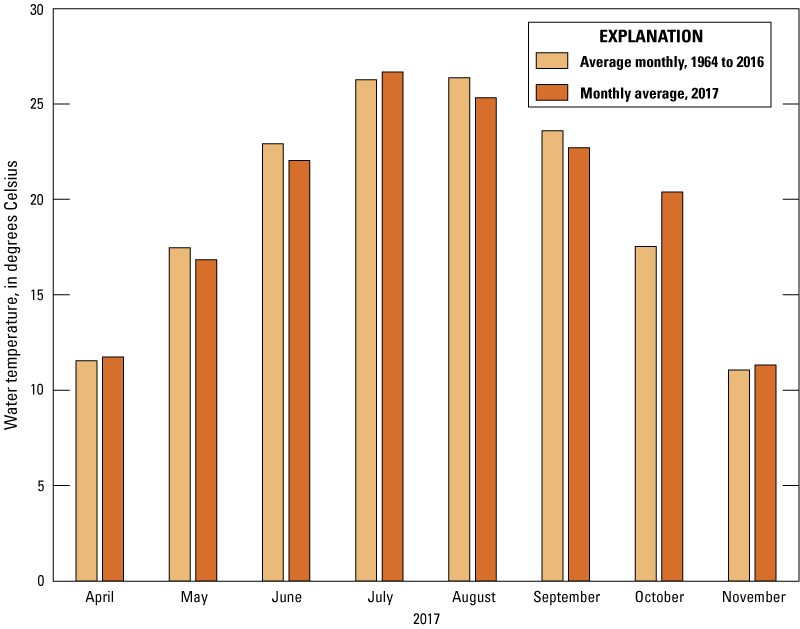
Bar chart showing monthly average water temperatures in 2017 and long-term average monthly water temperatures from 1964 to 2016, for April through November, in the Delaware River estuary at Benjamin Franklin Bridge at Philadelphia, Pennsylvania (data from USGS, 2020d). Water temperatures are given in degrees Celsius.
Specific Conductance and Chloride
Specific conductance is a measure of the capacity of water to conduct an electrical current and is a function of the types and quantities of dissolved substances in water (U.S. Environmental Protection Agency, 2016). As concentrations of dissolved ions increase, the specific conductance of the water also increases. Specific conductance measurements are good indicators of dissolved solids content and total ion concentrations, including chloride. Seawater and some artificial constituents can cause the specific conductance of estuary water to increase substantially. Dilution associated with high freshwater inflows results in decreased levels of dissolved solids and lower specific conductance, whereas low inflows have the opposite effect.
The upstream movement of seawater and the accompanying increase in chloride concentrations is an essential concern for water supplies obtained from the Delaware River estuary (Kauffman and others, 2009). Water with chloride concentrations greater than 250 milligrams per liter (mg/L) is considered undesirable for domestic use, and water with concentrations exceeding 50 mg/L is unsatisfactory for chemically sensitive consumers and some industrial processes. Chloride concentrations in the estuary increase in a downstream direction with proximity to the Atlantic Ocean.
Specific conductance, not chloride concentration, was measured by the USGS at the Reedy Island Jetty site. Chloride concentrations at Chester, Pa., were measured by Kimberly-Clark Chester Operations. The DRBC provided these data, which are not derived from specific conductance data.
At the Reedy Island Jetty site, the greatest daily maximum specific conductance was 23,400 microsiemens per centimeter at 25 degrees Celsius (uS/cm at 25 °C) on December 7, 2017 (table 17, in back of report) (USGS, 2020h). Daily maximum specific conductance during the report year exceeded 3,780 uS/cm at 25 °C on approximately 97 percent of the 365 days with measured specific conductance values in the report year. The lowest daily minimum specific conductance was 466 uS/cm at 25 °C on April 16, 2017. Daily minimum specific conductance exceeded 3,780 uS/cm at 25 °C on 66 percent of the 365 days with measured specific conductance values in the report year.
The data measured by Kimberly-Clark Chester Operations at Chester, Pa., indicates the greatest daily maximum chloride concentration was 651 mg/L on December 1 and 2, 2016 (table 18, in back of report). During the report year, daily maximum concentrations exceeded 50 mg/L on about 73 percent of the 358 days on which measurements were made. The lowest daily minimum chloride concentration was 14 mg/L on December 19, 2016. Daily minimum concentrations exceeded 50 mg/L on about 69 percent of the 358 days on which measurements were made. Daily maximum chloride concentrations exceeded 50 mg/L on most days from December 1, 2016, to early April 2017 and from late August to mid-November 2017 (table 18).
Dissolved Oxygen
Dissolved oxygen in water is necessary for the respiratory processes of aquatic organisms and chemical reactions in aquatic environments (USGS, 2020a). The primary source of dissolved oxygen in the Delaware River estuary is diffusion from the atmosphere and, to a lesser extent, the photosynthetic activity of aquatic plants. The principal factors that affect dissolved-oxygen concentrations in the estuary are water temperature, biochemical oxygen demand, freshwater inflow, phytoplankton, turbidity, salinity, and tidal and wind-driven mixing.
Concentrations of dissolved oxygen at several sites on the Delaware River estuary have been measured since 1961 by the USGS. Two of these sites, the Delaware River at Benjamin Franklin Bridge at Philadelphia, Pa., and the Delaware River at Chester, Pa., have nearly continuous records and are in the reach of the estuary most affected by effluent discharges, which can lead to reduced dissolved-oxygen concentrations because of increasing biological-oxygen demand by aerobic bacteria in water. For these sites, the daily mean and minimum daily mean dissolved-oxygen concentrations for July–September during the 1965–2017 report years are shown in figure 8. Although dissolved-oxygen concentrations have increased over this 53-year period, mean concentrations can vary substantially from year to year. Due to technological changes and other factors, the process used to calculate mean dissolved-oxygen concentrations and those data values has changed over time. The procedures used to create figure 8 of this report have been used since the 2009–2010 Delaware River Master report (Russell and others, 2019). The available mean and minimum daily dissolved-oxygen concentration data were downloaded from the USGS NWIS database for July, August, and September, and the average mean and average minimum dissolved-oxygen concentrations of all those daily values were computed over those 3-months in each report year.
Dissolved-oxygen concentrations in the Delaware River estuary are usually greatest near the Trenton site and decrease in a downstream direction. Concentrations commonly reach minimum levels in an area just downstream from the Benjamin Franklin Bridge site. During the report year, the lowest recorded daily mean concentration was 5.0 mg/L on July 15 and 16, 2017 (table 19, in back of report) (USGS, 2020d). Daily mean dissolved-oxygen concentrations were consistently 6.0 mg/L or greater from April 1 through July 5, 2017, and October 1 through November 30, 2017. At the Chester site, the lowest recorded daily mean dissolved-oxygen concentration was 5.0 mg/L on August 16, 2017 (table 20, in back of report) (USGS, 2020f).
Histograms of quarter-hourly dissolved-oxygen concentrations during the critical summer period (July 1–September 30, 2017) at the Benjamin Franklin Bridge and Chester sites are presented in figure 9. During the 2017 critical summer period, quarter-hourly dissolved-oxygen concentrations were 4 mg/L or less on no days (0 percent) at the Benjamin Franklin Bridge and Chester sites (USGS, 2020e, g).
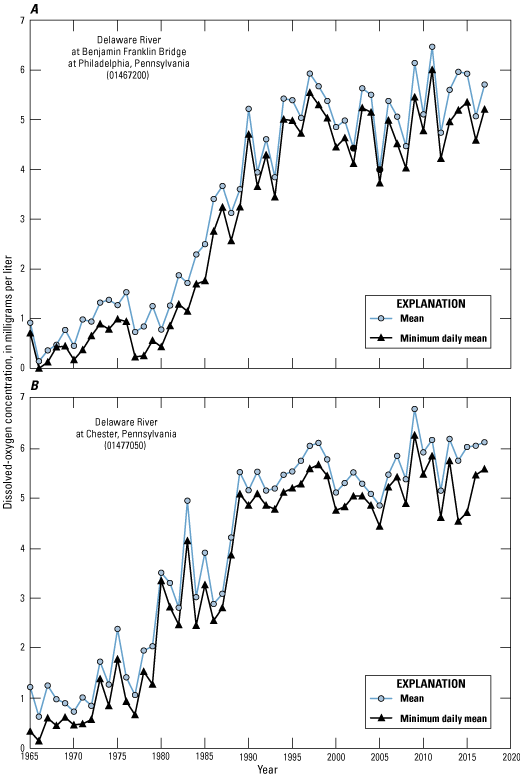
Graphs showing the daily mean and minimum daily mean dissolved-oxygen concentrations (in milligrams per liter) averaged for July–September annually at two U.S Geological Survey (USGS) streamgaging sites on the Delaware River estuary, 1965–2017: (A) Delaware River at Benjamin Franklin Bridge at Philadelphia, Pennsylvania (Pa.) (site number 01457200; data from USGS, 2020d); and (B) Delaware River at Chester, Pa. (site number 01477050; data from USGS, 2020f).
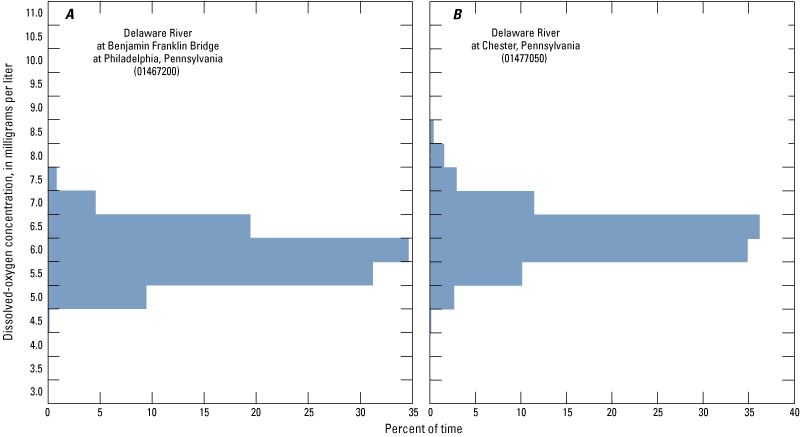
Graphs showing percent distribution of quarter-hourly dissolved-oxygen concentrations (in milligrams per liter) at two U.S. Geological Survey (USGS) streamgaging sites on the Delaware River estuary, from July to September 2017 at (A) Delaware River at Benjamin Franklin Bridge at Philadelphia, Pennsylvania (Pa.) (site number 01467200; data from USGS [2020e]); and (B) Delaware River at Chester, Pa. (site number 91477050; data from USGS [2020g]).
Hydrogen-Ion Activity (pH)
The pH of a solution is a measure of the effective concentration (activity) of dissolved hydrogen ions. Solutions with a pH less than 7 are considered acidic, whereas solutions with a pH greater than 7 are considered basic or alkaline. The pH of uncontaminated surface water ranges from 6.5 to 8.5. Major factors affecting the pH of surface water include the geologic composition of the drainage basin and human inputs, including effluent discharges. In addition, photosynthetic activity and dissolved gases, including carbon dioxide, hydrogen sulfide, and ammonia, can considerably affect pH. The pH of water determines the solubility (the amount that can be dissolved in the water) and biological availability (the amount that can be used by aquatic life) of chemical constituents such as nutrients (for example, phosphorus, nitrogen, and carbon) and heavy metals (for example, lead, copper, and cadmium) (USGS, 2020b).
During the report year, pH was measured seasonally (April–November) at the Benjamin Franklin Bridge and Chester sites and continuously at the Reedy Island Jetty site. During these periods, the ranges of daily median pH measured at these sites are as follows: Benjamin Franklin Bridge, 7.0–7.4; Chester, 7.0–7.7; and Reedy Island Jetty, 7.2–7.9 (USGS, 2020d, f, h). The pH of water in the Delaware River estuary is lowest near the Trenton site and increases (water becomes more alkaline) in the downstream direction. The pH of water in the Delaware River estuary between the Benjamin Franklin Bridge and Reedy Island Jetty sites was not a limiting factor for aquatic health or other beneficial water uses during the report year.
Tables 1, 3–11, and 13–20
Table 1.
Precipitation in the Delaware River Basin upstream from Montague, New Jersey.[Data from the National Weather Service, New York City Department of Environmental Protection, and Office of Delaware River Master. in., inches; —, not applicable]
Table 3.
Storage in Pepacton Reservoir, New York, for report year ending November 30, 2017.[Delaware River Master daily operations record; gage reading at 0800 hours; data provided by New York City. Storage is given in millions of gallons above the elevation of 1,152.00 feet. Add 7,711 million gallons for total contents above sill of outlet tunnel at the elevation of 1,126.50 feet. Storage at spillway level is 140,190 million gallons. —, not applicable; Mgal/d, million gallons per day; ft3/s, cubic foot per second]
Change is calculated as the storage on the last day of each month minus the storage on the first day of each month. Net change for the year is +41,703 million gallons; minimum and maximum storage for December through May are 70,613 and 142,322 million gallons, respectively. Minimum and maximum storage for June through November are 107,428 and 141,524 million gallons, respectively.
Table 4.
Storage in Cannonsville Reservoir, New York, for report year ending November 30, 2017.[Delaware River Master daily operations record; gage reading at 0800 hours; data provided by New York City. Storage is given in millions of gallons above the elevation of 1,040.00 feet. Add 2,584 million gallons for total contents above sill of outlet tunnel at the elevation of 1,020.50 feet. Storage at spillway level is 95,706 million gallons. —, not applicable; Mgal/d, million gallons per day; ft3/s, cubic foot per second]
Change is calculated as the storage on the last day of each month minus the storage on the first day of each month. Net change for the year is +30,536 million gallons; minimum and maximum storage for December through May are 19,493 and 100,743 million gallons, respectively. Minimum and maximum storage for June through November are 42,331 and 99,215 million gallons, respectively.
Table 5.
Storage in Neversink Reservoir, New York, for year ending November 30, 2017.[Delaware River Master daily operations record; gage reading at 0800 hours; data provided by New York City, Storage is given in millions of gallons above the elevation of 1,319.00 feet. Add 525 million gallons for total contents above sill of outlet tunnel at the elevation of 1,314.00 feet. Storage at spillway level is 34,941 million gallons. —, not applicable; Mgal/d, million gallons per day; ft3/s, cubic foot per second]
Change is calculated as the storage on the last day of each month minus the storage on the first day of each month. Net change for the year is +11,109 million gallons; minimum and maximum storage for December through May are 18,689 and 35,438 million gallons, respectively; minimum and maximum storage for June through November are 26,821 and 35,394 million gallons, respectively.
Table 6.
Diversions to New York City water supply system for report year ending November 30, 2017.[Delaware River Master daily operations record. Diversions in million gallons per day for each 24-hour period beginning 0800 local time. For December 1 to May 31, the average is computed beginning June 1, 2016, to the given date. For June 1 to November 30, the average is computed beginning June 1, 2017, to the given date. The diversion calculation is computed as authorized within the Decree. —, not applicable]
Table 7.
Consumption of water by New York City, 1950–2017.[Data provided by New York City, Department of Environmental Protection, Bureau of Water Supply. Mgal/d, million gallons per day]
Table 8.
Diversions by New Jersey, daily mean discharge, Delaware and Raritan Canal at Port Mercer, New Jersey (U.S. Geological Survey site number 01460440), for year ending November 30, 2017.[U.S. Geological Survey (2019e). All values except total are in million gallons per day, Mgal/d. Total in million gallons, Mgal; e, estimated; —, not applicable]
Table 9.
New York City reservoir release design data for report year ending November 30, 2017.[Delaware River Master daily operations record. The Montague design rate was 1,650 cubic feet per second (ft3/s) from December 1, 2016, through January 18, 2017, when a drought watch was ended. The Montague flow objective was 1,750 ft3/s from January 19, 2017, until June 15, 2017, when the flow objective was increased to 1,858 ft3/sec to account for excess release flows. The Montage flow objective returned to 1,750 ft3/s on October 23, 2017, when the 2017 Flexible Flow Management Program became effective. The Montague design rate was 1,750 (ft3/s) for the remainder of the year. Column (col.) 1 was provided by electric utility Brookfield Renewable U.S.; col. 2 was provided by electric utility Eagle Creek Renewable Energy, LLC; col. 3 computed using baseflow recession curve of uncontrolled runoff at the Montague site; col. 4 computed increase in runoff based on quantitative precipitation forecasts; col 5 = col. 1 + col. 2 + col. 3 + col. 4; col. 6 = design rate – col. 5, when positive, otherwise col. 6 = 0; col. 7 = col. 14 ( 4 days earlier); col. 8, directed release amount from the Office of the Delaware River Master = col. 6 + col. 7, when positive, otherwise, col. 8 = 0; col. 9 = col. 7 from table 10; col. 10 = summation of col. 9; col. 11 = flow objective – (col. 9 + col. 10 from table 10) when positive, otherwise, col. 11 = 0; col. 12 = summation of col. 11; col. 13 = col. 10 – col. 12; col. 14 = col. 13 divided by –10, limited to +/– 50 ft3/s. ft3/s, cols. 10, 12, 13, and 14 are accumulated from the previous water year starting June 1, 2016, with these values being reset on June 1, 2017; –x, a miscalculation of cumulative adjusted directed release occurred—values are reported as originally calculated]
Table 10.
Controlled releases from reservoirs in the upper Delaware River Basin and segregation of flow of Delaware River at Montague, New Jersey, for report year ending November 30, 2017.[Delaware River Master daily operations record. All provided measurements are given in the mean discharge in cubic feet per second (ft3/s) for 24 hours, except col. 14, which is in cubic feet per second accumulated daily. Column (col.) 1 = directed release ordered by the Office of the Delaware River Master; col. 2 = 24 hours beginning 1200 of date shown; col. 3 = 24 hours ending 2400, 1 day later; col. 4 = 24 hours beginning 1500, 1 day later; col. 5 = 24 hours beginning 0000 of date shown; col. 6 = 24 hours beginning 1600 of date shown; col. 7 = col. 2 + col. 3 + col. 4 in response to direction (col. 1); col. 8 = col. 2 + col. 3 + col. 4 – col. 7; col. 9 = col. 5 + col. 6; col. 10 = col. 11 – col. 7 – col. 8 – col. 9; col. 11 = 24 hours of calendar day shown; col. 12 = Interim Excess Release Quantity (IERQ) Bank releases. From 6/1/2017 to 10/23/2017 thermal releases were allowed per Delaware River Basin Commission Docket no. D–77–20 CP (Revised). Table footnotes in col. 12 indicate thermal release or Rapid Flow Change Mitigation Bank—refer to table footnotes. Starting on 10/23/2017, releases were made from 2017 Flexible Flow Management Program IERQ Banks; col. 13: if col. 7 > 0, col. 13 = col. 11 – col 8 –1,750 ft3/s but not greater than col. 7; if col 7 = 0, col. 13 = 1,858 ft3/s – (col. 11 – col. 8), positive values only and not greater than 108 ft3/s; col. 14 = cumulative summation of col. 13 values. Excess release credits were only applicable from June 1 to October 23, 2017. —, not applicable]
Table 11.
Daily mean discharge of the Delaware River at Montague, New Jersey (U.S. Geological Survey site number 01438500), for report year ending November 30, 2017.[Data from U.S. Geological Survey, 2019d. All values except the year’s total discharge volume are in cubic feet per second (ft3/s). The total volume discharged is given in cubic feet per second accumulated daily ([ft3/s]-d). —, not applicable]
Table 13.
Daily mean discharge of the East Branch Delaware River at Downsville, New York (U.S. Geological Survey site number 01417000), for report year ending November 30, 2017.[Data from U.S. Geological Survey, 2019a. All values except for the year’s total discharge volume are in cubic feet per second (ft3/s). The total discharge volume is given in cubic feet per second accumulated daily ([ft3/s]-d). —, not applicable]
Table 14.
Daily mean discharge, West Branch Delaware River at Stilesvillle, New York (U.S. Geological Survey site number 01425000), for report year ending November 30, 2017.[Data from U.S. Geological Survey, 2019b. All values except for the year’s total discharge are in cubic feet per second (ft3/s). The total discharge volume is given in cubic feet per second accumulated daily ([ft3/s]-d); —, not applicable]
Table 15.
Daily mean discharge, Neversink River at Town of Neversink, New York (U.S. Geological Survey site number 01436000), for report year ending November 30, 2017.[Data from U.S. Geological Survey, 2019c. All values except for the year’s total are in cubic feet per second (ft3/s). The total discharge volume is given in cubic feet per second accumulated daily, ([ft3/s]-d). —, not applicable]
Table 16.
Daily mean discharge, Delaware River at Trenton, New Jersey (U.S. Geological Survey site number 01463500), for report year ending November 30, 2017.[Data from U.S. Geological Survey, 2019f. All values except the year’s total are in cubic feet per second (ft3/s). The total discharge volume is given in cubic feet per second accumulated daily ([ft3/s]-d). —, not applicable]
Table 17.
Daily maximum and minimum specific conductance, Delaware River at Reedy Island Jetty, Delaware (site number 01482800), for report year ending November 30, 2017.[Data from U.S. Geological Survey, 2020h. Specific conductance measurements provided in microsiemens per centimeter at 25 degrees Celsius. —, not applicable; max, maximum; min, minimum]
Table 18.
Daily maximum and minimum chloride concentrations, Delaware River at Chester, Pennsylvania (site number 01477050), for report year ending November 30, 2017.[Record provided by Kimberly-Clark Chester Operations. Concentrations are in milligrams per liter. *, missing data; —, not applicable; max, maximum; min, minimum]
Table 19.
Daily mean dissolved-oxygen concentration, Delaware River at Benjamin Franklin Bridge at Philadelphia, Pennsylvania (site number 01467200), April 1 to November 30, 2017.[Station was renamed “Delaware River at Penn’s Landing, Philadelphia, PA,” in January 2020. Data from U.S. Geological Survey, 2020d. Concentrations are in milligrams per liter. —, not applicable]
Table 20.
Daily mean dissolved-oxygen concentration, Delaware at Chester, Pennsylvania (site number 01477050), April 1 to November 30, 2017.[Data from U.S. Geological Survey, 2020f. Concentrations in milligrams per liter; —, not applicable]
References Cited
Delaware River Basin Commission [DRBC], 2016, DRBC approves drought management special permit—Basin placed in “Drought Watch” stage effective immediately: DRBC news release, November 23, 2016, accessed May 2, 2019, at https://www.nj.gov/drbc/home/newsroom/news/approved/20161123_newsrel_drought-mgt-special-permit.html.
Delaware River Basin Commission [DRBC], 2017, DRBC lifts basinwide drought watch—Commission urges water efficiency and compliance with State-issued drought watches and warnings: DRBC news release, January 18, 2017, accessed May 2, 2019, at https://www.nj.gov/drbc/home/newsroom/news/approved/20170118_newsrel_end-drought-watch.html.
Delaware River Basin Commission [DRBC], 2021, Delaware Estuary Water Quality Monitoring Program: DRBC website, accessed November 5, 2021, at https://www.nj.gov/drbc/programs/quality/boat-run.html.
Delaware River Basin Commission [DRBC], 2023, Docket no. D–77–20 CP (Revised)—Delaware River Basin Commission—Modification to the release schedules from Cannonsville, Pepacton, and Neversink Reservoirs, Delaware and Sullivan Counties, New York: DRBC, West Trenton, N.J., [proceedings], 5 p., accessed March 16, 2023, at https://www.nj.gov/drbc/library/documents/Reservoir_NYC/D-77-20CPRev.pdf.
DiFrenna, V.J., Andrews, W.J., Russell, K.L., Norris, J.M., and Mason, R.R., Jr., 2020, Report of the River Master of the Delaware River for the period December 1, 2010–November 30, 2011: U.S. Geological Survey Open-File Report 2020–1020, 127 p., accessed April 15, 2021, at https://doi.org/10.3133/ofr20201020.
Kauffman, G., Belden, A., and Homsey, A., 2009, Technical summary—State of the Delaware Basin report—A report on the health of the 13,539-square-mile Delaware River Basin in Delaware, New Jersey, New York, and Pennsylvania: Delaware River Basin Commission and Partnership for the Delaware Estuary, prepared by University of Delaware, 195 p., accessed on March 11, 2019, at https://www.wrc.udel.edu/wp-content/uploads/2020/10/State-of-the-Delaware-Basin-Report-2008.pdf.
Russell, K.L., Andrews, W.J., DiFrenna, V.J., Norris, J.M., and Mason, R.R., Jr., 2024, Report of the River Master of the Delaware River for the period December 1, 2015–November 30, 2016: U.S. Geological Survey Open-File Report 2024–1022, 105 p., https://doi.org/10.3133/ofr20241022.
Russell, K.L., Ockerman, D., Krejmas, B.E., Paulachok, G.N., and Mason, R.R., Jr., 2019, Report of the River Master of the Delaware River for the period December 1, 2009–November 30, 2010: U.S. Geological Survey Open-File Report, 2019–1093, 128 p. [Also available at https://doi.org/10.3133/ofr20191093.]
U.S. Environmental Protection Agency [EPA], 2016, Indicators—Conductivity: EPA web page, accessed August 7, 2018, at https://www.epa.gov/national-aquatic-resource-surveys/indicators-conductivity.
U.S. Geological Survey [USGS], 2019a, USGS 01417000 East Branch Delaware River at Downsville NY: USGS National Water Information System database, accessed January 23, 2019, at https://waterdata.usgs.gov/nwis/dv?cb_00060=on&format=html&site_no=01417000&referred_module=sw&period=&begin_date=2016-12-01&end_date=2017-11-30.
U.S. Geological Survey [USGS], 2019b, USGS 01425000 West Branch Delaware River at Stilesville NY: USGS National Water Information System database, accessed January 23, 2019, at https://nwis.waterdata.usgs.gov/nwis/dv?cb_00060=on&format=html&site_no=01425000&referred_module=sw&period=&begin_date=2016-12-01&end_date=2017-11-30.
U.S. Geological Survey [USGS], 2019c, USGS 01436000 Neversink River at Neversink NY: USGS National Water Information System database, accessed January 23, 2019, at https://nwis.waterdata.usgs.gov/nwis/dv?cb_00060=on&format=html&site_no=01436000&referred_module=sw&period=&begin_date=2016-12-01&end_date=2017-11-30.
U.S. Geological Survey [USGS], 2019d, USGS 01438500 Delaware River at Montague NJ: USGS National Water Information System database, accessed January 23, 2019, at https://nwis.waterdata.usgs.gov/nwis/dv?cb_00060=on&format=html&site_no=01438500&referred_module=sw&period=&begin_date=2016-12-01&end_date=2017-11-30.
U.S. Geological Survey [USGS], 2019e, USGS 01460440 Delaware and Raritan Canal at Port Mercer NJ: USGS National Water Information System database, accessed January 23, 2019, at https://nwis.waterdata.usgs.gov/nwis/dv?cb_00060=on&format=%20html&site_no=01460440&referred_%20module=sw&period=&begin_date=2016-12-01&end_%20date=20 17-11-30.
U.S. Geological Survey [USGS], 2019f, USGS 01463500 Delaware River at Trenton NJ: USGS National Water Information System database, accessed January 23, 2019, at https://waterdata.usgs.gov/nwis/dv?cb_00060=on&format=html&site_no=01463500&referred_module=sw&period=&begin_date=2016-12-01&end_date=2017-11-30.
U.S. Geological Survey [USGS], 2020a, Dissolved oxygen and water: USGS web page, accessed April 10, 2020, at https://usgs.gov/special-topic/water-science-school/science/dissolved-oxygen-and-water?qt-science_center_objects=0#qt-science_center_objects.
U.S. Geological Survey [USGS], 2020b, pH and water: USGS web page, accessed April 10, 2020, at https://usgs.gov/special-topic/water-science-school/science/ph-and-water?qt-science_center_objects=0#qt-science_center_objects.
U.S. Geological Survey [USGS], 2020c, Temperature and water: USGS web page, accessed April 10, 2020, at https://usgs.gov/special-topic/water-science-school/science/temperature-and-water?qt_science_center_objects=0.
U.S. Geological Survey [USGS], 2020d, USGS 01467200 Delaware River at Penn’s Landing, Philadelphia, PA: USGS National Water Information System database, accessed April 10, 2020, at https://waterdata.usgs.gov/nwis/dv?cb_00010=on&cb_00010=on&cb_00010=on&cb_00010=on&cb_00010=on&cb_00300=on&cb_00300=on&cb_00400=on&cb_00400=on&format= html&site_no=01467200&legacy=&referred_module=sw&period=&begin_date=2017-04-01&end_date=2017-11-30.
U.S. Geological Survey [USGS], 2020e, USGS 01467200 Delaware River at Penn’s Landing, Philadelphia, PA: USGS National Water Information System database, accessed March 16, 2023, at https://waterdata.usgs.gov/monitoring-location/01467200/#parameterCode=00300&timeSeriesId=121396&startDT=2016-12-01&endDT=2017-11-30.
U.S. Geological Survey [USGS], 2020f, USGS 01477050 Delaware River at Chester PA: USGS National Water Information System database, accessed April 10, 2020, at https://waterdata.usgs.gov/nwis/dv?cb_00300=on&cb_00400=on&format=html&site_no=01477050&legacy=&referred_module=sw&period=&begin_date=2016-12-01&end_d ate=2017-11-30.
U.S. Geological Survey [USGS], 2020g, USGS 01477050 Delaware River at Chester PA: USGS National Water Information System database, accessed March 16, 2023, at https://waterdata.usgs.gov/monitoring-location/01477050/#parameterCode=00300&startDT=2016-12-01&endDT=2017-11-30.
U.S. Geological Survey [USGS], 2020h, USGS 01482800 Delaware River at Reedy Island Jetty, DE: USGS National Water Information System database, accessed April 10, 2020, at https://waterdata.usgs.gov/nwis/dv?cb_00095=on&cb_00400=on&format=html&site_no=01482800&legacy=&referred_module=sw&period=&begin_date=2016-12-01&end_d ate=2017-11-30.
Glossary
The following definitions apply to various terms and procedures used in the operations documented in this report.
- balancing adjustment
An operating procedure used by the Office of the Delaware River Master to correct for inaccuracies inherent in the design of releases from New York City reservoirs to meet the Montague flow objective at Montague, New Jersey (U.S. Geological Survey streamgaging site 01438500). The balancing adjustment calls for more water to be released when previous directed releases (or lack of releases) were insufficient to meet the Montague flow objective. This adjustment calls for less water to be released when previous directed releases were higher than required to meet the Montague flow objective. Based on provisional data, the balancing adjustment is computed as 10 percent of the difference between the cumulative adjusted directed release and the cumulative directed release required for exact forecasting. The balancing adjustment is applied to the following day’s release design. The maximum daily balancing adjustment is intentionally limited to preclude unacceptably large variations in the flow at the Montague streamgage.
- capacity
Total useable volume in a reservoir between the point of maximum depletion and the elevation of the lower crest of the spillway.
- conservation releases
Controlled releases from the Pepacton, Cannonsville, and Neversink Reservoirs in New York designed to maintain specified minimum flows in stream channels immediately below the reservoirs (tailwaters). The following conservation release rate zones are defined in the October 21, 2017, Flexible Flow Management Plan:
• Spill Mitigation (L1) Discharge Mitigation Releases are releases designed to help mitigate the effects of spilling immediately below the Delaware River Basin reservoirs. New York City shall make such controlled releases from the Delaware River Basin reservoirs in accordance with figures 1 and 2 and tables 4a-g in the 2017 Flexible Flow Management Program (FFMP2017). Zones or volumes may change depending on the specific requirements of the FFMP in effect at the time and may change during a report year if a new FFMP becomes effective. Three zones of reservoir-specific storage (L1–a, L1–b, and L1–c) are defined relative to two rule curves for each reservoir.
• Normal (L2) Conservation releases when New York City combined reservoir storage is in the normal (L2) storage zone.
• Watch (L3) Conservation releases from table 3 of FFMP2017 when New York City combined reservoir storage is in the drought watch (L3) storage zone.
• Warning (L4) Conservation releases from table 3 of FFMP2017 when New York City combined reservoir storage is in the drought warning (L4) storage zone.
• Drought (L5) Conservation releases from table 3 of FFMP2017 when New York City combined reservoir storage is in the drought (L5) storage zone (also referred to as Drought Emergency).
- directed releases
Controlled releases from New York City reservoirs in the upper Delaware River Basin, designed by the Office of the Delaware River Master to meet the Montague flow objective.
- diversions
The out-of-basin transfer of water by New York City from the Pepacton, Cannonsville, and Neversink Reservoirs of New York State in the upper Delaware River Basin through the East Delaware, West Delaware, and Neversink Tunnels, respectively, to New York City’s water supply system. Also, the out-of-basin transfer of water by New Jersey from the Delaware River through the Delaware and Raritan Canal.
- excess quantity
As defined by the Decree, the excess quantity of water is “equal to 83 percent of the amount by which the estimated consumption by New York City during the year is less than New York City’s estimate of continuous safe yield (1,665 million gallons per day [Mgal/d] stipulated by the 1954 Decree) from all its sources of supply obtainable without pumping, except that the excess quantity shall not exceed 70 billion gallons and the seasonal period of release of the excess quantity begins on June 15 and concludes on the following March 15.”
- daily excess release credits
Daily credits and deficits during the seasonal period (from June 15 to the following March 15) are computed as the arithmetic difference between the daily mean discharge of the Delaware River at Montague, New Jersey, and 1,750 cubic feet per second (ft3/s). The daily credit cannot exceed the 24-hour period releases from Pepacton, Cannonsville, and Neversink Reservoirs route to Montague and made in accordance with direction, except as follows: during the seasonal period, credits are also applied for part of all of the other releases from these reservoirs that contribute to the daily mean discharge at Montague between 1,750 (ft3/s) and the applicable excess release rate.
- Flexible Flow Management Program (FFMP)
A set of rules for the management of storage, diversions, releases, and flow targets relating to the apportioning of water from the Delaware River Basin under a 1954 Decree of the Supreme Court of the United States (available at https://webapps.usgs.gov/odrm/about/decree) and unanimously agreed to by the Decree Parties (Delaware, New Jersey, New York, New York City, and Pennsylvania).
- Interim Excess Release Quantity
An Interim Excess Release Quantity (IERQ) was defined in the 2017 Flexible Flow Management Program (app. 2).
Effective from December 1, 2016, to May 31, 2017, the IERQ is computed as 83 percent of the difference between the highest year’s consumption of the New York City water supply system during the period 2002–2006 (1,257 million gallons per day [Mgal/d])—and New York City’s current estimate of continuous safe yield of the New York City water supply system of 1,290 Mgal/d, obtainable without pumping. The IERQ was available for release of 15,468 cubic feet per second accumulated daily ([ft3/s]-d). 3.91 billion gallons (6,045 [ft3/s]-d) of the IERQ is incorporated in the releases tables to enhance base releases from the New York City Delaware River Basin reservoirs. The IERQ balance of 6.09 billion gallons (9,423 [ft3/s]-d) is reserved and can be used for additional releases to meet the Trenton Equivalent Flow Objective or to establish an Extraordinary Needs Bank.
Effective October 23, 2017, in FFMP2017, an IERQ of 10.0 billion gallons (15,468 [ft3/s]-d) shall be provided (determined as in the original FFMP) and based upon 83 percent of the difference between 1,257 Mgal/d (the highest year’s consumption of the New York City water supply system between 2002 and 2006, inclusive) and 1,290 Mgal/d (New York City’s estimate of continuous safe yield of the New York City water supply system at that time, obtainable without pumping). The IERQ shall reset to 10.0 billion gallons (15,468 [ft3/s]-d) on June 1st of each year of the Agreement or upon return to normal conditions after drought.
For each year beginning June 1st of the current program, the IERQ shall be used as defined below:
Trenton Equivalent Flow Objective: 6.09 billion gallons (9,423 cubic feet per second accumulated daily [(ft3/s)-d]) of the IERQ, upon request by the “Lower Basin States” or the Delaware River Basin Commission (DRBC), New York City shall release from the IERQ water in sufficient quantities to maintain a flow at Trenton of 3,000 cubic feet per second (ft3/s) during basin-wide normal conditions for the period commencing on June 1 and continuing through May 31. NYC shall make releases from the IERQ as provided above until the aggregate quantity of the IERQ is exhausted.
Thermal Mitigation: 1.62 billion gallons (2,500 [ft3/s]-d) of the IERQ is banked and available during basinwide normal conditions to support mitigation of thermal events that could adversely impact the cold-water fishery below the New York City Delaware reservoirs. Use of the water for any single event is informed by the current and forecasted basin conditions and the thermal mitigation guidance as developed by the Decree Parties. Releases for thermal mitigation shall be made at the direction of the New York State Department of Environmental Conservation (NYSDEC) and administered by the Office of the Delaware River Master (ODRM) and the New York City Department of Environmental Protection (NYCDEP) with notification made to all Decree Parties.
Rapid Flow Change Mitigation: 0.65 billion gallons (1,000 [ft3/s]-d) of the IERQ is to be banked and is available during basinwide normal conditions to mitigate potentially ecologically harmful conditions caused by rapid reductions in the New York City Delaware reservoir directed releases because of the requirements of the Montague flow objective in Section 2.a. Use of the water for any single event is informed by the current basin conditions and the guidance for its use as developed by the Decree Parties. Releases to mitigate rapid flow changes shall be made at the direction of the ODRM and NYCDEP, with notification to all Decree Parties.
New Jersey Diversion Amelioration: 1.65 billion gallons (2,545 [ft3/s]-d) of the IERQ is banked and reserved for use during drought conditions (basinwide or lower basin) to supply New Jersey’s increased diversion when the New Jersey Diversion Offset Bank as described below in Section 4.d., has been exhausted. Once the New York City reservoirs enter into drought watch, the combined storage of the City Delaware Reservoirs shall be computed as the actual storage volume minus the NJ Diversion Amelioration Bank and NJ Diversion Offset Bank volumes for purposes of determining storage zones.
Interim Excess Release Quantity Extraordinary Needs Bank
In addition to the hydrologic criteria described in section 2.5.6.A. of the Water Code (18 CFR part 410) and subject to other provisional uses of the Interim Excess Release Quantity (IERQ) as provided herein, the Decree Parties, the DRBC, and the ODRM may at any time review extraordinary water needs to support such research, aquatic-life, or other water-use activity as may be approved by the DRBC. Upon unanimous agreement, the Decree Parties may reallocate all or a portion of the IERQ uses identified in section 3.c remaining at such time, and such portion shall be placed in an IERQ Extraordinary Needs Bank and used to provide for such extraordinary water needs. Such quantity as may be reallocated shall be deducted from the agreed upon IERQ source as defined above. Any unused Extraordinary Needs Bank water shall be returned to IERQ.
key gaging stations
Specific sites on the East Branch Delaware River, West Branch Delaware River, Neversink River, Delaware and Raritan Canal, and mainstem Delaware River where continuous, systematic observations of gage height and discharge are made. Data from these sites are used on a year-round basis in the Office of the Delaware River Master operations.
maximum reservoir depletion
The minimum water-surface level or elevation below which a reservoir ceases to continue making delivery of quantities of water for all purposes for which the reservoir was designed. This level is also referred to as minimum full-operating level.
Montague flow objective
In section 2a of the October 21, 2017 Flexible Flow Management Program (FFMP2017; app. 2), “Except with respect to limitations provided herein in Section 5, releases from the City Delaware Basin Reservoirs shall be in quantities designed to maintain, during Normal storage conditions, a minimum basic rate of flow at the gaging station of the U.S. Geological Survey * * * at Montague, N. J. of 1,750 cubic feet per second (cfs), as directed by the River Master in accordance with Section VII. [sic] of the Decree. During Basinwide Drought Watch, Drought Warning, and Drought Emergency, in accordance with Section 5 of this Agreement and Section 2.5.3.B. [sic] and Tables 1 and 2 of the Delaware River Basin Water Code * * *, the Montague flow objective shall vary based upon the time of year and location of the salt front, and minimum compensating releases shall be made by the City of New York from its reservoirs in the upper Delaware Basin.” The Delaware River Basin Water Code can be found in the Code of Federal Regulations (18 CFR part 410).
rate of flow
Mean discharge for a specified 24-hour period, in cubic feet per second (ft3/s) or million gallons per day (Mgal/d).
rate of flow at Montague
Daily mean discharge of the Delaware River at Montague, New Jersey, computed on a calendar-day basis. The Montague flow objective is a benchmark used to control upstream releases and withdrawals of water from the Delaware River Basin.
reservoir-controlled releases
Controlled releases from reservoirs passed through outlet valves in the dams or through turbines in powerplants. These releases do not include spillway overflow at the reservoirs.
salt front
The salt front is defined as the 250 parts-per-million isochlor, or line of equal chloride concentration, in the Delaware River estuary—1 part per million is 1 part of solute (in this case, chloride) per 1 million parts of solvent (river water). The 7-day average location of the salt front is used as an indicator of salinity intrusion in the Delaware River estuary and a factor affecting the Montague and Trenton flow objectives during drought emergencies.
storage or contents
Usable volume of water in a reservoir. Unless otherwise indicated, volume is computed on the basis of the level of pool above the point of maximum depletion.
time of day
Time of day is expressed in 24-hour Eastern Standard Time, which during the report year included a 23-hour day on March 12 and a 25-hour day on November 5.
Trenton flow objective
In section 2b of the October 21, 2017, Flexible Flow Management Program (FFMP2017; app. 2), “Section 2.5.3 of the Water Code establishes a set of equivalent flow objectives at Trenton, N.J. to control salinity intrusion in the Delaware Estuary. * * * During Basinwide Drought Watch, Drought Warning, and Drought Emergency, in accordance with Section 5 of this Agreement and Section 2.5.3.B. [sic] and Tables 1 and 2 of the Water Code, the Trenton Equivalent Flow Objective shall vary based upon the time of year and location of the salt front, and minimum compensating releases shall be made by the City of New York from its reservoirs in the upper Delaware Basin.” The Delaware River Basin Water Code can be found in the Code of Federal Regulations (18 CFR part 410).
uncontrolled runoff at Montague
Runoff from the 3,480-square-mile drainage area above Montague, New Jersey, excluding the drainage area above the Pepacton, Cannonsville, and Neversink Reservoirs; Lake Wallenpaupack: and the Rio Reservoir, but including spillway overflow at these dams.
Appendix 1. Four-Party Letter for Interim Operations
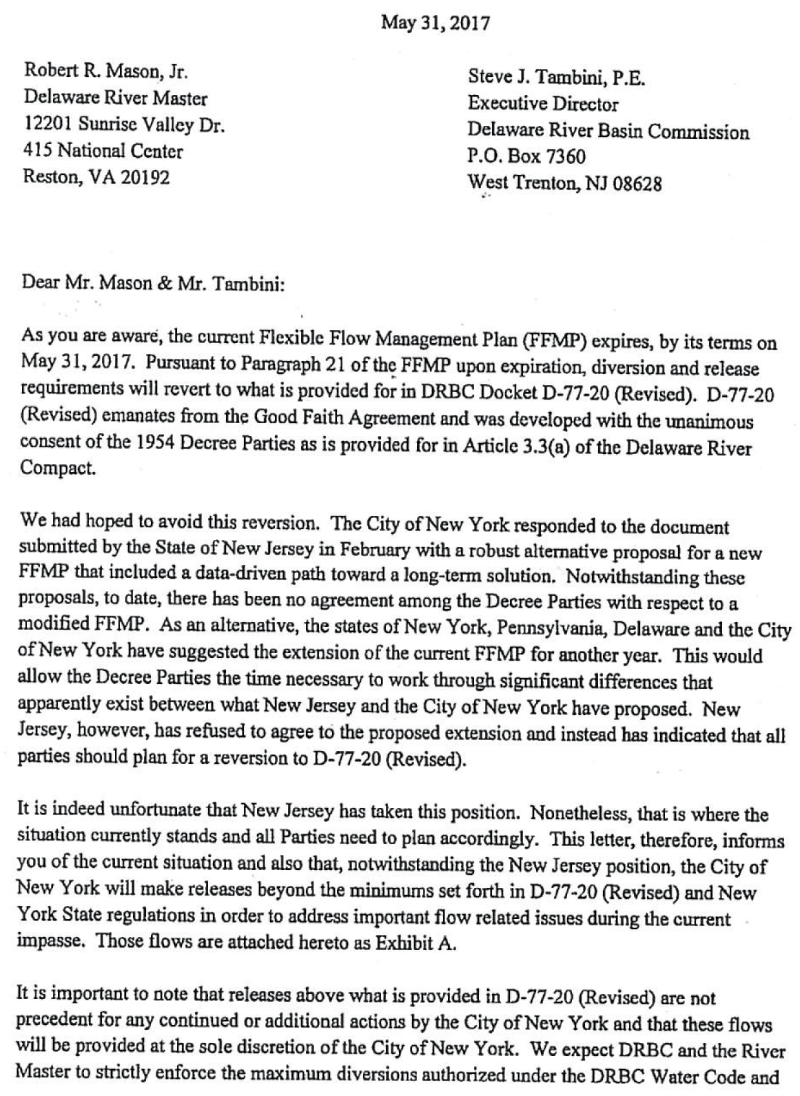
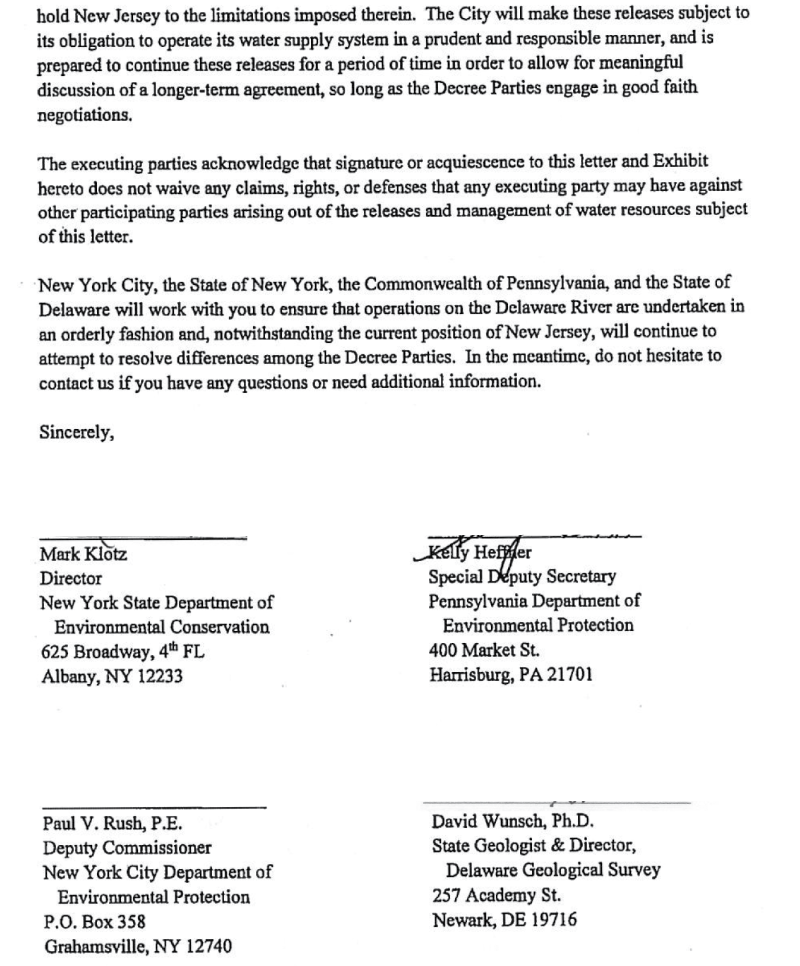
Full text of a letter, signed by four of the five Decree Parties of the Amended Decree of the U.S. Supreme Court, that notified the Office of the Delaware River Master of the intent to continue higher conservation releases consistent with recent operational plans.
Appendix 2. Agreement For a Flexible Flow Management Program
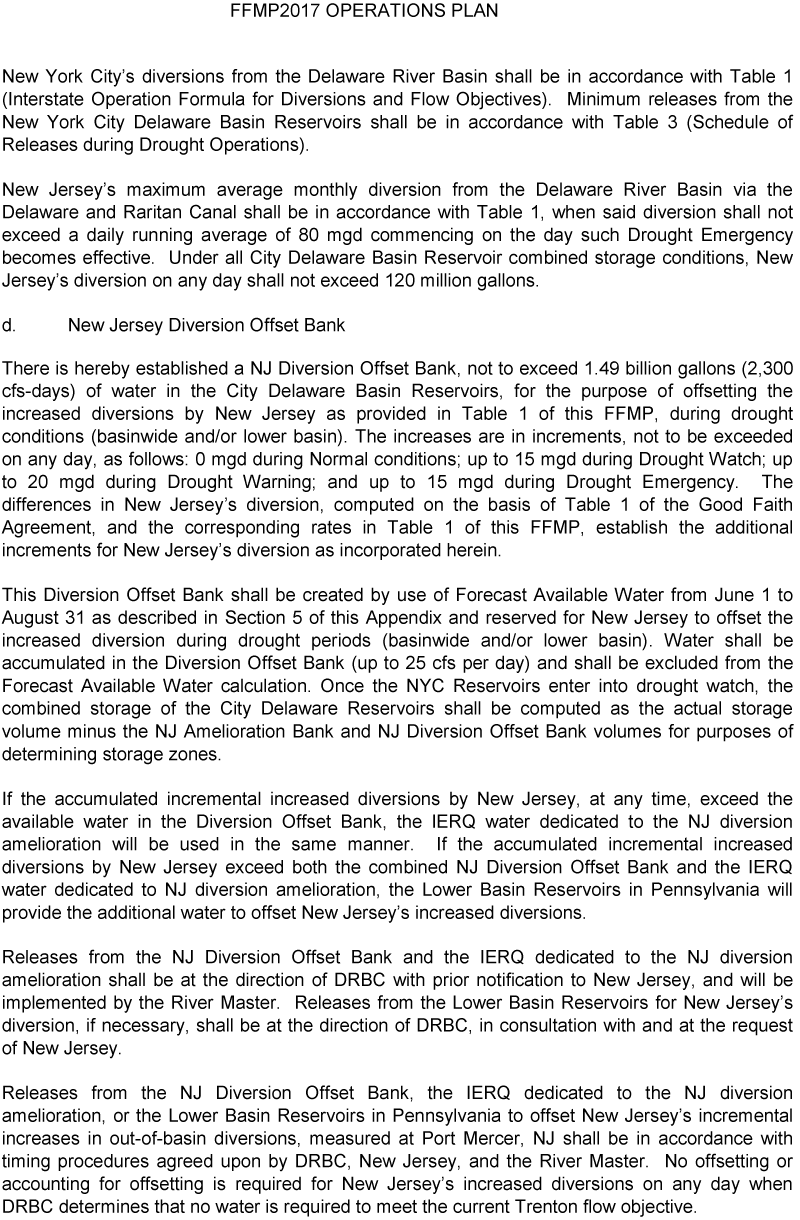
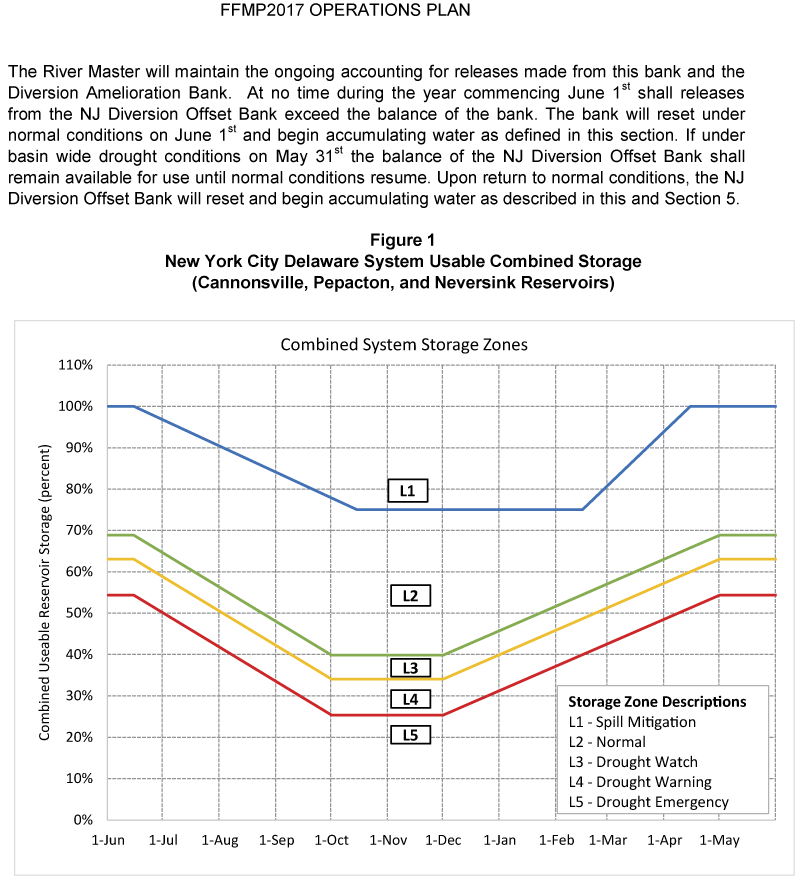
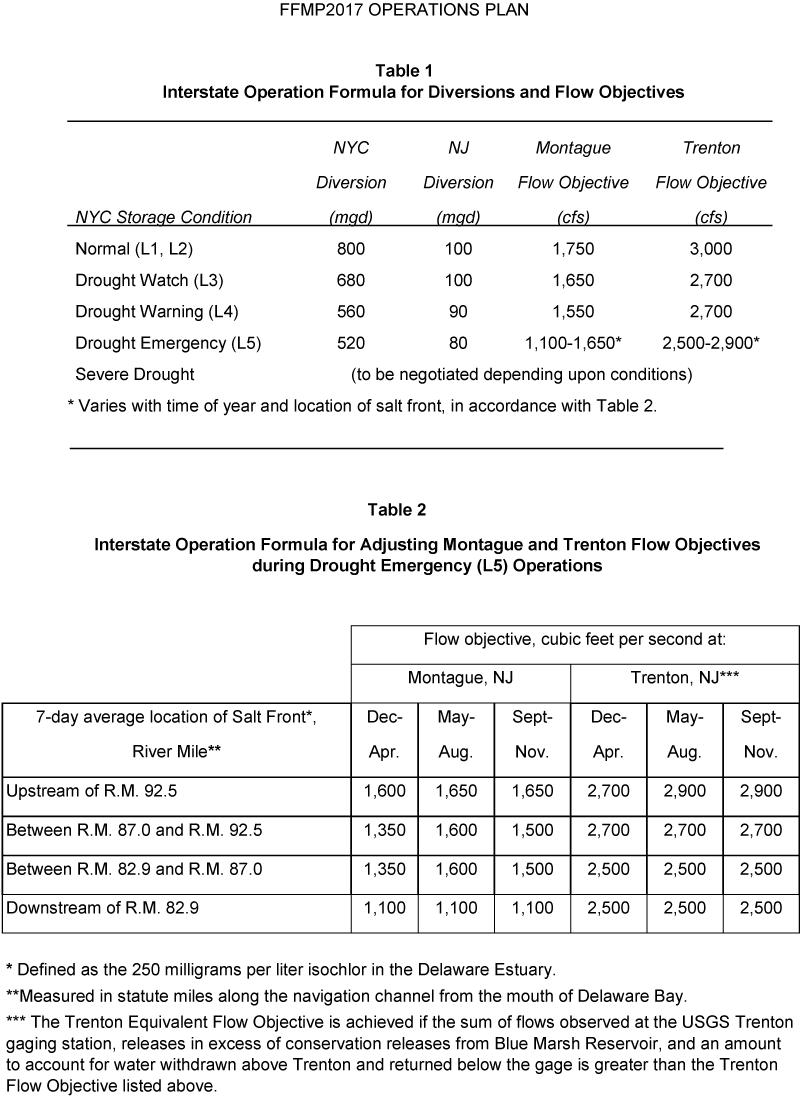
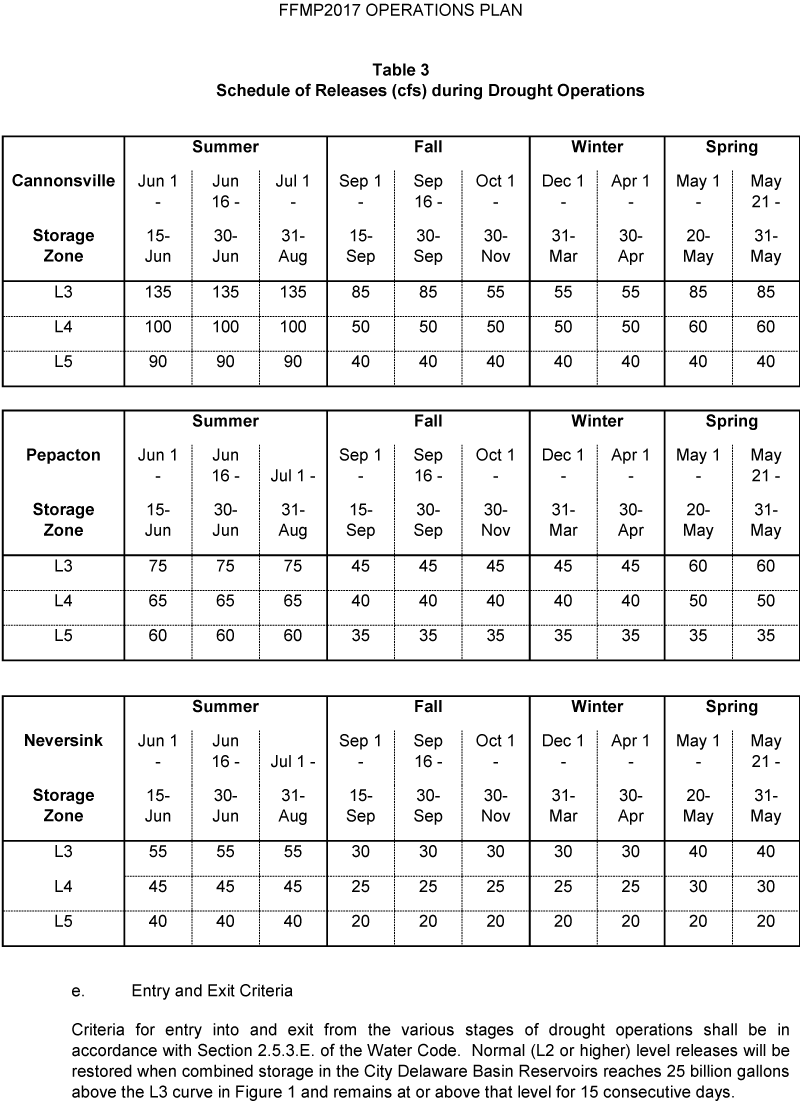
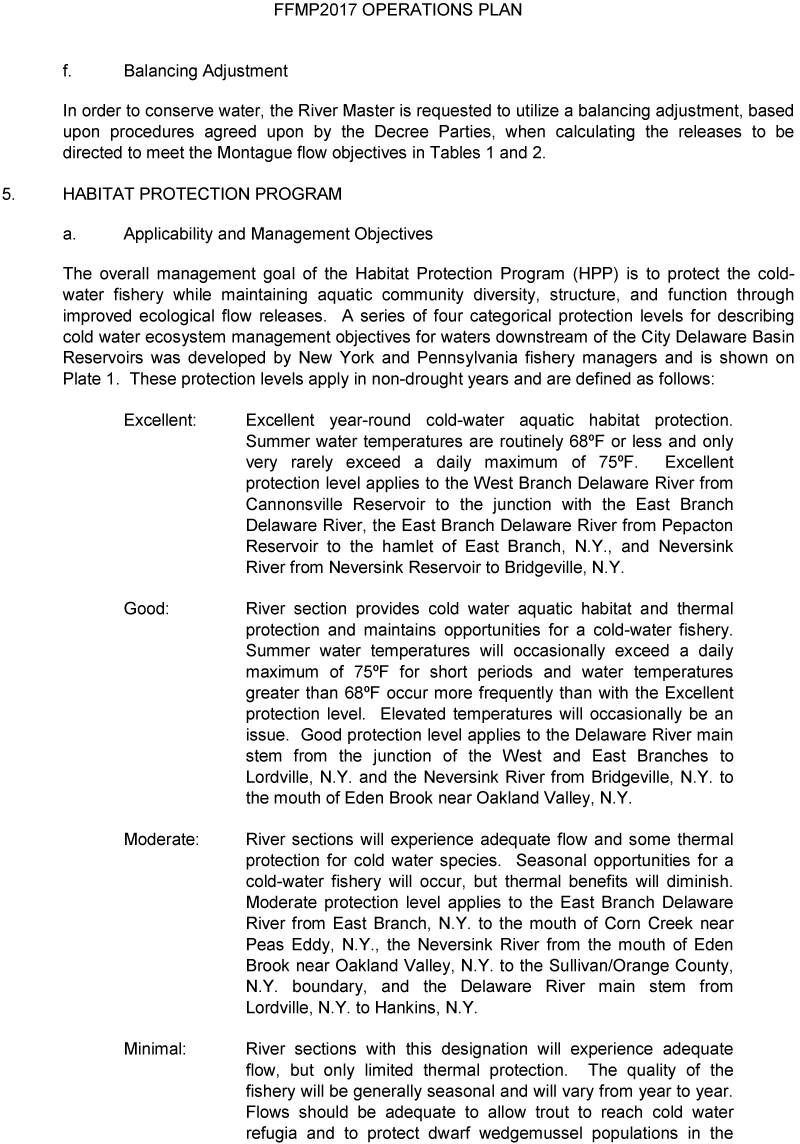
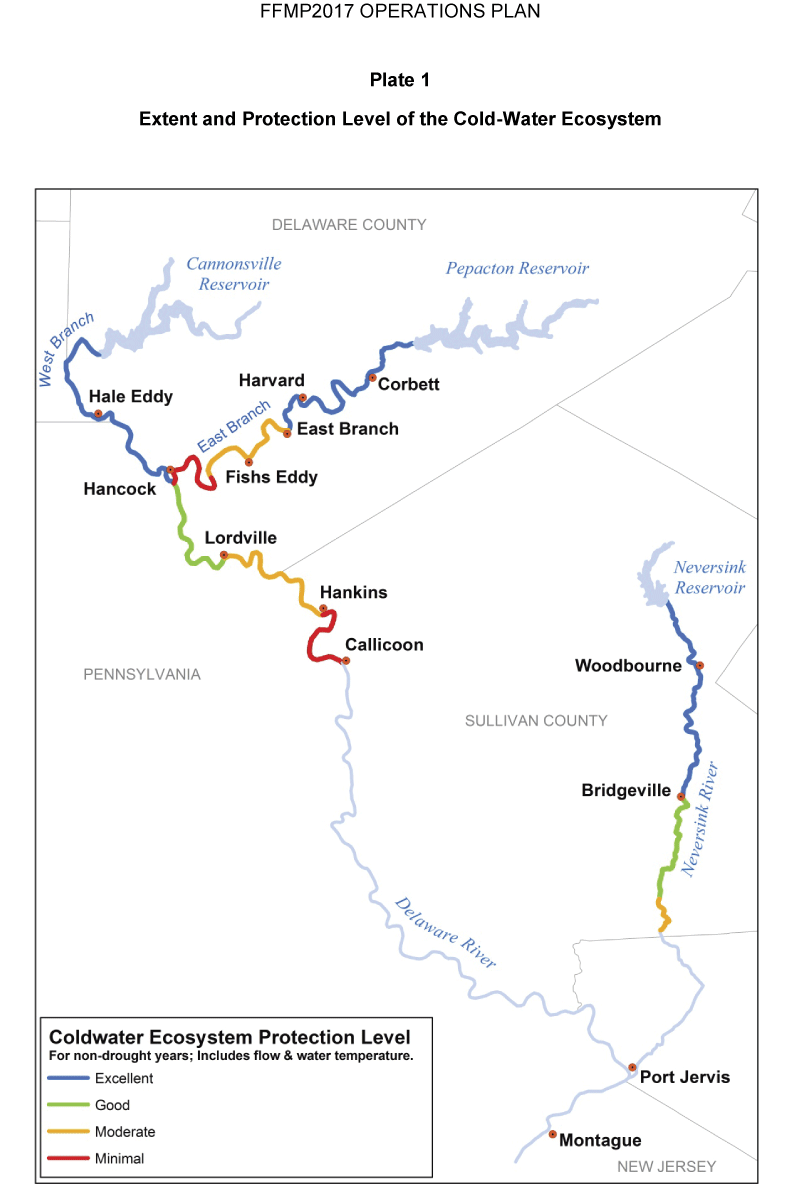
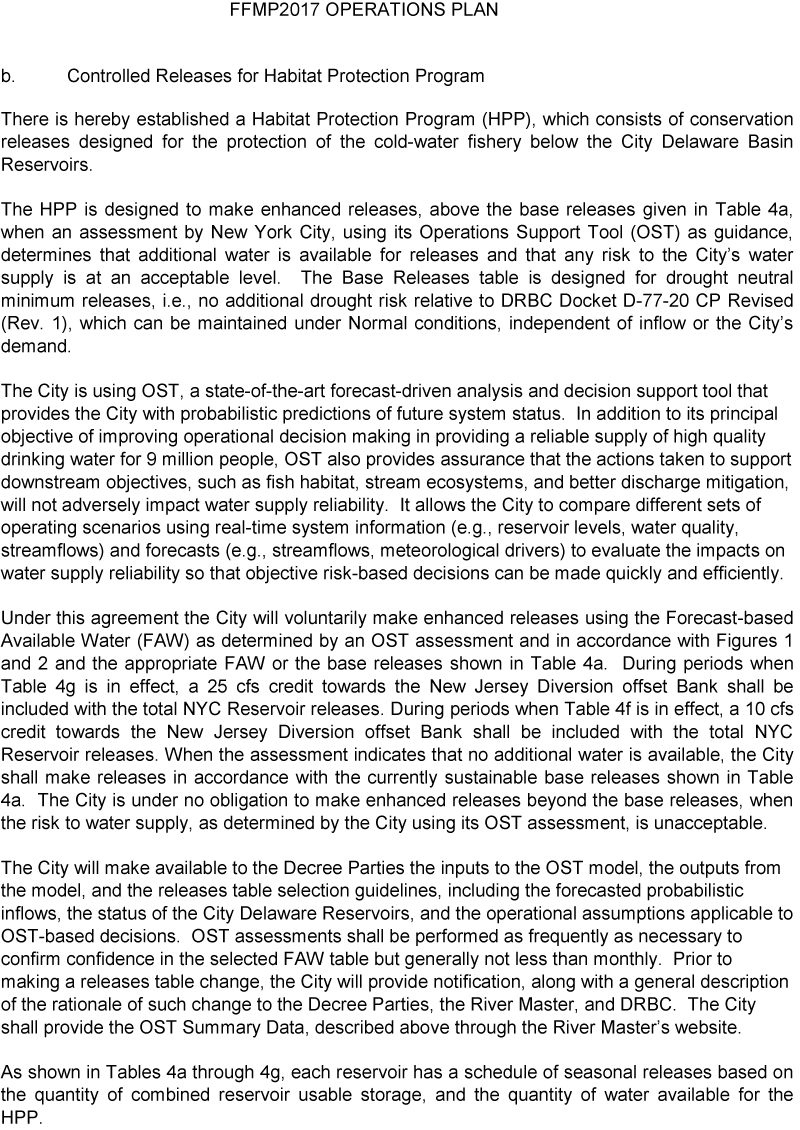
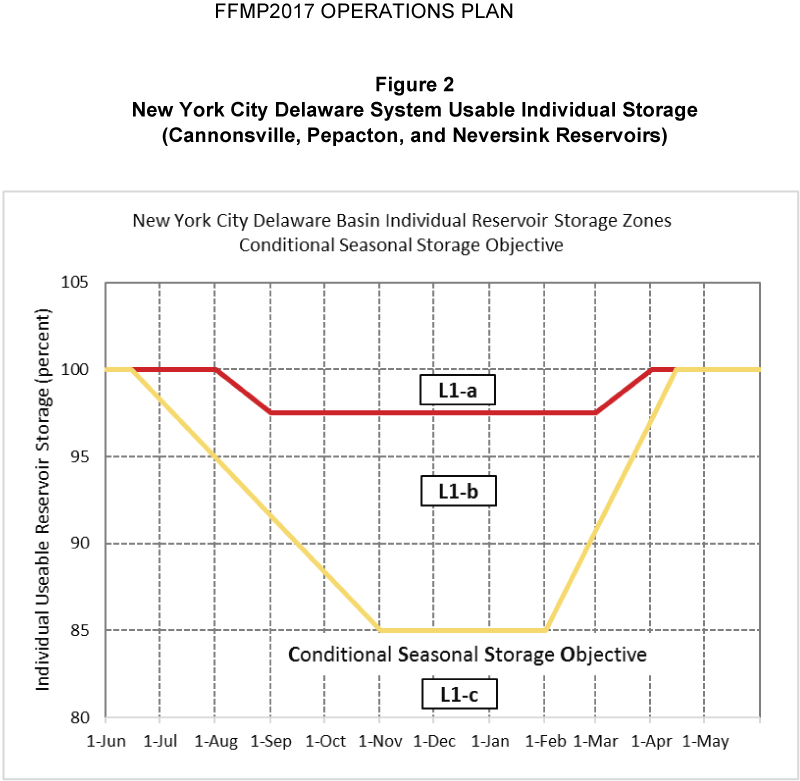
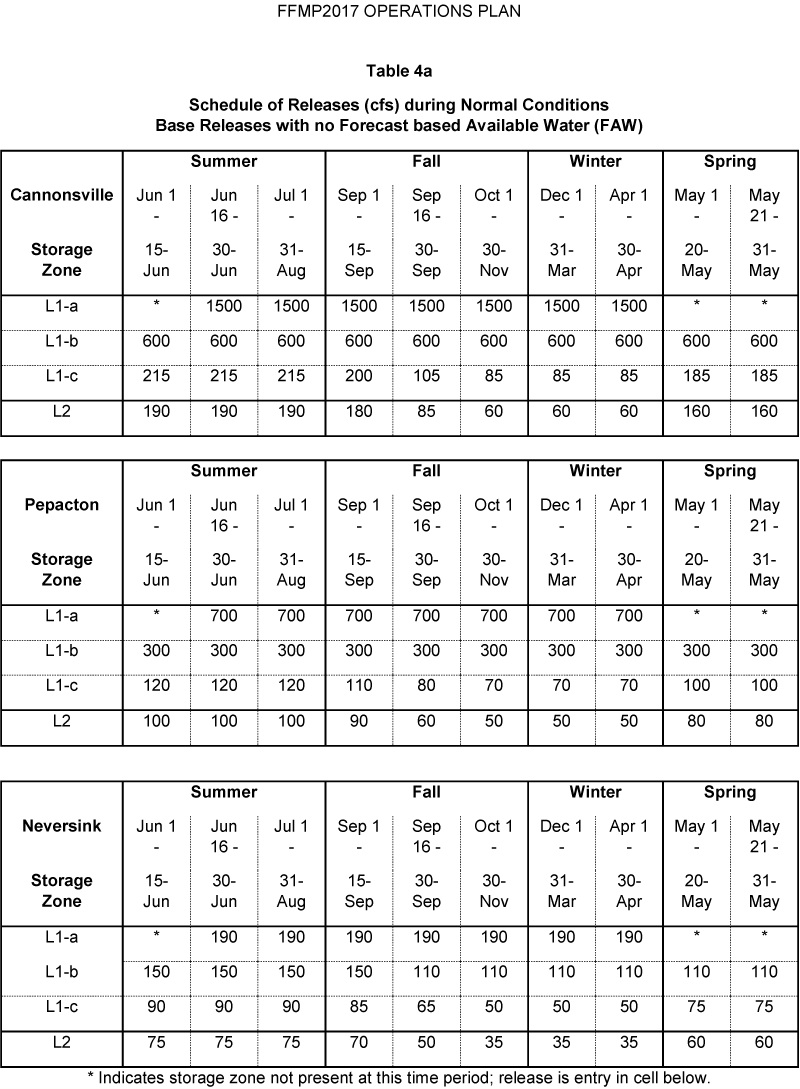
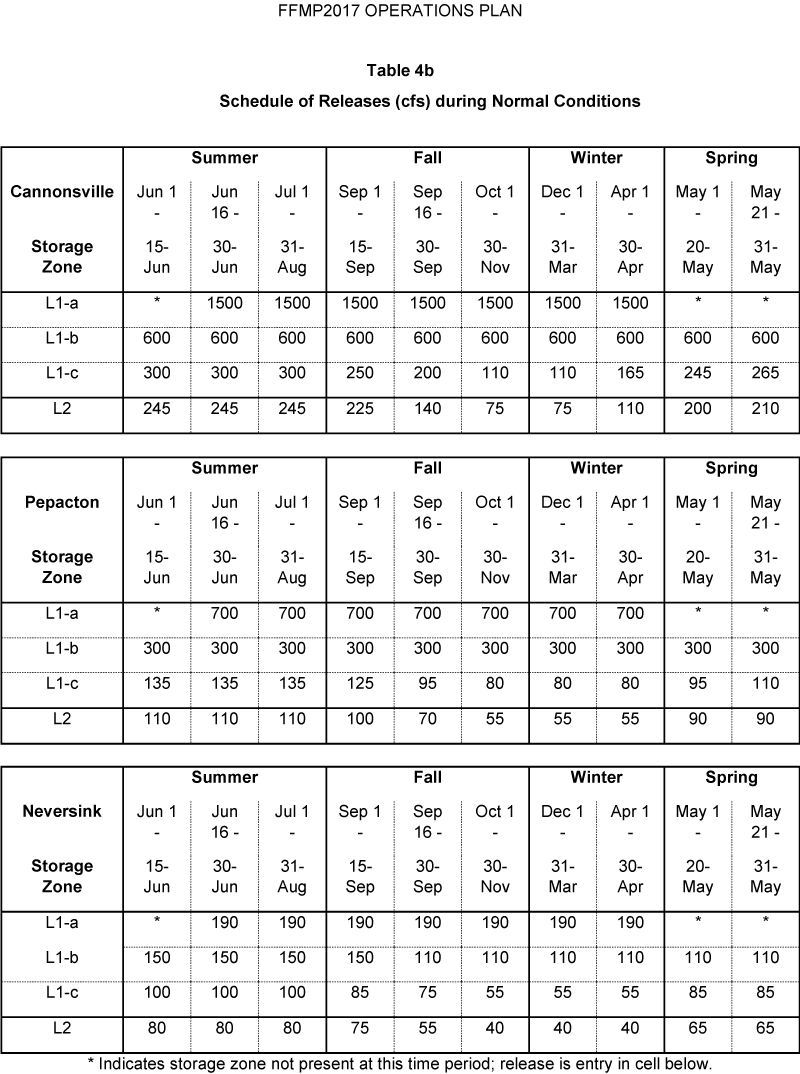
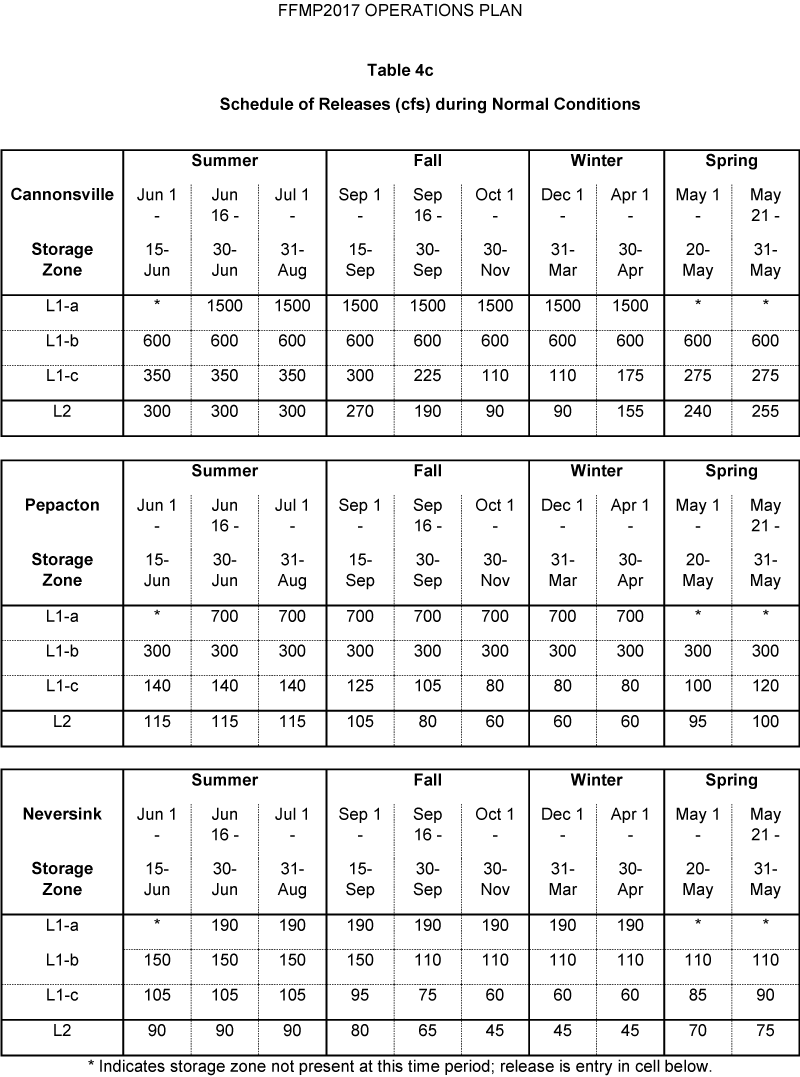
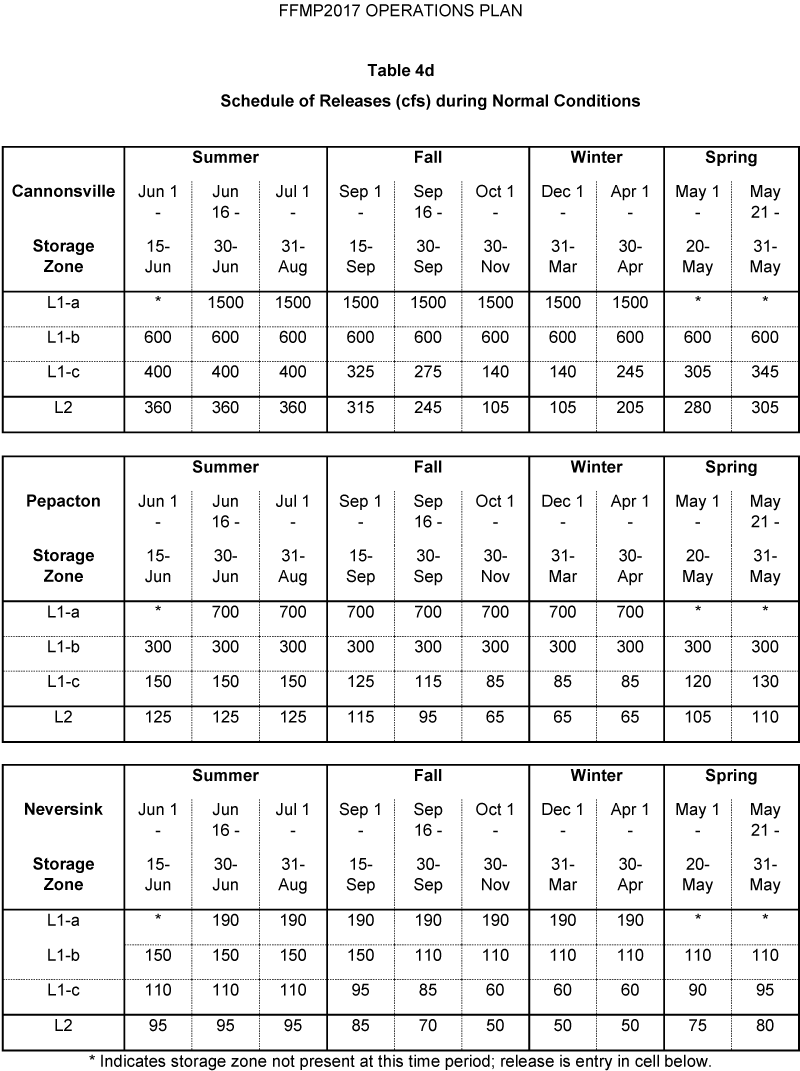
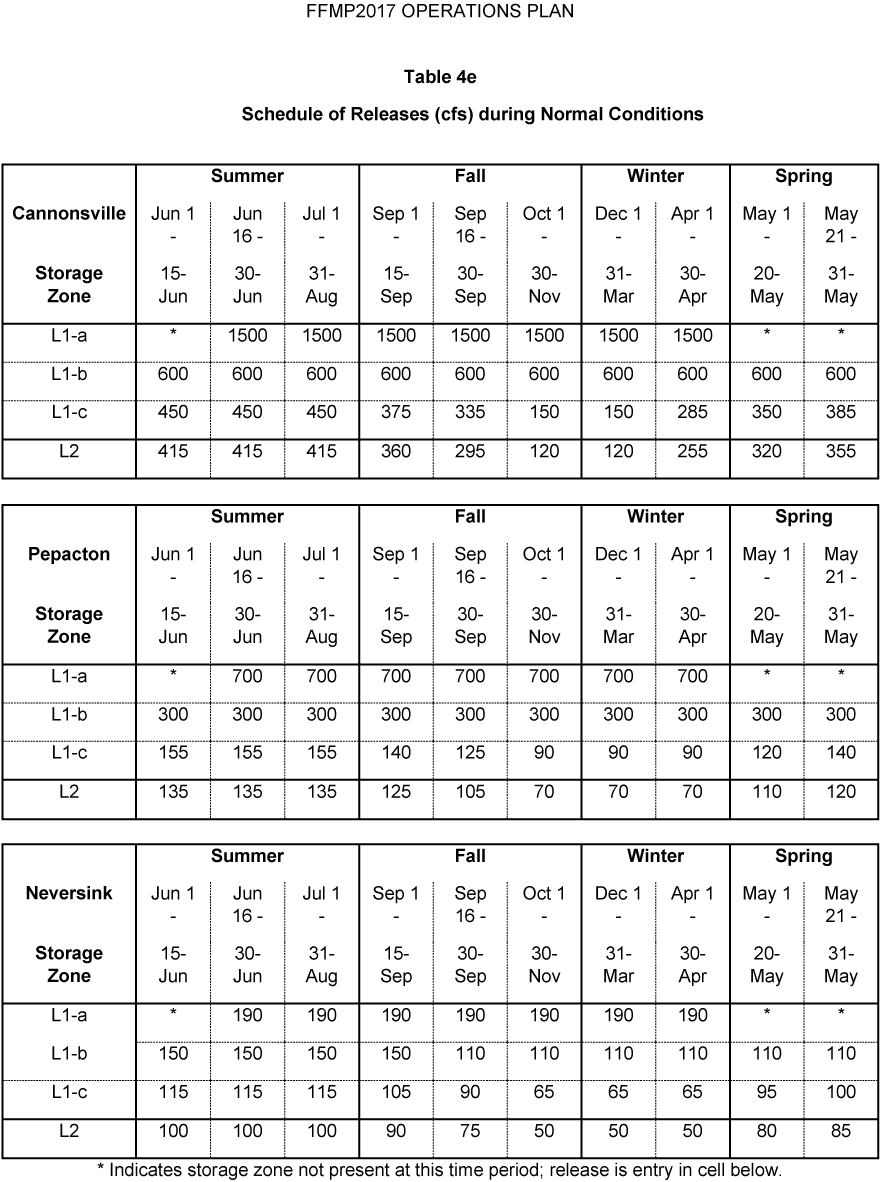
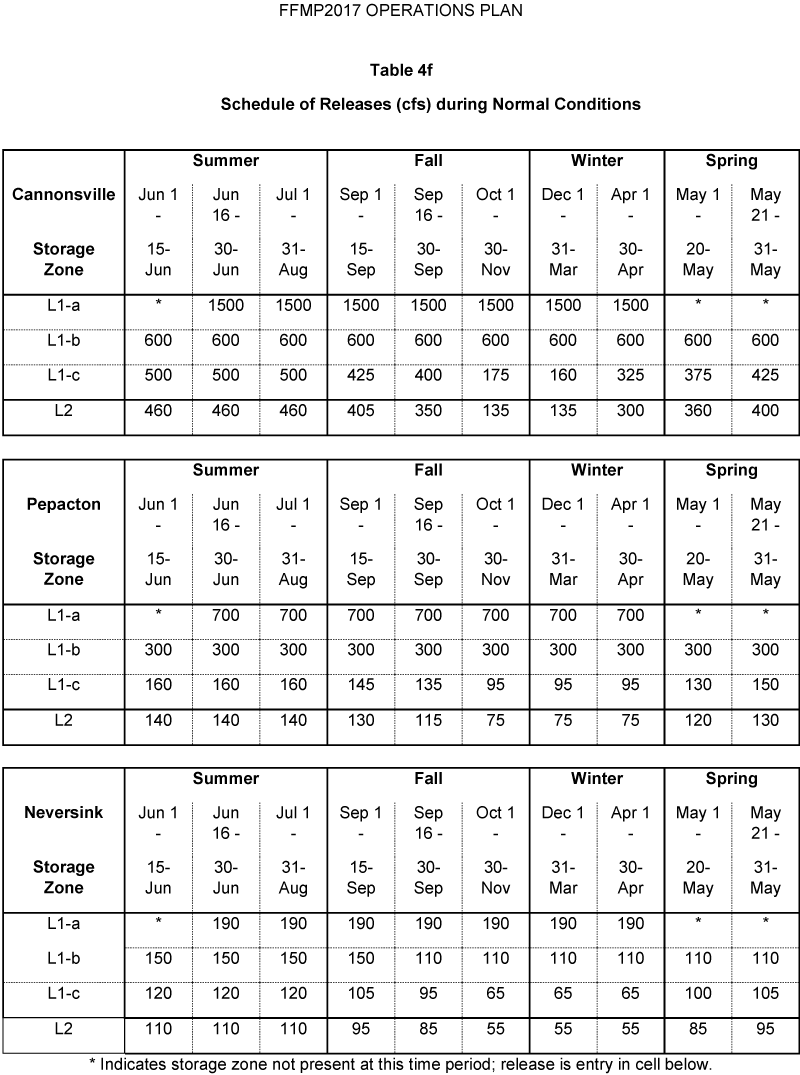
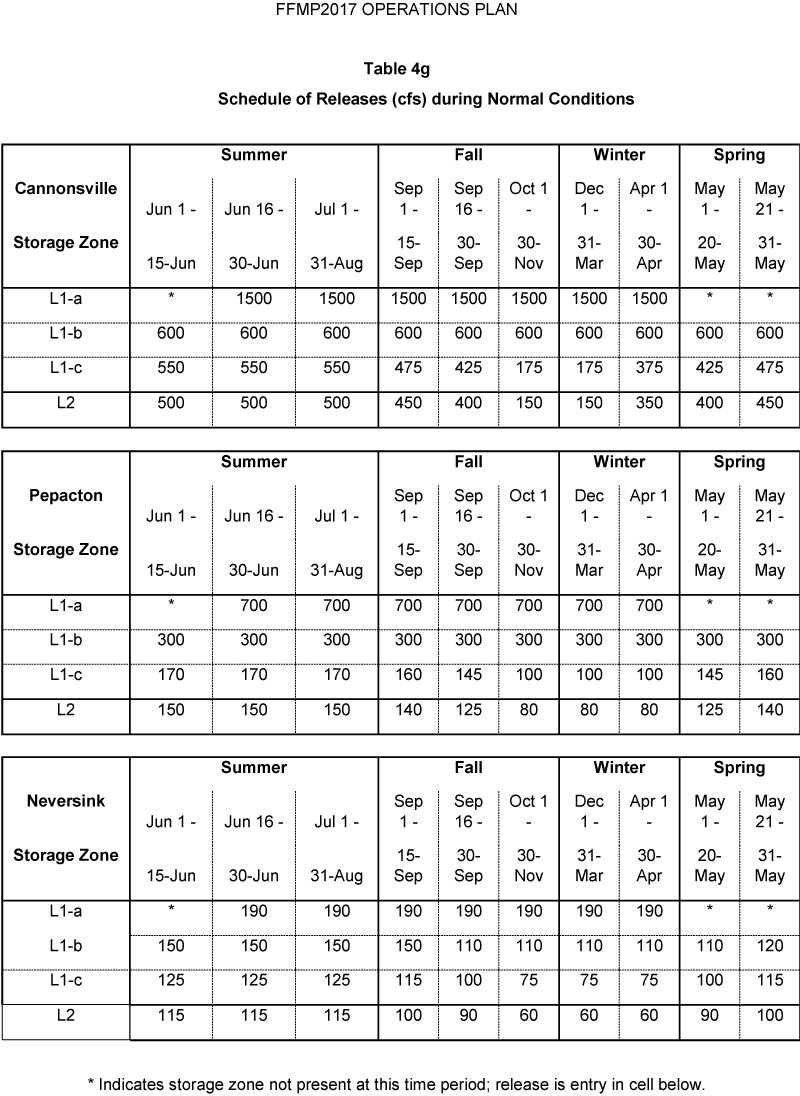
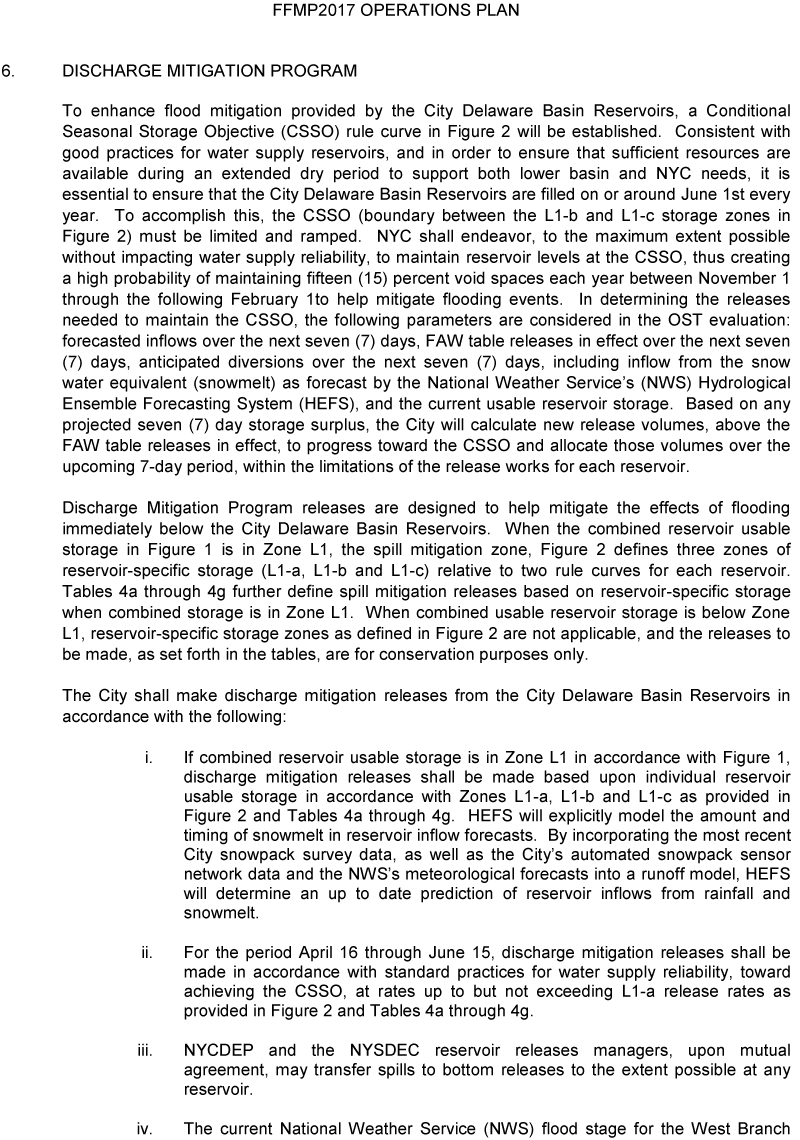
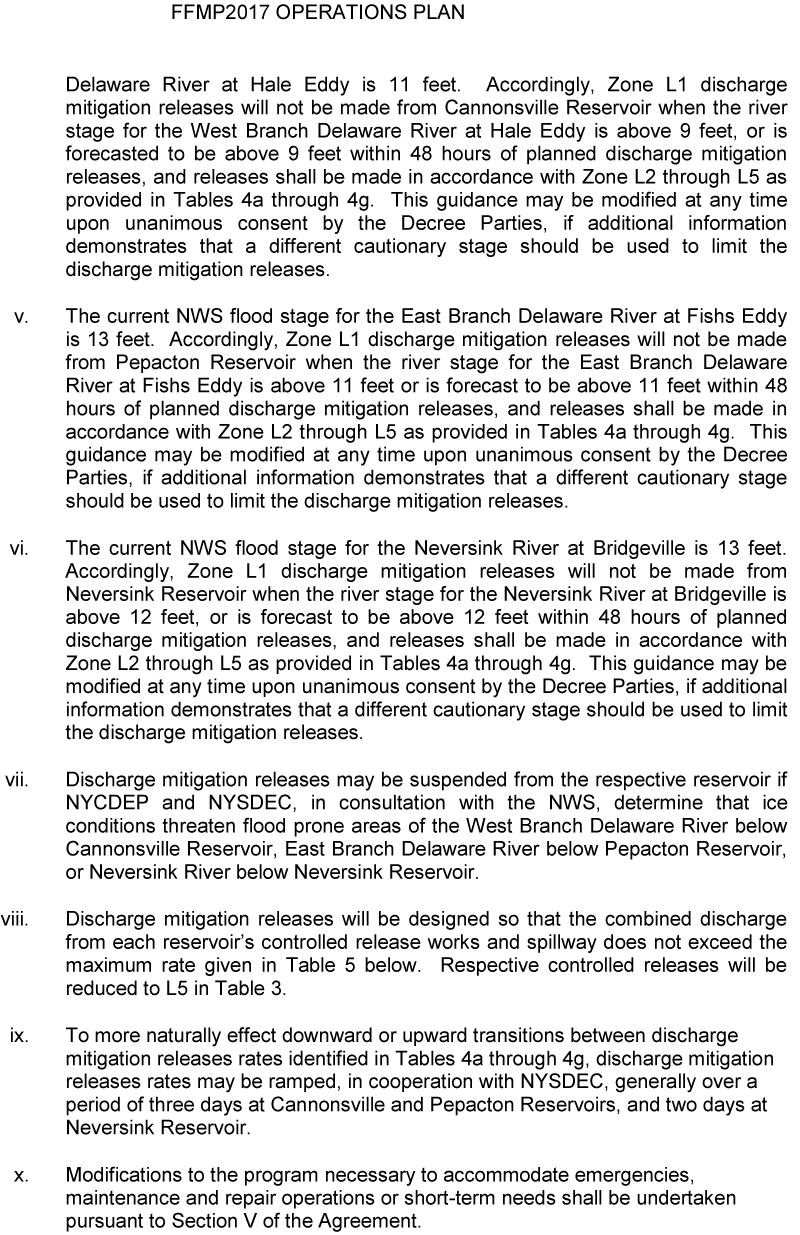
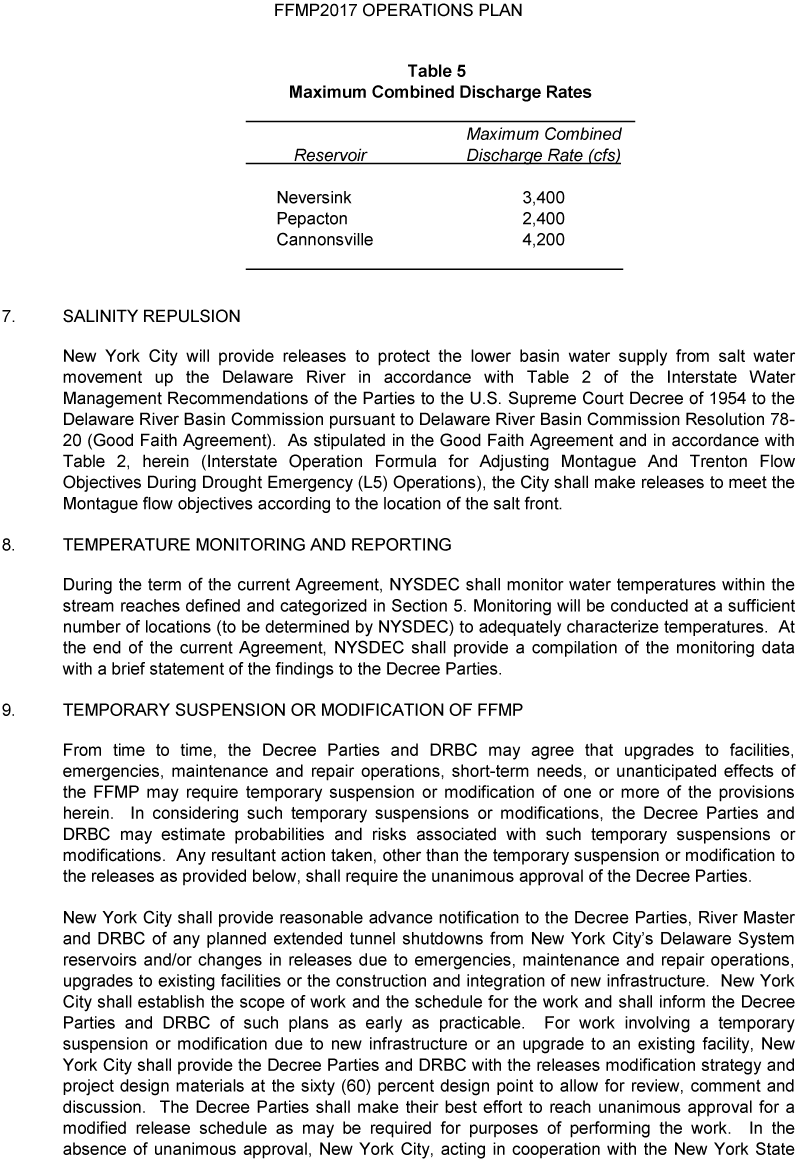
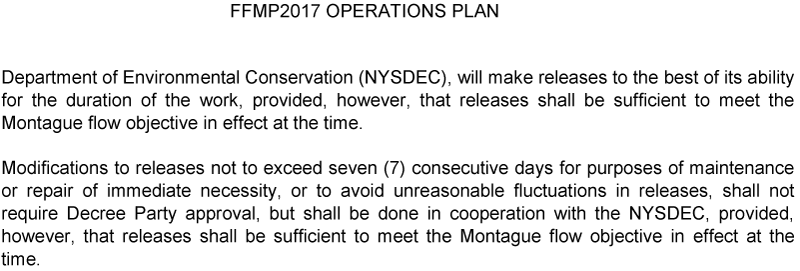
Full text of an agreement affecting the Amended Decree of the U.S. Supreme Court for managing diversions and releases under the Decree.
Conversion Factors
U.S. customary units to International System of Units
Temperature in degrees Celsius (°C) may be converted to degrees Fahrenheit (°F) as °F = (1.8 × °C) + 32.
Datums
Vertical coordinate information is referenced to the Bureau of Water Supply (BWS) datum, which was established by the New York City Department of Environmental Protection, Bureau of Water Supply.
Horizontal coordinate information is referenced to the North American Datum of 1983 (NAD 83).
Elevation, as used in this report, refers to distance above the vertical datum.
Supplemental Information
Specific conductance is given in microsiemens per centimeter at 25 degrees Celsius (uS/cm at 25 °C).
Concentrations of chemical constituents in water are given in milligrams per liter (mg/L).
Abbreviations
BWS
Bureau of Water Supply
Del.
Delaware
DRBC
Delaware River Basin Commission
FFMP
Flexible Flow Management Program
FFMP2017
2017 Flexible Flow Management Program
ft
foot
ft3/s
cubic foot per second
(ft3/s)-d
cubic foot per second accumulated daily
IERQ
Interim Excess Release Quantity
in.
inch
Mgal
million gallons
Mgal/d
million gallons per day
mg/L
milligram per liter
mi
mile
mi2
square mile
NAD 83
North American Datum of 1983
N.J.
New Jersey
N.Y.
New York
NYCDEP
New York City Department of Environmental Protection
NWIS
National Water Information System [database]
ODRM
Office of the Delaware River Master
OST
Operational Support Tool
Pa.
Pennsylvania
THPDMP
Tailwaters Habitat Protection and Discharge Mitigation Program
USGS
U.S. Geological Survey
µS/cm at 25 °C
microsiemens per centimeter at 25 degrees Celsius
For more information about this report, contact:
Delaware River Master, Office of the Delaware River Master, U.S. Geological Survey.
Visit our website at:
https://webapps.usgs.gov/odrm/
Publishing support provided by the Reston Publishing Service Center
Disclaimers
Any use of trade, firm, or product names is for descriptive purposes only and does not imply endorsement by the U.S. Government.
Although this information product, for the most part, is in the public domain, it also may contain copyrighted materials as noted in the text. Permission to reproduce copyrighted items must be secured from the copyright owner.
Suggested Citation
Russell, K.L., Andrews, W.J., DiFrenna, V.J., Norris, J.M., and Mason, R.R., Jr., 2024, Report of the River Master of the Delaware River for the period December 1, 2016–November 30, 2017: U.S. Geological Survey Open-File Report 2024–1022, 109 p., https://doi.org/10.3133/ofr20241022.
ISSN: 2331-1258 (online)
ISSN: 0196-1497 (print)
Study Area
| Publication type | Report |
|---|---|
| Publication Subtype | USGS Numbered Series |
| Title | Report of the River Master of the Delaware River for the period December 1, 2016–November 30, 2017 |
| Series title | Open-File Report |
| Series number | 2024-1022 |
| ISBN | 978-1-4113-4580-5 |
| DOI | 10.3133/ofr20241022 |
| Publication Date | August 16, 2024 |
| Year Published | 2024 |
| Language | English |
| Publisher | U.S. Geological Survey |
| Publisher location | Reston, VA |
| Contributing office(s) | Office of the Associate Director for Water |
| Description | xi, 109 p. |
| Country | United States |
| State | New Jersey, New York, Pennsylvania |
| Online Only (Y/N) | N |
| Additional Online Files (Y/N) | N |