

Neotropical Migratory Bird Monitoring Study at Marine Corps Base Camp Pendleton, California—2021 Annual Data Summary
Links
- Document: Report (9 MB pdf) , HTML , XML
- Download citation as: RIS | Dublin Core
Acknowledgments
This work was funded by Environmental Security Department, Resources Management Division, Marine Corps Base Camp Pendleton, California. Data either are not available or have limited availability owing to restrictions of the funding entity (U.S. Marine Corps). Contact Ryan Besser; ryan.besser@usmc.mil, for more information. The authors thank the biologists who assisted in data collection for this project: Lisa Allen, Lesley Handa, Alexandra Houston, Suellen Lynn, Rachelle McLaughlin, Jessica Medina, Elin Pierce, Benjamin Stubbs, Devin Taylor, and Michelle Treadwell.
Executive Summary
Two Monitoring Avian Productivity and Survivorship (MAPS) stations were operated at Marine Corps Base Camp Pendleton (MCBCP), California, in 2021: one at De Luz Creek and one at the Santa Margarita River. The stations were established to provide data on Neotropical migratory birds at MCBCP to support the dual missions of environmental stewardship and military readiness.
A total of 1,227 individual birds were captured in 2021 between the two stations: 395 at De Luz and 832 at Santa Margarita (both 15 banding days). Of these 1,227 individuals captured, 955 were newly banded (273 at De Luz and 682 at Santa Margarita), 150 were recaptures banded before 2021 (28 at De Luz and 122 at Santa Margarita, excluding recaptures released before reading band number [1 at De Luz and 3 at Santa Margarita]), and 118 were unbanded (93 at De Luz and 25 at Santa Margarita). Return rate in 2021 was much lower than the annual mean at De Luz (1995–2019) and similar to the annual mean at the Santa Margarita station (1998–2020). The sex ratio of known-sex adult birds was skewed toward males at both stations in 2021.
Species richness was similar at De Luz from 2019 to 2021, increased at Santa Margarita from 2020 to 2021 and was above annual means at both sites (1995–2019 and 1998–2020, respectively). The most abundant species at De Luz were Wrentit (Chamaea fasciata) and Allen’s Hummingbird (Selasphorus sasin). Song Sparrow (Melospiza melodia) and Common Yellowthroat (Geothlypis trichas) were most abundant at Santa Margarita.
Since 2002, we have examined the population trends of 12 species at De Luz and 13 species at Santa Margarita for which numbers of known-age individuals were adequate for statistical analysis. We estimated population size and calculated indices of productivity and survival for a subset of these species with sufficient captures and recaptures for valid parameter estimation—four at De Luz and six at Santa Margarita. We determined that in 2021, abundance of 42 percent (5 of 12) of focal species at De Luz and 38 percent (5 of 13) of focal species at Santa Margarita was below the annual mean abundance. Of the focal species below mean abundance, 40 percent (2 of 5) at De Luz and 60 percent (3 of 5) at Santa Margarita were migrant populations. Of the focal species, 25 (3 of 12) percent at De Luz and 31 percent (4 of 13) at Santa Margarita had declining population trends during the span of station operation. With few exceptions, these declines appeared to be associated with conditions on the breeding grounds.
Annual productivity (calculated as the ratio of juveniles to adults among individual captures) was zero for all focal species at De Luz in 2021. At Santa Margarita, productivity increased from year 2020 to 2021 for Common Yellowthroat, Song Sparrow, and Yellow Warbler (Setophaga petechia) and declined from year 2020 to 2021 for Least Bell’s Vireo (Vireo bellii pusillus), but productivity was above the 1998–2020 mean for all four species, whereas productivity was maintained for Orange-crowned Warbler (Leiothlypis celata) and Yellow-breasted Chat (Icteria virens). Winter precipitation affected productivity of Black-headed Grosbeak (Pheucticus melanocephalus), Common Yellowthroat, and Song Sparrow at De Luz and affected productivity of Common Yellowthroat, Orange-crowned Warbler, Song Sparrow, Yellow-breasted Chat, and Yellow Warbler at Santa Margarita.
We calculated the mean annual adult survival for 1998–2020 at Santa Margarita, excluding years when the station was not operated. Survival could not be calculated for De Luz in 2021 because the station was not operated in 2020. Model-averaged annual adult survival ranged from 42 to 66 percent for residents and from 30 to 66 percent for migrants at Santa Margarita. Survival of Common Yellowthroat, Song Sparrow, and possibly Yellow Warbler was found to be affected by winter precipitation. Sex was a significant predictor of survival for Common Yellowthroat, Least Bell’s Vireo, Orange-crowned Warbler, and Yellow-breasted Chat at Santa Margarita, where females were found to have lower survival than males.
At Santa Margarita, multiple regression analyses examining adult survival and productivity as predictors of future population size indicated that resident Song Sparrow and migrant Yellow Warbler populations were affected by population size from the previous year, migrant Yellow-breasted Chat populations were affected by productivity from the previous year, and migrant Orange-Crowned Warbler populations were affected by survival from the previous year. Updated previous-year population size predictions could not be calculated for De Luz because the station was not operated in 2020.
Introduction
This report is the 22nd annual progress update summarizing the activities of two Monitoring Avian Productivity and Survivorship (MAPS) stations at Marine Corps Base Camp Pendleton (MCBCP or Base). MAPS is an international monitoring program that uses capture and banding data to compile basic demographic parameters of migratory bird species, many of which are imperiled regionally and even globally (DeSante and others, 2005). Age- and sex-specific data on annual survival, reproduction, and recruitment can be gathered and compared across stations to identify population trends for species of interest and can be used to identify proximate factors responsible for trends, in particular, negative trends. In turn, information obtained from long-term monitoring of bird populations can be used to guide management activities intended to maintain or reestablish viable populations throughout the species’ ranges.
Two MAPS stations were established at Camp Pendleton in 1995 and operated annually thereafter: one in riparian habitat along De Luz Creek and the other in oak woodland near Case Springs in a mountainous region of the Base. A third station was established in 1998 in riparian habitat along the Santa Margarita River, west of Ysidora Basin, at the site of the former water treatment settling ponds. These stations were established as part of a long-term study of the status of Neotropical migratory birds at Camp Pendleton and are being operated in a manner consistent with other banding stations participating in an effort to monitor birds worldwide. Operation of the Case Springs station ceased after the 1999 season because of low annual capture rates (Kus and Beck, 2001). The following progress report deals exclusively with results from the De Luz Creek and Santa Margarita River stations that have been operated annually since 1995 and 1998, respectively. Neither of these stations were operated in 2003, 2005, 2011, or 2012, and the De Luz station was not operated in 2020 when funding was unavailable.
Partway through the 2004 season, a wildfire known as the India fire burned part of De Luz Canyon, including the De Luz station. The fire, which started on May 2, burned for several days, and drastically changed the habitat at the De Luz station. It left little to no herbaceous or shrub vegetation and scorched most trees through the canopy layer. By August 2004, an altered herbaceous layer had returned, and trees and shrubs showed new growth. We continued to operate the De Luz station in 2004 after the fire on a modified basis; nets were operated fewer hours per day in order to minimize sun exposure of birds in nets resulting from the change in vegetation structure. Individual captures, total captures, and capture rates were extremely low because of loss of habitat and reduced net-hours (Kus and Falcone, 2006). In 2006, standard banding operations resumed at the De Luz station. There were subsequent fires in and around De Luz Canyon, but they did not burn the De Luz station. The Santa Margarita station has never burned. In 2017, heavy winter rains resulted in flooding at the De Luz station, which thinned or removed the understory and deposited sand throughout part of the station. The flooding in 2017 restricted access to the station until mid-May and delayed operations until late in the season. Consequently, adults expected to be captured during that time were missed, skewing adult population size estimates and inflating estimates of productivity.
Methods
Bird Banding
Following standardized MAPS protocol (DeSante and others, 2021), the Santa Margarita station was operated 1 day during every 10-day netting period (hereafter referred to as period) between April 6 and August 24, 2021, for a total of 15 days (periods). The De Luz station was operated 1 day during every 10-day netting period between April 7 and August 25, 2021, for a total of 15 periods. The first three periods in April were designated as −3, −2, and −1, whereas those between May 1 and August 31 were designated as 1, 2, and so forth to conform to the standard MAPS nomenclature, where station operation begins on May 1. A total of 10 mist nets, placed 60–100 meters (m) apart, were erected at each site in fixed locations, chosen in the first year of the study for their potential to capture birds moving through the vegetation (figs. 1, 2). Net 9 at De Luz was moved in 2017 after winter flooding scoured away the vegetation around it; it was renamed net 19 in accordance with MAPS protocol (fig. 1). After further winter flooding (winter 2018–19), the center of the site was scoured, eliminating nets 5, 6, 7, and 10. With nets 8 and 19 as the southernmost nets, the station was extended north, adding eight new net locations labeled 20–27 (fig. 1). Mist nets were made of 30-millimeter (mm) mesh black nylon and were 12 m long by 2.6 m high with four trammels (pockets) running the length of the net. Nets were suspended from vertical aluminum poles anchored by permanent rebar stakes and covered a vertical area ranging from approximately 0.25 to 2.5 m above the ground. Nets were opened within 30 minutes after dawn and were run for 5 hours, typically until between 1100 and 1200 Pacific Daylight Time (PDT). Nets were not operated during inclement weather, such as rain, heavy wind, or extreme heat or cold. Any deficiency in netting time totaling more than 2.5 hours, because of weather or other events, was corrected by netting for that amount of time on the next available day.
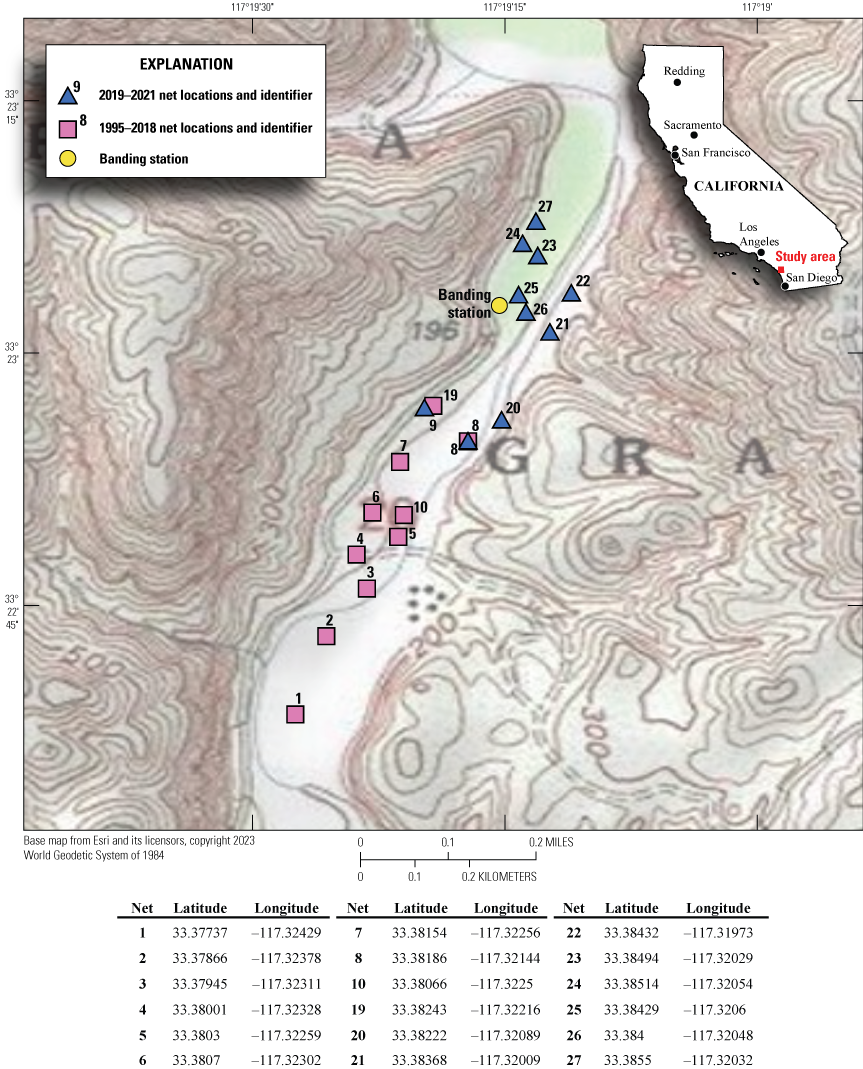
Net locations at De Luz Creek, Marine Corps Base Camp Pendleton, California. Net coordinates in decimal degrees.
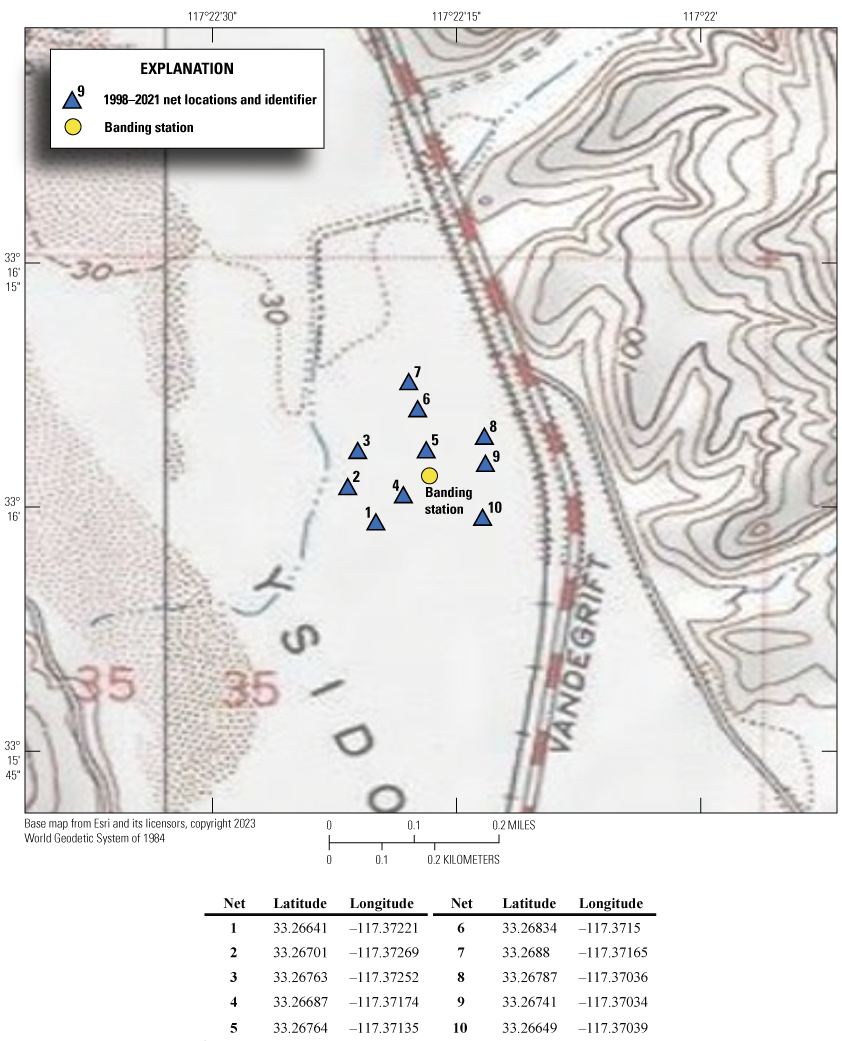
Net locations at Santa Margarita River, Marine Corps Base Camp Pendleton, California. Net coordinates in decimal degrees.
Nets were checked every 30–40 minutes by observers working circuits. Hummingbirds, game birds, and raptors were not banded but were identified to species, age, and sex when possible and released at the capture site. All other birds were removed from nets, held in cloth bags labeled with the net number, and taken to a central processing location within 250 m of the most distant net, where they were banded with federal numbered aluminum bands. Data recorded for each individual caught included age, sex, breeding condition, weight, wing chord, fat deposition, feather wear, and molt status (Pyle, 1997). Birds were held for 5–30 minutes, depending on the number of birds captured during one net run. After processing, juveniles, brooding females, and all Wrentits (Chamaea fasciata) were released in the vicinity of the net in which they had been captured, while all other birds were released at the processing station. Typically, three field personnel operated the De Luz station (hereafter, De Luz) and four operated the Santa Margarita station (hereafter, Santa Margarita).
Fieldwork was authorized under Federal Recovery Permit ESPER0004080-0 and Federal Bird Banding Permit 22372 by Lisa Allen, Lesley Handa, Alexandra Houston, Suellen Lynn, Rachelle McLaughlin, Jessica Medina, Shannon Mendia, Elin Pierce, Benjamin Stubbs, Devin Taylor, and Michelle Treadwell.
Analyses
All banding data were entered into MAPSPROG, the Institute for Bird Populations (IBP) data entry program, for verification and error checking, which included cross-checking against previous years’ data (Froehlich and others, 2006). Finalized MAPSPROG data were submitted to IBP and analyzed as described in the following section.
Bird captures were quantified by species, age, sex, and number of captures for each year. We used the total number of captures (newly banded birds, birds that were captured but not banded [unbanded; including hummingbirds, game birds, raptors, and birds that escaped prior to banding], and previously banded birds [recaptures]) to create a list of captured species and a total count of captures per species for the sites. We intentionally did not band hummingbirds because they are difficult to band and recapture and would require a concentrated effort beyond the scope of a MAPS station. We included hummingbirds in the total count of captures and the captured species list, but we did not include them in further analyses because we could not determine individual identity, and therefore, could not accurately calculate abundance, productivity, or survival. The total number of individuals captured each year included only newly banded birds, unbanded birds, and first-time recaptures of birds banded at the sites in previous years and represents the number of unique individuals caught, even though some may have been captured more than once during the season.
We calculated annual capture rates for each species by dividing the total number of captures by the total number of hours nets were open at the banding station (net-hours) and multiplying this number by 100. Captures per 100 net-hours is a standard unit of measurement used for bird banding analyses. Calculating capture rates in this manner allowed us to account for variability in the number of banding hours each day and make between-year comparisons.
We calculated species richness (the number of species captured at the site), relative species abundance (the proportion of all individuals represented by a particular species), sex and age ratios (to determine the demographic composition of the population), productivity (a reproductive index represented by the number of juveniles captured divided by the number of adults captured), adult survival (based on encounter histories and recapture probabilities using Program MARK; White and Burnham, 1999; see “Productivity, Survival, and Population Size” for details), and population trends. Subsets of species were examined for population trends, population composition, productivity, survival, and population size analyses. The species examined differed among the various analyses and were based on the requirements of particular analyses and the methods of past reports.
All comparisons with previous years’ data refer to the following reports: Kus, 1995, 1996; Kus and Beck, 1997, 1999, 2000; Kus and Sharp, 2002; Kus and Kisner, 2003; Kus and Falcone, 2006; Howell and others, 2007, 2008; Rogne and others, 2008; Rogne and Kus, 2009, 2010; Madden-Smith and others, 2012; Allen and Kus, 2014, 2015; Madden and others, 2015; Hall and Kus, 2016, 2017; Mendia and others, 2018; Mendia and Kus, 2019.
Population Trends
As in past reports, we examined the population trends of 12 breeding species at De Luz and 13 breeding species at Santa Margarita with historically adequate numbers of known-age individuals (Kus and Kisner, 2003; Kus and Falcone, 2006). At the time the species were chosen, the requirements were that the species averaged greater than six captures per year, bred at the stations, and had easily distinguishable age classes (Kus and Kisner, 2003). We used the number of adult captures per 100 net-hours to compare population trends, while accounting for minor differences in annual effort. We considered residents and migrants separately because these two groups experience different conditions affecting their populations. Resident species spend their entire annual cycle at Camp Pendleton, whereas migratory species split the year between Camp Pendleton breeding grounds, migration routes, and distant wintering grounds. Seven resident species (Bewick’s Wren [Thryomanes bewickii], California Towhee [Melozone crissalis], Common Yellowthroat [Geothlypis trichas], House Wren [Troglodytes aedon], Song Sparrow [Melospiza melodia], Spotted Towhee [Pipilo maculatus], and Wrentit) and five migrant species (Ash-throated Flycatcher [Myiarchus cinerascens], Black-headed Grosbeak [Pheucticus melanocephalus], Least Bell’s Vireo [Vireo bellii pusillus], Pacific-slope Flycatcher [Empidonax difficilis], and Yellow-breasted Chat [Icteria virens]) were selected for consideration of population trends at De Luz. Seven resident species (American Goldfinch [Spinus tristis], Bewick’s Wren, Common Yellowthroat, House Wren, Song Sparrow, Spotted Towhee, and Wrentit) and six migrant species (Black-headed Grosbeak, Least Bell’s Vireo, Orange-crowned Warbler [Leiothlypis celata], Willow Flycatcher [Empidonax traillii], Yellow Warbler [Setophaga petechia], and Yellow-breasted Chat) were selected at Santa Margarita.
We used linear regression to analyze long-term population trends of the focal species, with year as the independent variable and individuals captured per 100 net-hours as the dependent variable. Analyses were considered significant if P was less than or equal to (≤) 0.10. For each species with significant trends, we calculated the percent annual change by dividing the slope of the regression line by the mean annual captures per 100 net-hours and multiplying by 100 (Nott and Michel, 2005).
Productivity, Survival, and Population Size
To determine the contributions of breeding productivity and annual adult survival to annual population size, we estimated population size and calculated indices of productivity and survival for each year for a subset of bird species with sufficient captures and recaptures for valid parameter estimation. At De Luz, we analyzed productivity for two migrant species (Black-headed Grosbeak and Least Bell’s Vireo) and two resident species (Common Yellowthroat and Song Sparrow). At Santa Margarita, we analyzed productivity and survival for four migrant species (Least Bell’s Vireo, Orange-crowned Warbler, Yellow-breasted Chat, and Yellow Warbler) and two resident species (Common Yellowthroat and Song Sparrow).
Productivity was calculated as the number of juvenile captures (hatch-year [HY]) divided by the number of adult captures (after-hatch-year [AHY]) to control for fluctuations in adult population size. We used the number of individual adults captured per 100 net-hours for each species as the relative population estimate for each year.
For Santa Margarita, we calculated annual survival of focal species in Program MARK (White and Burnham, 1999), using the ‘RMark’ package (Laake, 2013) in R (R Core Team, 2021). We estimated only adult survival because first-year survival was small and therefore difficult to differentiate from recapture probability. Birds were grouped by sex (female versus male), and birds of unknown sex were excluded from analyses. For MARK analyses, we created encounter histories for each of the selected species based on if an individual was captured at the station within a particular year. Multiple captures of individuals within a year were counted as a single encounter. We assumed constant recapture probability because we expended a nearly constant effort each year. Because we did not operate the MAPS stations during 2003, 2005, 2011 (operated only during fall migration and therefore not comparable to other years), and 2012, we were unable to calculate annual survival for several years. De Luz was not operated in 2020, so annual survival was not calculated for 2021.
We analyzed these data using multiple regression, where the independent variables were the previous year’s population estimate (yearx−1), the previous year’s productivity (yearx−1), and model-averaged survival from the previous year (yearx−1) to the survey year (yearx), and the dependent variable was the survey year’s (yearx) population estimate. To account for effort, we used population estimate per 100 net-hours in these analyses. Analyses were considered significant if P≤0.10.
Effect of Precipitation on Productivity and Survival
We examined the effect of winter precipitation on productivity and survival of the focal species at each station because several studies have found it to be an important predictor (Nott and others, 2002; Sillett and Holmes, 2002; Bolger and others, 2005; DeSante and others, 2005; LaManna and others, 2012; Rockwell and others, 2017; Zarzycki, 2017). Monthly precipitation data were gathered from Camp Pendleton’s Lake O’Neill station for years that the Camp Pendleton MAPS stations were operated (Office of Water Resources, 2021). We grouped total precipitation values over two periods of the local rainy season of each bio year (from July to June): from October to December (hereafter, early winter) and from January to March (hereafter, late winter), since timing of precipitation likely affects the timing of increased availability of food resources (seeds, fruits, and insects). We created a set of models using total winter precipitation (early and late winter precipitation combined), early winter precipitation, and late winter precipitation as independent variables, and a model with early and late winter precipitation together as two predictors in the same model, to estimate the regression equation coefficients for each variable while controlling for the other.
We used multiple regression to build models and an information-theoretic approach (Akaike’s Information Criterion for small sample size [AICc]) to evaluate support for models that tested the effect of winter precipitation on productivity of focal species (Burnham and Anderson, 2002). We used the productivity values (calculated as stated earlier) for each focal species as dependent variables. Productivity models for De Luz did not include 2004 or 2017 because the effort in those years was inconsistent with other survey years.
We also used AICc to evaluate support for models that tested the effect of sex, year (annual variability related to habitat condition, such as wildfire, flooding, hurricanes, and disturbances by other causes), and winter precipitation as predictors of survival of focal species at Santa Margarita. We used logistic regression in a mark-recapture modeling framework to build models. First, we generated a constant survival model to serve as a reference. We then modeled sex, year, and winter precipitation and evaluated support for the models relative to the constant survival.
The best-fitting model was selected from a set of models using AICc. Models were considered well supported if they were within 2 AICc of the highest-ranked (top) model (ΔAICc was less than 2), AIC weight that was greater than 0.05, and parsimony (favoring simpler models over more complex models with similar support). We estimated productivity and survival from the top model, unless more than one model in the model set had a ΔAICc value of less than 2, in which case we averaged the parameters of all the models in the model set using the ‘MuMIn’ package (version 1.43.17; Barton, 2020) in R (R Core Team, 2021) for productivity and the ‘RMark’ package (Laake, 2013) in R (R Core Team, 2021) for annual survival estimates (Burnham and Anderson, 2002).
Results
De Luz Creek
Overview of 2021 Captures
From April 7 to August 25, 2021, 395 individuals of 42 species were captured during 710.6 net-hours (operation of one net for 1 hour; unidentified species not included in individual or species total; see appendix 1, table 1.1 for common and taxonomic species names of alpha codes used in tables and figures; appendix 2, tables 2.1, 2.2). The number of individuals captured in 2021 decreased by 25 percent from 2019 but was higher than the annual mean (±standard deviation [SD]) of 372±93 individuals (appendix 2, table 2.1) during years of standard banding operations (1995–2002, 2006–10, 2013–16, 2018, and 2019). Species richness stayed at 42 species in 2019 and 2021 and was higher than the annual mean (±SD) of 40±3 species (1995–2002, 2006–10, 2013–17, 2018, and 2019). One new species, Black-throated Gray Warbler (Setophaga nigrescens), was captured at De Luz in 2021, increasing the station total to 81 species.
Overall captures, including recaptures of some individuals, totaled 443; 24 percent less than in 2019. Of those 443 captures, 395 were individual captures, with 273 new individuals captured, 29 individuals recaptured from previous years (including 1 recapture that escaped before reading its band number), and 93 unbanded individuals (appendix 2, tables 2.1, 2.3). Mean capture rate over all dates was 0.6 captures per net-hour (range 0.3–1.0 captures per net-hour), 25 percent lower than in 2019 (appendix 2, table 2.2).
Of the species making up at least 5 percent of the total number of individuals captured, Wrentit and Allen’s Hummingbird (Selasphorus sasin) were the most abundant species captured (49 and 36 individuals, respectively). California Towhee was the third most abundant species (29 individuals), Spotted Towhee was the fourth most abundant species captured (27 individuals), Anna’s Hummingbird (Calypte anna) and Black-headed Grosbeak were tied for the fifth most abundant species (both with 23 individuals), and Bushtit (Psaltriparus minimus) and Song Sparrow were tied for the sixth most abundant species (both with 20 individuals; fig. 3; appendix 2, table 2.1). These eight species together accounted for 57 percent of all individuals captured at De Luz in 2021.
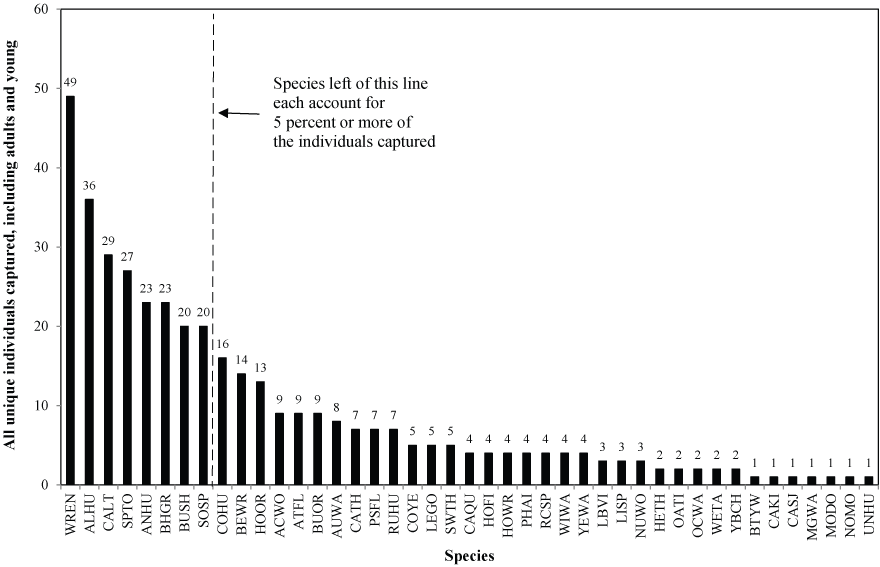
Number of individuals (banded and unbanded) captured per species at De Luz Creek, Marine Corps Base Camp Pendleton, California, 2021. See appendix 1 (table 1.1) for common and scientific bird names corresponding to four-letter species codes.
The sex ratio of adults of known sex (N=217) was skewed toward males (58:42, M:F; appendix 2, table 2.4). The proportion of juveniles among birds captured in 2021 was 20 percent, 21 percent lower than the 1995–2019 mean (±SD) of 25±16 percent (not including 2017, when juvenile numbers were inflated because of delayed entry to the station). A total of 67 juveniles of 15 species were captured. The species making up at least 5 percent of the total number of juveniles captured were Allen’s Hummingbird, Anna’s Hummingbird, Costa’s Hummingbird (Calypte costae), Bushtit, and Bewick’s Wren; these five species made up 82 percent of all juveniles captured at De Luz in 2021.
Of the individual birds captured at the station, 76 percent (300/395) were banded, either in 2021 or in previous years (excludes 1 recapture that escaped before reading its band number; appendix 2, tables 2.1, 2.3). A total of 93 birds were not banded, 83 of which were hummingbirds and 5 of which were game birds. The remaining five birds escaped before banding.
Capture rates were highest at 100 captures per 100 net-hours in early May during MAPS period 1, coinciding with migration at this time of year, and in mid-July during MAPS period 8 (appendix 2, table 2.2). Peak species richness of 22 species was seen in early May during MAPS period 1 (appendix 2, table 2.5).
A total of 29 individual birds, 7 percent of all individuals captured (banded and unbanded; 29/395), were banded in previous years at De Luz (appendix 2, tables 2.1, 2.3), which was 48 percent lower than the mean annual return rate (±SD) from 1996 to 2019 of 12±5 percent. All recaptures were originally banded from 2016 to 2019. Of the recapture total, 52 percent consisted of Song Sparrows and Spotted Towhees (with seven individuals each). The two oldest individuals recaptured in 2021, both at least 6 years old and banded as adults in 2016, were a Wrentit of unknown sex and a male Bullock’s Oriole (Icterus bullockii; appendix 2, table 2.3).
Population Trends
Of the focal species, 33 percent (4/12) had population sizes above their 1995–2019 annual means in 2021, as measured by the number of adult individuals captured per 100 net-hours (annual means calculated without 2004 or 2017; figs. 4, 5). Among residents, three species (43 percent) were above their annual means, whereas only one migrant species (20 percent) was above the annual mean. Of the five focal species with populations below their annual means (42 percent), three were residents and two were migrants. Three species (25 percent) had population sizes in 2021 that were comparable to their 1995–2019 annual means.
Results from linear regression showed significantly decreasing trends for three of the 12 focal species (25 percent). Common Yellowthroat declined by 4.7 percent per year, Song Sparrow declined by 3.5 percent per year, and Yellow-breasted Chat declined by 8.1 percent per year. No significant trend was detected for nine species (75 percent; Bewick’s Wren, California Towhee, House Wren, Spotted Towhee, Wrentit, Ash-throated Flycatcher, Black-headed Grosbeak, Least Bell’s Vireo, and Pacific-slope Flycatcher; models were considered significant if P≤0.10; table 1; figs. 4–6). Of the species in decline, 33 percent were migrants and 67 percent were resident populations (table 1; figs. 4–6).
Table 1.
Results of linear regression analyses to model population trends over time for 12 bird species captured at De Luz Creek, Marine Corps Base Camp Pendleton, California, 1995–2021.[Population estimates accounted for effort. Abbreviations: β, Parameter estimates; SE, standard error; P, p-values; R2, model explaining population trends over time; —, no data; <, less than; ≤, less than or equal to]
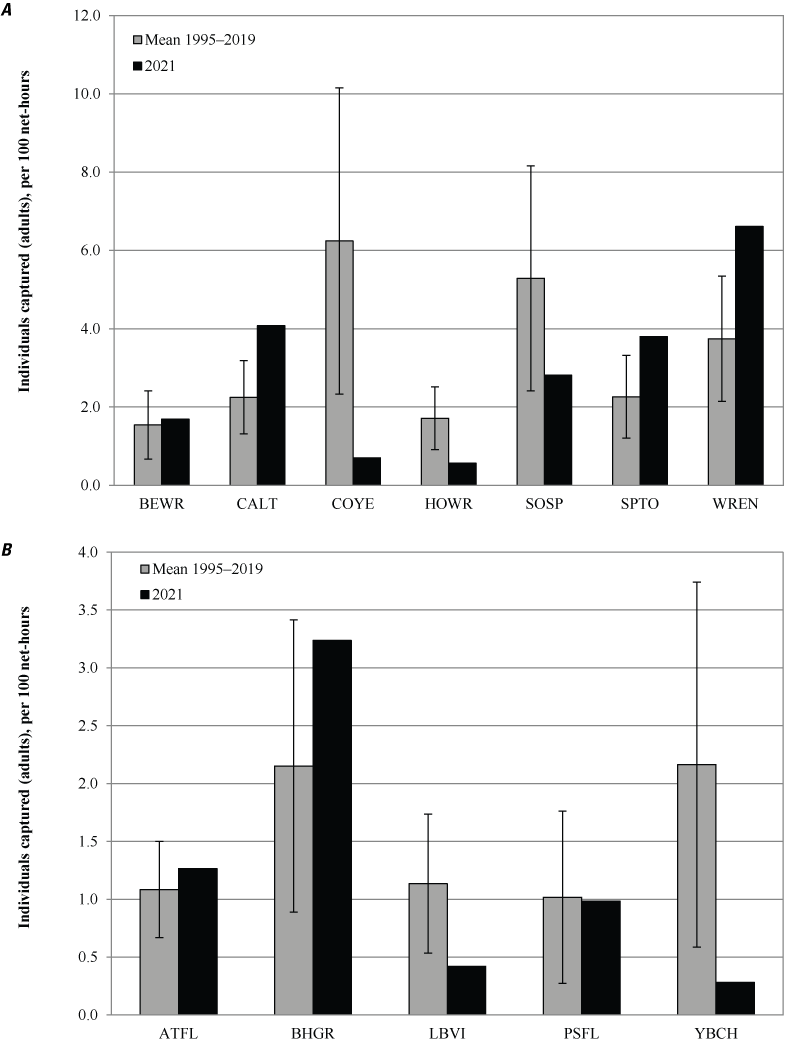
Local adult populations of A, resident species and B, migrant species, adjusted for effort: De Luz Creek, Marine Corps Base Camp Pendleton, California, 1995–2021 (banded birds only; excludes 2017). Error bars represent standard deviations. See appendix 1 (table 1.1) for common and scientific bird names corresponding to four-letter species codes.
Adult population trends of A, resident species and B, migrant species, adjusted for effort: De Luz Creek, Marine Corps Base Camp Pendleton, California, 1995–2021 (banded birds only). Significant (P≤0.10) negative trends are denoted by “−” in the species label. See appendix 1 (table 1.1) for common and scientific bird names corresponding to four-letter species codes. Abbreviation: ≤, less than or equal to.

Linear trendlines for local adult populations of A, resident species and B, migrant species, adjusted for effort at De Luz Creek, Marine Corps Base Camp Pendleton, California, 1995–2021 (banded birds only; excludes 2017). Significant (P≤0.10) negative trends are denoted by “−” in the species label. See appendix 1 (table 1.1) for common and scientific bird names corresponding to four-letter species codes. Abbreviation: ≤, less than or equal to.
Productivity
The observed productivity in 2021 was zero young per adult for residents Song Sparrow and Common Yellowthroat and migrants Black-headed Grosbeak and Least Bell’s Vireo, because no juveniles of these species were captured in 2021 (fig. 7). Winter precipitation had a positive effect on productivity of all focal species at De Luz except Least Bell’s Vireo (tables 2, 3). Total winter precipitation predicted Black-headed Grosbeak and Song Sparrow productivity, and total winter precipitation and late winter precipitation predicted Common Yellowthroat productivity (P<0.10).
Annual productivity of focal species and winter precipitation for the associated bio-year (total winter is October–March, early winter is October–December, and late winter is January–March): De Luz Creek, Marine Corps Base Camp Pendleton, California, 1995–2021. Intervals affected by lack of banding denoted by * and intervals with only migration banding denoted by ** (banded birds only).
Table 2.
Logistic regression models for the effect of precipitation on productivity for four bird species captured at De Luz Creek, Marine Corps Base Camp Pendleton, California, 1995–2021 (excluding 2004 and 2017 because of inconsistency in survey effort).[Models are ranked from best to worst based on Akaike’s Information Criterion for small samples (AICc), difference between AICc of model and AICc of the highest-ranked (top) model (ΔAICc), and Akaike weights (w). AICc is based on −2×loge likelihood (logLik) and the number of parameters (K) in the model. Abbreviation: +, plus]
Table 3.
Results of multiple regression analyses to predict productivity for four bird species captured at De Luz Creek, Marine Corps Base Camp Pendleton, California, 1995–2021 (excluding 2004 and 2017 because of inconsistency in survey effort).[Model-averaged parameter estimates (β), standard error (SE), 95-percent (%) confidence intervals (CI), Z-values (Z), and P-values (P) averaged over all models with ΔAICc<2. Abbreviation: <, less than; ≤, less than or equal to]
Santa Margarita River
Overview of 2021 Captures
From April 6 to August 24, 2021, 832 individuals of 38 species were captured during 798 net-hours (appendix 3, tables 3.1, 3.2; unidentified species not included in species total). The number of individuals captured in 2021 increased by 38 percent from 2020 and was 36 percent higher than the annual mean (±SD) of 610±153 individuals (appendix 3, table 3.1) during years of standard banding operations (1998–2002, 2006–10, 2013–16, 2018, and 2019). Species richness increased to 38 species between 2020 and 2021 and was higher than the annual mean (±SD) of 32±5 species. The station total for all years was at 67 species in 2021.
Overall captures, including recaptures of some individuals, totaled 1,032, which is 42 percent more than in 2020. Of those 1,032 captures, 682 were new individuals banded, 125 were individuals recaptured from previous years (including 3 recaptures that escaped before reading their band numbers and 1 recapture that was originally recorded as a lost band in 2019), and 25 were unbanded individuals (appendix 3, table 3.3). Overall capture rates by date ranged from 0.7 to 2.4 captures per net-hour for an average (±SD) capture rate of 1.4±0.6 per net-hour, 17 percent higher than in 2020 (appendix 3, table 3.2).
Of the species consisting of at least 5 percent of the total number of individuals at Santa Margarita in 2021, Song Sparrow was the most abundant species, with 236 individual captures representing 28 percent of all individuals captured. Common Yellowthroat was the second most abundant species, with 222 individuals representing 27 percent of all individuals. The third most abundant species was Orange-crowned Warbler (77 individuals), and Least Bell’s Vireo (39 individuals) was the fourth most abundant species. Together, these four species consisted of 69 percent of individual captures at Santa Margarita in 2021 (fig. 8; appendix 3, tables 3.1, 3.4).
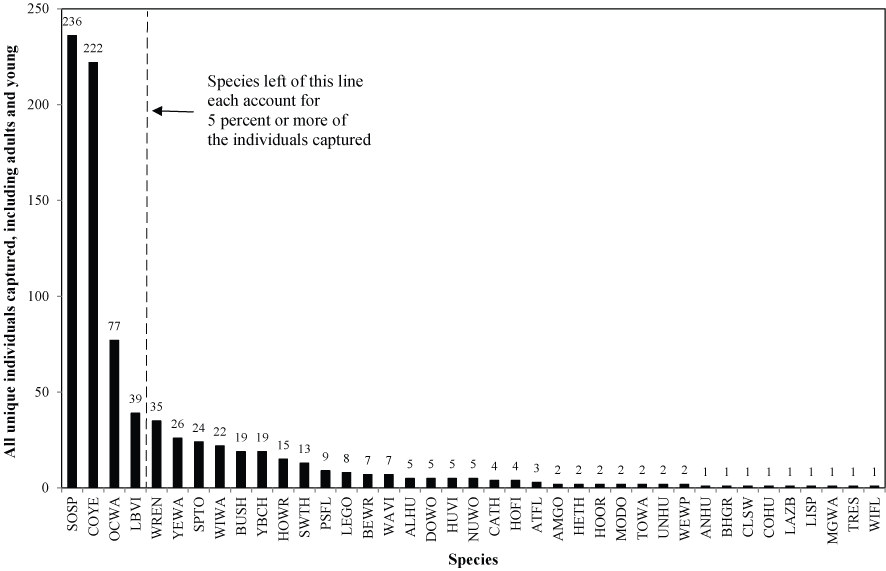
Number of individuals (banded and unbanded) captured per species at Santa Margarita River, Marine Corps Base Camp Pendleton, California, 2021. See appendix 1 (table 1.1) for common and scientific bird names corresponding to four-letter species codes.
The sex ratio of adults of known sex (N=387) was slightly skewed toward males (55:45, M:F; appendix 3, table 3.4). The proportion of juveniles in the known-age population in 2021 was 40 percent, 18 percent above the annual mean (±SD) of 34±14 percent from 1998 to 2020. The juvenile population consisted of 335 individuals of 20 species. Song Sparrow and Common Yellowthroat were by far the most abundant species among juveniles, with 124 and 114 juveniles captured, respectively. These 2 species consisted of 37 percent and 34 percent, respectively, of juveniles captured at the Santa Margarita station.
Of the individual birds captured at the station, 96 percent (802/833) were banded in 2021 or recaptured from previous years. This excludes three recaptures that escaped before reading their band numbers: one Common Yellowthroat originally recorded as a lost band in 2019 from a data loss, and two recaptured juvenile Least Bell’s Vireos that were banded at a nearby nest monitoring survey area at MCBCP as nestlings in 2021 (appendix 3, tables 3.1, 3.3). A total of 25 birds were not banded: 9 were hummingbirds and 2 were game birds. The remaining 14 birds escaped before banding.
Capture rates peaked at 2.4 captures per net-hour in mid-May during MAPS period 2, coinciding with migration at this time of year (appendix 3, table 3.2). Species richness among captures peaked in mid-May, with 23 species (MAPS period 2), also attributable to species migrating through the area at this time of year (appendix 3, table 3.5).
There were 120 birds, 14 percent of all individuals captured (banded and unbanded; 120/832; excludes 3 recaptures that escaped before reading their band numbers and 1 recapture that was originally recorded as a lost band; appendix 3, table 3.3), that were banded in previous years at the Santa Margarita station, slightly below the mean (±SD) annual return rate from 1999 to 2020 of 16±5 percent. Song Sparrow, Common Yellowthroat, and Orange-crowned Warbler together consisted of 78 percent of all recaptures from previous years. The oldest individual recaptured at the Santa Margarita station in 2021 was a Wrentit that was at least 9 years old, originally banded in 2013.
Population Trends
Of the focal species, 38 percent (5/13) had population sizes below their 1998–2020 annual means in 2021, as measured by the number of individuals captured per 100 net-hours (figs. 9, 10). Among residents, two species (29 percent of focal resident species) were below their annual means, and three migrant species (50 percent of focal migrant species) were below their annual means. Of the six species with populations above their annual means (46 percent of all focal species), three were residents and three were migrants. Two species, residents House Wren and Spotted Towhee, had population sizes in 2021 that were comparable to their 1998–2020 annual means.

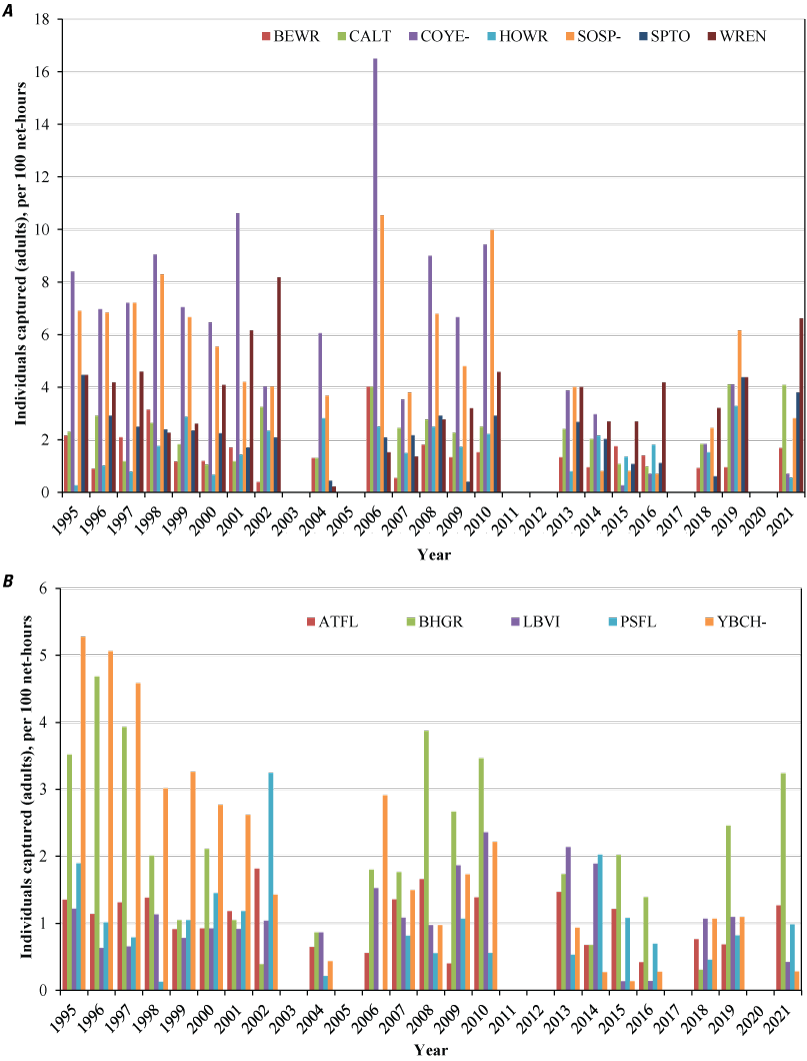
Local adult populations of A, resident species and B, migrant species, adjusted for effort at Santa Margarita River, Marine Corps Base Camp Pendleton, California, 1998–2021 (banded birds only). Error bars represent standard deviations. See appendix 1 (table 1.1) for common and scientific bird names corresponding to four-letter species codes.
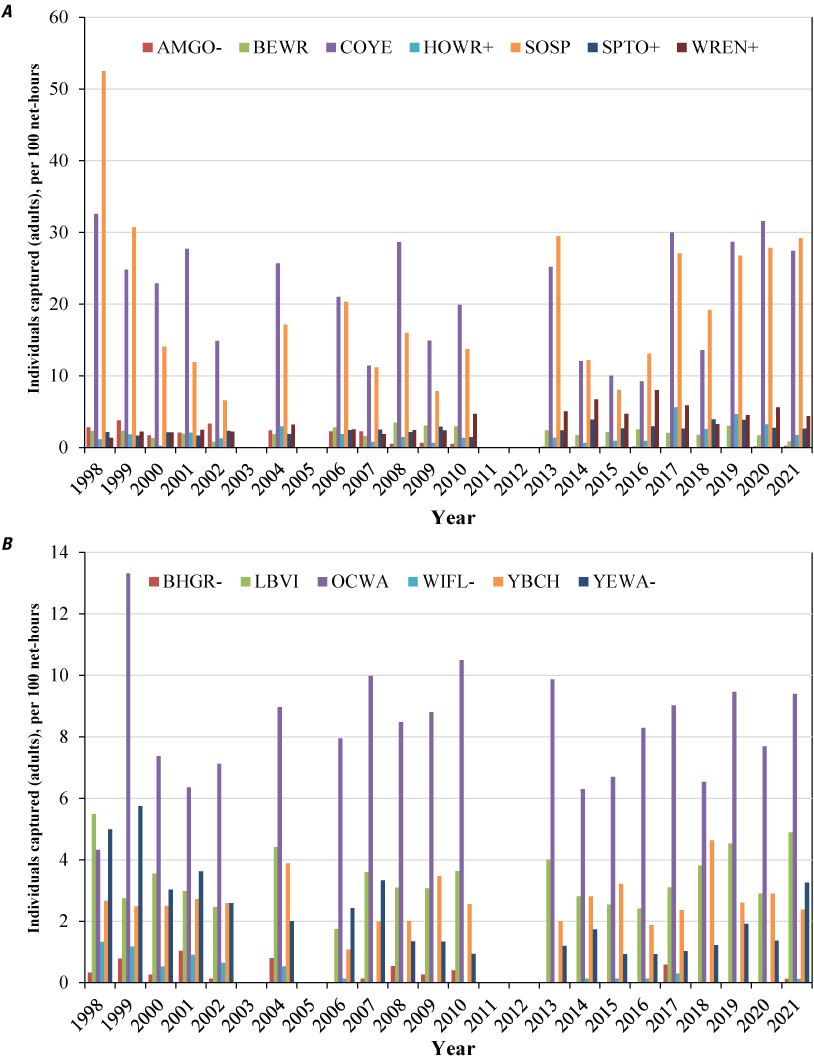
Adult population trends of A, resident species and B, migrant species, adjusted for effort at Santa Margarita River, Marine Corps Base Camp Pendleton, California, 1998–2021 (banded birds only). Significant (P≤0.10) positive trends are denoted by + and negative trends are denoted by “−” in the species label. See appendix 1 (table 1.1) for common and scientific bird names corresponding to four-letter species codes. Abbreviation: ≤, less than or equal to.
Results from linear regression showed significantly decreasing long-term trends for four focal species (31 percent). American Goldfinch declined by 12.7 percent per year, Black-headed Grosbeak declined by 8.9 percent per year, Willow Flycatcher declined by 13.7 percent per year, and Yellow Warbler declined by 5.4 percent per year. Significantly increasing trends were detected for three species (23 percent). House Wren increased by 3.9 percent per year, Spotted Towhee increased by 2.4 percent per year, and Wrentit increased by 4.8 percent per year. No significant trend was detected for six species (46 percent; Bewick’s Wren, Common Yellowthroat, Song Sparrow, Least Bell’s Vireo, Orange-crowned Warbler, and Yellow-breasted Chat; models were considered significant if P≤0.10; table 4; figs. 9–11). Of the species in decline, 75 percent (3/4) were migrants and 25 percent (1/4) were resident species.
Table 4.
Results of linear regression analyses to model population trends over time for 13 bird species captured at Santa Margarita River, Marine Corps Base Camp Pendleton, California, 1998–2021.[Population estimates accounted for effort. Abbreviations: β, Parameter estimates; SE, standard error; P, p-values; R2, model explaining population trends over time; —, no data; <, less than; ≤, less than or equal to]
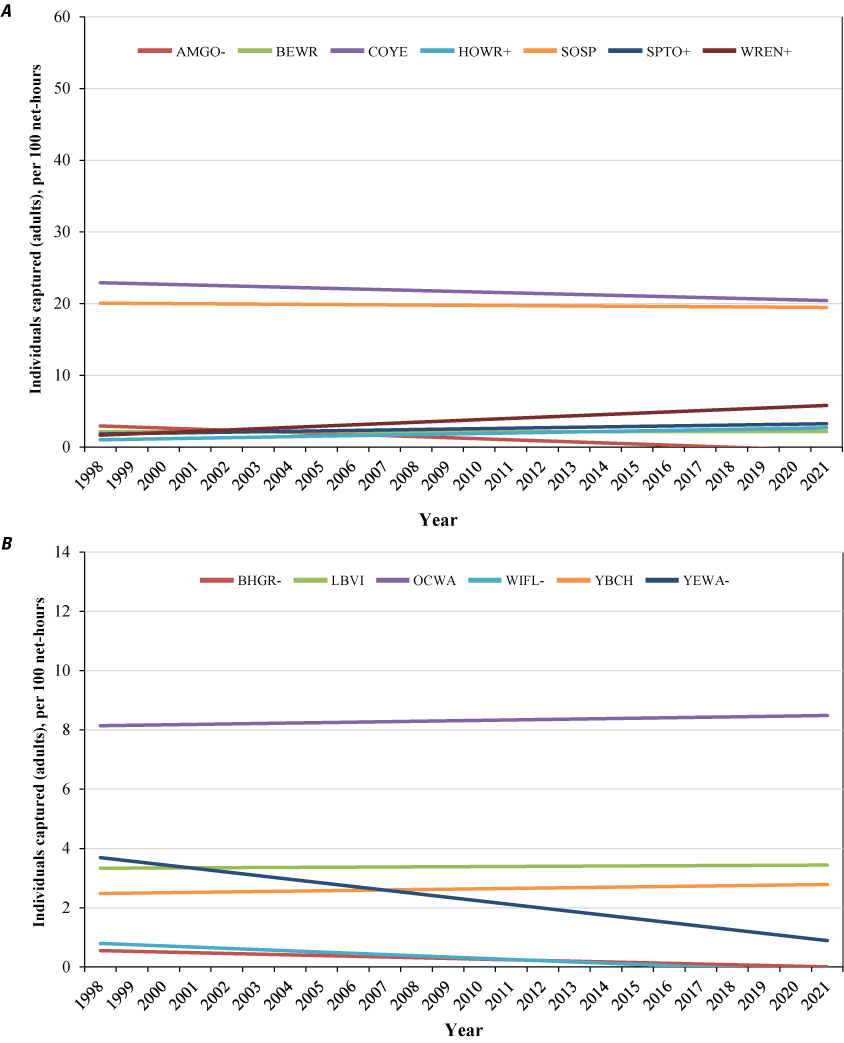
Linear trendlines for local adult populations of A, resident species and B, migrant species, adjusted for effort at Santa Margarita River, Marine Corps Base Camp Pendleton, California, 1998–2021 (banded birds only). Significant (P≤0.10) positive trends are denoted by + and negative trends are denoted by “−” in the species label. See appendix 1 (table 1.1) for common and scientific bird names corresponding to four-letter species codes. Abbreviation: ≤, less than or equal to.
Productivity
The observed productivity in 2021 increased relative to 2020 for all resident and one migrant focal species but decreased for the other three migrant focal species (fig. 12). Resident Common Yellowthroat productivity increased to 1.1 young per adult, 11 percent higher than the annual mean (±SD) of 1.0±0.9; resident Song Sparrow productivity increased to 1.1 young per adult, 2 percent higher than the annual mean of 1.1±1.1. Productivity of migrant Orange-crowned Warbler remained at 0.4 young per adult equal to the annual mean of 0.4±0.3. Migrant Yellow-breasted Chat productivity remained at 0.1 young per adult, 81 percent lower than the annual mean of 0.3±0.5. Productivity increased to 0.2 young per adult for migrant Yellow Warbler, 100 percent higher than the annual mean of 0.1±0.1. Migrant Least Bell’s Vireo productivity decreased to 0.6 young per adult but was 40 percent higher than the annual mean of 0.4±0.3.
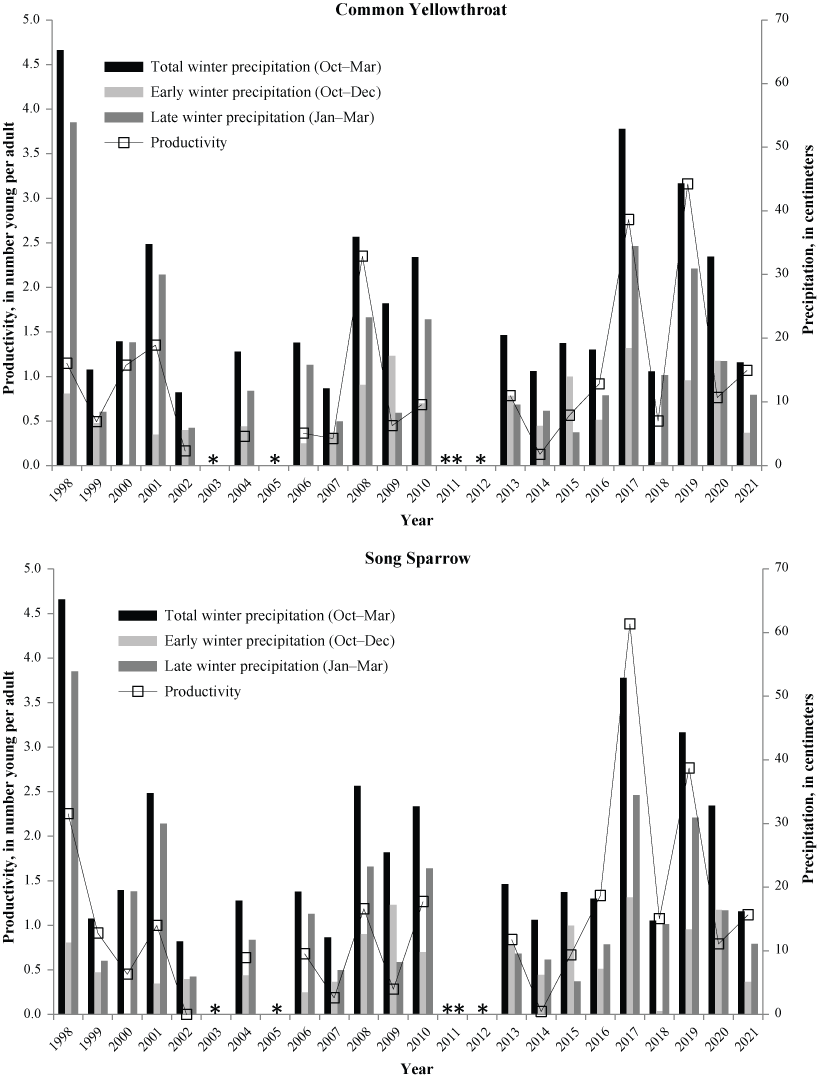
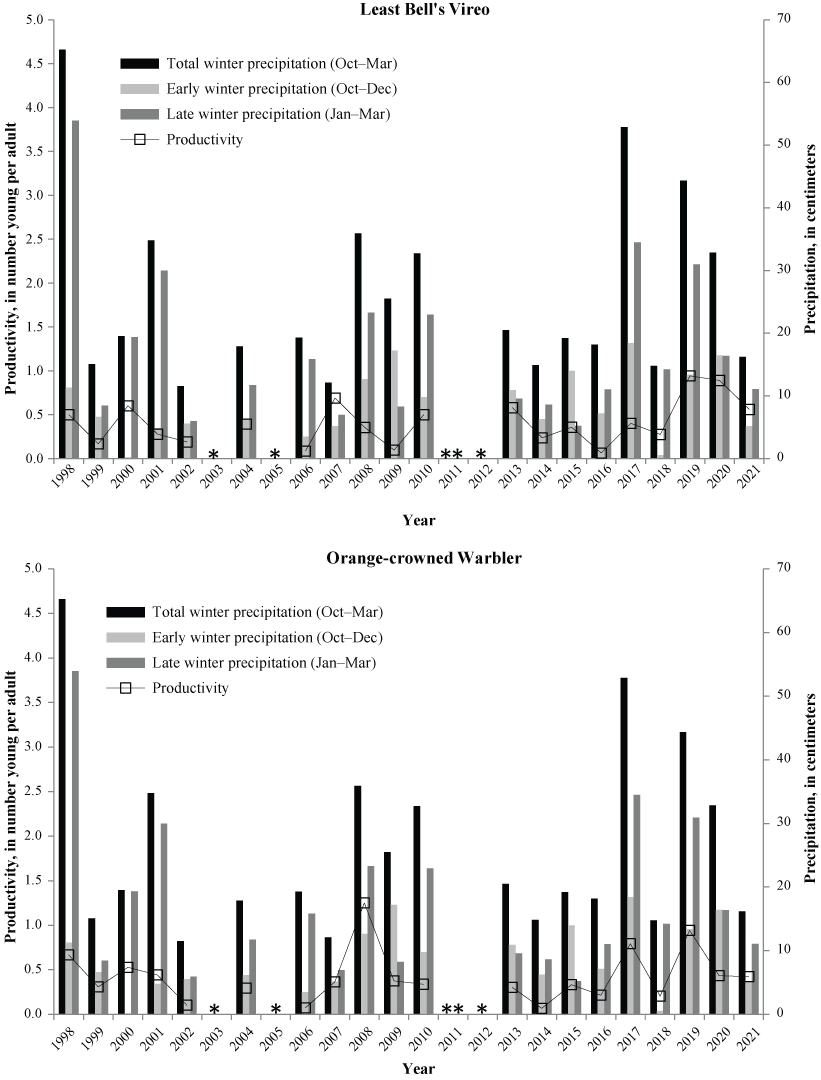
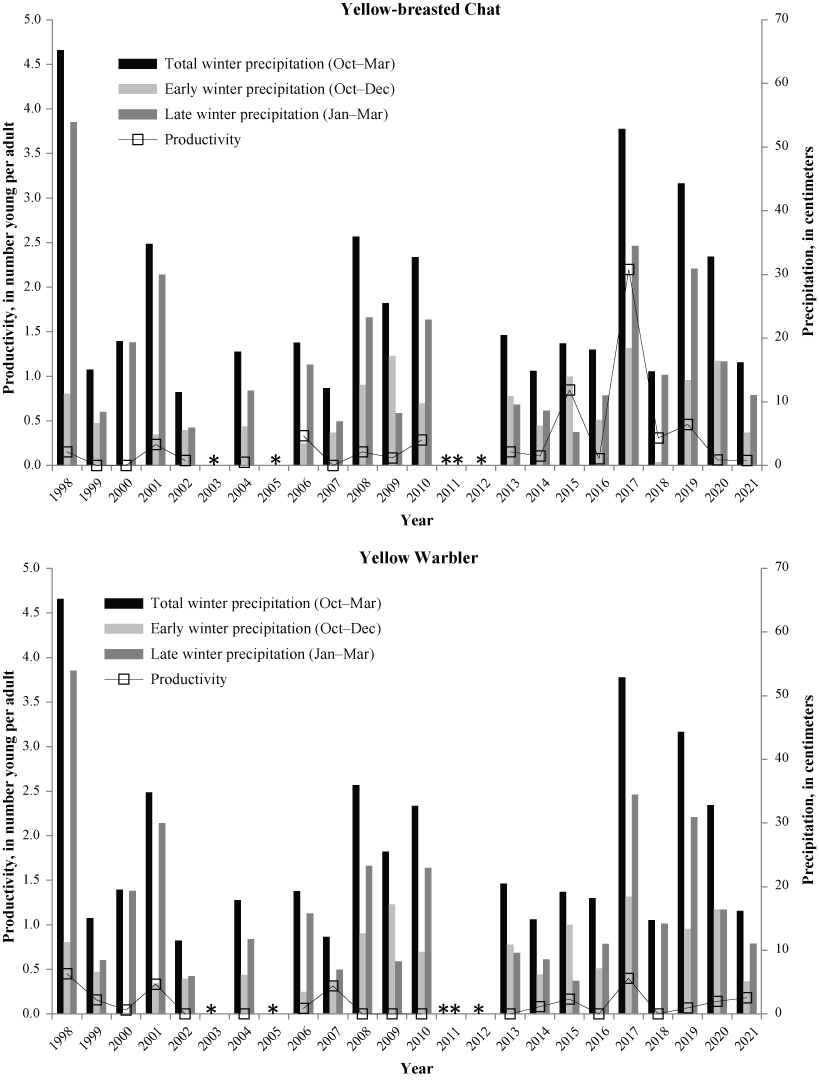
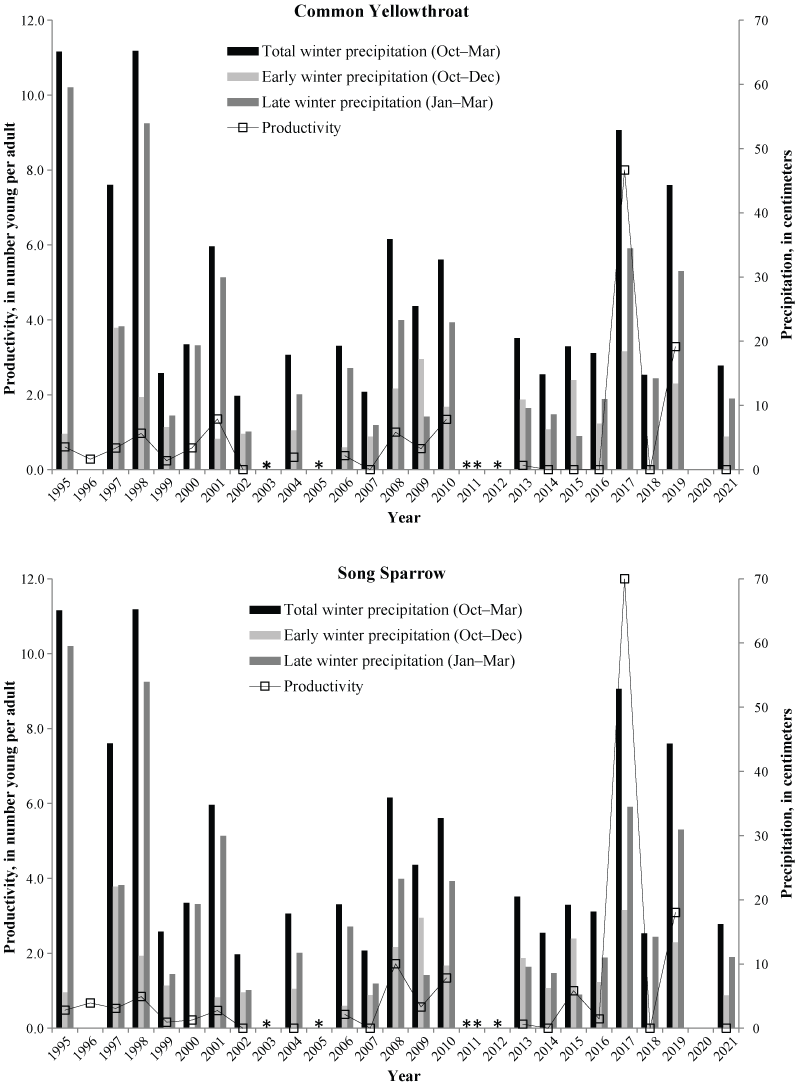
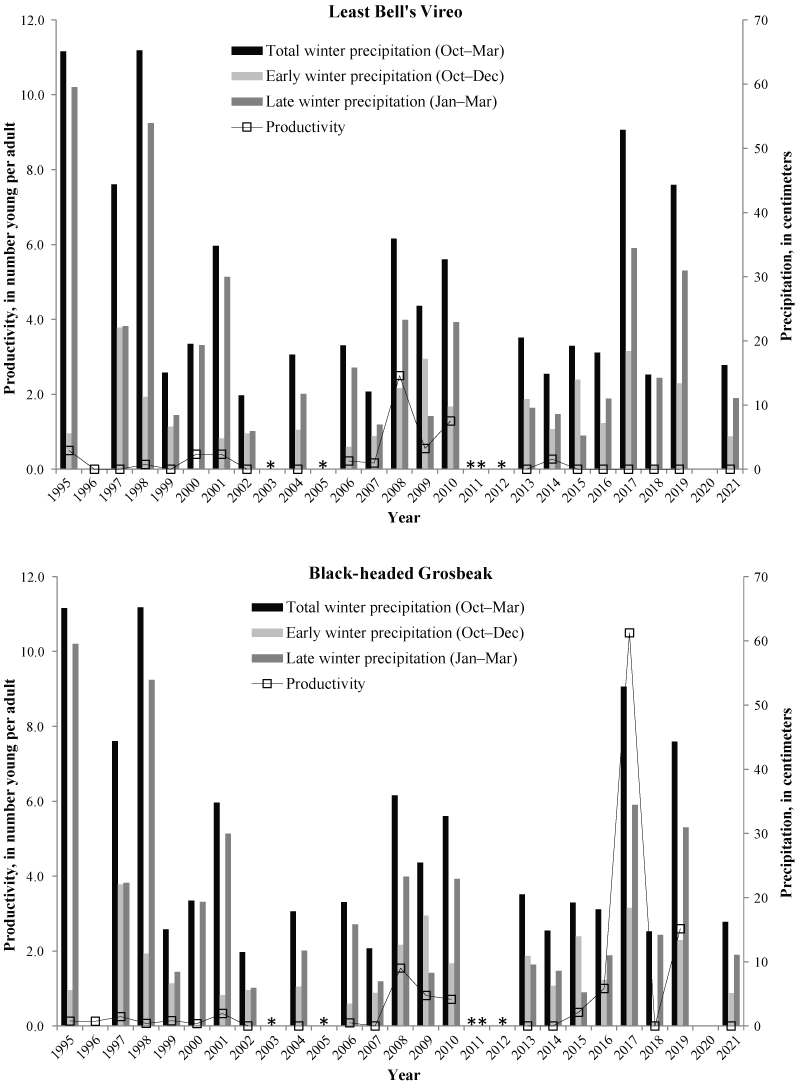
Annual productivity of focal species and winter precipitation for the associated bio-year (total winter is October–March, early winter is October–December, and late winter is January–March) at Santa Margarita River, Marine Corps Base Camp Pendleton, California, 1998–2021. Intervals affected by lack of banding denoted by * and intervals with only migration banding denoted by ** (banded birds only).
Winter precipitation had a positive effect on the productivity of all focal species at the Santa Margarita station except Least Bell’s Vireo (tables 5, 6). Song Sparrow, Orange-crowned Warbler, Yellow-breasted Chat, and Yellow Warbler productivity was predicted by total winter precipitation (Song Sparrow, Orange-crowned Warbler, and Yellow-breasted Chat: P<0.10; Yellow Warbler: P=0.10). Common Yellowthroat productivity was predicted by total, early, and late winter precipitation (P<0.01).
Table 5.
Logistic regression models for the effect of precipitation on productivity for six bird species captured at Santa Margarita River, Marine Corps Base Camp Pendleton, California, 1998–2021.[Models are ranked from best to worst based on Akaike’s Information Criterion for small samples (AICc), difference between AICc of model and AICc of the highest-ranked (top) model (ΔAICc), and Akaike weights (w). AICc is based on −2×loge likelihood (logLik) and the number of parameters (K) in the model. Abbreviations: +, plus; ≤, less than or equal to]
Table 6.
Results of multiple regression analyses to predict productivity for six bird species captured at Santa Margarita River, Marine Corps Base Camp Pendleton, California, 1998–2021.[Model-averaged parameter estimates (β), standard error (SE), 95-percent (%) confidence intervals (CI), Z-values (Z), and P-values (P) averaged over all models with ΔAICc<2. Abbreviations: <, less than; ≤, less than or equal to]
Survival
Top models of adult survival were different among focal species (table 7). The top models for resident Common Yellowthroat included sex and a weak effect of total winter precipitation. Survival estimates were higher for males than females and increased with increasing total winter precipitation. Although the top models for resident Song Sparrow included early winter precipitation and early winter plus late winter precipitation, examination of 95-percent confidence intervals of the beta estimates indicated that early winter precipitation was the stronger driver of Song Sparrow survival, which increased with increased early winter precipitation. The top predictor for migrants Least Bell’s Vireo, Orange-crowned Warbler, and Yellow-breasted Chat survival was sex, where survival estimates were higher for males than for females. Yellow Warbler survival was best modelled as constant. Models with winter precipitation and sex were within 2 units of AICc but were not parsimonious, and these variables were not found to be significant contributors to the models based on an examination of the 95 percent confidence intervals of the beta estimates.
Table 7.
Logistic regression models for the effect of year on survival for two resident and four migrant bird species captured at Santa Margarita, Marine Corps Base Camp Pendleton, California, 1998–2021.[Models are ranked from best to worst based on Akaike’s Information Criterion for small samples (AICc), difference between AICc of model and AICc of the highest-ranked (top) model (ΔAICc), and Akaike weights (w). AICc is based on −2×loge likelihood and the number of parameters (K) in the model. Abbreviation: +, plus]
Model averaged annual adult survival ranged from 42 to 66 percent for residents and from 30 to 66 percent for migrants at Santa Margarita (fig. 13). Mean model averaged annual survival from 1998 to 2021 was higher for males than females in all focal species except Yellow Warbler, where survival (±SD) did not differ between the sexes (Common Yellowthroat: female 43±2 percent, male 47±2 percent; Song Sparrow: female 55±6 percent, male 56±6 percent; Yellow-breasted Chat: female 31±0.4 percent, male 48±0.4 percent; Least Bell’s Vireo: female 41±0.05 percent, male 66±0.05 percent; Orange-crowned Warbler: female 42±1 percent, male 57±1 percent; and Yellow Warbler: female 34±1 percent, male 34±1 percent).
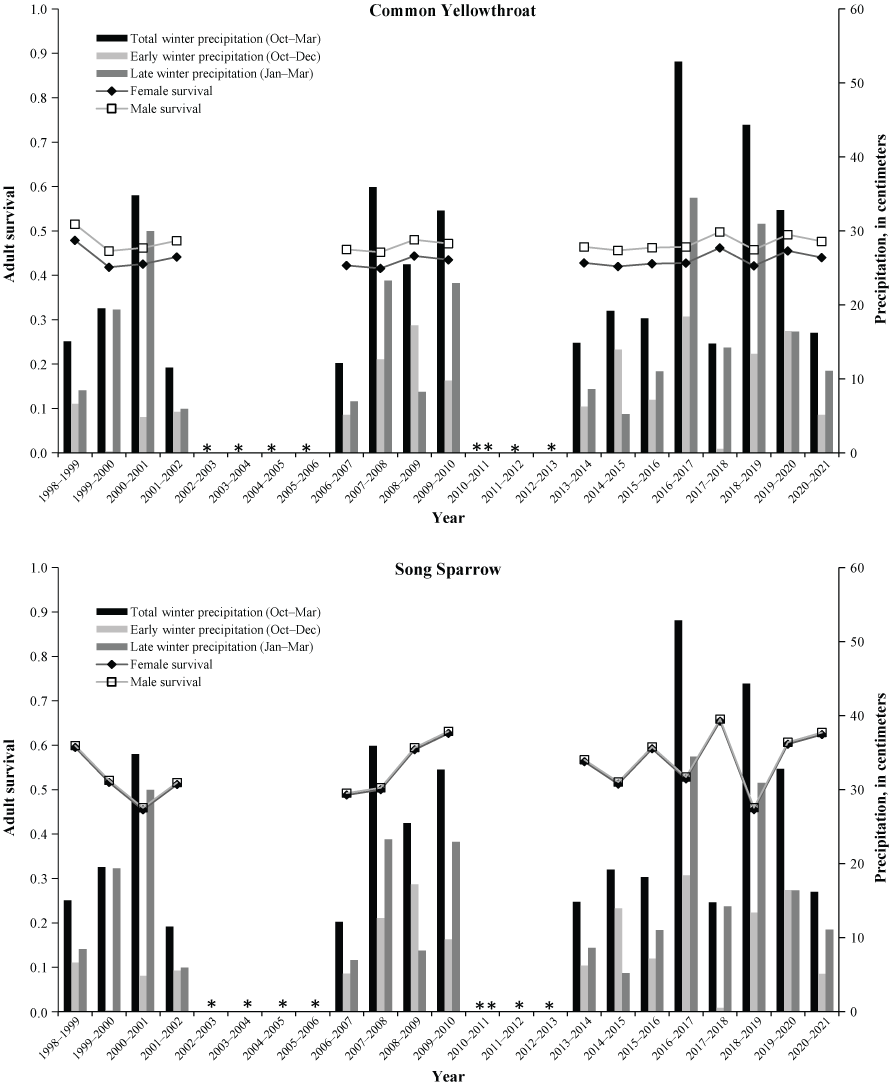
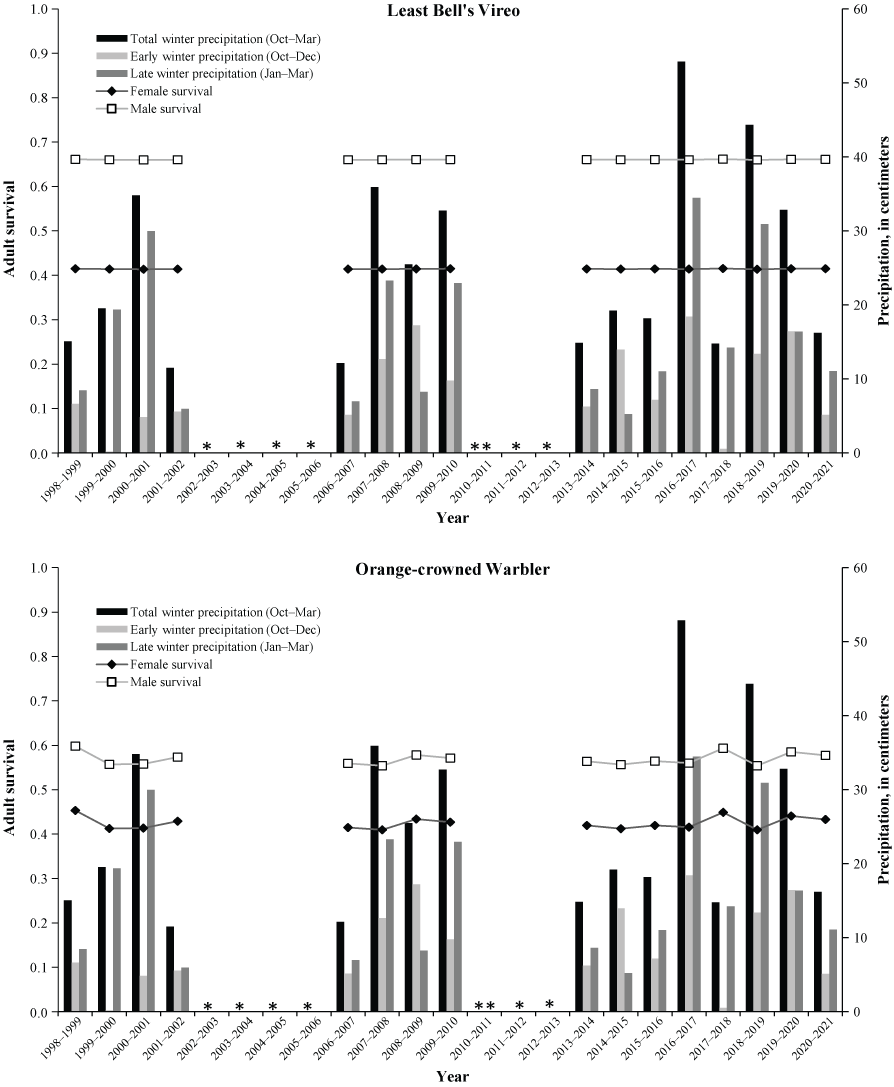

Model averaged annual adult survival (table 7) of focal species by sex (male versus female) and winter precipitation for the associated bio-year (total winter is October–March, early winter is October–December, and late winter is January–March) at Santa Margarita River, Marine Corps Base Camp Pendleton, California, 1998–2021. Intervals affected by lack of banding denoted by * and intervals with only migration banding denoted by **.
Predictors of Population Size
Adult population size in the previous year was a significant predictor for Yellow Warbler population size (R2=0.61, P<0.10; table 8). Adult survival from the previous year was a significant predictor of population size for Song Sparrow and Orange-crowned Warbler (Song Sparrow: R2 = 0.66; P<0.10; Orange-crowned Warbler: R2=0.58, P<0.10). Productivity from the previous year was a significant predictor of Yellow-breasted Chat population size (R2=0.67; P<0.10). However, neither adult survival, productivity, nor adult population size from the previous year were significant predictors of Common Yellowthroat or Least Bell’s Vireo population size (Common Yellowthroat: R2=0.38; P>0.10; Least Bell’s Vireo: R2=0.15, P>0.10).
Table 8.
Results of multiple regression analyses to predict population size for six bird species captured at Santa Margarita River, Marine Corps Base Camp Pendleton, California, 1998–2021.[Population estimates accounted for effort. Abbreviations: β, Parameter estimates; SE, standard error; P, p-values; R2, model explaining population trends over time; —, no data; ≤, less than or equal to]
Discussion
Species richness and the number of individual captures at both MAPS stations at MCBCP were above the annual means in 2021. The peak in captures and species richness at both stations in 2021 was in early to mid-May and coincided with migration. One additional peak was observed at De Luz in mid-July, also coinciding with migration.
Return rate was 48 percent lower than the 20-year mean at De Luz and 11 percent lower but approaching the 18-year mean at the Santa Margarita station. The low return rate of birds to De Luz could be a result of a gradual decline in habitat quality at the station; a habitat quality decline is suggested by anecdotal evidence. De Luz Creek is drier than the Santa Margarita River and crews have observed a decline in water flow (R. Pottinger, U.S. Geological Survey, oral commun., 2018). Furthermore, a fire burned most of the station in 2004. A nearby 5-year study (B. Kus, U.S. Geological Survey, unpub. data, 2019) of post-fire recovery found that habitat at that site may have converted to a different habitat type that doesn’t provide suitable resources for reproduction for some species, which is possibly what happened at De Luz. Slow habitat recovery may have been compounded by extended drought (2011–18; Vose and others, 2014) and flooding at the site in 2017 and 2019.
The proportion of juveniles in the 2021 populations was 21 percent lower than the annual mean at De Luz but was 17 percent higher than the annual mean at Santa Margarita. Reproductive success at De Luz was likely affected by the decline in habitat. Furthermore, the winter of 2020–21 was relatively dry, with total winter precipitation 50 percent lower than the 1995–2020 mean (±SD; 32.5±19.0 centimeters [cm]) and was the sixth driest winter of the study. The combination of habitat degradation and dry vegetation could increase exposure of nests and result in increased nest predation at De Luz. The habitat at Santa Margarita is denser and more mesic and was likely not affected as severely by the dry winter.
Comparable to the 2018 and 2019 seasons, the proportion of hummingbirds among all birds captured at De Luz was high; 75 percent of all juveniles captured, and 21 percent of all individuals captured were hummingbird species, including Anna’s Hummingbird, Costa’s Hummingbird, Allen’s Hummingbird, and Rufous Hummingbird (Selasphorus rufus), which was 197 percent above the 1995–2019 mean of 7 percent of all individuals captured. As in 2019, the proportion of orioles (Hooded Oriole [Icterus cucullatus] and Bullock’s Oriole) was also high, at 194 percent above the 1995–2019 mean of 2 percent. An increase in exotic tree tobacco (Nicotiana glauca) was observed in the creek bed and may have contributed to the increase in nectarivores (hummingbird species and orioles) at De Luz, which forage on the plant’s tubular yellow flowers.
Although half of focal species populations were above their annual means in 2021, several populations may be in decline at MCBCP. We found 25 percent of focal species (3/12) at De Luz (Common Yellowthroat, Song Sparrow, and Yellow-breasted Chat) and 31 percent (4/13) of focal species at Santa Margarita (American Goldfinch, Black-headed Grosbeak, Willow Flycatcher, and Yellow Warbler) to be showing significantly declining trends during the period of this study (De Luz: 1995–2021; Santa Margarita: 1998–2021). We compared population trends of focal species on MCBCP to trends from the North American Breeding Bird Survey at different scales: in the United States and Canada, in the state of California, and in the California coast bird conservation region (an ecologically distinct bird conservation region [Sauer and others, 2020]) to evaluate the extent to which trends on Base matched those at larger spatial scales or appeared to be localized effects.
Consistent with their trends range wide in the United States, Willow Flycatcher, Yellow Warbler, and American Goldfinch are in decline on MCBCP. Willow Flycatcher and American Goldfinch are in decline range wide in the United States, but stable throughout California and the California coast bird conservation region, indicating the decline at the Santa Margarita station is a local effect. However, Willow Flycatchers were always rare at the station and mainly pass through on migration. The local American Goldfinch trend could be caused by the establishment of noxious, invasive plants at Santa Margarita. Giant reed (Arundo donax), black mustard (Brassica nigra), and poison hemlock (Conium maculatum) reduce habitat suitability for native species by outcompeting native plants for water, producing allelopathic chemicals, and overshading, preventing germination of native plants. These invasive species may be eliminating native seed-producing plants the American Goldfinch is dependent upon on Base, driving them to find food elsewhere. Although invasive species removal has been completed west of the Santa Margarita station, none has been done at the station and where the restoration has taken place, native vegetation struggles to fill in the gaps, possibly resulting from long-term drought. Yellow Warbler is in decline range wide in the United States and the California coast bird conservation region but stable throughout California, indicating the decline at the Santa Margarita station is not a local effect. Yellow-breasted Chat is in decline range wide and at De Luz on MCBCP but is stable at the Santa Margarita station, in California, and the California coast bird conservation region, indicating the decline at De Luz is localized. The habitat has declined at De Luz; in particular, wild grape (Vitis spp.) cover in areas previously inhabited by Yellow-breasted Chat has been reduced. Black-headed Grosbeak is in decline throughout the California coast bird conservation region and at the Santa Margarita station on MCBCP. Barring 2017 and 2021, when four individuals and one individual were captured, respectively, no Black-headed Grosbeak had been captured at Santa Margarita since 2010, and capture rate of Black-headed Grosbeak at the station has always been low (mean [±SD] adults captured per year: 2±2 adults). Song Sparrow is declining range wide in the United States and at De Luz. However, the trends in California, the California coast bird conservation region, and at the Santa Margarita are stable, indicating the decline at De Luz is a local effect. Common Yellowthroat also is declining range wide in the United States and at De Luz, but it is increasing in California and in the California coast bird conservation region and is stable at the Santa Margarita station, indicating the decline at De Luz also is a local effect. Declines of residents Common Yellowthroat and Song Sparrow at De Luz may be explained by anecdotal observations of loss of understory.
Of the focal species and resident species, 23 percent (3/13) of at Santa Margarita had significantly increasing population trends (House Wren, Spotted Towhee, and Wrentit). House Wren is increasing range wide in the United States, whereas Spotted Towhee and Wrentit are declining range wide, in California, and (for the Spotted Towhee) in the California coast bird conservation area. These three species are stable at De Luz, indicating that increases in Spotted Towhee and Wrentit are localized at the Santa Margarita.
We captured no juveniles of focal species at De Luz in 2021. In contrast, productivity at Santa Margarita was higher than the annual means for all focal species except Yellow-breasted Chat. Several studies have found that winter precipitation is an important predictor of productivity (Nott and others, 2002; Bolger and others, 2005; DeSante and others, 2005; Zarzycki, 2017). We found that total winter precipitation increased productivity of all focal species except Least Bell’s Vireos at both MCBCP stations. Lack of precipitation, combined with a decline in habitat quality, may be resulting in a combined negative effect on productivity of focal species at De Luz. Increased precipitation results in increased plant (Birtwistle, 2015) and arthropod abundance (Bolger and others, 2005), which increases fledging success and adult survival (Bolger and others, 2005). Results indicate that the relationship may be further affected by the timing of winter precipitation (for example, if it occurs early or late in the season). Productivity of Black-headed Grosbeak and Song Sparrow at De Luz was predicted by early winter precipitation. Except for the Common Yellowthroat, which is strictly insectivorous, these species are all insectivores that also eat fruits when they are available. Increased precipitation in the early winter may jump-start primary productivity, increasing availability of fruits during important breeding activities for these species. Productivity of Common Yellowthroat was predicted by late winter precipitation at both stations. This is likely an effect of arthropod abundance boosting food availability during their breeding activities.
Survival was highly variable among focal species and years at MCBCP. Winter precipitation has been found to be an important predictor of survival in species such as Wrentits, warblers, Swainson’s Thrush (Catharus ustulatus), Spotted Towhee, California Towhee, and Rufous-Crowned Sparrow (Aimophila ruficeps; Sillett and Holmes, 2002; Bolger and others, 2005; LaManna and others, 2012; Rockwell and others, 2017). There is a gap in our understanding of survival of focal species at De Luz for 2021 because the station was not operated in 2020, but we found that winter precipitation affected survival of some but not all species at Santa Margarita. A model based on total winter precipitation was among the best supported models of survival of resident Common Yellowthroat, whereas two models (one based on early precipitation, and the other based on a combination of two precipitation variables, early plus late precipitation) were the best supported models for resident Song Sparrow survival. Sex was the top predictor of survival for Common Yellowthroat, Least Bell’s Vireo, Orange-crowned Warbler, and Yellow-breasted Chat, where females had lower probability of survival than males. More research is needed to determine drivers of survival for our focal species. Several studies have found that precipitation during migration drives the survival of migrant species (Sillett and Holmes, 2002; LaManna and others, 2012; Rockwell and others, 2017; Zarzycki, 2017; Saracco and Rubenstein, 2020). Future studies could examine the effects of precipitation on migratory stop-over and wintering grounds of species that breed at MCBCP (Mexico, Central America, and South America). Access to updated local temperature and El Niño/Southern Oscillation data would be useful to inform the interactions between local precipitation and temperature on local avian populations as well.
We investigated previous-year adult population size, survival, and productivity as predictors of adult population size for focal species at Santa Margarita in the survey year. Population size of four of the six bird species was positively associated with either population size the previous year (Song Sparrow and Yellow Warbler), breeding productivity the previous year (Yellow-breasted Chat), or adult survival from the previous year (Orange-crowned Warbler). These population models would also benefit from the inclusion of winter temperature data on MCBCP for resident species and on wintering grounds for migrants. Woodworth and others (2017) found that temperature on the wintering grounds limited population growth for Savannah Sparrows (Passerculus sandwichensis) by limiting survival.
Conclusions
The Monitoring Avian Productivity and Survivorship (MAPS) Program provides insight into important questions regarding avian population trends by examining key demographic parameters. This year’s research detected population declines in multiple species on Marine Corps Base Camp Pendleton (MCBCP or Base), and a plummet in productivity at De Luz Creek, potentially driven by habitat changes. With continued MAPS station operations on Base, the following actions could improve our understanding of the factors driving these declines:
-
1. Investigate the ongoing declines at De Luz relative to possible vegetation change resulting from heavy precipitation, drought, floods, and fire.
-
a. Changes in vegetation over time can be analyzed using measurements from the Landsat Normalized Difference Vegetation Index (NDVI), which is used to quantify vegetation greenness and understand changes in plant health.
-
b. Over time, NDVI values can be used to analyze the response of vegetation to precipitation, drought, flooding, and fire relative to demographic parameters of our focal species (Birtwistle, 2015).
-
-
2. Evaluate the relationship between weather variables, nesting initiation, and resulting demographic consequences for avian species that breed at Camp Pendleton.
-
3. Investigate range-wide population declines of Yellow Warbler relative to conditions on overwintering and stopover sites, such as weather patterns and habitat alteration.
-
4. Perform periodic syntheses of multi-year periods to better grasp big-picture trends occurring with breeding birds on Base.
The MAPS Program on Base also contributes to our understanding of emerging new threats to riparian birds; for example, the invasive Kuroshio Shot Hole Borer (Euwallacea Kuroshio; KSHB) has caused massive and widespread loss of riparian habitat in the Tijuana River and has been detected in multiple other rivers in San Diego County. Although the KSHB hasn’t yet been detected on Base, the MAPS stations on Base provide an invaluable reference point to understand the effects of KSHB on riparian habitat and associated birds at infested sites.
Continued research through the MAPS Program is a valuable way to support the Base’s commitment to environmental stewardship. The two stations on MCBCP are two of the longest operating MAPS stations in the nation, with nearly concurrent operation at De Luz since 1995 and at Santa Margarita since 1998. Decades of MAPS Program monitoring on Base provided the data needed to analyze the effects of precipitation, and fire on local bird populations. The knowledge gained by the MAPS Program’s continent-wide, collaborative avian monitoring effort helps to maximize the return on Marine Corps investment in environmental compliance and conservation by enhancing the effectiveness of conservation efforts and providing the data to analyze that effectiveness.
References Cited
Barton, K., 2020, MuMIn—Multi-model inference—R package version 1.43.17: Vienna, Austria, The Comprehensive R Archive Network (CRAN), accessed February 1, 2024, at https://cran.r-project.org/web/packages/MuMIn/MuMIn.pdf.
Bolger, D.T., Patten, M.A., and Bostock, D.C., 2005, Avian reproductive failure in response to an extreme climatic event: Oecologia, v. 142, no. 3, p. 398–406, accessed February 1, 2024, at https://doi.org/10.1007/s00442-004-1734-9.
DeSante, D.F., Burton, K.M., Kaschube, D.R., Velez, P., Froehlich, D., and Albert, S., 2021, MAPS manual—2021 protocol: Petaluma, Calif., The Institute for Bird Populations, 90 p., accessed February 1, 2024, at https://www.birdpop.org/docs/misc/MAPSManual21.pdf.
DeSante, D.F., Nott, M.P., and Kaschube, D.R., 2005, Monitoring, modeling, and management—Why base avian management on vital rates and how should it be done?, in Ralph, J.C., and Rich, T.D., eds., Bird conservation implementation and integration in the Americas—Proceedings of the Third International Partners in Flight Conference, Asilomar, Calif., March 20–24, 2002: Albany, Calif., v. 1 and 2, U.S. Department of Agriculture, Forest Service, Pacific Southwest Research Station, General Technical Report PSW-GTR-191, p. 795–804, accessed February 1, 2024, at https://www.fs.usda.gov/research/treesearch/32069.
Froehlich, D., Michel, N., DeSante, D.F., and Velez, P., 2006, MAPSPROG version 4.1 user’s guide and manual: Point Reyes Station, Calif., The Institute for Bird Populations, 172 p., accessed February 1, 2024, at https://www.birdpop.org/docs/misc/MAPSPROG-Manual.pdf.
Kus, B.E., and Beck, P.P., 1997, Neotropical migratory bird monitoring study at Marine Corps Base Camp Pendleton, California—Third annual progress report, 1997—Prepared for the U.S. Marine Corps, Environmental and Natural Resources Office: Camp Pendleton, Calif., U.S. Geological Survey Report, 29 p.
Kus, B.E., and Beck, P.P., 1999, Neotropical migratory bird monitoring study at Marine Corps Base Camp Pendleton, California—Fourth annual progress report, 1998—Prepared for the U.S. Marine Corps, Environmental and Natural Resources Office: Camp Pendleton, Calif., U.S. Geological Survey Report, 45 p.
Kus, B.E., and Beck, P.P., 2001, Neotropical migratory bird monitoring study at Marine Corps Base Camp Pendleton, California—Case Springs Station, 1995–1999—Prepared for AC/S Environmental Security, Marine Corps Base Camp Pendleton, California: Camp Pendleton, Calif., Marine Corps Base Camp Pendleton, U.S. Geological Survey Report.
Laake, J.L., 2013, RMark—An R interface for analysis of capture-recapture data with MARK: Seattle, Wash., Alaska Fisheries Science Center Processed Rep 2013–01, National Oceanic and Atmospheric Administration, National Maritime Fisheries Service, 25 p., accessed February 1, 2024, at https://repository.library.noaa.gov/view/noaa/4372.
LaManna, J.A., George, T.L., Saracco, J.F., Nott, M.P., and DeSante, D.F., 2012, El Niño—Southern Oscillation influences annual survival of a migratory songbird at a regional scale: The Auk, v. 129, no. 4, p. 734–743, accessed February 1, 2024, at https://doi.org/10.1525/auk.2012.12017.
Nott, M.P., and Michel, N., 2005, Management strategies for reversing declines in landbirds of conservation concern on military installations—Predictive modeling of landbird populations on military installations: Point Reyes Station, Calif., Institute for Bird Populations, accessed February 1, 2024, at https://doi.org/10.21236/ADA541508.
Nott, M.P., Desante, D.F., Siegel, R.B., and Pyle, P., 2002, Influences of the El Niño/Southern Oscillation and the North Atlantic Oscillation on avian productivity in forests of the Pacific Northwest of North America: Global Ecology and Biogeography, v. 11, no. 4, p. 333–342, accessed February 1, 2024, at https://doi.org/10.1046/j.1466-822X.2002.00296.x.
R Core Team, 2021, R—A language and environment for statistical computing: Vienna, Austria, R Foundation for Statistical Computing, accessed September 24, 2021, at https://www.R-project.org/.
Rockwell, S.M., Wunderle, J.M., Jr., Sillett, T.S., Bocetti, C.I., Ewert, D.N., Currie, D., White, J.D., and Marra, P.P., 2017, Seasonal survival estimation for a long-distance migratory bird and the influence of winter precipitation: Oecologia, v. 183, no. 3, p. 715–726, accessed February 1, 2024, at https://doi.org/10.1007/s00442-016-3788-x.
Saracco, J.F., and Rubenstein, M., 2020, Integrating broad‐scale data to assess demographic and climatic contributions to population change in a declining songbird: Ecology and Evolution, v. 10, no. 4, p. 1804–1816, accessed February 1, 2024, at https://doi.org/10.1002/ece3.5975.
Sauer, J.R., Link, W.A., and Hines, J.E., 2020, The North American Breeding Bird Survey, analysis results 1966–2019: U.S. Geological Survey data release, accessed February 28, 2023, at https://doi.org/10.5066/P96A7675.
Sillett, T.S., and Holmes, R.T., 2002, Variation in survivorship of a migratory songbird throughout its annual cycle: Journal of Animal Ecology, v. 71, no. 2, p. 296–308, accessed February 1, 2024, at https://doi.org/10.1046/j.1365-2656.2002.00599.x.
Vose, R.S., Applequist, S., Squires, M., Durre, I., Menne, M.J., Williams, C.N., Jr., Fenimore, C., Gleason, K., and Arndt, D., 2014, NOAA Monthly U.S. Climate Divisional Database (NClimDiv)—Gridded Climate Divisional Dataset (CLIMDIV): National Oceanic and Atmospheric Administration, National Climatic Data Center, accessed October 11, 2019, at https://doi.org/10.7289/V5M32STR.
White, G.C., and Burnham, K.P., 1999, Program MARK—Survival estimation from populations of marked animals: Bird Study, v. 46, no. sup1, p. S120–S139, accessed February 1, 2024, at https://doi.org/10.1080/00063659909477239.
Woodworth, B.K., Wheelwright, N.T., Newman, A.E., Schaub, M., and Norris, D.R., 2017, temperatures limit population growth rate of a migratory songbird: Nature Communications, v. 8, article no. 14812, 9 p., accessed February 1, 2024, at https://doi.org/10.1038/ncomms14812.
Appendix 1. Alpha Codes, Common Names, and Scientific Names for Species Captured at De Luz Creek and Santa Margarita River, Camp Pendleton, California
Table 1.1.
Species captured at De Luz Creek and Santa Margarita River, Camp Pendleton, California.[—, no data]
Appendix 2. Tables for De Luz Creek, Camp Pendleton, California
Table 2.1.
Number of individuals (banded and unbanded) captured: De Luz Creek, Marine Corps Base Camp Pendleton, California, 1995–2021.[—Left][See appendix 1 (table 1.1) for common and scientific bird names corresponding to four-letter species codes]
Table 2.2.
Capture rate by net and date: De Luz Creek, Marine Corps Base Camp Pendleton, 2021.[MAPS, Monitoring Avian Productivity and Survivorship; mm-dd-yy, month-day-year]
Table 2.3.
Number of birds captured, banded, and recaptured: De Luz Creek, Marine Corps Base Camp Pendleton, California, 2016–21.[See appendix 1 (table 1.1) for common and scientific bird names corresponding to four-letter species codes]
Table 2.4.
Sex and age of individuals (banded and unbanded) captured: De Luz Creek, Marine Corps Base Camp Pendleton, California, 2021.[—Left][See appendix 1 (table 1.1) for common and scientific bird names corresponding to four-letter species codes. Abbreviations: HY, hatch-year; AHY, after-hatch-year; SY, second-year; ASY, after-second-year; TY, third-year; ATY, after-third-year; I, indeterminable age]
Table 2.5.
Number of captures by date: De Luz Creek, Marine Corps Base Camp Pendleton, California, 2021.[See appendix 1 (table 1.1) for common and scientific bird names corresponding to four-letter species codes. Abbreviations: MAPS, Monitoring Avian Productivity and Survivorship; mm-dd, month-day]
Appendix 3. Tables for Santa Margarita River, Camp Pendleton, California
Table 3.1.
Number of individuals (banded and unbanded) captured: Santa Margarita River, Marine Corps Base Camp Pendleton, California, 1998–2021.[See appendix 1 (table 1.1) for common and scientific bird names corresponding to four-letter species codes]
Table 3.2.
Capture rate by net and date: Santa Margarita River, Marine Corps Base Camp Pendleton, 2021.[MAPS, Monitoring Avian Productivity and Survivorship; mm-dd-yy, month-day-year]
Table 3.3.
Number of birds captured, banded, and recaptured: Santa Margarita River, Marine Corps Base Camp Pendleton, California, 2017–21.[—Left][See appendix 1 (table 1.1) for common and scientific bird names corresponding to four-letter species codes]
Table 3.3.
Number of birds captured, banded, and recaptured: Santa Margarita River, Marine Corps Base Camp Pendleton, California, 2017–21.[—Right][See appendix 1 (table 1.1) for common and scientific bird names corresponding to four-letter species codes]
Table 3.4.
Sex and age of individuals (banded and unbanded) captured: Santa Margarita River, Marine Corps Base Camp Pendleton, California, 2021.[—Left][See appendix 1 (table 1.1) for common and scientific bird names corresponding to four-letter species codes. Abbreviations: HY, hatch-year; AHY, after-hatch-year; SY, second-year; ASY, after-second-year; TY, third-year; ATY, after-third-year; I, indeterminable age]
Table 3.5.
Number of captures by date: Santa Margarita River, Marine Corps Base Camp Pendleton, California, 2021.[See appendix 1 (table 1.1) for common and scientific bird names corresponding to four-letter species codes. Abbreviations: MAPS, Monitoring Avian Productivity and Survivorship; mm-dd, month-day]
For more information concerning the research in this report, contact the
Director, Western Ecological Research Center
U.S. Geological Survey
3020 State University Drive East
Sacramento, California 95819
https://www.usgs.gov/centers/werc
Publishing support provided by the Science Publishing Network,
Sacramento Publishing Service Center
Disclaimers
Any use of trade, firm, or product names is for descriptive purposes only and does not imply endorsement by the U.S. Government.
Although this information product, for the most part, is in the public domain, it also may contain copyrighted materials as noted in the text. Permission to reproduce copyrighted items must be secured from the copyright owner.
Suggested Citation
Mendia, S.M., and Kus, B.E., 2024, Neotropical migratory bird monitoring study at Marine Corps Base Camp Pendleton, California—2021 annual data summary: U.S. Geological Survey Open-File Report 2024–1024, 69 p., https://doi.org/10.3133/ofr20241024.
ISSN: 2331-1258 (online)
Study Area
| Publication type | Report |
|---|---|
| Publication Subtype | USGS Numbered Series |
| Title | Neotropical migratory bird monitoring study at Marine Corps Base Camp Pendleton, California—2021 annual data summary |
| Series title | Open-File Report |
| Series number | 2024-1024 |
| DOI | 10.3133/ofr20241024 |
| Publication Date | June 12, 2024 |
| Year Published | 2024 |
| Language | English |
| Publisher | U.S. Geological Survey |
| Publisher location | Reston, VA |
| Contributing office(s) | Western Ecological Research Center |
| Description | viii, 69 p. |
| Country | United States |
| State | California |
| Other Geospatial | Marine Corps Base Camp Pendleton |
| Online Only (Y/N) | Y |