

ECCOE Landsat Quarterly Calibration and Validation Report—Quarter 4, 2023
Links
- Document: Report (5.8 MB pdf) , HTML , XML
- Dataset: USGS database —EarthExplorer
- Version History: Version History (1 KB txt)
- Download citation as: RIS | Dublin Core
Executive Summary
The U.S. Geological Survey Earth Resources Observation and Science Calibration and Validation (Cal/Val) Center of Excellence (ECCOE) focuses on improving the accuracy, precision, calibration, and product quality of remote-sensing data, leveraging years of multiscale optical system geometric and radiometric calibration and characterization experience. The ECCOE Landsat Cal/Val Team continually monitors the geometric and radiometric performance of active Landsat missions and makes calibration adjustments, as needed, to maintain data quality at the highest level.
This report provides observed geometric and radiometric analysis results for Landsats 7, 8, and 9 for quarter 4 (October–December) of 2023. All data used to compile the Cal/Val analysis results presented in this report are freely available from the U.S. Geological Survey EarthExplorer website: https://earthexplorer.usgs.gov.
This is the second quarterly report to include analysis results for Landsat 9, which was launched in September 2021. The inclusion of Landsat 9 analysis results was dependent on two factors: a complete reprocessing of the Landsat 9 data archive and enough time elapsing to begin formulating lifetime trends. In April 2023, all Landsat 9 image data acquired since the satellite’s launch were reprocessed to take advantage of calibration updates identified by the ECCOE Landsat Cal/Val Team. Additional information about the Landsat 9 reprocessing effort is available at https://www.usgs.gov/landsat-missions/news/upcoming-reprocessing-all-landsat-9-data. Additional information about Landsat 9 prelaunch, commissioning, and early on-orbit imaging performance is available at https://www.mdpi.com/journal/remotesensing/special_issues/15B4V2K92K.
Introduction
The U.S. Geological Survey (USGS) Earth Resources Observation and Science (EROS) Calibration and Validation (Cal/Val) Center of Excellence (ECCOE) focuses on improving the accuracy, precision, and quality of remote-sensing data, leveraging years of multiscale optical and thermal system geometric and radiometric calibration and characterization experience (USGS, 2021b).
This report provides observed geometric and radiometric analysis results for Landsats 7, 8, and 9 for quarter 4 (October–December) of 2023. All data used to compile the Cal/Val analysis results presented in this report are freely available from the USGS EarthExplorer website: https://earthexplorer.usgs.gov (USGS, 2021a).
This is the second quarterly report to include analysis results for Landsat 9, which was launched in September 2021. The inclusion of Landsat 9 analysis results was dependent on two factors: a complete reprocessing of the Landsat 9 data archive and enough time elapsing to begin formulating lifetime trends. In April 2023, all Landsat 9 image data acquired since the satellite’s launch were reprocessed to take advantage of calibration updates identified by the ECCOE Landsat Cal/Val Team. Additional information about the Landsat 9 reprocessing effort is available at https://www.usgs.gov/landsat-missions/news/upcoming-reprocessing-all-landsat-9-data. Additional information about Landsat 9 prelaunch, commissioning, and early on-orbit imaging performance is available at https://www.mdpi.com/journal/remotesensing/special_issues/15B4V2K92K (Remote Sensing, 2024).
Background
The U.S. Department of the Interior is directed to ensure that U.S. land imaging needs are met in the future and to maintain U.S. leadership in civil land imaging and land science. Those directives come in the context of the Future of Land Imaging Interagency Working Group’s report titled “A Plan for a U.S. National Land Imaging Program” (Executive Office of the President of the United States, 2007) and two recent Earth observation (EO) publications (Executive Office of the President of the United States, 2014, 2016). These reports identified Landsat and other key USGS EO assets as critical components in the national EO structure, where several assets were ranked in the top 10 of more than 300 assets. Among them, Landsat ranked third or higher.
Continuity with the past is key to meeting future land imaging science needs. The Landsat program, operated by the USGS, is the longest continuous record of satellite-based Earth imaging. Landsat data quality is viewed by the remote-sensing user community as a gold standard (National Geospatial Advisory Committee, 2020).
To ensure the continued excellent quality of Landsat data, the USGS EROS Center has identified (1) maintaining a well-calibrated multidecade remote-sensing archive for science and (2) developing and understanding land remote-sensing requirements and land imaging solutions as key strategic pillars. Understanding the land imaging requirements of current and future users, along with an ability to assess the capabilities of current and future systems for meeting those requirements, is key to meeting future land imaging science needs. In the past, Cal/Val activities at the EROS Center addressing the previously mentioned pillars were spread across multiple groups. The USGS EROS Center strategically brought the multiple groups together and formed a single team in a unified project called the ECCOE to enable the USGS to more efficiently address national and global land remote-sensing needs.
Purpose and Scope
The primary purpose of this report is to provide the latest geometric and radiometric performance results for all active Landsat missions. This report provides observed geometric and radiometric analysis results for Landsats 7, 8, and 9 for quarter 4 (October–December), 2023. All data used to compile the results presented in this report are available from the USGS EarthExplorer website: https://earthexplorer.usgs.gov (USGS, 2021a).
Processing Level Definitions
This report frequently references Landsat processing levels. Descriptions of these processing levels are in the following subsections.
Level 0
The Level 0 Reformatted Archive (L0Ra) and Level 0 Reformatted Product (L0Rp) formats do not have sensor chip assembly or band alignment applied. L0Ra data are sensor data and spacecraft ancillary data that are reformatted for easier processing. Minor corrections to the ancillary data (such as frame number and time-code corrections) are applied, and ancillary raw data units are converted to engineering units. Image data are left in counts or digital numbers. L0Rp and L0Ra files are in the same format, but the content is different. L0Ra files contain an entire interval of imagery, whereas L0Rp files only contain a smaller part of the L0Ra data: a Worldwide Reference System-2 (WRS–2) scene-based subset.
Level 1
The standard Level 1 (L1) image data are radiometrically and geometrically corrected. L1 Geometric Systematic Correction products are radiometrically calibrated with only systematic geometric corrections applied using the spacecraft ephemeris data. L1 Systematic Terrain Correction products are radiometrically calibrated with systematic geometric corrections applied using the spacecraft ephemeris data and digital elevation model data to correct for relief displacement. L1 Terrain Precision Correction (L1TP) products are radiometrically calibrated and orthorectified using ground control points (GCPs) and digital elevation model data to correct for relief displacement.
Level 2
The Level 2 science products are generated from L1 inputs that meet the less than 76-degree solar zenith angle constraint and include the required auxiliary data inputs to generate a scientifically viable product. Level 2 science products represent surface reflectance and surface temperature. Surface reflectance is the fraction of incoming solar radiation that is reflected from the Earth’s surface. Surface reflectance product generation accounts for the temporally, spatially, and spectrally varying scattering and absorbing effects of atmospheric gases, aerosols, and water vapor, which are necessary to reliably characterize the Earth’s land surface.
Surface temperature is the measurement of the temperature of the surface of the Earth in Kelvin. Provisional surface temperature is generated from the Landsat Collection 2 L1 thermal infrared bands, top of atmosphere reflectance, Advanced Spaceborne Thermal Emission and Reflection Radiometer (ASTER) Global Emissivity Database data, ASTER Normalized Difference Vegetation Index data, and atmospheric profiles of geopotential height, specific humidity, and air temperature extracted from reanalysis data.
Landsat Collection Definitions
This report frequently references Landsat collections. In 2016, the USGS reorganized the Landsat archive into a tiered-collection management structure. This structure ensures that all Landsat L1 products provide a consistent archive of known data quality while controlling continuous improvement of the archive and access to all data as they are acquired. The implementation of collections represents a substantial change in the management of the Landsat archive by ensuring consistent quality over time and across all instruments.
Landsat Collection 1
Landsat Collection 1 was released in 2016 and introduced collection tiers for L1 data products based on data quality and the level of processing. The tier definition purpose was to support easier identification of suitable scenes for time-series pixel-level analysis. In addition to tiered products, several changes were first introduced with the release of Collection 1 processing. Because of the release of Landsat Collection 2 in December 2020, Collection 1 processing of newly acquired data ended on January 1, 2022. Access to archived Collection 1 data products ceased on December 30, 2022. Additional information about the Collection 1 products is available at https://www.usgs.gov/landsat-missions/landsat-collection-1.
Landsat Collection 2
Landsat Collection 2 was released in December 2020 and marked the second major reprocessing effort on the Landsat archive (USGS, 2020a, b). Collection 2 represented several data product improvements that harnessed recent advancements in data processing, algorithm development, and data access and distribution capabilities. Additional information about the Collection 2 products is available at https://www.usgs.gov/landsat-missions/landsat-collection-2.
Landsat 9 Radiometric Performance Summary
The Landsat 9 on-orbit radiometric performance for this reporting quarter (quarter 4, October–December 2023) meets all requirements as outlined in USGS (2022). The quarterly Operational Land Imager (OLI) and Thermal Infrared Sensor (TIRS) radiometric performance summaries are provided in tables 1 and 2, respectively.
Table 1.
Landsat 9 Operational Land Imager radiometric performance summary, quarter 4 (October–December), 2023.[The previous quarter is quarter 3 (July–September), 2023. OLI, Operational Land Imager; <, less than; SNR, signal-to-noise ratio; Ltypical, typical radiance; -, not applicable; Lhigh, high radiance; RMS, root mean square; stdev, standard deviation; ≤, less than or equal to; W/m2 sr µm, watt per square meter per steradian per micrometer; σ, sigma; spec, specification]
From Haque and others (2024).
Table 2.
Landsat 9 Thermal Infrared Sensor radiometric performance summary, quarter 4 (October–December), 2023.[The previous quarter is quarter 3 (July–September), 2023. TIRS, Thermal Infrared Sensor; ~, approximately; <, less than; NE∆T, noise equivalent change in temperature; K, Kelvin; RMS, root mean square; stdev, standard deviation; -, not applicable; >, greater than; W/m2 sr µm, watt per square meter per steradian per micrometer; σ, sigma; spec, specification]
From Haque and others (2024).
Landsat 9 Operational Land Imager Signal-to-Noise Ratio
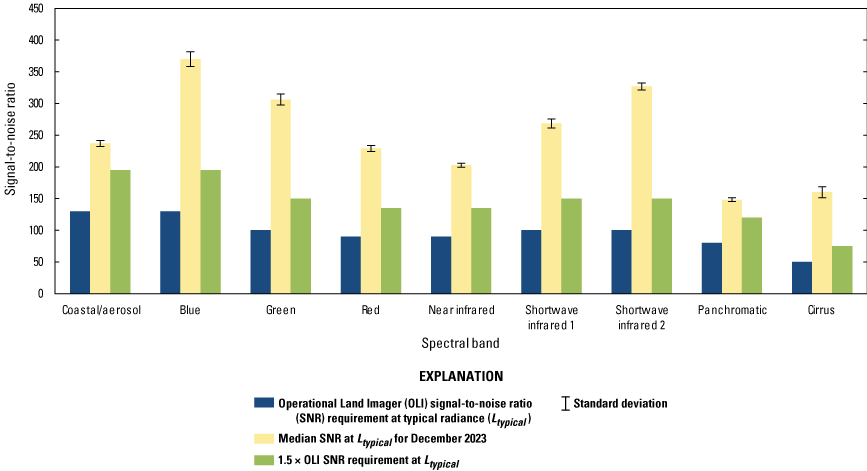
The signal-to-noise ratio (SNR) for each of the OLI spectral bands is characterized at a prescribed band-specific typical radiance (Ltypical) level, as described in table 3. The SNR of a detector at a given radiance level is defined as the mean of the measured pixel radiances acquired over a homogenous target divided by their standard deviation. A curve is fit to the SNR at the measured radiance levels and is evaluated at the prescribed Ltypical level. Before launch, the SNR was characterized at multiple stages of the instrument build, culminating in the testing of the fully integrated instrument.
Table 3.
Landsat 8 and 9 Operational Land Imager typical radiances for each spectral band (from Haque and others [2024]).[OLI, Operational Land Imager; nm, nanometer; Ltypical, typical radiance; W/m2 sr µm, watt per square meter per steradian per micrometer]
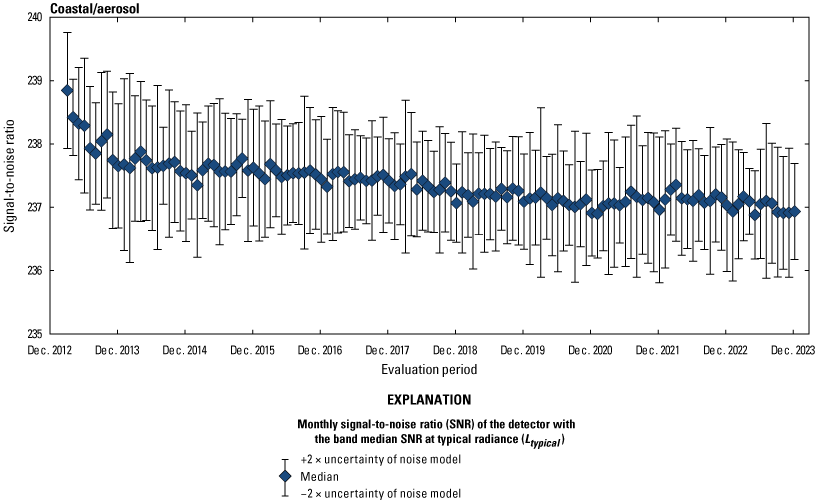
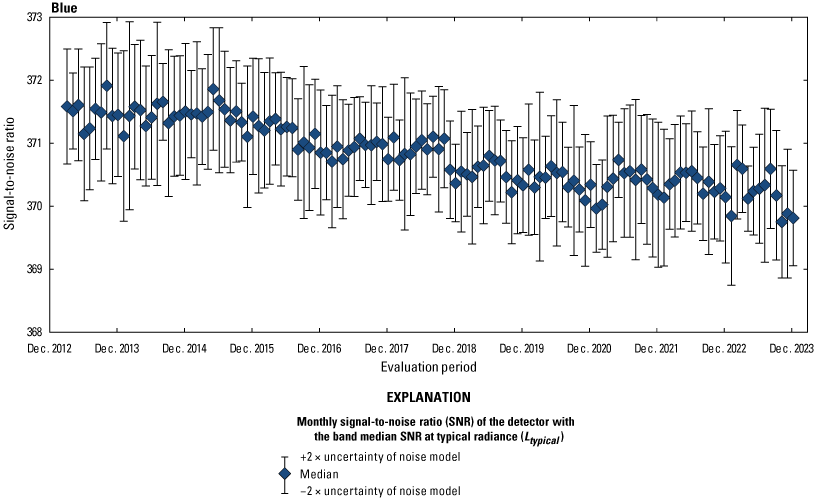
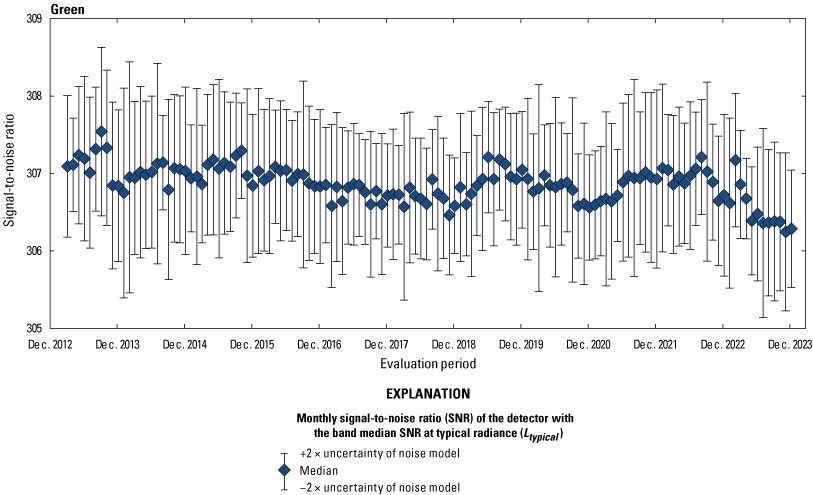
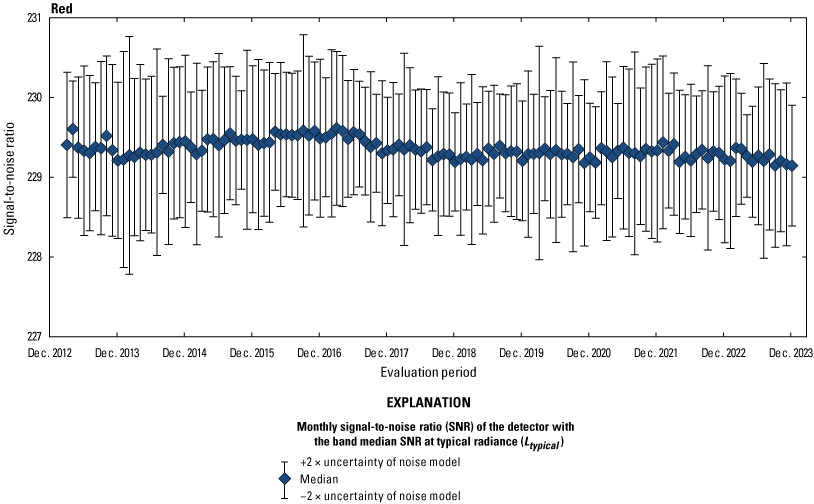
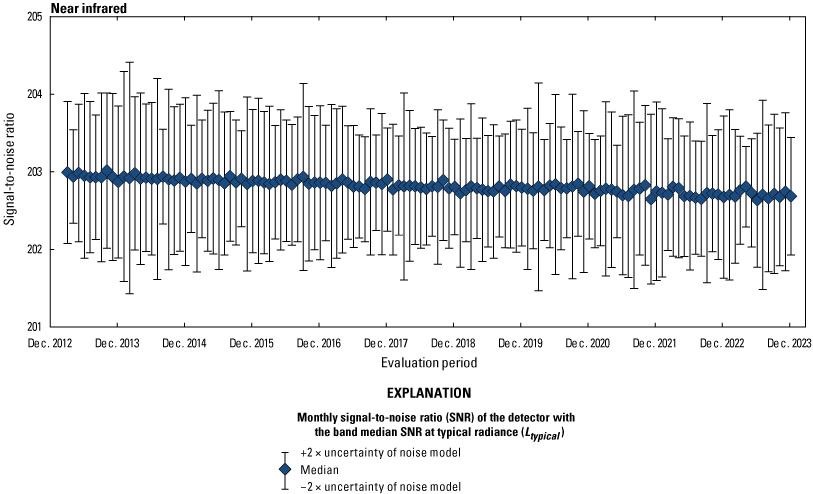
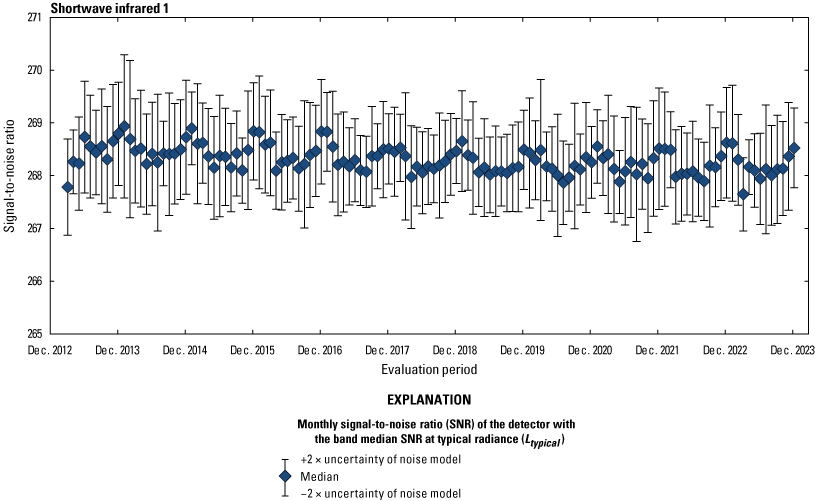
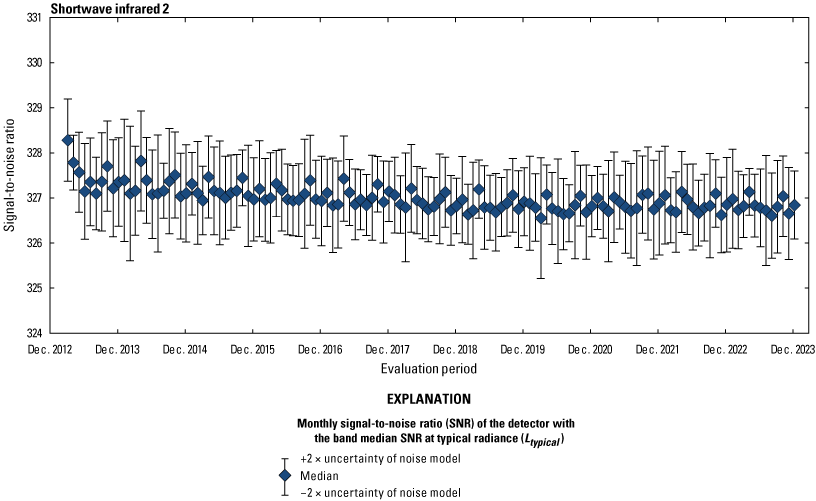
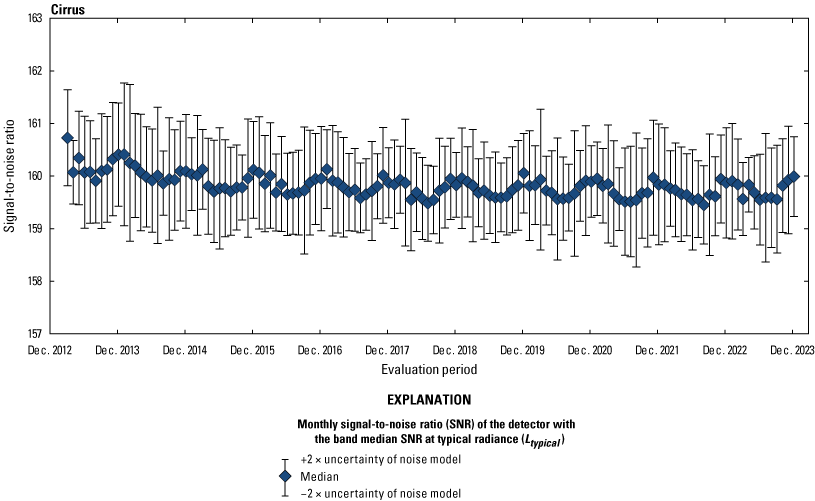
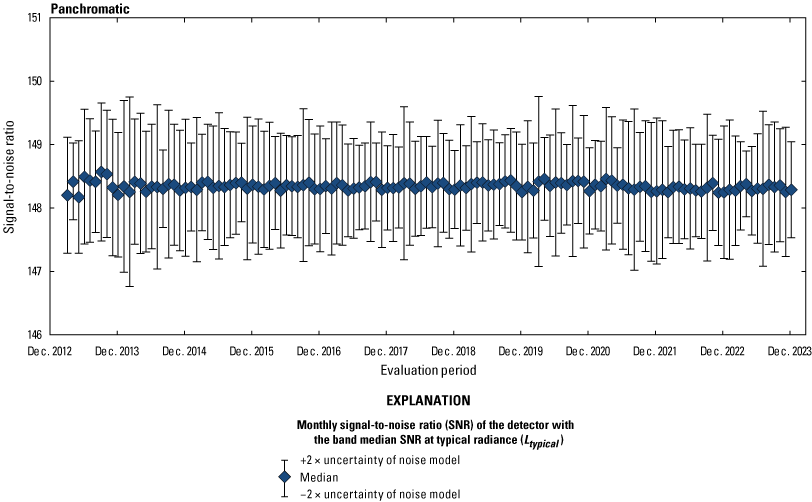
The Landsat 9 OLI SNR is evaluated on orbit each month using onboard calibrator data and is slightly better than the Landsat 8 OLI SNR (between 3.47 and 8.59 percent band-dependent improvement at the Ltypical level). It is consistently two to three times better than requirements and about eight times better than the Landsat 7 Enhanced Thematic Mapper Plus (ETM+) SNR. The per-band OLI median SNR at the Ltypical level (yellow bars) for December 2023, which for all bands, easily exceeds the OLI SNR requirements (blue bars) by more than 50 percent, is shown in figure 1. Lifetime SNR stability at Ltypical for each OLI band is represented in figures 2, 3, 4, 5, 6, 7, 8, 9, and 10; monthly SNR values (for the detectors that have median SNRs for all bands) are denoted by the diamonds, and the uncertainties in the monthly SNR model are denoted by the error bars. The SNR for each band has remained stable over time (within the uncertainty of the models and much greater than the required levels). From Haque and others (2024), radiometric updates implemented during the Landsat 9 data archive reprocessing effort resulted in slight per-band improvement in the Landsat 9 OLI SNR (between 0.03 and 3.84 percent).
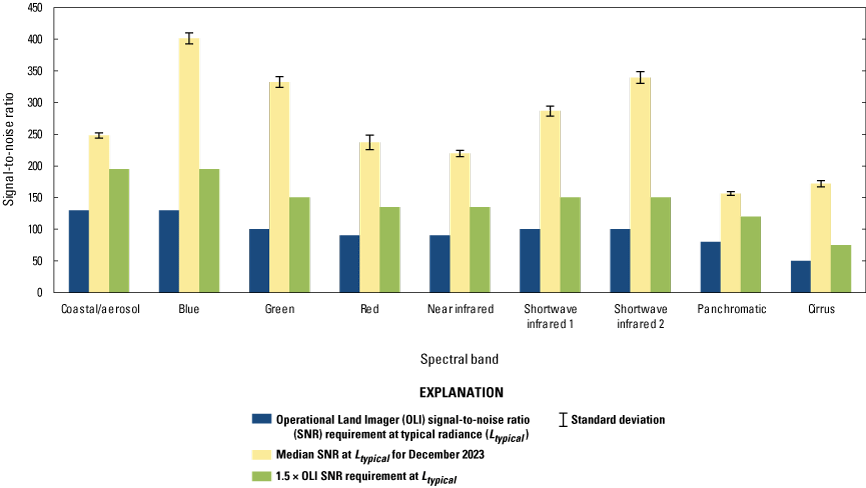
Landsat 9 Operational Land Imager signal-to-noise ratio performance, December 2023.
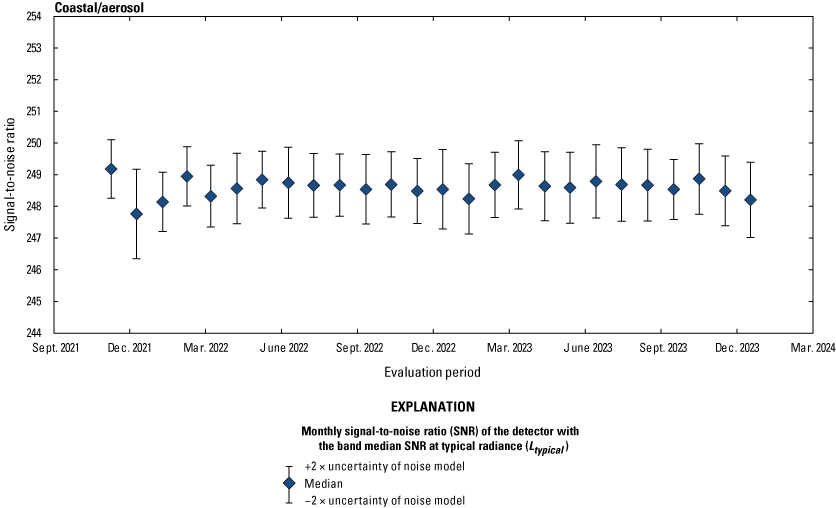
Landsat 9 Operational Land Imager coastal/aerosol band lifetime signal-to-noise ratio stability.
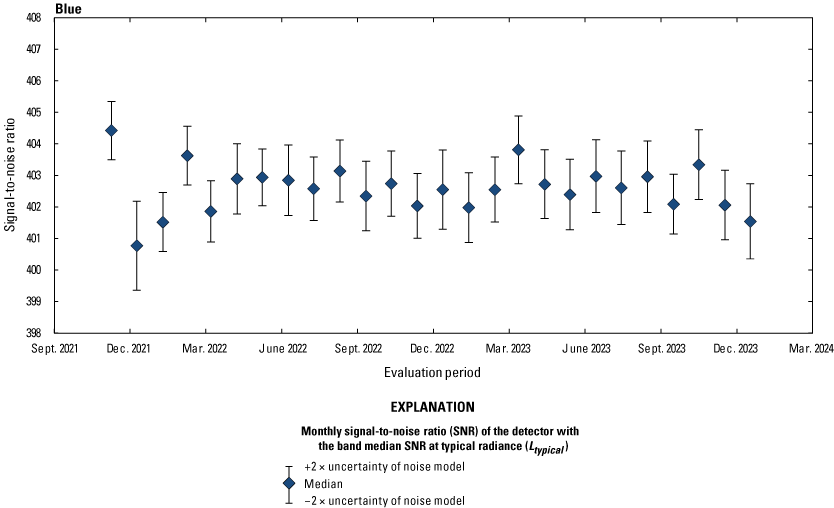
Landsat 9 Operational Land Imager blue band lifetime signal-to-noise ratio stability.
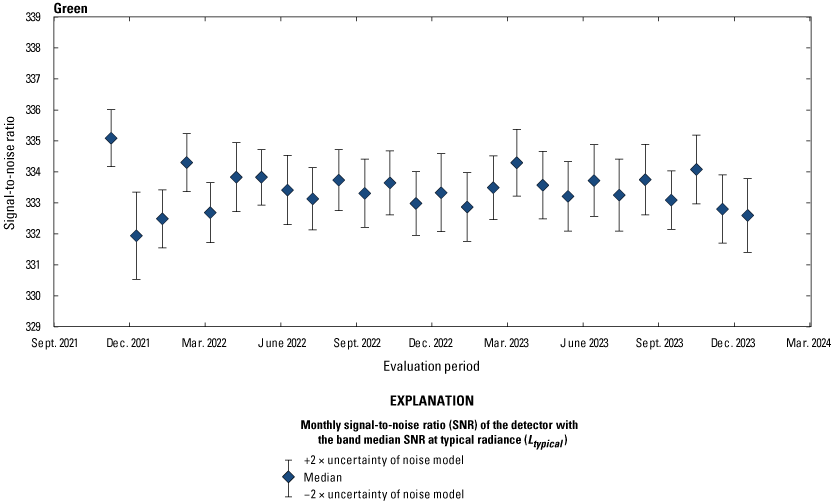
Landsat 9 Operational Land Imager green band lifetime signal-to-noise ratio stability.
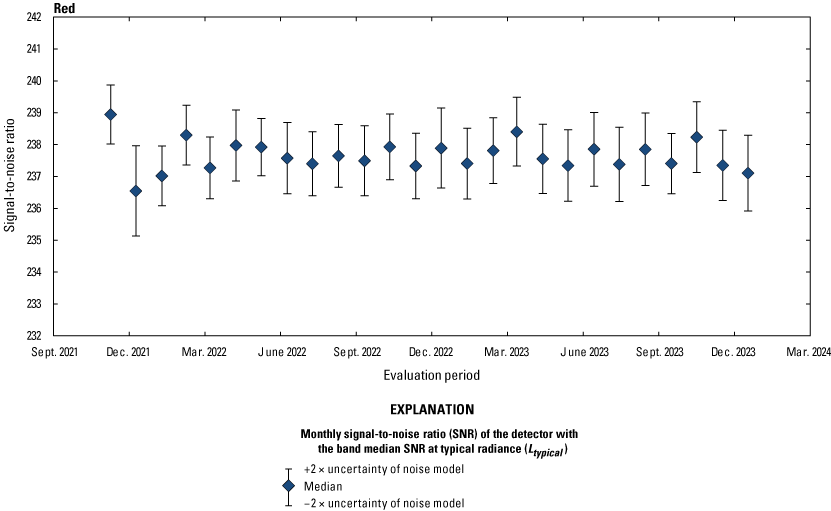
Landsat 9 Operational Land Imager red band lifetime signal-to-noise ratio stability.
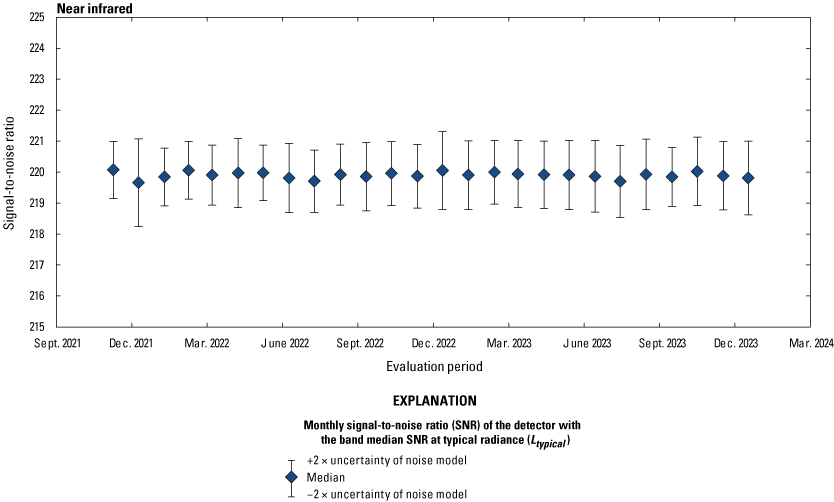
Landsat 9 Operational Land Imager near infrared band lifetime signal-to-noise ratio stability.
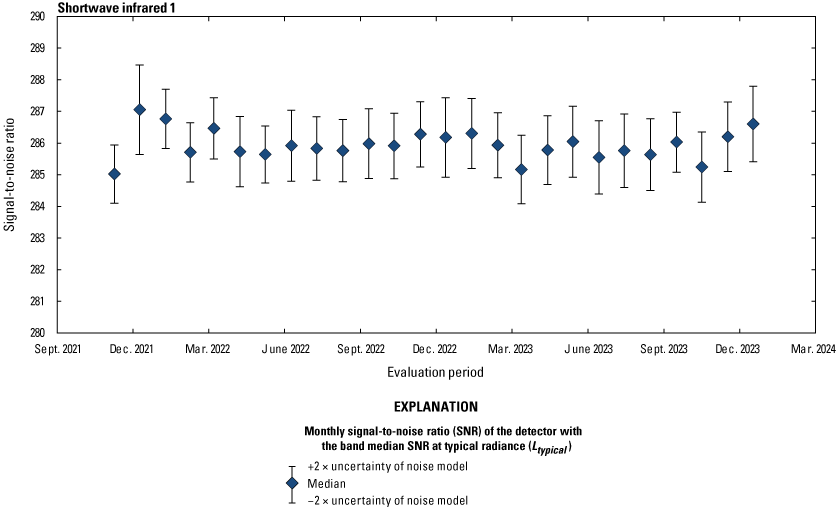
Landsat 9 Operational Land Imager shortwave infrared 1 band lifetime signal-to-noise ratio stability.
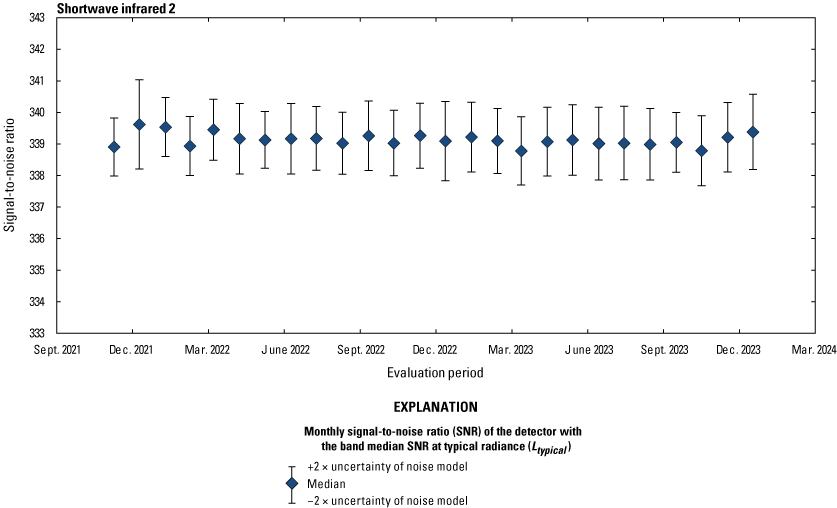
Landsat 9 Operational Land Imager shortwave infrared 2 band lifetime signal-to-noise ratio stability.
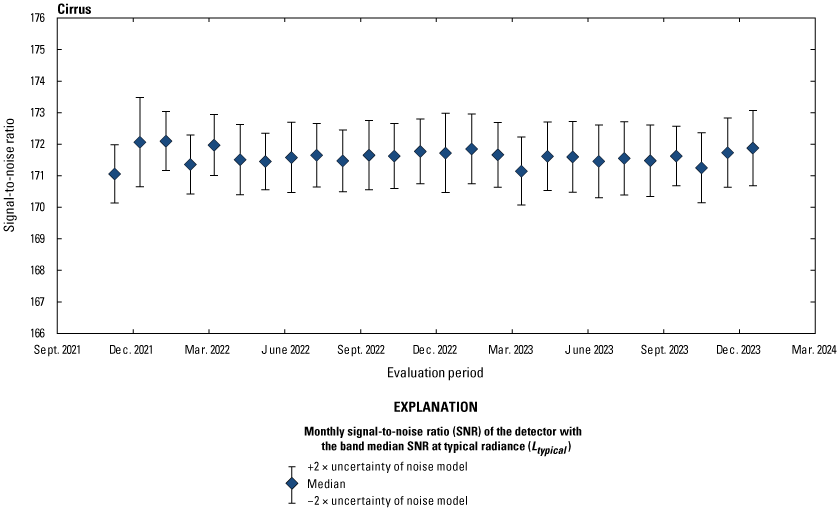
Landsat 9 Operational Land Imager cirrus band lifetime signal-to-noise ratio stability.
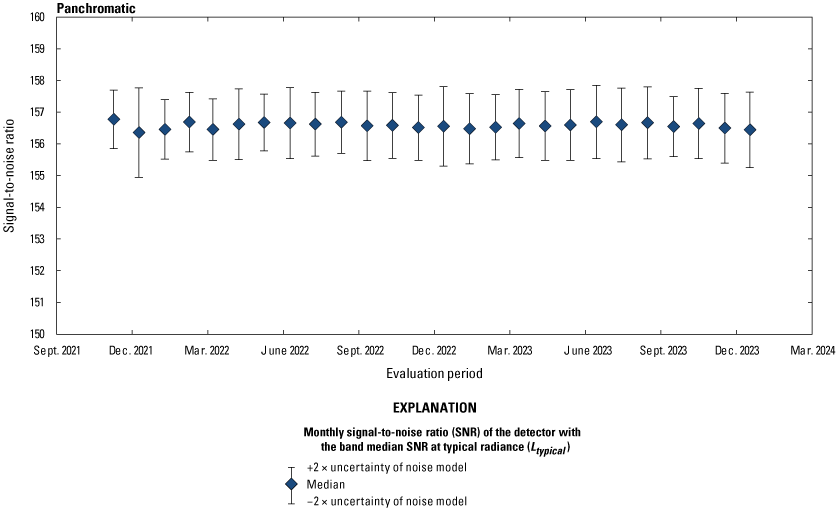
Landsat 9 Operational Land Imager panchromatic band lifetime signal-to-noise ratio stability.
Landsat 9 Thermal Infrared Sensor Noise Performance
Noise can be defined as variation in detected signal over time when observing a stable source of radiation. For thermal sensors, noise is usually expressed in terms of a change in brightness temperature (that is, the noise equivalent change in temperature [NEΔT]). NEΔT is estimated as the standard deviation of detector data acquired over a uniform radiance source and then converted to temperature. Noise performance is completed on blackbody and deep space TIRS data (Barsi and others, 2022).
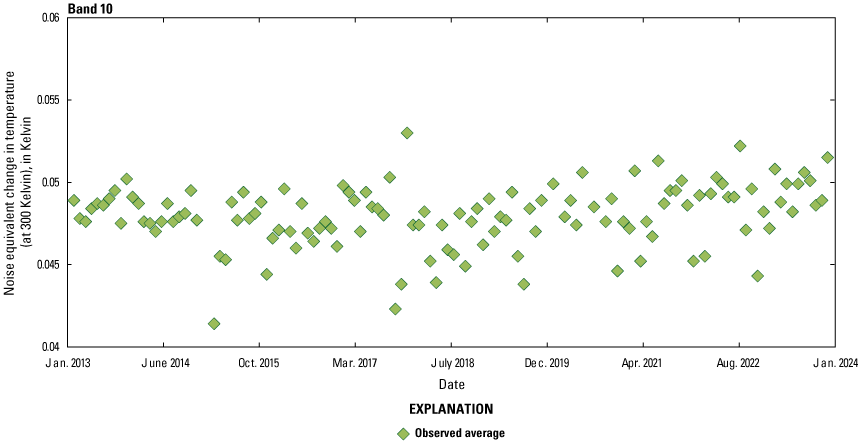
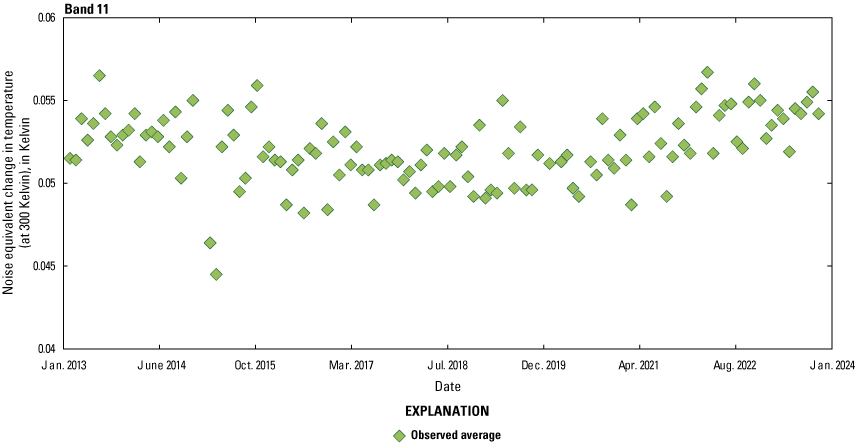
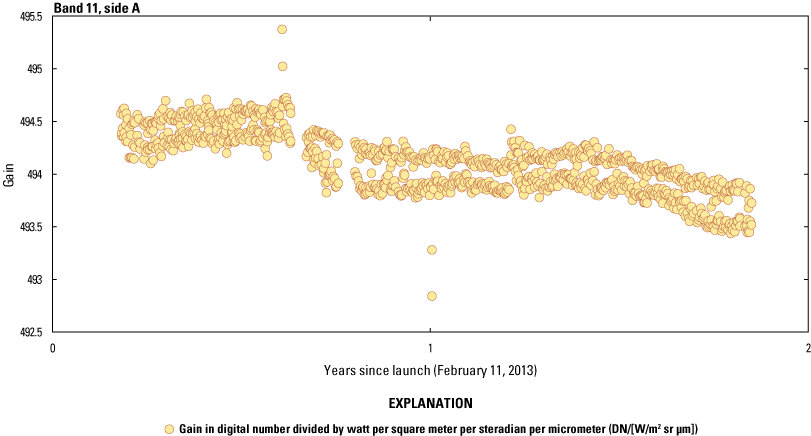
All Landsat 9 TIRS detectors have similar NEΔT. At 300 Kelvin (K), band-average noise performance for both thermal bands is about six times better than the requirement (less than 0.4 K) and about three times better than the NEΔT of the Landsat 7 ETM+ thermal band at that same temperature. Lifetime averages of NEΔT at 300 K for TIRS band 10 are shown in figure 11, and the same averages for TIRS band 11 are shown in figure 12. In both figures, colored diamonds are used to indicate the observed NEΔT values as measured over time.
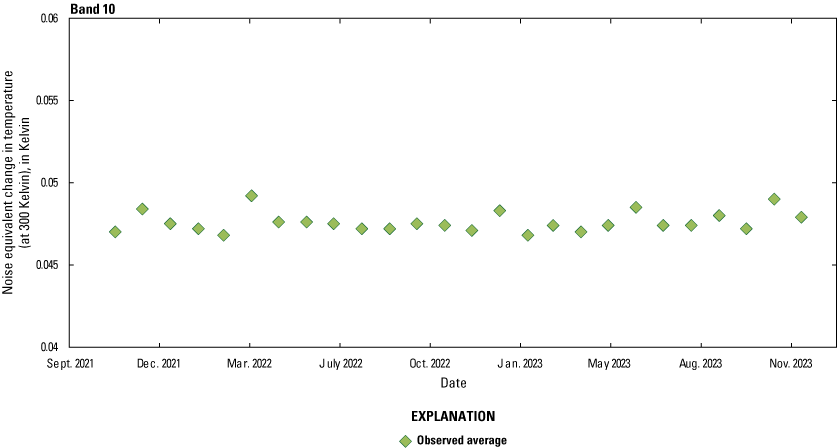
Landsat 9 Thermal Infrared Sensor band 10 lifetime noise performance.
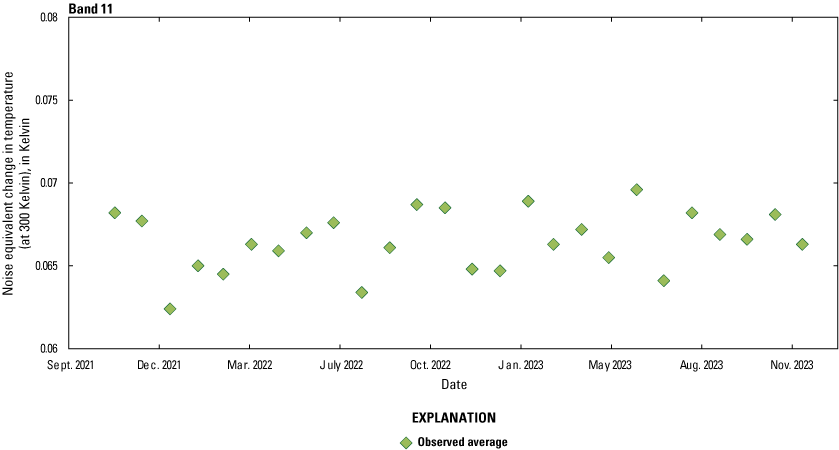
Landsat 9 Thermal Infrared Sensor band 11 lifetime noise performance.
Landsat 9 Radiometric Stability
Radiometric stability of an instrument is fundamental to low uncertainty in the radiometric calibration of data products generated from its measurements. The radiometric response stability is characterized for all OLI and TIRS bands using the instruments’ responses to signals from the onboard calibration devices collected over time (USGS, 2021d). The bias and gain stability of an instrument are contributing factors to variability within a radiometrically calibrated product.
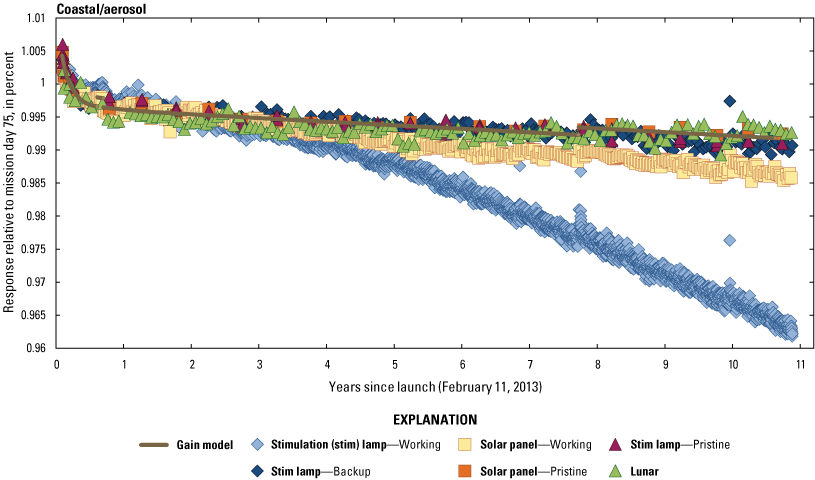
The per-band Landsat 9 OLI radiometric stability over the lifetime of the instrument is shown in figures 13, 14, 15, 16, 17, 18, 19, 20, and 21. Within each figure, the x-axis represents years since launch (September 27, 2021), and the y-axis represents the response relative to the normalized first three months of image data acquisitions. With the exception of the coastal/aerosol band (which is currently under investigation for possible updates), all onboard calibrators demonstrate stable responses over time at a level less than approximately (~) 0.3 percent with no significant trends, indicating no change in responsivity and indicating high radiometric stability of the instrument over its lifetime. Note that, because of the stable responses, the scale for these figures has been reduced when compared with the equivalent Landsat 8 figures to show additional detail.
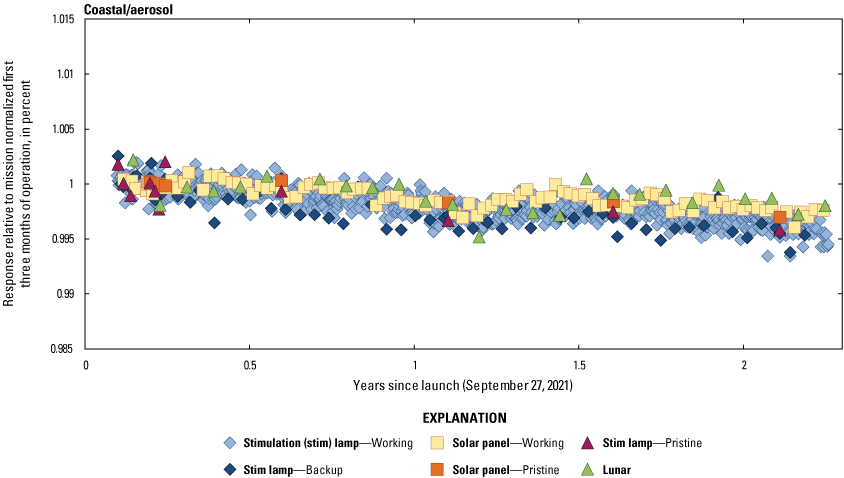
Landsat 9 Operational Land Imager coastal/aerosol band lifetime radiometric stability.
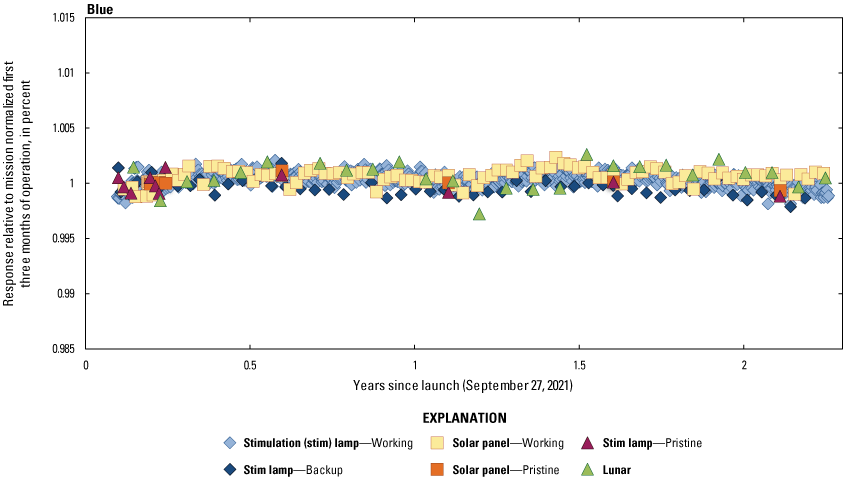
Landsat 9 Operational Land Imager blue band lifetime radiometric stability.
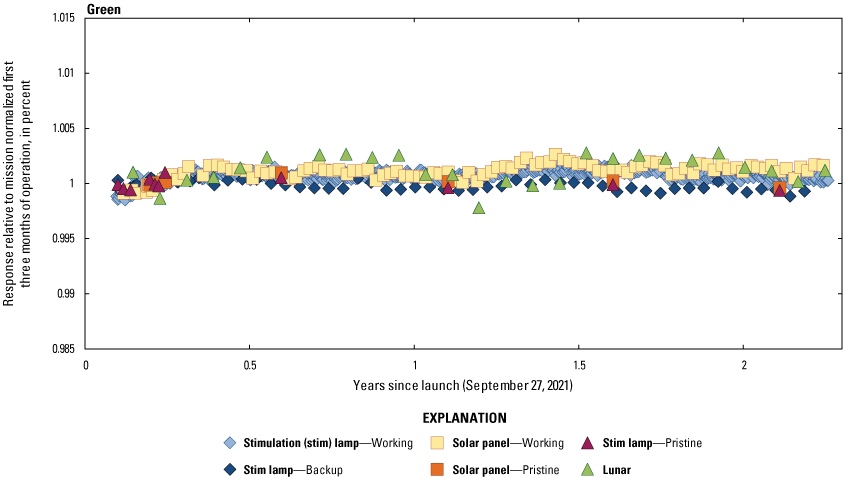
Landsat 9 Operational Land Imager green band lifetime radiometric stability.
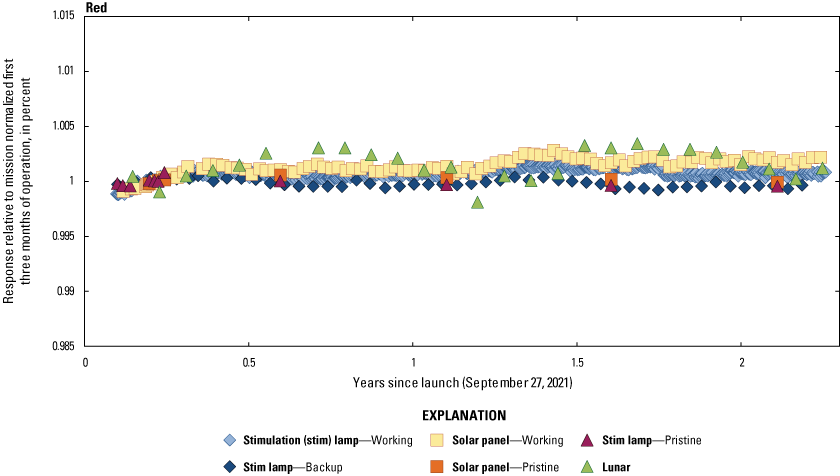
Landsat 9 Operational Land Imager red band lifetime radiometric stability.
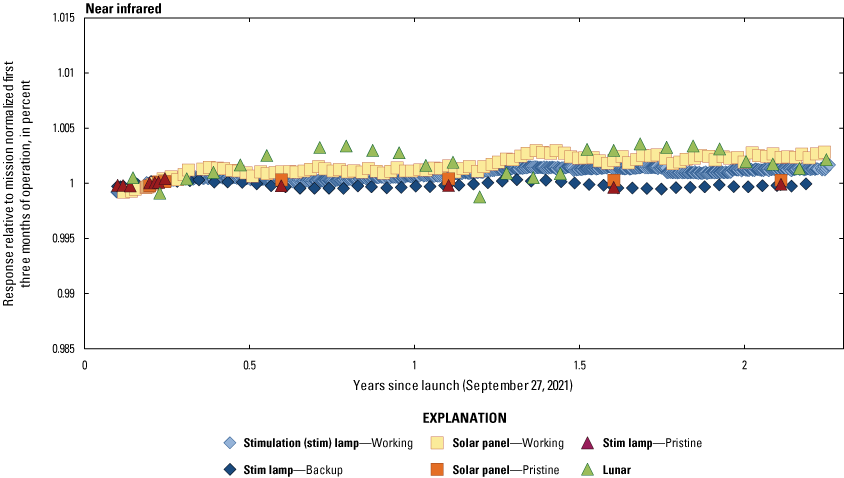
Landsat 9 Operational Land Imager near infrared band lifetime radiometric stability.
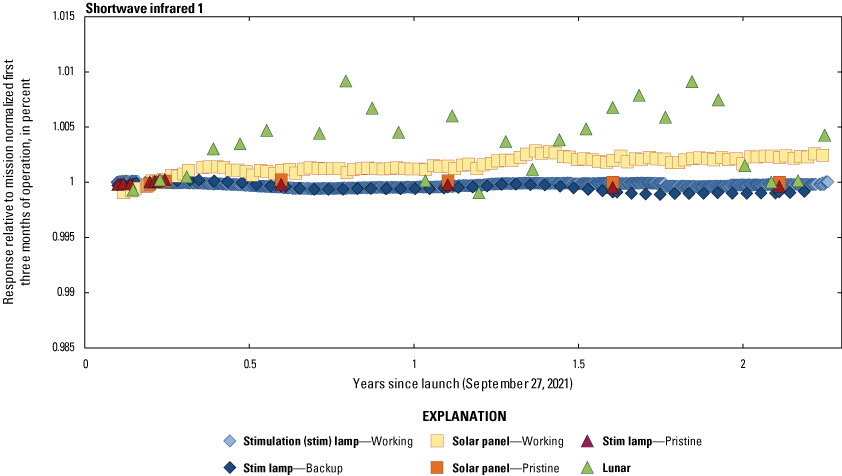
Landsat 9 Operational Land Imager shortwave infrared 1 band lifetime radiometric stability.
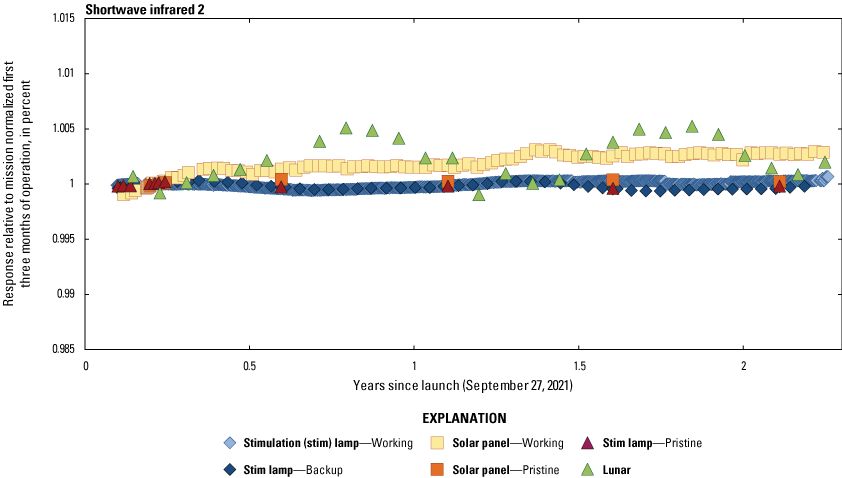
Landsat 9 Operational Land Imager shortwave infrared 2 band lifetime radiometric stability.
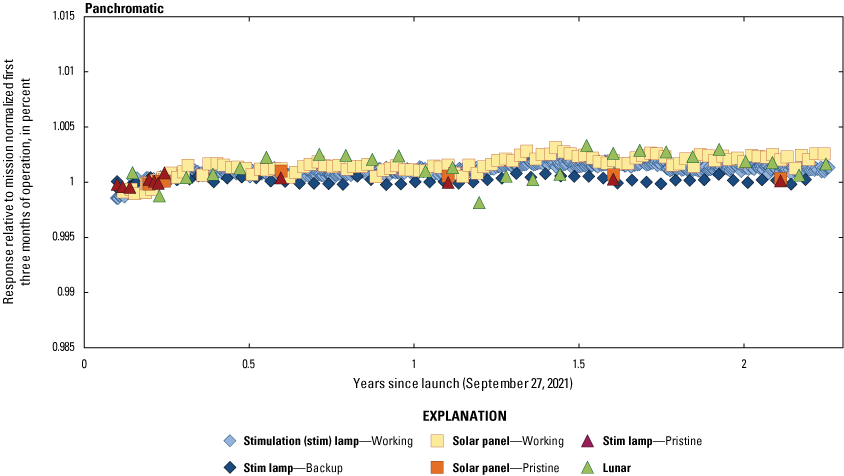
Landsat 9 Operational Land Imager panchromatic band lifetime radiometric stability.
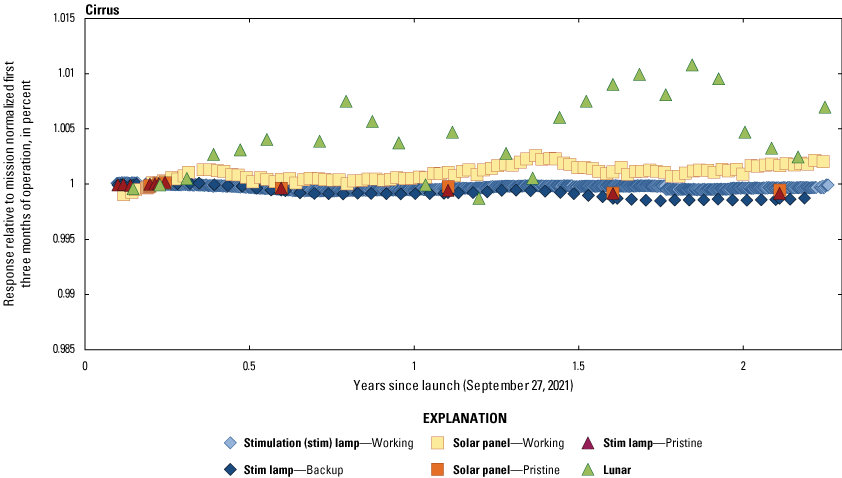
Landsat 9 Operational Land Imager cirrus band lifetime radiometric stability.
Early mission TIRS responsivity remained stable to within 0.05 percent in bands 10 and 11. On March 12, 2022, the TIRS Cryocooler Electronics reset suddenly, leading to instrument power down and loss of thermal control. Once thermal control was recovered, the internal responsivity metric indicated that the response had changed by about 0.35 and 0.43 percent for bands 10 and 11 (Haque and others, 2024). This is corrected during data product generation and is transparent to the data users. After the reset event, TIRS responsivity has remained stable, as shown in figures 22 and 23, respectively.
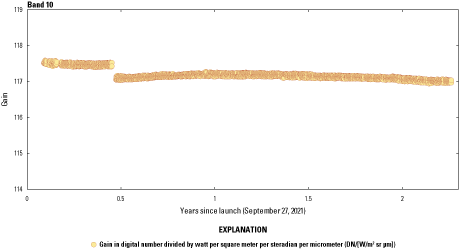
Landsat 9 Thermal Infrared Sensor band 10 radiometric stability.
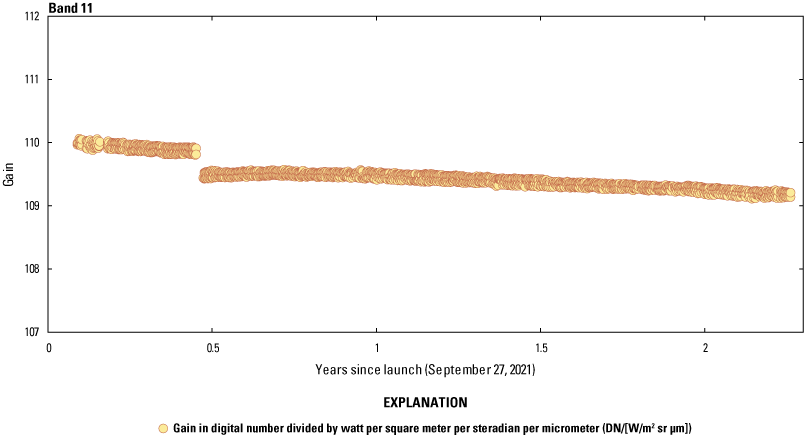
Landsat 9 Thermal Infrared Sensor band 11 radiometric stability.
Landsat 9 Relative Gains
Relative gains account for the differences in responsivity between detectors within a spectral band. OLI relative gains are monitored using solar diffuser acquisitions, side slither acquisitions (which entail a 90-degree yaw maneuver over an invariant site to flatten the data), and scene statistics. Quarterly updates are completed using data from the solar diffuser acquisitions from the previous quarter (quarter 3 [July–September], 2023).
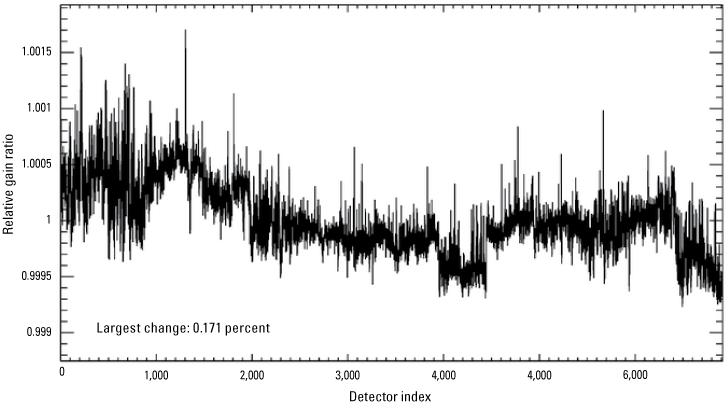
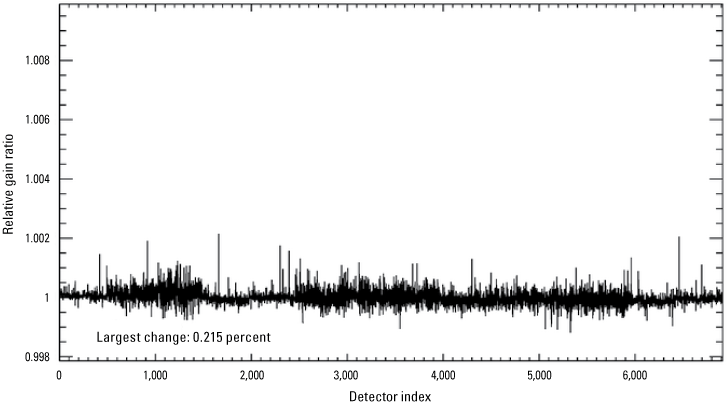
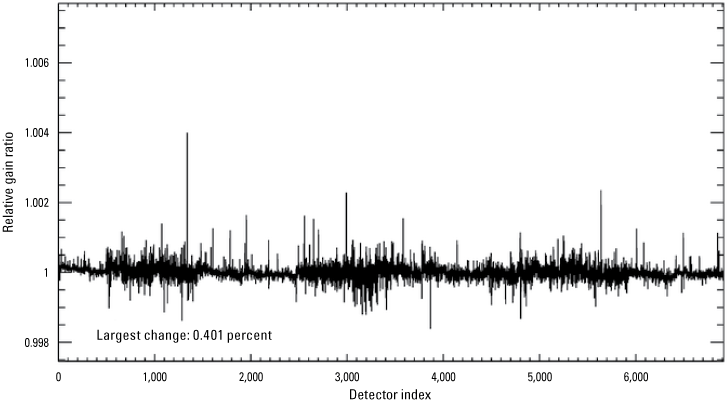
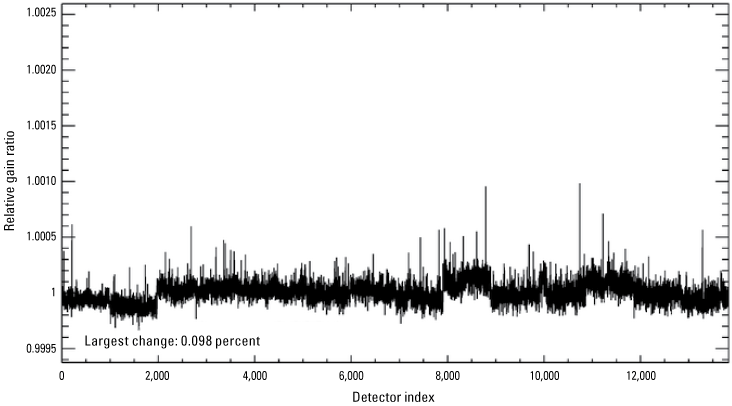
Typical per-detector changes in relative gains between the previous quarter and this quarter for several bands are shown in figures 24, 25, 26, and 27 by analyzing data from within each quarter. In each figure, the x-axis indicates the detector index, and the y-axis indicates the change in relative gain between the quarters as a ratio. These changes in responsivity are accounted for in the L1 product by updating the following quarter’s calibration parameter file (CPF).
Landsat 9 Operational Land Imager coastal/aerosol band per-detector change in relative gains between quarter 3 and quarter 4, 2023.
Landsat 9 Operational Land Imager shortwave infrared 1 band per-detector change in relative gains between quarter 3 and quarter 4, 2023.
Landsat 9 Operational Land Imager shortwave infrared 2 band per-detector change in relative gains between quarter 3 and quarter 4, 2023.
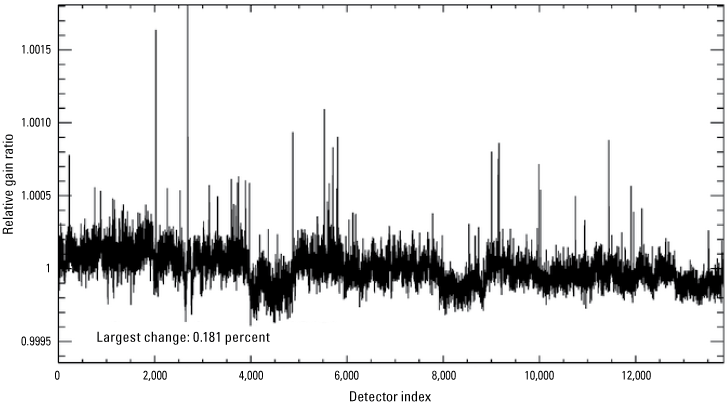
Landsat 9 Operational Land Imager panchromatic band per-detector change in relative gains between quarter 3 and quarter 4, 2023.
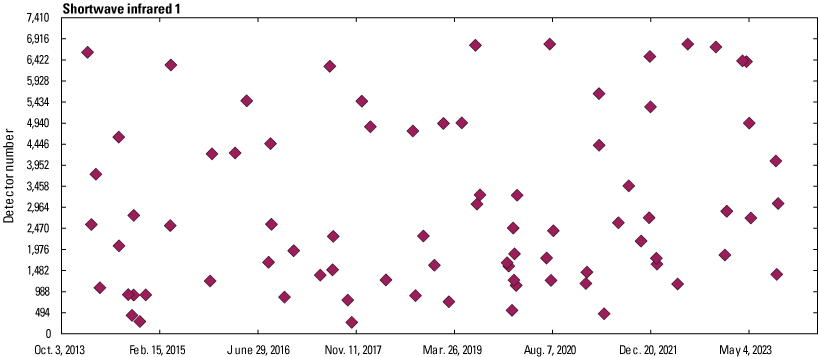
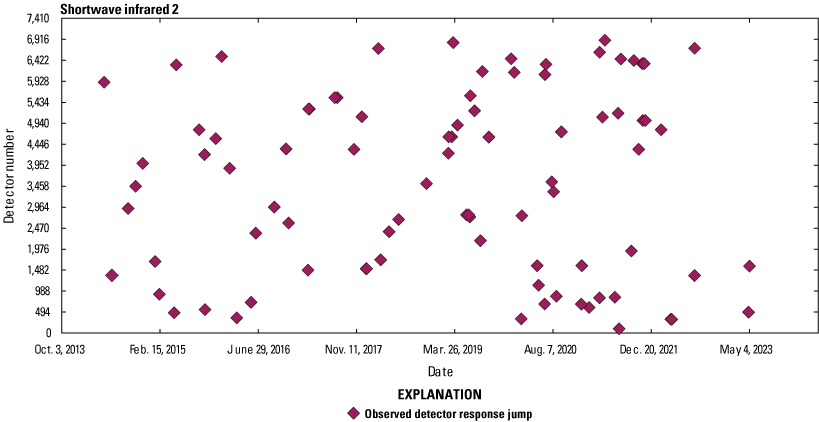
The Landsat 9 OLI detectors that have indicated a sudden change in responsivity of 0.5 percent or greater in the shortwave infrared (SWIR) 1 and SWIR 2 bands since launch are shown in figures 28 and 29. The x-axis indicates the date of the jump in responsivity, and the y-axis signifies the detector number. The observed responsivity jumps seem to be randomly scattered in time and location on the focal plane so do not seem to be associated with an instrument event or failure. These jumps are only observed in the SWIR bands (SWIR 1, SWIR 2, and cirrus); the visible and near infrared band detectors have not indicated any jump behavior over the whole mission.
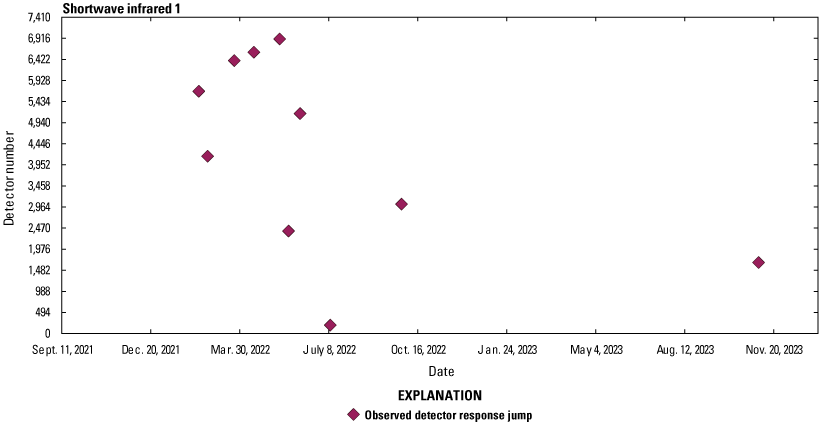
Landsat 9 Operational Land Imager shortwave infrared 1 lifetime jumps in detector responsivity.
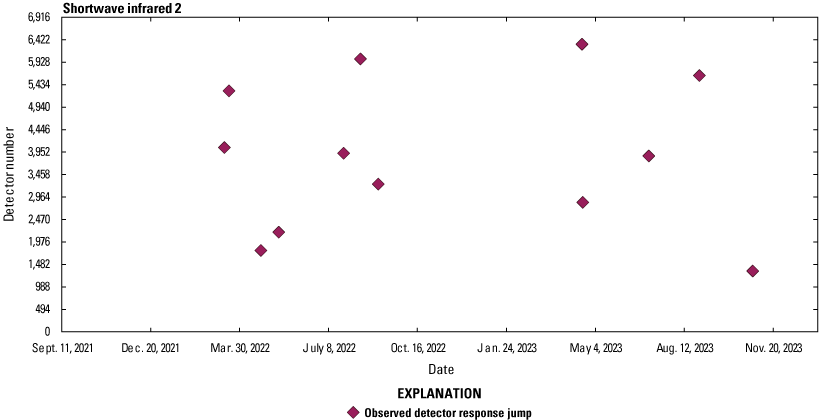
Landsat 9 Operational Land Imager shortwave infrared 2 lifetime jumps in detector responsivity.
Landsat 9 to Landsat 8 Operational Land Imager Radiometric Cross-Comparison
The instruments onboard Landsat 9 are improved replicas of those currently collecting data onboard Landsat 8. Landsat 9 improvements include higher OLI radiometric resolution with a 14-bit quantization, increased from 12 bits for Landsat 8 (USGS, 2019c). Cross-comparison quantitative analysis between the Landsat 9 and Landsat 8 Level 1 top of atmosphere reflectance acquisitions over a pseudoinvariant calibration site (PICS) is performed to determine interoperability between Landsat 9 OLI and Landsat 8 OLI.
The top of atmosphere reflectance values observed over the Libya 4 PICS site (lat 28.55° N., long 23.39° E.) using the Centre National D’Etudes Spatiales (CNES) region of interest (ROI) are shown in figure 30. The reflectance measurements indicate good agreement between both sensors, and the similar trends by both sensors indicate consistent calibration.
Landsat 9 to Landsat 8 Operational Land Imager Libya 4 pseudoinvariant calibration site top of atmosphere reflectance cross-comparison.
Landsat 9 Geometric Performance Summary
The Landsat 9 on-orbit geometric performance for the reporting quarter (quarter 4, October–December 2023) meets all requirements as outlined in USGS (2022) with the exception of OLI band registration accuracy (all bands). The registration accuracy offset for all bands slightly exceeds the required value, but the offset easily meets the required value when excluding the cirrus band. The quarterly results summary is provided in table 4.
Table 4.
Landsat 9 geometric performance summary, quarter 4 (October–December), 2023.[The previous quarter is quarter 3 (July–September), 2023. OLI, Operational Land Imager; <, less than; LE90, linear error with 90-percent confidence; CE90, circular error with 90-percent confidence; L1T, Level 1 terrain-corrected product; >, greater than; TIRS, Thermal Infrared Sensor]
From Haque and others (2024).
Landsat 9 Band Registration Accuracy
Internal band registration measures how accurately the various Landsat 9 spectral bands are geometrically aligned to each other. The assessment provides a numerical evaluation of the accuracy of the band registration within an image using automated cross-correlation techniques between the bands to be assessed (USGS, 2021d).
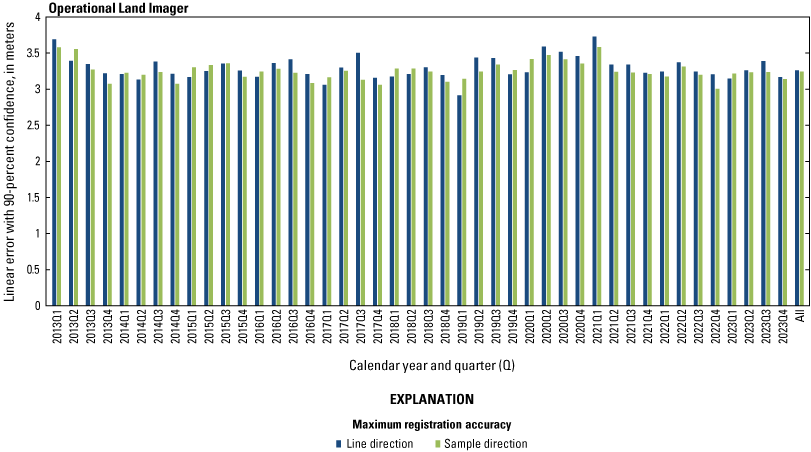
Landsat 9 OLI band registration performance has been stable over time. Quarterly band-to-band maximum registration accuracy for each band combination except for the cirrus band is shown in figure 31. Within the figure, blue bars indicate maximum registration accuracy in the line direction, and green bars indicate maximum registration accuracy in the sample direction. Lifetime OLI band registration accuracy for all bands is 4.8 meters (not shown), and lifetime OLI band registration accuracy for all bands, excluding cirrus, is 3.2 meters, which is well within the instrument specification accuracy. OLI band registration accuracy for all bands during quarter 4, 2023, is 4.94 meters (table 4), and OLI band registration accuracy for all bands, excluding cirrus, during quarter 4, 2023, is 3.09 meters (table 4).
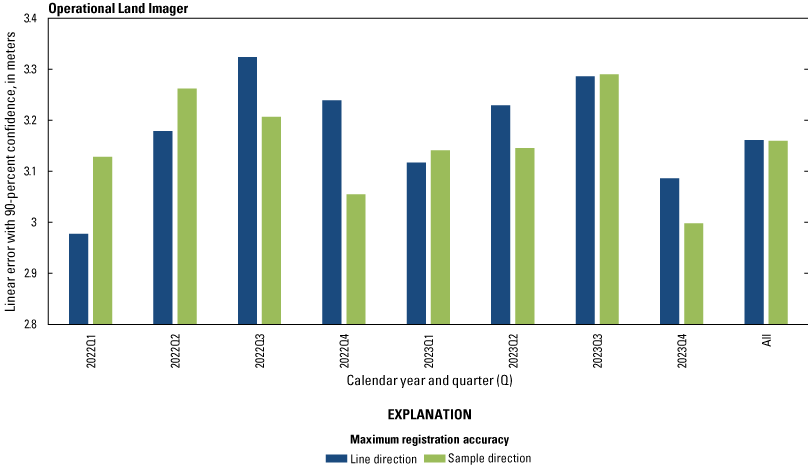
Landsat 9 Operational Land Imager lifetime band (excluding cirrus) registration accuracy by quarter.
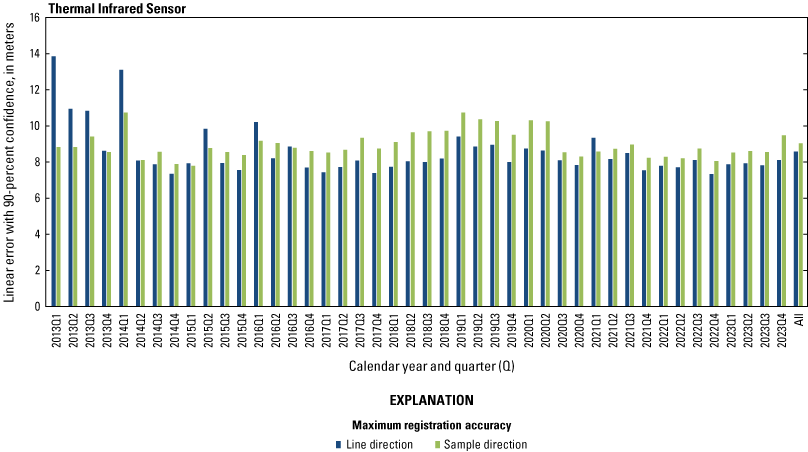
TIRS band registration performance has been stable throughout the instrument’s lifetime. Behavior is well within specification, as shown in figure 32, and quarter 4, 2023, results are consistent with past performance. Within the figure, blue bars indicate maximum registration accuracy in the line direction, and green bars indicate maximum registration accuracy in the sample direction. Lifetime TIRS band registration accuracy is 8.5 meters, and during quarter 4, 2023, the accuracy is also 8.5 meters.
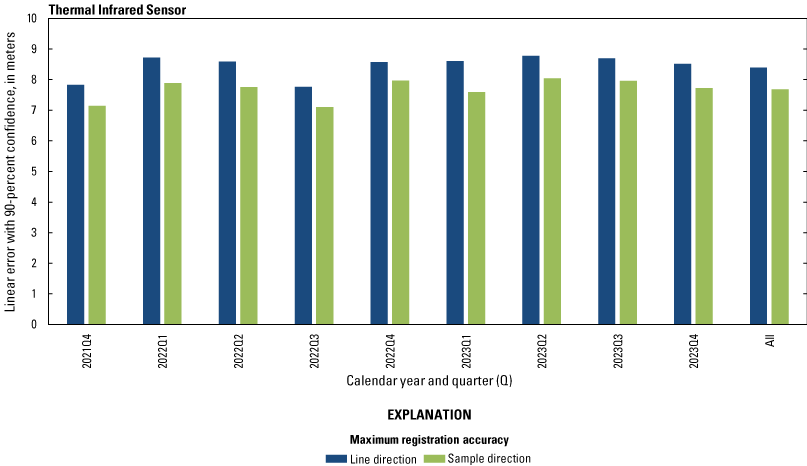
Landsat 9 Thermal Infrared Sensor lifetime band registration accuracy by quarter.
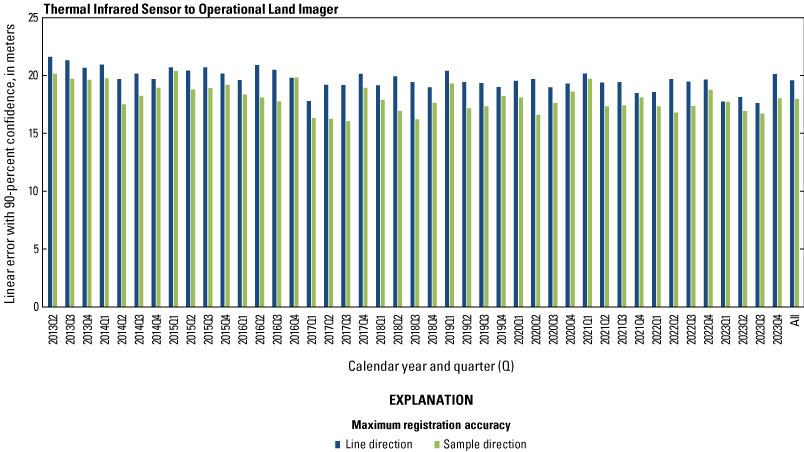
Lifetime TIRS to OLI band registration accuracy by quarter is shown in figure 33. Behavior has been stable throughout the instrument’s lifetime and well within specification. Within the figure, blue bars indicate maximum registration accuracy in the line direction, and green bars indicate maximum registration accuracy in the sample direction. Lifetime TIRS to OLI registration accuracy (excluding the cirrus band) is 17.8 meters in the line direction and 17.7 meters in the sample direction. Quarter 4, 2023, TIRS to OLI registration accuracy (excluding the cirrus band) is 18.9 meters in the line direction and 19.7 meters in the sample direction.
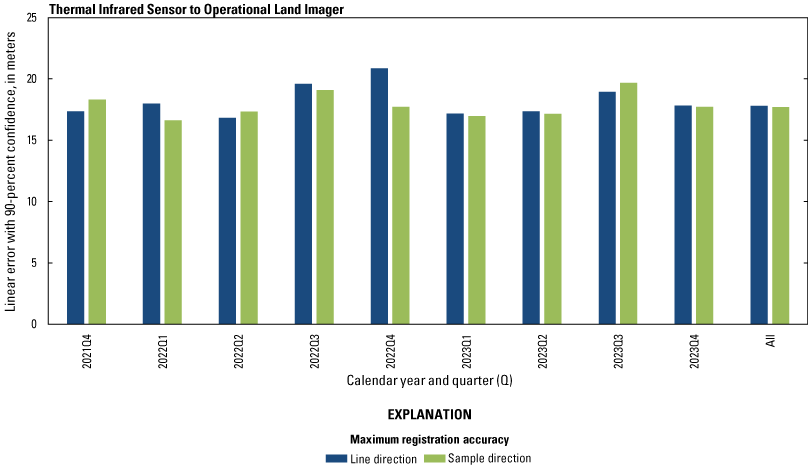
Landsat 9 Thermal Infrared Sensor to Operational Land Imager lifetime band (excluding cirrus) registration accuracy by quarter.
Landsat 9 Operational Land Imager to Thermal Infrared Sensor Alignment
Landsat 9 OLI to TIRS alignment knowledge is critical to ensure that the L1 product accuracy requirements can be met. The alignment between OLI and TIRS instruments is periodically measured using correlation-based methods to ensure that the band-to-band alignment requirements for all Landsat 9 bands can be met (USGS, 2021d). The alignment estimates are used to update the calibration parameters in the CPFs when the observed changes are determined to affect the performance requirements.
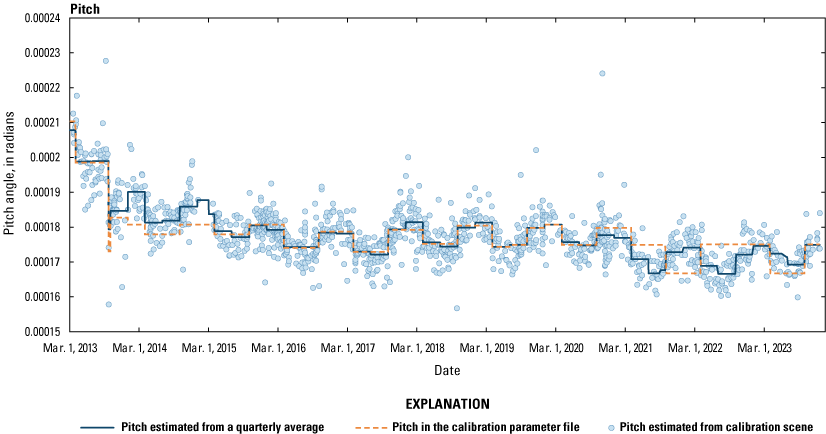
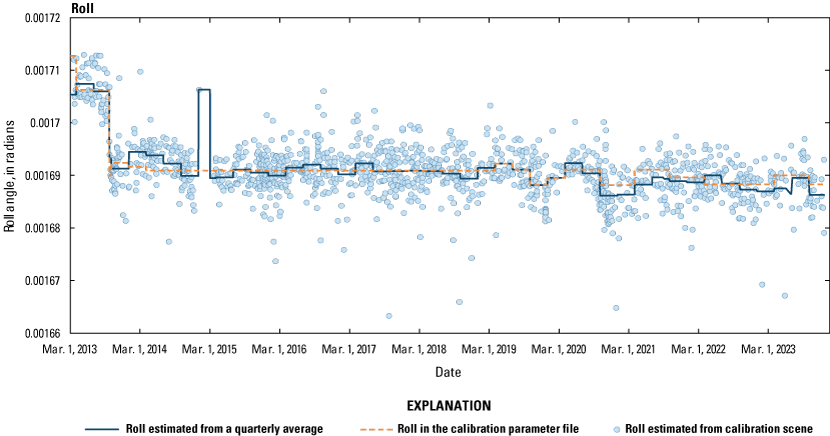
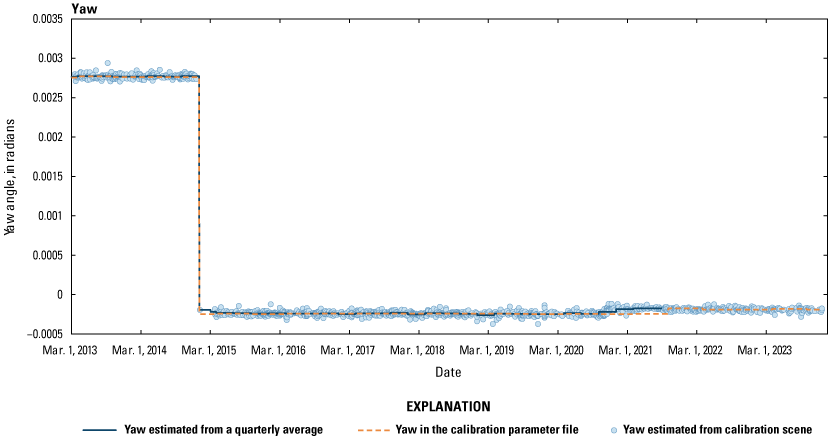
TIRS to OLI pitch alignment measurements over instrument lifetimes are shown in figure 34. Although still early in the Landsat 9 mission, a seasonal pattern has been observed along with a slight downward trend. The predictive estimate for quarter 1, 2024, was determined based on these observed trends. The lifetime TIRS to OLI roll alignment is shown in figure 35, and the lifetime TIRS to OLI yaw alignment is shown in figure 36. Each light blue symbol on these figures represents one calibration scene, the dark blue solid lines indicate quarterly alignment averages, and the orange dashed lines indicate applied Collection 2 CPF correction values.
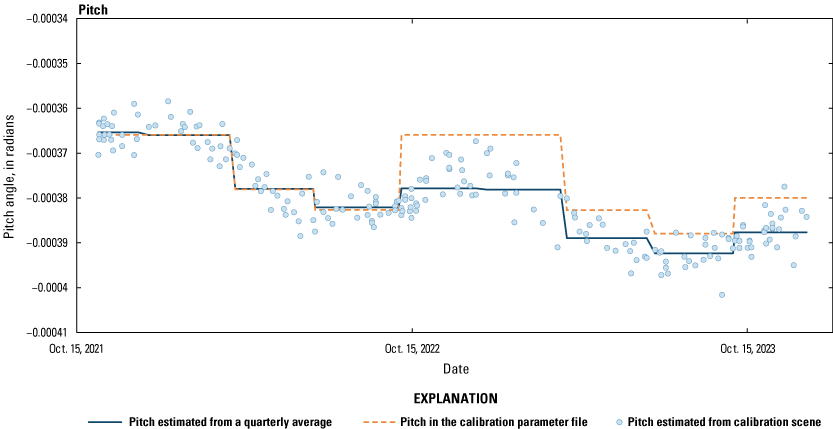
Landsat 9 Thermal Infrared Sensor to Operational Land Imager lifetime pitch alignment.
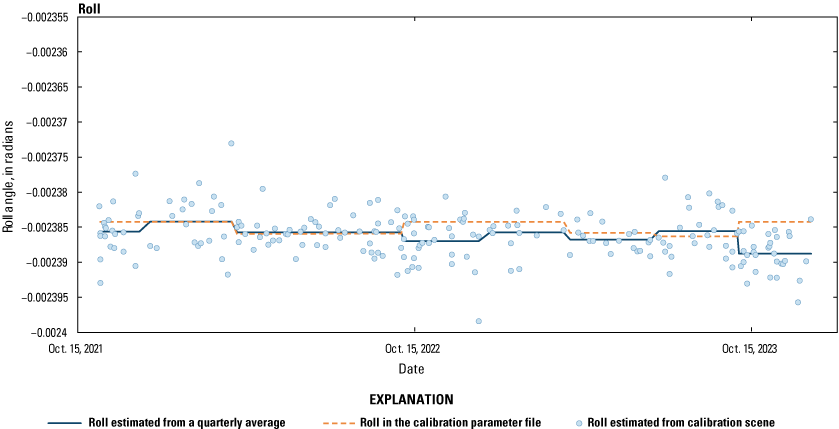
Landsat 9 Thermal Infrared Sensor to Operational Land Imager lifetime roll alignment.
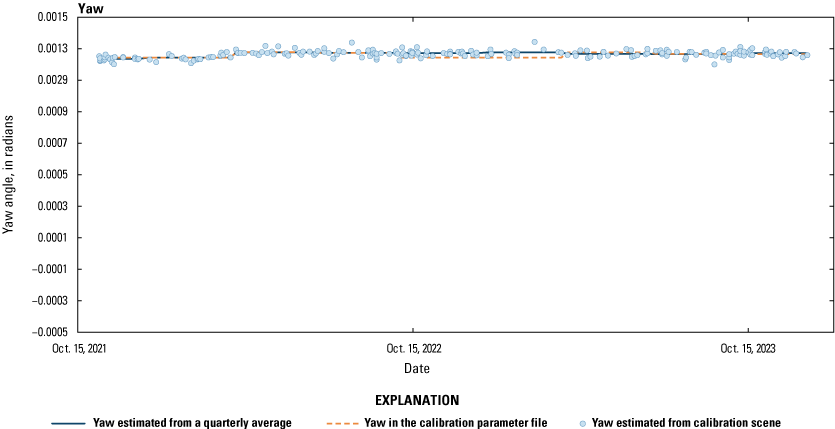
Landsat 9 Thermal Infrared Sensor to Operational Land Imager lifetime yaw alignment.
Landsat 9 Geometric Accuracy
The Landsat 9 geometric assessment evaluates the absolute positional accuracy of the image products with respect to a ground (geometric) reference. The geometric accuracy assessment estimates the geometric error between the L1TP products and GCPs using automated cross-correlation techniques (USGS, 2021d).
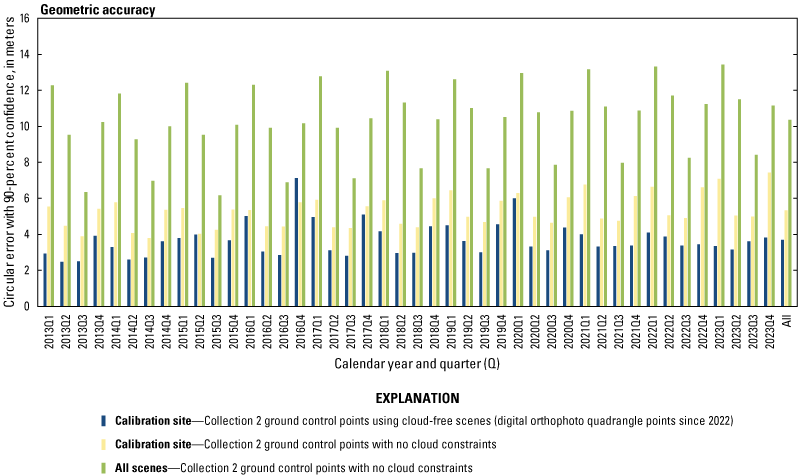
Based on analysis results, relative accuracy of the Collection 2 GCPs is comparable to the digital orthophoto quadrangle (DOQ) supersites, which are sites created from a mosaic of highly accurate high-resolution terrain-corrected aerial data. Comparatively, relative accuracy of the Collection 2 GCPs is substantially better than the internal consistency of the Collection 1 GCPs. Overall, results based on cloud-contaminated scenes are the primary contributor to poor geometric accuracy from L1TP products. Lifetime quarterly geometric accuracy at a circular error with 90-percent confidence (CE90) is shown in figure 37. Blue bars indicate the geometric accuracy estimated over DOQ supersite paths/rows (calibration sites) with cloud-free scenes, yellow bars indicate geometric accuracy estimated over supersite paths/rows with no cloud constraints using Collection 2 GCPs, and green bars indicate geometric accuracy estimated over all L1TP scenes processed in Collection 2 using Collection 2 GCPs with no cloud constraints. All results for this quarter are within the accuracy specification.
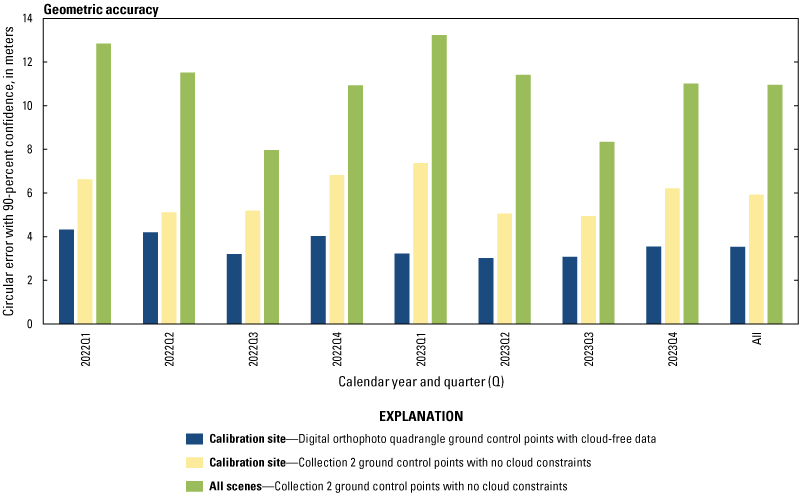
Landsat 9 lifetime geometric accuracy by quarter.
Lifetime and quarter 4, 2023, geometric accuracies for L1TP products are 3.5 and 3.6 meters when compared against cloud-free scenes over supersite paths/rows (using DOQ GCPs), 5.9 and 6.2 meters when compared against all L1TP scenes over supersite paths/rows only, and 11.0 and 11.0 meters when analyzing all the L1TP scenes processed in Collection 2, respectively. Note that seasonal effect is a factor in accuracy results.
Landsat 9 Geodetic Accuracy
The purpose of the geodetic accuracy assessment is to ensure that the Landsat 9 L0Rp data can be successfully processed into L1 systematic products that meet the system requirement of 65 meters at a CE90 horizontal accuracy. To measure the accuracy, calibration scenes are automatically correlated with data from the panchromatic band to measure the discrepancy between the known ground location and the position predicted by the OLI geometric model (USGS, 2021d).
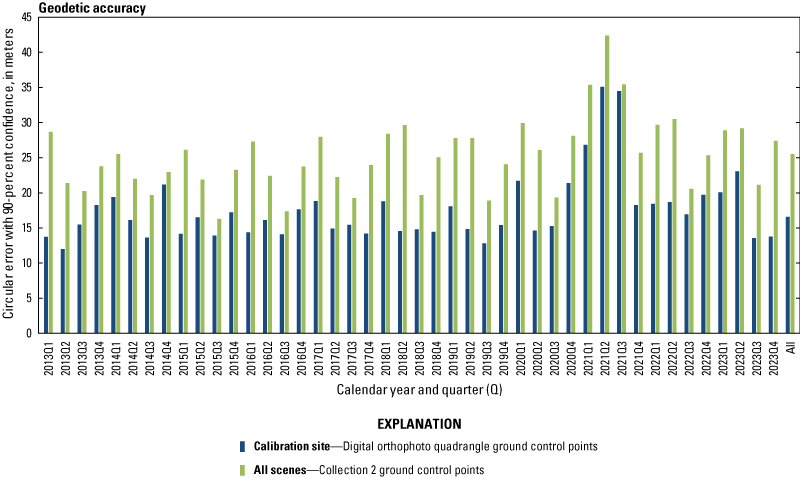
Based on analysis results, absolute accuracy of the Collection 2 GCPs is comparable to the DOQ supersites and is substantially better compared to the Collection 1 GCPs (Rengarajan and others, 2020). Lifetime quarterly geodetic accuracy (CE90) is shown in figure 38. Blue bars indicate the accuracy estimated using DOQ supersite paths/rows (calibration site), and green bars indicate accuracy estimated from all L1TP scenes processed in Collection 2 using Collection 2 GCPs. As in the case with the geometric accuracy, a wide variety of scene types (cloud contaminated, islands, desert, snow covered, ice sheets, and so on) are the primary contributor to the poor geodetic accuracy for Collection 2 GCP-based results.
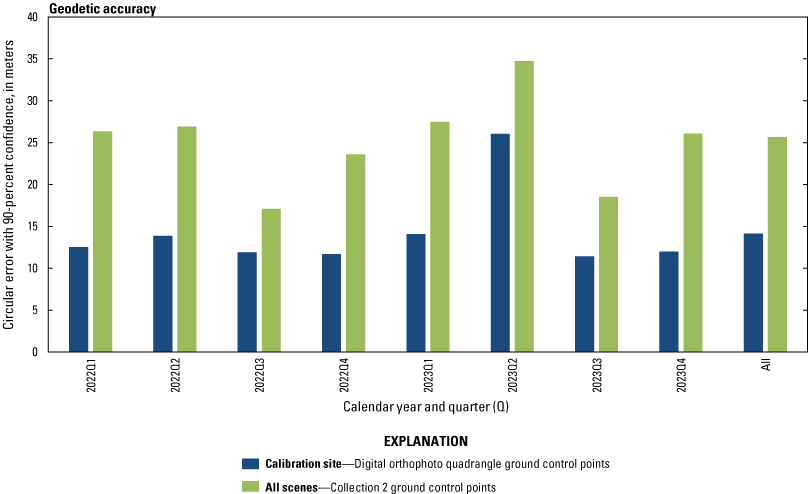
Landsat 9 lifetime geodetic accuracy by quarter.
Lifetime geodetic accuracies for systematic products are 14.2 meters when compared using DOQ GCPs over supersites and 25.7 meters when compared using Collection 2 GCPs over all the scenes processed in Collection 2, respectively.
Landsat 9 to Landsat 8 Operational Land Imager Geometric Coregistration
The Landsat 9 and Landsat 8 OLI sensors provide identical spectral and spatial characteristics. To measure the geometric coregistration, image-to-image comparisons between Landsat 9 and Landsat 8 L1TP products were assessed and the results are shown in figure 39. The image-to-image registration accuracy characterization is performed between panchromatic band image products using a correlation-based mensuration process (Choate and others, 2022). While measuring the image-to-image registration between two sensors, scene pairs were selected in such a way that temporal distance between the two scenes was no more than 32 days. The observed coregistration error between Landsat 9 and Landsat 8 L1TP products is indicated with the magenta dots. Based on analysis results, the Landsat 9 and Landsat 8 L1TP products are well coregistered to within 3 meters of the CE90 (Rengarajan and others, 2024).
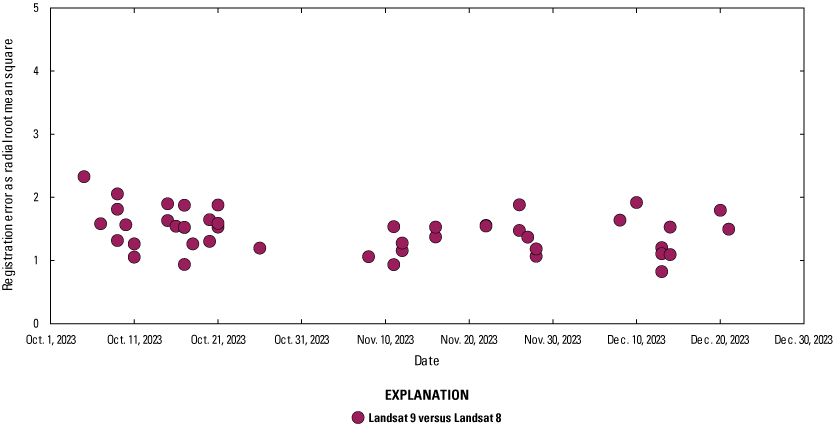
Coregistration error between Landsat 9 and Landsat 8 Level 1 terrain-corrected products, quarter 4, 2023.
Landsat 8 Radiometric Performance Summary
The Landsat 8 on-orbit radiometric performance for this reporting quarter (quarter 4, October–December 2023) meets all requirements as outlined in USGS (2019b). The quarterly OLI and TIRS radiometric performance summaries are provided in tables 5 and 6, respectively.
Table 5.
Landsat 8 Operational Land Imager radiometric performance summary, quarter 4 (October–December), 2023.[The previous quarter is quarter 3 (July–September), 2023. OLI, Operational Land Imager; <, less than; SNR, signal-to-noise ratio; Ltypical, typical radiance; -, not applicable; Lhigh, high radiance; RMS, root mean square; stdev, standard deviation; ≤, less than or equal to; W/m2 sr µm, watt per square meter per steradian per micrometer; σ, sigma; spec, specification]
From Haque and others (2024).
Table 6.
Landsat 8 Thermal Infrared Sensor radiometric performance summary, quarter 4 (October–December), 2023.[The previous quarter is quarter 3 (July–September), 2023. TIRS, Thermal Infrared Sensor; ~, approximately; <, less than; NE∆T, noise equivalent change in temperature; K, Kelvin; TBD, to be determined; RMS, root mean square; stdev, standard deviation; -, not applicable; >, greater than; W/m2 sr µm, watt per square meter per steradian per micrometer; σ, sigma; spec, specification]
From Haque and others (2024).
Landsat 8 Operational Land Imager Signal-to-Noise Ratio
The SNR for each of the OLI spectral bands is characterized at a prescribed band-specific Ltypical level, as described in table 3. The SNR of a detector at a given radiance level is defined as the mean of the measured pixel radiances acquired over a homogenous target divided by their standard deviation. A curve is fit to the SNR at the measured radiance levels and is evaluated at the prescribed Ltypical level. The SNR is characterized at multiple stages of the instrument build, culminating in the testing of the fully integrated instrument.
The Landsat 8 OLI SNR is evaluated on orbit each month. It remains consistently two to three times better than requirements and about eight times better than the Landsat 7 ETM+ SNR. The Collection 2 SNR slightly increased because of improvement in the bias calculation, further exceeding requirement thresholds. The per-band OLI median SNR at the Ltypical level (yellow bars) for December 2023, which for all bands easily exceeds the OLI SNR requirements (blue bars) by more than 50 percent, is shown in figure 40. Lifetime SNR stability at Ltypical for each OLI band is represented in figures 41, 42, 43, 44, 45, 46, 47, 48, and 49; monthly SNR values (for the detectors that have median SNRs for all bands) are denoted by the diamonds, and the uncertainties in the monthly SNR model are denoted by the error bars. The SNR for each band has remained stable over time (within the uncertainty of the models and much greater than the required levels).
Landsat 8 Operational Land Imager signal-to-noise ratio performance, December 2023.
Landsat 8 Operational Land Imager coastal/aerosol band lifetime signal-to-noise ratio stability.
Landsat 8 Operational Land Imager blue band lifetime signal-to-noise ratio stability.
Landsat 8 Operational Land Imager green band lifetime signal-to-noise ratio stability.
Landsat 8 Operational Land Imager red band lifetime signal-to-noise ratio stability.
Landsat 8 Operational Land Imager near infrared band lifetime signal-to-noise ratio stability.
Landsat 8 Operational Land Imager shortwave infrared 1 band lifetime signal-to-noise ratio stability.
Landsat 8 Operational Land Imager shortwave infrared 2 band lifetime signal-to-noise ratio stability.
Landsat 8 Operational Land Imager cirrus band lifetime signal-to-noise ratio stability.
Landsat 8 Operational Land Imager panchromatic band lifetime signal-to-noise ratio stability.
Landsat 8 Thermal Infrared Sensor Noise Performance
Noise can be defined as variation in the detected signal over time when observing a stable source of radiation. For thermal sensors, noise is usually expressed in terms of a change in brightness temperature (that is, NEΔT). NEΔT is estimated as the standard deviation of detector data acquired over a uniform radiance source and then converted to temperature. Noise performance is completed on blackbody and deep space TIRS data (Montanaro and others, 2014).
All Landsat 8 TIRS detectors have similar NEΔT. At 300 K, band-average noise performance for both thermal bands is about eight times better than the requirement (less than 0.4 K) and about four times better than the NEΔT of the Landsat 7 ETM+ thermal band at that same temperature. Lifetime averages of NEΔT at 300 K for TIRS band 10 are shown in figure 50, and the same averages for TIRS band 11 are shown in figure 51. In both figures, colored diamonds are used to indicate the observed NEΔT values as measured over time.
Landsat 8 Thermal Infrared Sensor band 10 lifetime noise performance.
Landsat 8 Thermal Infrared Sensor band 11 lifetime noise performance.
Landsat 8 Radiometric Stability
Radiometric stability of an instrument is fundamental to low uncertainty in the radiometric calibration of data products generated from its measurements. The radiometric response stability is characterized for all OLI and TIRS bands using the instruments’ responses to signals from the onboard calibration devices collected over time (USGS, 2021d). The bias and gain stability of an instrument are contributing factors to variability within a radiometrically calibrated product.
The Landsat 8 per-band OLI radiometric stability over the lifetime of the instrument is shown in figures 52, 53, 54, 55, 56, 57, 58, 59, and 60. Within each figure, the x-axis represents years since launch (February 11, 2013), and the y-axis represents the response relative to mission day 75. The solid brown line (figs. 52 and 53) represents the gain model used over time, which is derived from the OLI response to the stimulation lamps, solar panels, and lunar collects; it is only shown for the bands with responsivity (gain) determined to be slowly changing over time (coastal/aerosol [CA] and blue bands). For the remaining bands, response changes were minuscule until the safehold events in November 2020. More information about the Landsat 8 safehold events is available at https://www.usgs.gov/landsat-missions/november-19-2020-landsat-8-data-availability-update-recent-safehold-events. These observations indicate high radiometric stability of the instrument over its lifetime. Data derived from bands that have changed responsivity are corrected during product generation, so final products are not affected.
Landsat 8 Operational Land Imager coastal/aerosol band lifetime radiometric stability.
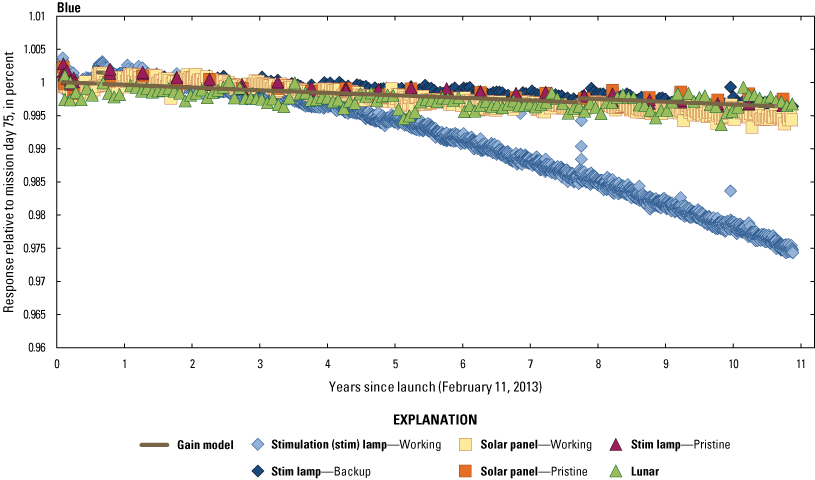
Landsat 8 Operational Land Imager blue band lifetime radiometric stability.
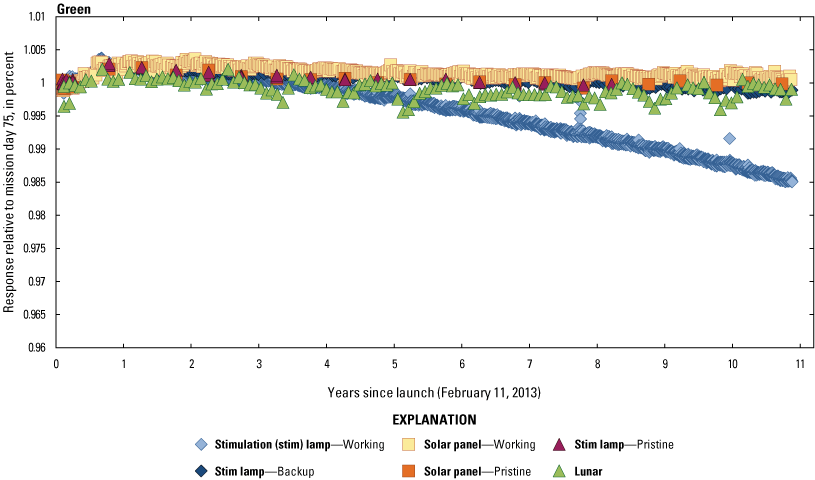
Landsat 8 Operational Land Imager green band lifetime radiometric stability.
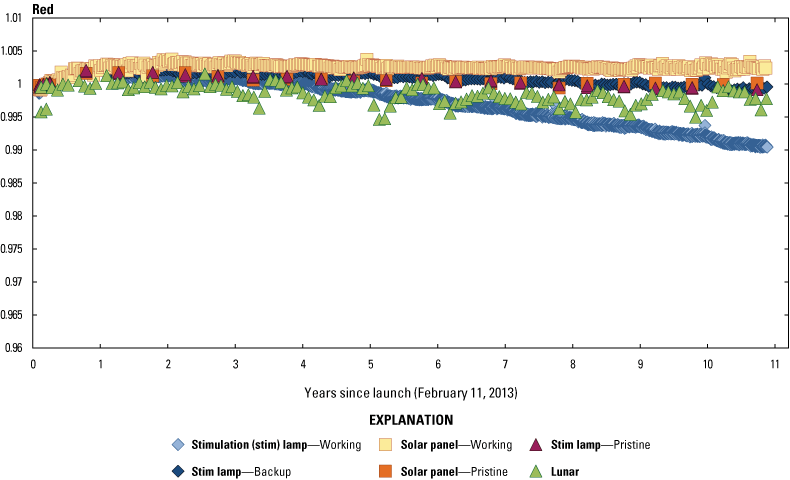
Landsat 8 Operational Land Imager red band lifetime radiometric stability.
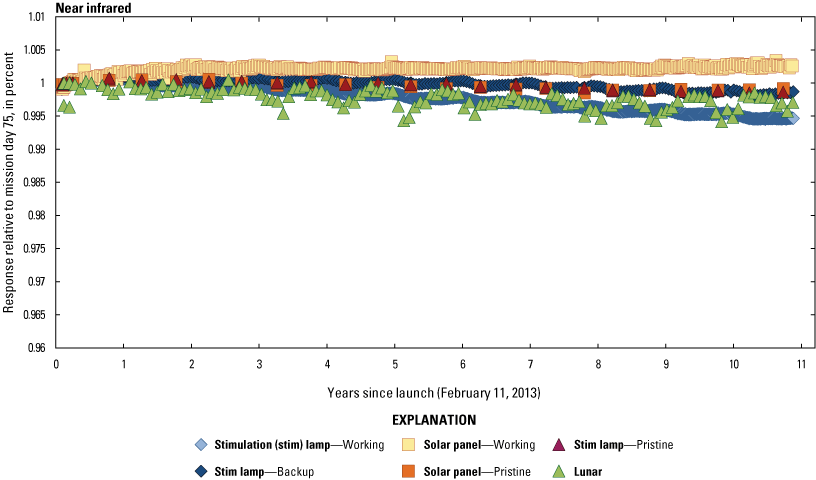
Landsat 8 Operational Land Imager near infrared band lifetime radiometric stability.
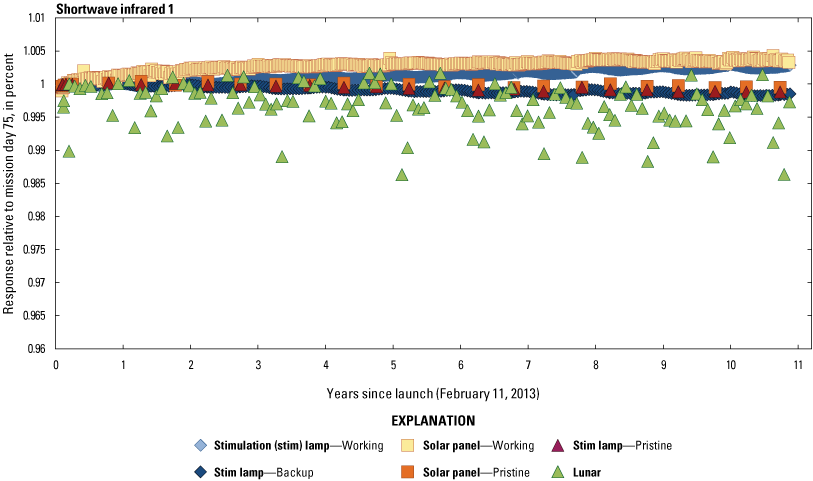
Landsat 8 Operational Land Imager shortwave infrared 1 band lifetime radiometric stability.
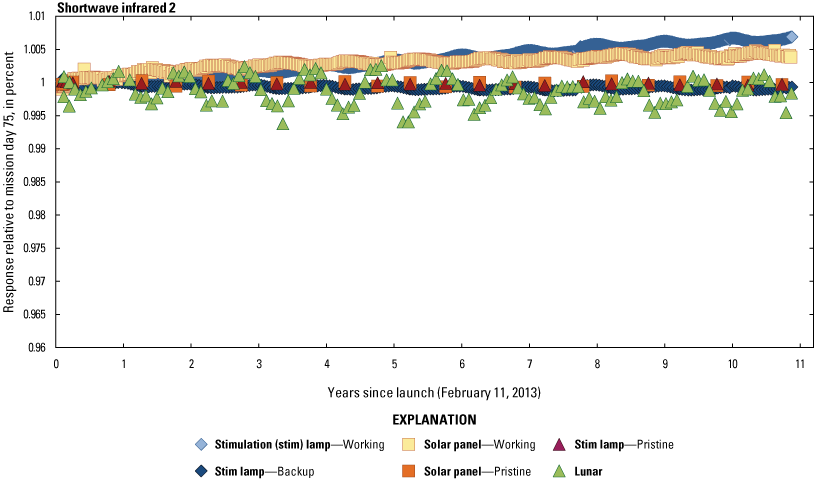
Landsat 8 Operational Land Imager shortwave infrared 2 band lifetime radiometric stability.

Landsat 8 Operational Land Imager panchromatic band lifetime radiometric stability.
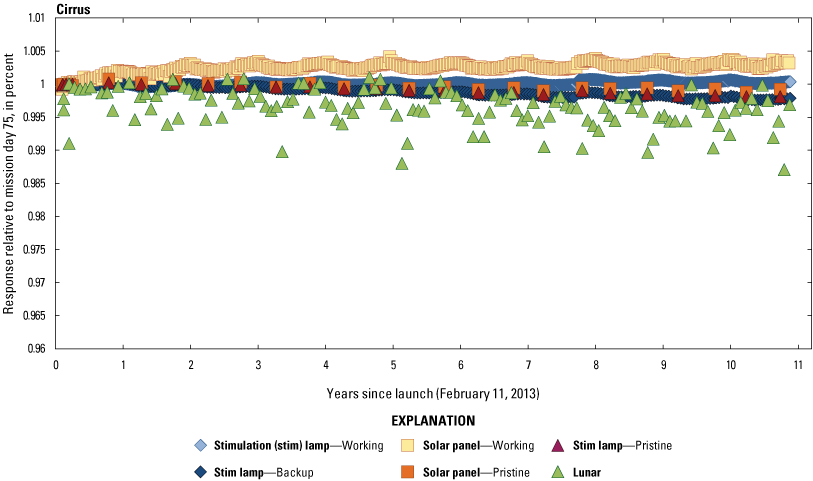
Landsat 8 Operational Land Imager cirrus band lifetime radiometric stability.
From Micijevic and others (2021), the stability of the Landsat 8 TIRS side A electronics that were used for the first ~700 days of the mission is shown in figures 61 and 62. During that period, TIRS gains changed by about 0.2 and 0.1 percent per year for bands 10 and 11, respectively. These trends reduced on the side B electronics to about 0.05 and 0.01 percent until the two safehold events in November 2020, as shown in figures 63 and 64, respectively. After the safehold events, TIRS responsivity has gradually decreased ~3.2 and ~6.2 percent for bands 10 and 11, respectively. Note that the response degradation is modeled and corrected to within 0.5-percent uncertainty in the L1 products.
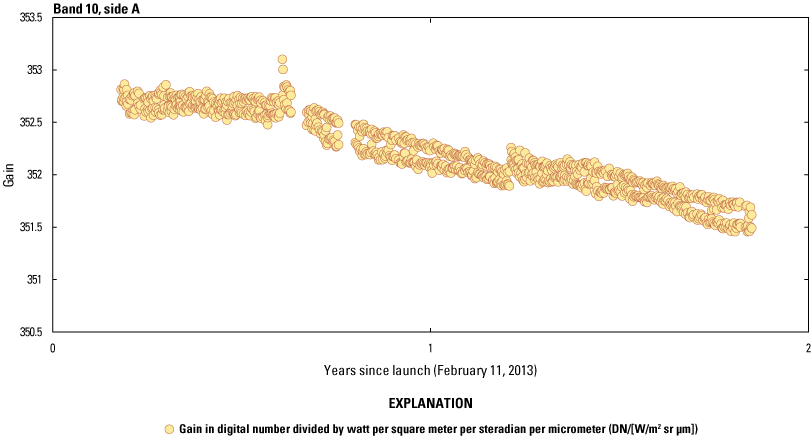
Landsat 8 Thermal Infrared Sensor band 10 radiometric stability (side A) for the first approximately 700 days of the mission (from Micijevic and others [2021]).
Landsat 8 Thermal Infrared Sensor band 11 radiometric stability (side A) for the first approximately 700 days of the mission (from Micijevic and others [2021]).
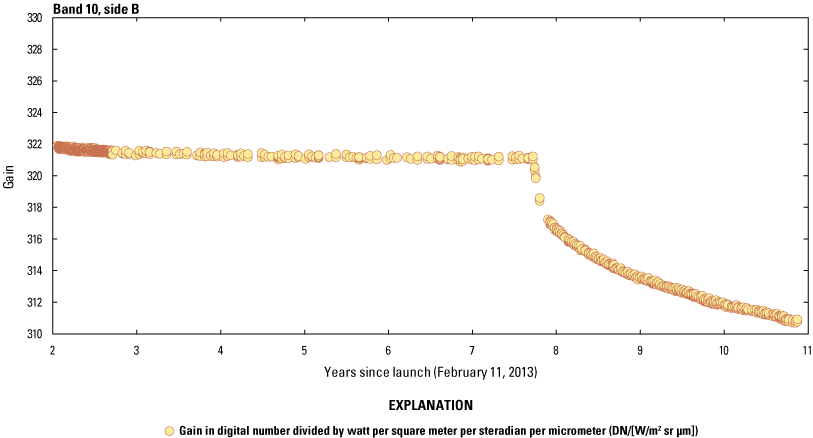
Landsat 8 Thermal Infrared Sensor band 10 radiometric stability (side B).
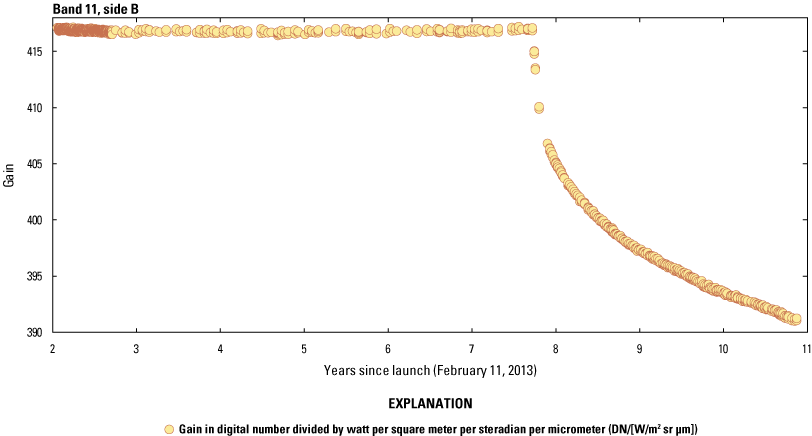
Landsat 8 Thermal Infrared Sensor band 11 radiometric stability (side B).
Since January 2021, Landsat 8 TIRS onboard calibrator acquisitions have been collected on a weekly basis (instead of once every ~2 weeks) to better monitor the degradation in response observed after the safehold events. Weekly calibration acquisitions are planned into the future if the response degradation trend continues and if geometric and radiometric accuracies are not negatively affected by the increased acquisition frequency.
Landsat 8 Absolute Radiometric Calibration
Absolute radiometric calibration is established on the ground before launch and transferred to orbit using the solar diffuser for OLI and the blackbody for TIRS. Onboard calibrators and PICS (Committee on Earth Observation Satellites, 2021) are used to monitor changes in absolute calibration, and vicarious methods are used to check absolute calibration over time (USGS, 2021d). Updates can be made to the calibration parameters used in processing the data to L1 when a substantial change is detected in the calibrator trends.
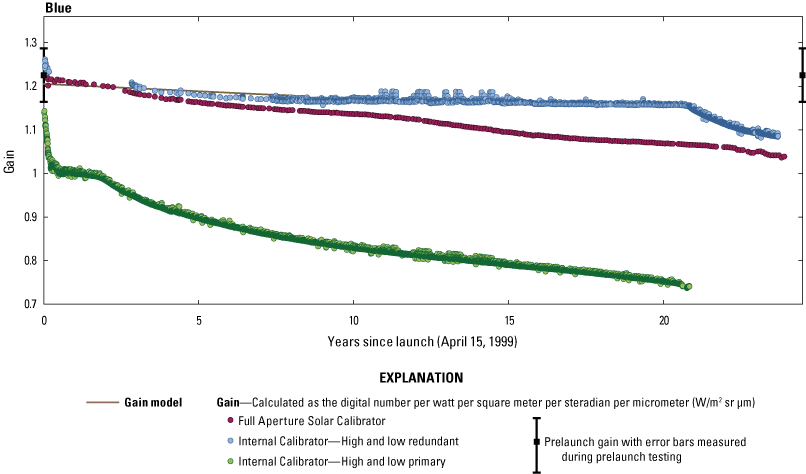
The lifetime effect of Landsat 8 OLI gain updates is shown in figure 65. A slow decay in coastal/aerosol (CA) and blue band calibration response was observed (figs. 52 and 53, respectively). The absolute radiometric calibration for the CA band has been actively modeled since April 2015, and an update to the calibration parameters was implemented for the blue band in April 2017. In April 2018, it was determined that the response to the working stimulation lamp was diverging from the other calibrators, and the working stimulation lamp was removed from the model that generates the gain updates. Similarly, in October 2019, the working diffuser was removed from the gain model because of diverging trends. In both cases, the new estimates of the radiometric gain were only applied to newly acquired data. When the archive was reprocessed for Collection 2, the updated gains were applied to all data, which changed the calibrated response in the CA and blue bands by as much as 0.15 percent compared to the Collection 1 products (Micijevic and others, 2021). The safehold events in November 2020 caused small changes to the Landsat 8 OLI response, as reflected in figure 26 by the small, systematic error adjustments that were made to the gain models. In July 2021, the CPF was updated to account for as much as a 0.12-percent step change in OLI responsivity caused by the November 2020 safehold events (Micijevic and others, 2022).
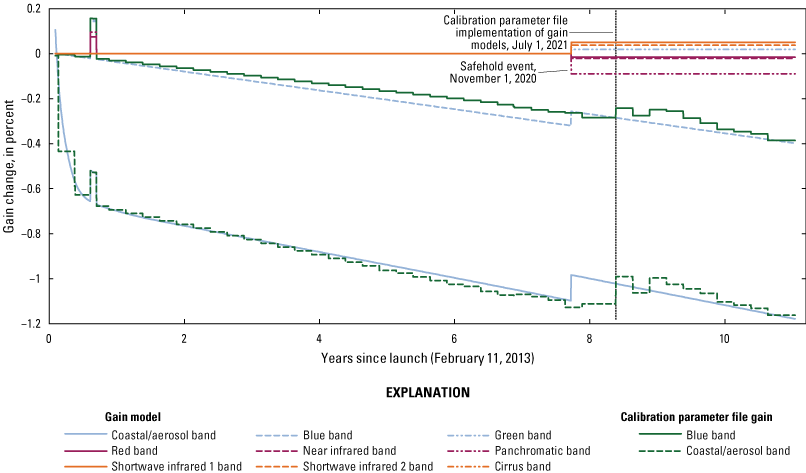
Landsat 8 Operational Land Imager lifetime gain trends and calibration gain updates.
The effect of change in average gain for Landsat 8 TIRS bands 10 and 11 since the safehold event on November 1, 2020, is shown in figure 66. The orange line is a modeled gain trend for band 10 based on the Internal Calibrator data (fig. 63), and the blue line is the gain trend sampled into calibration parameters that ensure there is no more than a 0.5-percent band-average radiometric gain change over the CPF period in the L1 products. Likewise, for band 11, the magenta line in figure 66 is a modeled gain trend based on the Internal Calibrator data (fig. 64), and the yellow line is the gain trend sampled into calibration parameters. Because of the relatively sharp decrease in response shortly after the safehold events, when compared with the response before the safehold events, calibration parameters were issued more frequently to ensure high quality L1 products. As the rate of degradation has slowed, updated calibration parameters have returned to quarterly issuance.
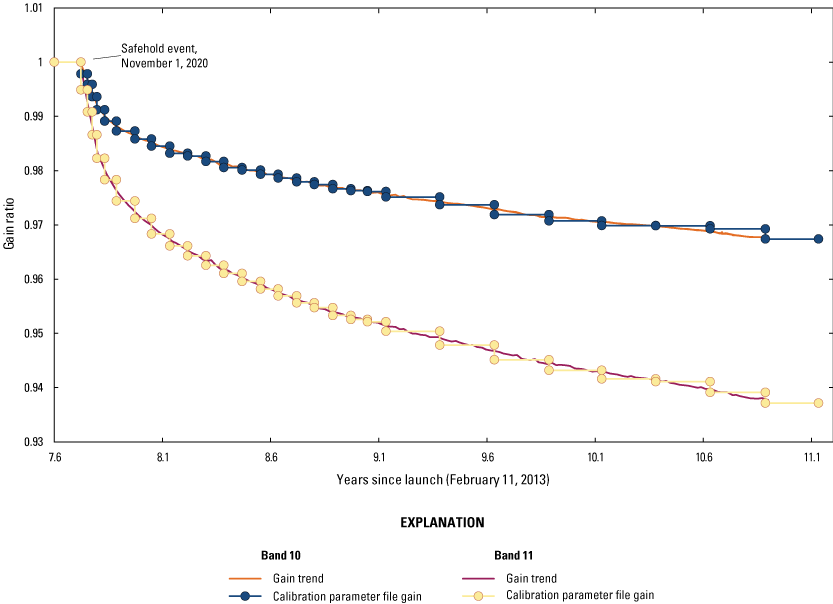
Landsat 8 Thermal Infrared Sensor gain degradation since the safehold event on November 1, 2020.
Landsat 8 Relative Gains
Relative gains account for the differences in responsivity between detectors within a spectral band. OLI relative gains are monitored using solar diffuser acquisitions, side slither acquisitions (which entail a 90-degree yaw maneuver over an invariant site to flatten the data), and scene statistics. Quarterly updates are completed using data from the solar diffuser acquisitions from quarter 3 (July–September), 2023. Starting with the release of Collection 2, TIRS relative gain calibration updates also were completed quarterly using blackbody collects from the previous quarter. These calibration updates removed detector-to-detector striping (USGS, 2021d).
Typical per-detector changes in relative gains between the previous quarter and this quarter for several bands are shown in figures 67, 68, 69, and 70 by analyzing data from within each quarter. In each figure, the x-axis indicates the detector number, and the y-axis indicates the change in relative gain between the quarters as a ratio. These changes in responsivity are accounted for in the L1 product by updating the following quarter’s CPF.
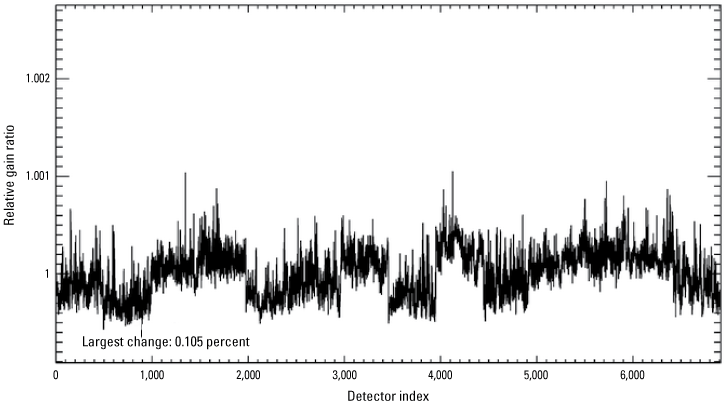
Landsat 8 Operational Land Imager coastal/aerosol band per-detector change in relative gains between quarter 3 and quarter 4, 2023.
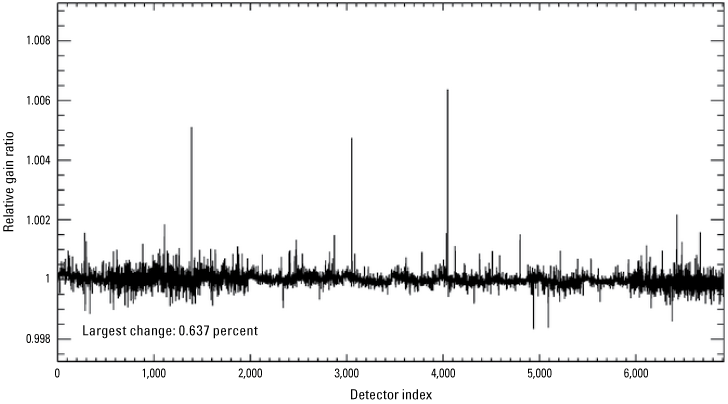
Landsat 8 Operational Land Imager shortwave infrared 1 band per-detector change in relative gains between quarter 3 and quarter 4, 2023.
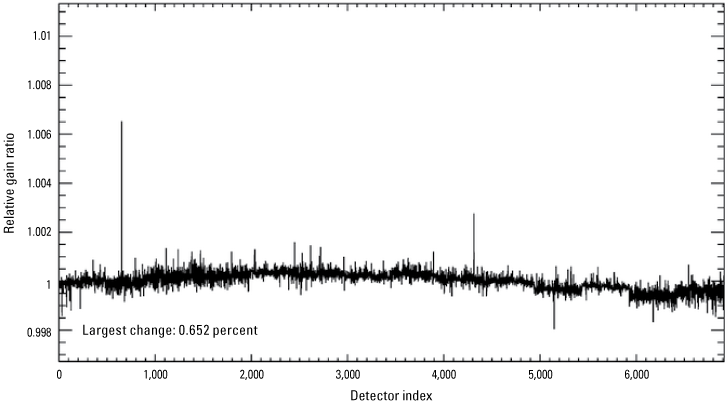
Landsat 8 Operational Land Imager shortwave infrared 2 band per-detector change in relative gains between quarter 3 and quarter 4, 2023.
Landsat 8 Operational Land Imager panchromatic band per-detector change in relative gains between quarter 3 and quarter 4, 2023.
The OLI detectors that have indicated a sudden change in responsivity of 0.5 percent or greater in the SWIR 1 and SWIR 2 bands since launch are shown in figures 71 and 72. The x-axis indicates the date of the jump in responsivity, and the y-axis signifies the detector number. The observed responsivity jumps seem to be randomly scattered in time and location on the focal plane so do not seem to be associated with an instrument event or failure. These jumps are only observed in the SWIR bands (SWIR 1, SWIR 2, and cirrus); the visible and near infrared band detectors have not indicated any jump behavior over the whole mission.
Landsat 8 Operational Land Imager shortwave infrared 1 lifetime jumps in detector responsivity.
Landsat 8 Operational Land Imager shortwave infrared 2 lifetime jumps in detector responsivity.
Landsat 8 Geometric Performance Summary
The Landsat 8 on-orbit geometric performance for the reporting quarter (quarter 4, October–December 2023) meets all requirements as outlined in USGS (2019b), with the exception of OLI band registration accuracy (all bands). The registration accuracy offset for all bands slightly exceeds the required value, but the offset easily meets the required value when excluding the cirrus band. The quarterly results summary is provided in table 7.
Table 7.
Landsat 8 geometric performance summary, quarter 4 (October–December), 2023.[The previous quarter is quarter 3 (July–September), 2023. OLI, Operational Land Imager; <, less than; LE90, linear error with 90-percent confidence; CE90, circular error with 90-percent confidence; L1T, Level 1 terrain-corrected product; >, greater than; TIRS, Thermal Infrared Sensor]
From Haque and others (2024).
Landsat 8 Band Registration Accuracy
Internal band registration measures how accurately the various Landsat 8 spectral bands are geometrically aligned to each other. The assessment provides a numerical evaluation of the accuracy of the band registration within an image using automated cross-correlation techniques between the bands to be assessed (USGS, 2021d).
Landsat 8 OLI band registration performance has been stable over time. Quarterly band-to-band maximum registration accuracy for each band combination except for the cirrus band is shown in figure 73. Within the figure, blue bars indicate maximum registration accuracy in the line direction, and green bars indicate maximum registration accuracy in the sample direction. Lifetime OLI band registration accuracy for all bands is 4.2 meters (not shown), and lifetime OLI band registration accuracy for all bands, excluding cirrus, is 3.3 meters, which is well within the instrument specification accuracy. OLI band registration accuracy for all bands during quarter 4, 2023, is 4.66 meters (table 7), and OLI band registration accuracy for all bands, excluding cirrus, during quarter 4, 2023, is 3.16 meters (table 7).
Landsat 8 Operational Land Imager lifetime band (excluding cirrus) registration accuracy by quarter.
Landsat 8 TIRS band registration performance has been stable throughout the instrument’s lifetime, including after changes in Scene Select Mechanism (SSM) operation beginning in December 2014. Behavior is well within specification, as shown in figure 74, and quarter 4, 2023, results are consistent with past performance. Within the figure, blue bars indicate maximum registration accuracy in the line direction, and green bars indicate maximum registration accuracy in the sample direction. Lifetime TIRS band registration accuracy is 9.0 meters, and during quarter 4, 2023, the accuracy is 9.5 meters (table 7). Since quarter 3 (July–September), 2020 (Collection 2 data), registration bias between the line and sample directions has reduced, which may be because of better SSM pointing stability, the TIRS relative gain update, or both.
Landsat 8 Thermal Infrared Sensor lifetime band registration accuracy by quarter.
Lifetime Landsat 8 TIRS to OLI band registration accuracy by quarter is shown in figure 75. Before the Collection 2 CPF update, seasonal effects are noticeable but leveled off after the release of Collection 2 in December 2020, as indicated by the closely aligned line (blue bars) and sample (green bars) accuracies. Lifetime Landsat 8 TIRS to OLI registration accuracy (excluding the cirrus band) is 19.6 meters in the line direction and 18.0 meters in the sample direction. Quarter 4, 2023, TIRS to OLI registration accuracy (excluding the cirrus band) is 20.1 meters in the line direction and 18.0 meters in the sample direction.
Landsat 8 Thermal Infrared Sensor to Operational Land Imager lifetime band (excluding cirrus) registration accuracy by quarter.
Landsat 8 Operational Land Imager to Thermal Infrared Sensor Alignment
Landsat 8 OLI to TIRS alignment knowledge is critical to ensure that the L1 product accuracy requirements can be met. The alignment between OLI and TIRS instruments is periodically measured using correlation-based methods to ensure that the band-to-band alignment requirements for all Landsat 8 bands can be met (USGS, 2021d). The alignment estimates are used to update the calibration parameters in the CPFs when the observed changes are determined to affect the performance requirements.
Landsat 8 TIRS to OLI pitch alignment measurements over instrument lifetimes are shown in figure 76. The November 2020 safehold events did substantially affect pitch alignment, but the ECCOE Landsat Cal/Val Team continues to monitor pitch alignment. From Haque and others (2022), in quarter 4, 2021, a small change in the TIRS to OLI pitch alignment was observed, which is similar to the seasonal trend observed in previous years; however, the magnitude of this trend was not the same as before, so it was unclear whether this new trend would continue. The trend continued in quarter 1, so a CPF update was issued in quarter 2, 2022, for residual corrections to the alignment parameters. At this point of time, predictive estimates based on previous quarters, not knowing if the seasonal trend will be observed or not, made the CPF inconsistent with the seasonal pattern. With an intention to align the CPF more with the seasonal pattern for better prediction, subsequent predictive CPF updates for quarter 3, 2022; quarter 4, 2022; and quarter 1, 2023, were not changed. Based on previously observed seasonal patterns in the alignment trend, a TIRS-OLI alignment update was made for quarter 2, 2023, and unchanged for quarter 3, 2023. The April 2023 TIRS SSM excursion anomaly did not indicate any substantial effects in the TIRS to OLI pitch alignment. The lifetime TIRS to OLI roll alignment is shown in figure 77, and the lifetime TIRS to OLI yaw alignment is shown in figure 78. The April 2023 TIRS SSM excursion anomaly did not indicate any substantial effects to roll or yaw alignment. Each light blue symbol on these figures represents one calibration scene, the dark blue solid lines indicate quarterly alignment averages, and the orange dashed lines indicate applied Collection 2 CPF correction values.
Landsat 8 Thermal Infrared Sensor to Operational Land Imager lifetime pitch alignment.
Landsat 8 Thermal Infrared Sensor to Operational Land Imager lifetime roll alignment.
Landsat 8 Thermal Infrared Sensor to Operational Land Imager lifetime yaw alignment.
Landsat 8 Geometric Accuracy
The Landsat 8 geometric assessment evaluates the absolute positional accuracy of the image products with respect to a ground (geometric) reference. The geometric accuracy assessment estimates the geometric error between the L1TP products and GCPs using automated cross-correlation techniques (USGS, 2021d).
Based on analysis results, relative accuracy of the Collection 2 GCPs is comparable to the DOQ supersites, which are sites created from a mosaic of highly accurate high-resolution terrain-corrected aerial data. Comparatively, relative accuracy of the Collection 2 GCPs is substantially better than the internal consistency of the Collection 1 GCPs. Overall, cloud contaminated scene-based results are the primary contributor to poor geometric accuracy from L1TP products. Lifetime quarterly Landsat 8 geometric accuracy at a CE90 is shown in figure 79. Blue bars indicate the geometric accuracy estimated over supersite paths/rows (calibration sites) with cloud-free scenes (using DOQ GCPs for the trend since quarter 1 [January–March], 2022), yellow bars indicate geometric accuracy estimated over supersite paths/rows (calibration site scenes subsetting from all the L1TP scenes with no cloud constraints) using Collection 2 GCPs, and green bars indicate geometric accuracy estimated over all L1TP scenes processed in Collection 2 using Collection 2 GCPs (no cloud constraints). All results for this quarter are within the accuracy specification.
Landsat 8 lifetime geometric accuracy by quarter.
Lifetime and quarter 4, 2023, geometric accuracies for L1TP products are 3.7 and 3.8 meters when compared against cloud-free scenes over supersite paths/rows, 5.3 and 7.4 meters when compared against all L1TP scenes over supersite paths/rows only, and 10.4 and 11.1 meters when analyzing all the L1TP scenes processed in Collection 2, respectively. Note that seasonal effect is a factor in accuracy results.
Landsat 8 Geodetic Accuracy
The purpose of the geodetic accuracy assessment is to ensure that the Landsat 8 L0Rp data can be successfully processed into L1 systematic products that meet the system requirement of 65 meters at a CE90 horizontal accuracy. To measure the accuracy, calibration scenes are automatically correlated with data from the panchromatic band to measure the discrepancy between the known ground location and the position predicted by the OLI geometric model (USGS, 2021d).
Based on analysis results, absolute accuracy of the Collection 2 GCPs is comparable to the DOQ supersites and is substantially better compared to the Collection 1 GCPs (Rengarajan and others, 2020). Lifetime quarterly Landsat 8 geodetic accuracy (CE90) is shown in figure 80. Blue bars indicate the accuracy estimated using DOQ supersite paths/rows (calibration site), and green bars indicate accuracy estimated from all L1TP scenes processed in Collection 2 using Collection 2 GCPs. As in the case with the geometric accuracy, a wide variety of scene types (cloud contaminated, islands, desert, snow covered, ice sheets, and so on) are the primary contributor to the poor geodetic accuracy for Collection 2 GCP-based results.
Landsat 8 lifetime geodetic accuracy by quarter.
Although quarters 1, 2, and 3, 2021, indicated a slight increase in the geodetic accuracy offset, the lifetime results have been consistently well within the accuracy specification. The increase in the geodetic accuracy is because of a systematic bias in the along-track direction observed since the November 2020 safehold events. After the bias stabilized, an update to the sensor alignment parameters in the CPF was released in quarter 4, 2021, resulting in a decrease in the observed geodetic offsets. An additional sensor alignment update was released in quarter 2, 2022, in response to an along-track offset that was greater than 10 meters and continuing to increase (Haque and others, 2023b). Geodetic accuracy has been within 10 meters (considering both along-track and across-track directions) since then, including after the April 2023 TIRS SSM excursion anomaly (USGS, 2023), and no sensor alignment update was necessary. Lifetime geodetic accuracies for systematic products are 16.6 meters when compared using DOQ GCPs over supersites and 25.5 meters when compared using Collection 2 GCPs over all the scenes processed in Collection 2, respectively.
Landsat 7 Radiometric Performance Summary
The Landsat 7 on-orbit radiometric performance for this reporting quarter (quarter 4, October–December 2023) was fully characterized and the details are summarized in this section.
Landsat 7 Onboard Calibrator Trends
The ETM+ has three onboard calibration devices: the Internal Calibrator, the Partial Aperture Solar Calibrator, and the Full Aperture Solar Calibrator. These calibration devices have been used to monitor radiometric stability since launch (April 15, 1999; Markham and others, 1994; Barsi and others, 2016; USGS, 2019a).
The responsivity of the ETM+ as determined from the onboard calibrators is shown in figure 81 for the blue band and figure 82 for the SWIR 1 band. The three calibrators all indicate degradation over time, although at varying rates that changed at different times. The degradation shown here is thought to be primarily within the calibrators and not because of the ETM+ detectors or electronics (Markham and others, 2012). Furthermore, preliminary analyses indicate no substantial change in response after a series of orbit-lowering maneuvers, beginning on April 6, 2022. Additional information about the Landsat 7 orbit lowering is available at https://www.usgs.gov/centers/eros/news/landsat-7-lowered-standard-landsat-orbit.
Landsat 7 Enhanced Thematic Mapper Plus blue band lifetime gains.
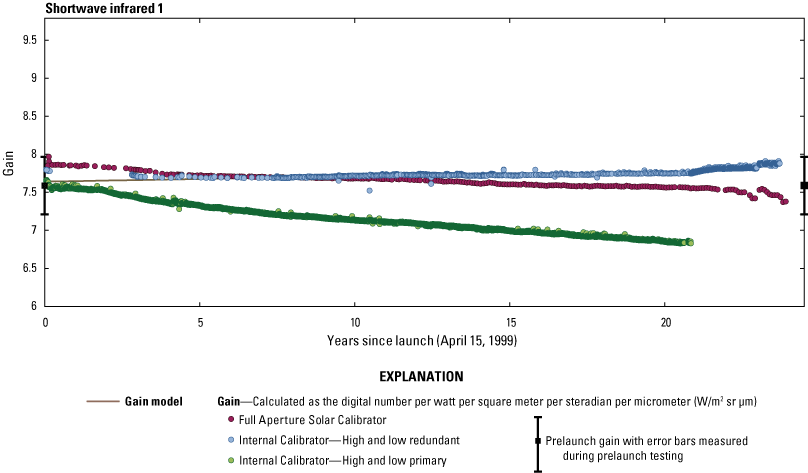
Landsat 7 Enhanced Thematic Mapper Plus shortwave infrared 1 band lifetime gains.
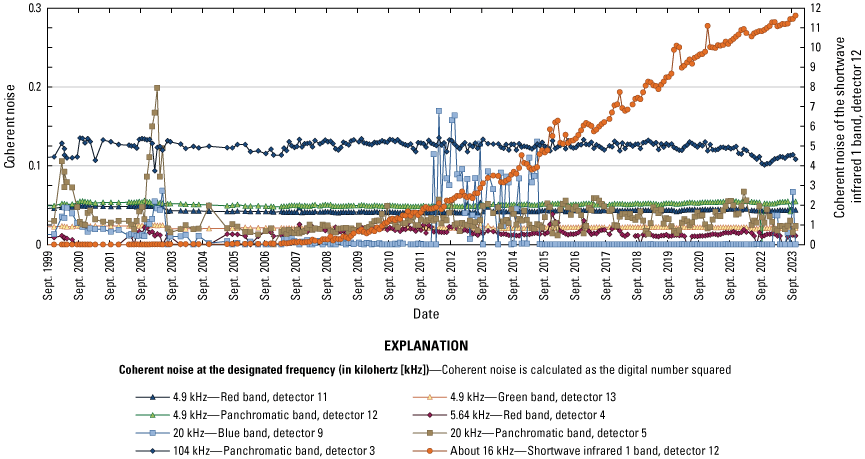
Landsat 7 Coherent Noise
Coherent noise in the ETM+ has been monitored since launch using a fast Fourier transform on dark nighttime data (Barsi and others, 2016). The Landsat 7 lifetime coherent noise results for specific band and detector combinations at designated frequencies are shown in figure 83. Magnitudes of most coherent noise components remain low, but a positive trend in coherent noise power of SWIR 1 (band 5) detector 12 (orange circles) has been observed. In this SWIR 1 detector 12 case, noise power decreases with instrument on time along an interval, so scenes acquired earlier in an interval are subject to stronger coherent noise features. In 2010, only the first few scenes acquired in an interval were affected by the coherent noise, but by 2015, the noise was strong enough that it was still present as many as 15 minutes later (fig. 83).
Landsat 7 Enhanced Thematic Mapper Plus lifetime coherent noise.
Landsat 7 Pseudoinvariant Calibration Sites Trending
PICS also are used to monitor the ETM+ radiometric stability. Several of the PICS regions (Committee on Earth Observation Satellites, 2021) defined by CNES were used to develop a new gain model for ETM+, which was applied starting in 2013 (USGS, 2021c). The Cal/Val Team uses multiple PICS for monitoring radiometric changes because of the temporal stability of those sites (Tuli and others, 2019). PICS trending calculates basic statistics from geographic ROIs extracted from geometrically corrected Landsat products. The primary purpose for trending is to repeatedly characterize PICS, save results to the database, and thus enable an automatic monitoring of ETM+ temporal stability.
The lifetime top of atmosphere reflectance values observed over the Libya 4 PICS site (lat 28.55° N., long 23.39° E.) using the CNES ROI are shown in figure 84. The lifetime temporal trends show seasonal effects, which are more substantial in the longer wavelength SWIR bands. After the seasonal effect is removed, a slight indication of deviation from current trends is observed; the deviation is in the negative direction for all bands. Because of uncontrolled orbital drifting, the Bidirectional Reflectance Distribution Function effect is more substantial in recent top of atmosphere reflectance trending.
Libya 4 pseudoinvariant calibration site top of atmosphere reflectance trending normalizing/correcting seasonality effects, Collection 2.
Landsat 7 Geometric Performance Summary
The Landsat 7 on-orbit geometric performance for this quarter (quarter 4, October–December 2023) meets all requirements as outlined in USGS (2019a). The quarterly results summary is provided in table 8.
Table 8.
Landsat 7 geometric performance summary, quarter 4 (October–December), 2023.[The previous quarter is quarter 3 (July–September), 2023. ETM+, Enhanced Thematic Mapper Plus; <, less than; σ, sigma; L1T, Level 1 terrain-corrected product]
From Haque and others (2024).
Landsat 7 Geodetic Accuracy
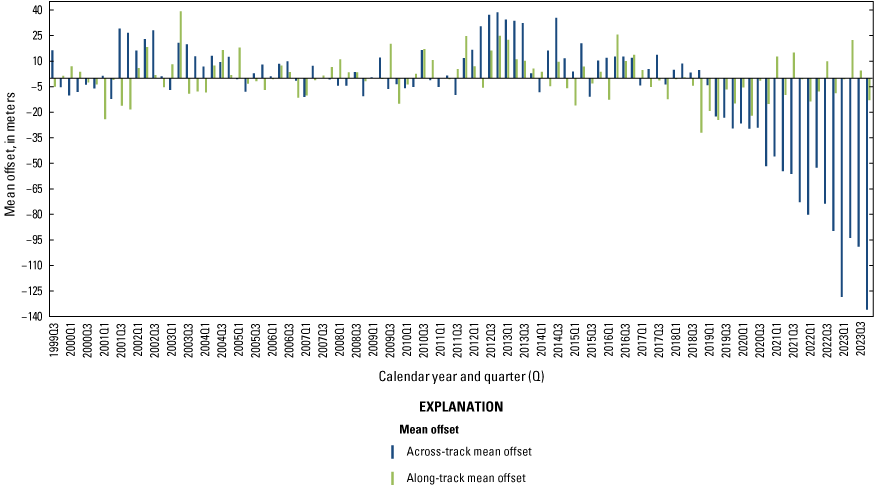
The purpose of the geodetic accuracy assessment is to ensure that the Landsat 7 L0Rp data can be successfully processed into L1 systematic products that meet the system requirement of 250-meter (1σ) accuracy, excluding terrain effects and without the use of GCPs. Geodetic accuracy is monitored using calibration supersites containing GCPs derived from the DOQ aerial photography (U.S. supersites) and Satellite Pour l’Observation de la Terre (SPOT) satellite imagery (Australian supersites).
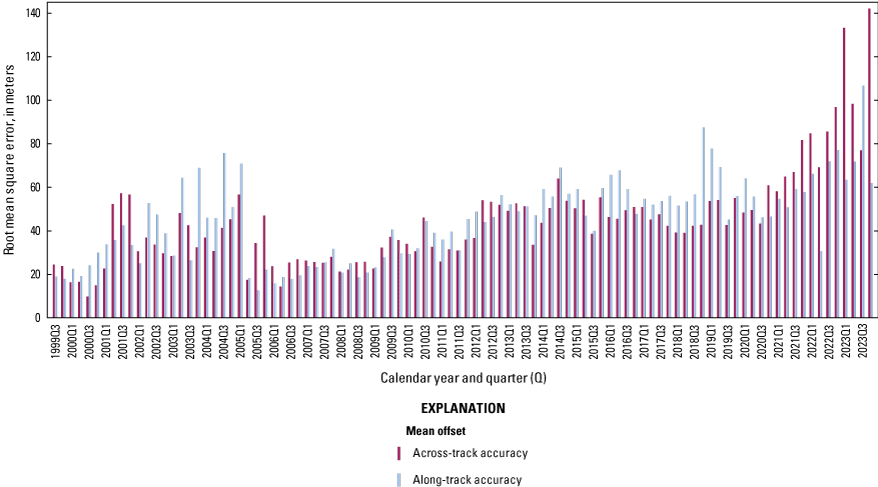
The lifetime quarterly mean offsets for Landsat 7 are shown in figure 85. Within the figure, the blue bars indicate the across-track mean offset, and the green bars indicate the along-track mean offset. As of quarter 4 (October–December), 2023, this across-track offset has exceeded 135 meters.
Landsat 7 lifetime mean offsets per quarter.
The lifetime quarterly geodetic accuracy for Landsat 7 is shown in figure 86. The figure shows the expected geodetic accuracy of a systematic product. Magenta bars indicate the across-track root mean square error (RMSE), and light blue bars indicate the along-track RMSE. As of quarter 4 (October–December), 2023, this across-track offset has exceeded 142 meters. The along-track offset has exceeded 61 meters, with an even greater offset of 106 meters measured in quarter 2, 2023 (Haque and others, 2023a).
Landsat 7 lifetime geodetic accuracy per quarter.
Landsat 7 Band Registration Accuracy
Internal band registration measures how accurately the various Landsat 7 spectral bands are aligned to each other. The assessment provides a numerical evaluation of the accuracy of the band registration within an image using automated cross-correlation techniques between the bands to be assessed (USGS, 2021d).
The per-band average RMSE since launch is shown in figure 87. Blue bars indicate band registration accuracy in the line direction, and green bars indicate band registration accuracy in the sample direction. This figure also shows the specification offsets, which each band easily outperforms.
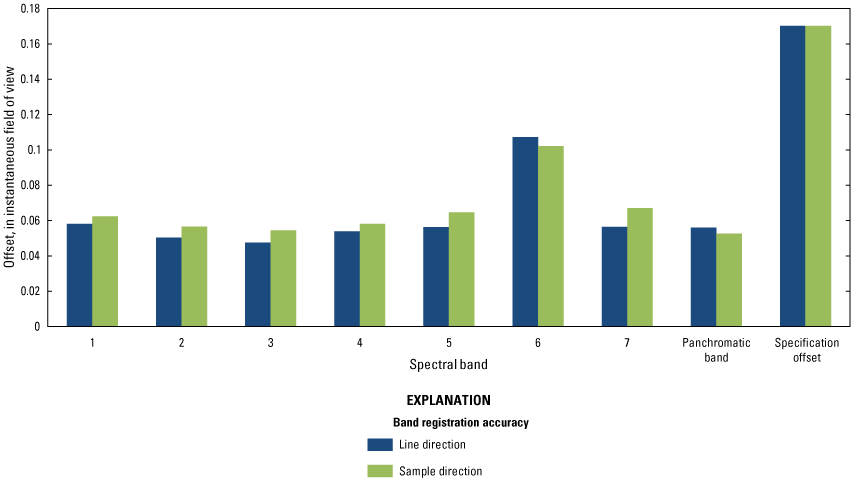
Landsat 7 band-average root mean square registration error since launch.
Landsat 7 Orbital Drift from Worldwide Reference System-2
Landsat 7 is nearing the end of its fuel supply. To conserve fuel, satellite inclination maneuvers have been eliminated, causing the satellite to slowly drift off the nominal WRS–2 orbit. The Cal/Val Team continues to monitor Northern and Southern Hemisphere sites to quantify the amount of WRS–2 displacement. Stakeholders use this information to determine the usability of the data. From April 6 to May 5, 2022, Landsat 7 went through several orbital maneuvers to lower the orbit by 8 kilometers, which has resulted in substantial differences in scene center easting when compared with the displacement before the orbital maneuvers.
The observed orbital drift from WRS–2 for path 39, row 37 (lat 33°10′37″ N., long 115°38′05″ W.), which is a Northern Hemisphere scene, is shown in figure 88. Magenta diamonds in the figure indicate the scene center location converted to easting and, for historical trending purposes, the measurements begin in 2015. The difference between extreme measurements is about 131.3 kilometers. The drift for this Northern Hemisphere scene was to the west until the orbit-lowering maneuvers, after which substantial westward and eastward drift fluctuations were observed. The most recent observations from December 2023 provide further indication of westward and eastward drift fluctuations.
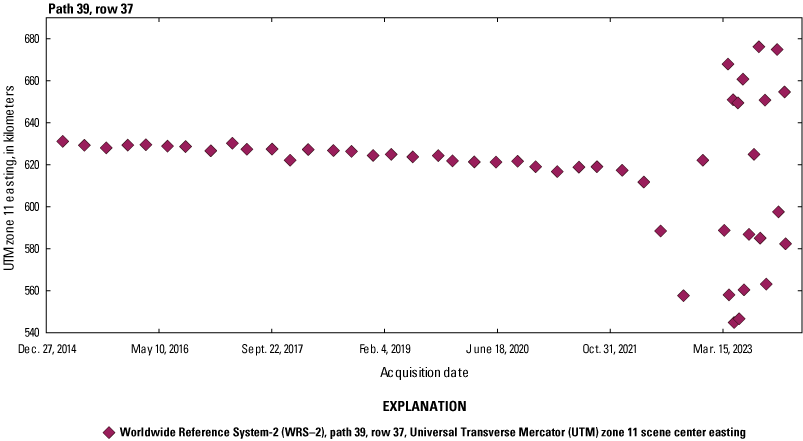
Landsat 7 lifetime orbital drift from World Reference System-2 (path 39, row 37).
The observed orbital drift from WRS–2 for path 100, row 73 (lat 18°47′14″ S., long 138°22′13″ E.), which is a Southern Hemisphere scene, is shown in figure 89. Again, magenta diamonds indicate the scene center location converted to easting, and the figure has measurements from 2015 to the current quarter. The difference between extreme measurements is about 157.6 kilometers. The drift for this Southern Hemisphere scene was to the east until the orbit-lowering maneuvers, after which substantial westward and eastward drift fluctuations were observed.
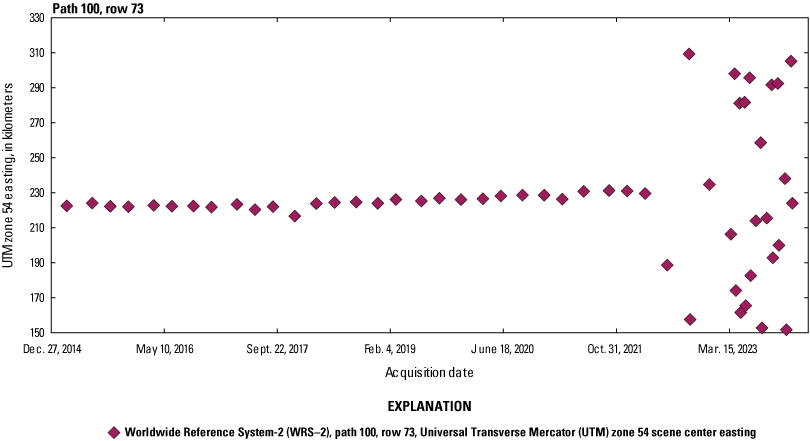
Landsat 7 lifetime orbital drift from World Reference System-2 (path 100, row 73).
Quarterly Level 2 Validation Results
In addition to L1 products, Landsat 7, Landsat 8, and Landsat 9 surface reflectance PICS trending is completed by the Cal/Val Team. The primary purpose of Level 2 surface reflectance PICS trending is to repeatedly characterize the temporal stability of the ETM+ and OLI sensors. The CNES ROI has been chosen for completing the analysis, and the results are summarized in this section.
Level 2 Surface Reflectance Pseudoinvariant Calibration Site Trending
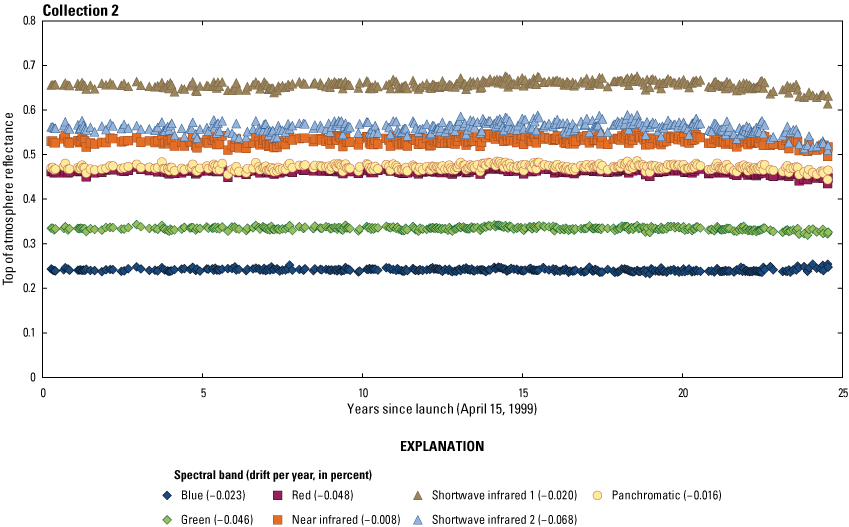
The Collection 2, Level 2 lifetime surface reflectance trends for six Landsat 7 spectral bands for the Libya 4 PICS are provided in figure 90. The x-axis represents years since launch, and the y-axis represents surface reflectance. For this analysis, cloud-free data were used. A strong seasonal effect was noted in the longer wavelength (SWIR) bands (not shown). This seasonal effect has been reduced using appropriate linear models. After reducing seasonality from all bands, drift was estimated for each band from the slope and intercept of line fits. A slight positive drift was noticeable for all bands except for the blue and red bands.
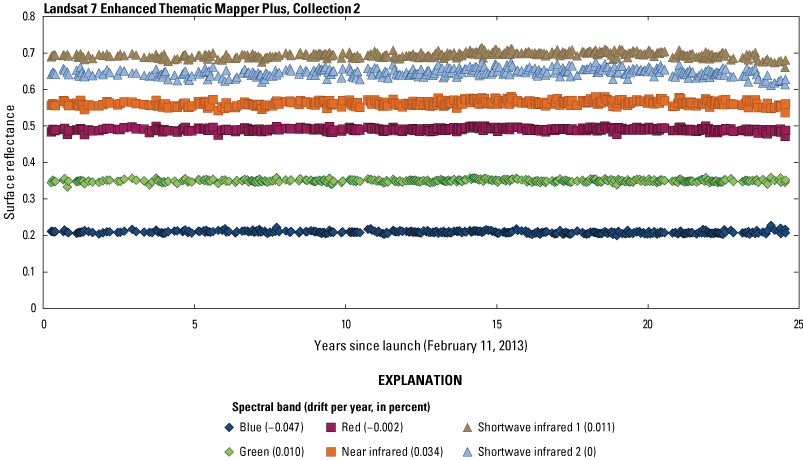
Libya 4 pseudoinvariant calibration site surface reflectance trending, Landsat 7 Enhanced Thematic Mapper Plus, Collection 2.
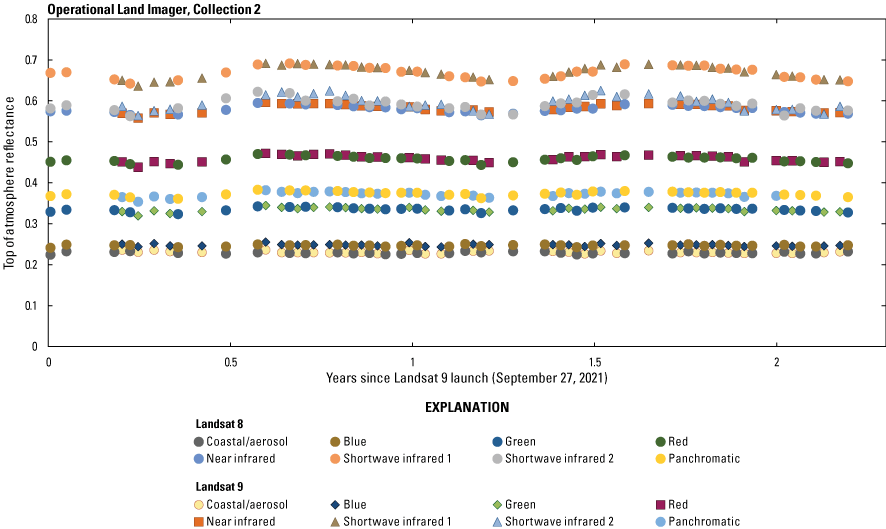
The Collection 2, Level 2 lifetime surface reflectance trends for seven Landsat 8 spectral bands for the Libya 4 PICS are provided in figure 91. Drift estimate results indicate small decay in responsivity for all bands. The x-axis represents years since launch, and the y-axis represents surface reflectance. The seasonal effect has been reduced from all bands using appropriate models. While still very early in the mission, the Collection 2, Level 2 lifetime surface reflectance observations for seven Landsat 9 spectral bands for the Libya 4 PICS are provided in figure 92.
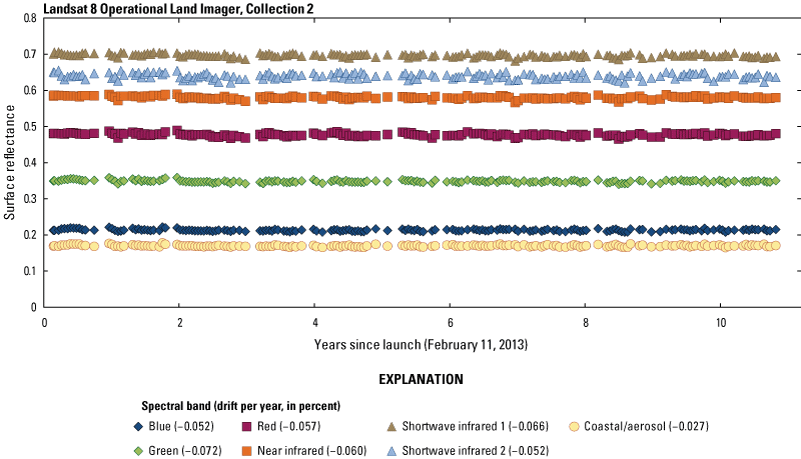
Libya 4 pseudoinvariant calibration site surface reflectance trending, Landsat 8 Operational Land Imager, Collection 2.
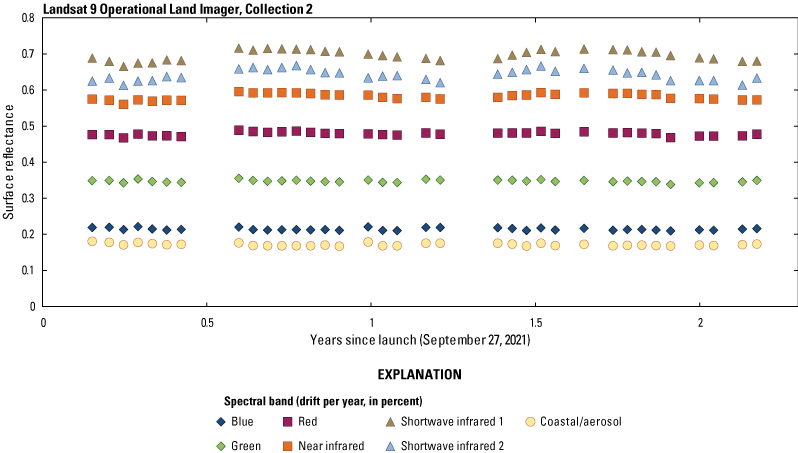
Libya 4 pseudoinvariant calibration site surface reflectance trending, Landsat 9 Operational Land Imager, Collection 2.
Overall, OLI and ETM+ indicated stability for Level 2 surface reflectance based on the analysis completed. No substantial instability was monitored in any band, according to the lifetime drift estimate results.
Summary
The Landsat 9 and Landsat 8 Operational Land Imager and Thermal Infrared Sensor on-orbit radiometric and geometric performance for quarter 4 (October–December), 2023, meets all requirements, with the exception of OLI band registration accuracy (all bands). Both the Landsat 9 and Landsat 8 registration accuracy offsets for all bands slightly exceed the required value, but the offsets easily meets the required value when excluding the cirrus band. Landsat 7 Enhanced Thematic Mapper Plus (ETM+) on-orbit geometric performance for this reporting quarter meets all requirements. Although not measured against specified requirements, Landsat 7 ETM+ on-orbit radiometric performance was fully characterized and summarized in this report. Additionally, quarterly Level 2 validation results for Operational Land Imager and ETM+ indicated stability for Level 2 surface reflectance.
References Cited
Barsi, J.A., Markham, B.L., Czapla-Myers, J.S., Helder, D.L., Hook, S.J., Schott, J.R., and Haque, M.O., 2016, Landsat-7 ETM+ radiometric calibration status: Proceedings of SPIE Optical Engineering + Applications, San Diego, Calif., 2016, Earth Observing Systems XXI, v. 9972, accessed April 2024 at https://doi.org/10.1117/12.2238625.
Barsi, J.A., Montanaro, M., Thome, K., Raqueno, N.G., Hook, S., Anderson, C.H., and Micijevic, E., 2022, Early radiometric performance of Landsat-9 Thermal Infrared Sensor: Proceedings of SPIE 12232, Earth Observing Systems, v. XXVII, article 122320U, 31 p., accessed April 2024 at https://doi.org/10.1117/12.2634058.
Choate, M.J., Rengarajan, R., Storey, J.C., and Lubke, M., 2022, Landsat 9 geometric characteristics using underfly data: Remote Sensing (Basel), v. 14, no. 15, article 3781, 18 p., accessed April 2024 at https://doi.org/10.3390/rs14153781.
Committee on Earth Observation Satellites, 2021, PICS—Pseudo-Invariant Calibration Sites: Committee on Earth Observation Satellites, Cal/Val Portal website, accessed April 2024 at https://calvalportal.ceos.org/pics_sites.
Executive Office of the President of the United States, 2007, A plan for a U.S. National Land Imaging Program—Future of Land Imaging Interagency Working Group: Washington, D.C., Executive Office of the President of the United States, National Science and Technology Council (NSTC) Office of Science and Technology Policy (OSTP) report, 110 p., accessed April 2024 at https://obamawhitehouse.archives.gov/sites/default/files/microsites/ostp/fli_iwg_report_print_ready_low_res.pdf.
Executive Office of the President of the United States, 2014, National plan for Civil Earth Observations: Washington, D.C., Executive Office of the President of the United States, Office of Science and Technology Policy (OSTP) report, 62 p., accessed April 2024 at https://obamawhitehouse.archives.gov/sites/default/files/microsites/ostp/NSTC/2014_national_plan_for_civil_earth_observations.pdf.
Executive Office of the President of the United States, 2016, The second national Civil Earth Observation assessment—Societal benefit areas, subareas, and key objectives: Washington, D.C., Executive Office of the President of the United States, Office of Science and Technology Policy (OSTP) report, 21 p., accessed April 2024 at https://obamawhitehouse.archives.gov/sites/default/files/microsites/ostp/NSTC/the_second_national_civil_earth_observations_assessment.pdf.
Haque, M.O., Rengarajan, R., Lubke, M., Hasan, M.N., Shrestha, A., Shaw, J.L., Denevan, A., Ruslander, K., Micijevic, E., Choate, M.J., Anderson, C., Thome, K., Kaita, E., Barsi, J., Levy, R., Miller, J., and Ding, L., 2024, ECCOE Landsat quarterly Calibration and Validation report—Quarter 3, 2023: U.S. Geological Survey Open-File Report 2024–1017, 65 p., accessed April 2024 at https://doi.org/10.3133/ofr20241017.
Haque, M.O., Rengarajan, R., Lubke, M., Hasan, M.N., Shrestha, A., Tuli, F.T.Z., Shaw, J.L., Denevan, A., Franks, S., Ruslander, K., Micijevic, E., Choate, M.J., Anderson, C., Thome, K., Kaita, E., Barsi, J., Levy, R., Miller, J., and Ding, L., 2023a, ECCOE Landsat quarterly Calibration and Validation report—Quarter 2, 2023: U.S. Geological Survey Open-File Report 2023–1075, 39 p., accessed April 2024 at https://doi.org/10.3133/ofr20231075.
Haque, M.O., Rengarajan, R., Lubke, M., Hasan, M.N., Shrestha, A., Tuli, F.T., Shaw, J.L., Denevan, A., Franks, S., Micijevic, E., Choate, M.J., Anderson, C., Thome, K., Kaita, E., Barsi, J., Levy, R., and Miller, J., 2023b, ECCOE Landsat quarterly Calibration and Validation report—Quarter 3, 2022: U.S. Geological Survey Open-File Report 2023–1013, 38 p., accessed April 2024 at https://doi.org/10.3133/ofr20231013.
Haque, M.O., Rengarajan, R., Lubke, M., Tuli, F.T.Z., Shaw, J.L., Hasan, M.N., Denevan, A., Franks, S., Micijevic, E., Choate, M.J., Anderson, C., Markham, B., Thome, K., Kaita, E., Barsi, J., Levy, R., and Ong, L., 2022, ECCOE Landsat quarterly Calibration and Validation report—Quarter 4, 2021: U.S. Geological Survey Open-File Report 2022–1033, 38 p., accessed April 2024 at https://doi.org/10.3133/ofr20221033.
Markham, B.L., Ahmad, S.P., Irons, J.R., and Williams, D.L., 1994, Radiometric calibration of the Landsat-7 Enhanced Thematic Mapper Plus: Proceedings of IGARSS ‘94—1994 IEEE International Geoscience and Remote Sensing Symposium, 1994, v. 4, p. 2004–2006, accessed April 2024 at https://doi.org/10.1109/IGARSS.1994.399636.
Markham, B.L., Haque, M.O., Barsi, J.A., Micijevic, E., Helder, D.L., Thome, K.J., Aaron, D., and Czapla-Myers, J.S., 2012, Landsat-7 ETM+—12 years on-orbit reflective-band radiometric performance: IEEE Transactions on Geoscience and Remote Sensing, v. 50, no. 5, p. 2056–2062, accessed April 2024 at https://doi.org/10.1109/TGRS.2011.2169803.
Micijevic, E., Rengarajan, R., Haque, M.O., Lubke, M., Tuli, F.T., Shaw, J.L., Hasan, N., Denevan, A., Franks, S., Choate, M.J., Anderson, C., Markham, B., Thome, K., Kaita, E., Barsi, J., Levy, R., and Ong, L., 2021, ECCOE Landsat quarterly Calibration and Validation report—Quarter 2, 2021: U.S. Geological Survey Open-File Report 2021–1105, 40 p., accessed April 2024 at https://doi.org/10.3133/ofr20211105.
Micijevic, E., Rengarajan, R., Haque, M.O., Lubke, M., Tuli, F.T.Z., Shaw, J.L., Hasan, N., Denevan, A., Franks, S., Choate, M.J., Anderson, C., Markham, B., Thome, K., Kaita, E., Barsi, J., Levy, R., and Ong, L., 2022, ECCOE Landsat quarterly Calibration and Validation report—Quarter 3, 2021: U.S. Geological Survey Open-File Report 2022–1025, 38 p., accessed April 2024 at https://doi.org/10.3133/ofr20221025.
Montanaro, M., Barsi, J.A., Lunsford, A., Rohrbach, S., and Markham, B.L., 2014, Performance of the Thermal Infrared Sensor on-board Landsat 8 over the first year on-orbit: Proceedings of SPIE Optical Engineering + Applications, San Diego, Calif., 2014, Earth Observing Systems XIX, v. 9218, 14 p., accessed April 2024 at https://doi.org/10.1117/12.2063457.
National Geospatial Advisory Committee, 2020, Landsat data—Community standard for data calibration (October 2020): Landsat Advisory Group, 12 p., accessed April 2024 at https://www.fgdc.gov/ngac/meetings/october-2020/ngac-paper-landsat-data-community-standard-for.pdf.
Remote Sensing, 2024, Landsat 9 pre-launch, commissioning, and early on-orbit imaging performance [special issue]: MDPI web page, accessed April 2024 at https://www.mdpi.com/journal/remotesensing/special_issues/15B4V2K92K#info.
Rengarajan, R., Choate, M., Hasan, M.H., and Denevan, A., 2024, Co-registration accuracy between Landsat-8 and Sentinel-2 orthorectified products: Remote Sensing of Environment, v. 301, article 113947, 30 p., accessed April 2024 at https://doi.org/10.1016/j.rse.2023.113947.
Rengarajan, R., Storey, J.C., and Choate, M.J., 2020, Harmonizing the Landsat ground reference with the Sentinel-2 Global Reference image using space-based bundle adjustment: Remote Sensing (Basel), v. 12, no. 19, article 3132, 26 p., accessed April 2024 at https://doi.org/10.3390/rs12193132.
Tuli, F.T.Z., Pinto, C.T., Angal, A., Xiong, X., and Helder, D., 2019, New approach for temporal stability evaluation of Pseudo-Invariant Calibration Sites (PICS): Remote Sensing (Basel), v. 11, no. 12, article 1502, 23 p., accessed April 2024 at https://doi.org/10.3390/rs11121502.
U.S. Geological Survey [USGS], 2023, Temporary pause in Landsat 8 product processing: U.S. Geological Survey website, accessed April 2024 at https://www.usgs.gov/landsat-missions/news/temporary-pause-landsat-8-product-processing.
U.S. Geological Survey [USGS], 2019a, Landsat 7 (L7) data users handbook (ver. 2.0, November 2019): U.S. Geological Survey, Earth Resources Observation and Science (EROS) Center, LSDS–1927, 139 p., accessed April 2024 at https://www.usgs.gov/landsat-missions/landsat-7-data-users-handbook.
U.S. Geological Survey [USGS], 2019b, Landsat 8 (L8) data users handbook (ver. 5.0, November 2019): U.S. Geological Survey, Earth Resources Observation and Science (EROS) Center, LSDS–1574, 106 p., accessed April 2024 at https://www.usgs.gov/landsat-missions/landsat-8-data-users-handbook.
U.S. Geological Survey [USGS], 2019c, Landsat 9 (ver. 1.3, August 2022): U.S. Geological Survey Fact Sheet 2019-3008, 1 p., accessed April 2024 at https://doi.org/10.3133/fs20193008.
U.S. Geological Survey [USGS], 2020a, Landsat 8–9 Operational Land Imager (OLI)—Thermal Infrared Sensor (TIRS) Collection 2 Level 1 (L1) data format control book (DFCB) (ver. 6.0, September 2020): U.S. Geological Survey, Earth Resources Observation and Science (EROS) Center, LSDS–1822, 58 p., accessed April 2024 at https://www.usgs.gov/media/files/landsat-8-9-olitirs-collection-2-level-1-data-format-control-book.
U.S. Geological Survey [USGS], 2020b, Landsat 8–9 Operational Land Imager (OLI)—Thermal Infrared Sensor (TIRS) Collection 2 Level 2 (L2) data format control book (DFCB) (ver. 7.0, December 2022): U.S. Geological Survey, Earth Resources Observation and Science (EROS) Center, LSDS–1328, 72 p., accessed April 2024 at https://www.usgs.gov/media/files/landsat-8-9-olitirs-collection-2-level-2-data-format-control-book.
U.S. Geological Survey [USGS], 2021a, EarthExplorer: U.S. Geological Survey database, accessed April 2024 at https://earthexplorer.usgs.gov.
U.S. Geological Survey [USGS], 2021b, EROS Cal/Val Center of Excellence (ECCOE): U.S. Geological Survey website, accessed April 2024 at https://www.usgs.gov/calval.
U.S. Geological Survey [USGS], 2021c, Landsat 7 ETM+ calibration notices: U.S. Geological Survey website, accessed April 2024 at https://www.usgs.gov/landsat-missions/landsat-7-etm-calibration-notices.
U.S. Geological Survey [USGS], 2021d, Landsat 8–9 Calibration and Validation (Cal/Val) algorithm description document (ADD) (ver. 4.0, January 2021): U.S. Geological Survey, Earth Resources Observation and Science (EROS) Center, LSDS–1747, 807 p., accessed April 2024 at https://www.usgs.gov/media/files/landsat-8-9-calibration-validation-algorithm-description-document.
U.S. Geological Survey [USGS], 2022, Landsat 9 data users handbook (ver. 1.0, February 2022): U.S. Geological Survey, Earth Resources Observation and Science (EROS) Center, LSDS–2082, 115 p., accessed April 2024 at https://www.usgs.gov/media/files/landsat-9-data-users-handbook.
Supplemental Information
Radiance is given in watts per square meter per steradian per micrometer (W/m2 sr µm).
Within this report, quarter 1 is from January to March, quarter 2 is from April to June, quarter 3 is from July to September, and quarter 4 is from October to December. For example, quarter 4, 2023, was from October to December 2023.
Abbreviations
Please refer to https://www.usgs.gov/landsat-missions/glossary-and-acronyms for lists of Landsat glossary terms and other Landsat abbreviations.
~
approximately
ASTER
Advanced Spaceborne Thermal Emission and Reflection Radiometer
CA
coastal/aerosol
Cal/Val
Calibration and Validation
CE90
circular error with 90-percent confidence
CNES
Centre National D’Etudes Spatiales
CPF
calibration parameter file
DOQ
digital orthophoto quadrangle
ECCOE
EROS Cal/Val Center of Excellence
EO
Earth observation
EROS
Earth Resources Observation and Science
ETM+
Enhanced Thematic Mapper Plus
GCP
ground control point
L0Ra
Level 0 Reformatted Archive
L0Rp
Level 0 Reformatted Product
L1
Level 1
L1TP
L1 Terrain Precision Correction
Ltypical
typical radiance
NEΔT
noise equivalent change in temperature
OLI
Operational Land Imager
PICS
pseudoinvariant calibration sites
RMSE
root mean square error
ROI
region of interest
SNR
signal-to-noise ratio
SPOT
Satellite Pour l’Observation de la Terre
SSM
Scene Select Mechanism
SWIR
shortwave infrared
TIRS
Thermal Infrared Sensor
USGS
U.S. Geological Survey
WRS–2
Worldwide Reference System-2
For more information about this publication, contact:
Director, USGS Earth Resources Observation and Science Center
47914 252nd Street
Sioux Falls, SD 57198
605–594–6151
For additional information, visit: https://www.usgs.gov/centers/eros
Publishing support provided by the
Rolla Publishing Service Center
Disclaimers
Any use of trade, firm, or product names is for descriptive purposes only and does not imply endorsement by the U.S. Government.
Although this information product, for the most part, is in the public domain, it also may contain copyrighted materials as noted in the text. Permission to reproduce copyrighted items must be secured from the copyright owner.
Suggested Citation
Haque, M.O., Rengarajan, R., Lubke, M., Hasan, M.N., Shrestha, A., Shaw, J.L., Denevan, A., Ruslander, K., Micijevic, E., Choate, M.J., Anderson, C., Thome, K., Barsi, J., Kaita, E., Levy, R., Miller, J., and Ding, L., 2024, ECCOE Landsat quarterly Calibration and Validation report—Quarter 4, 2023 (ver. 1.2, June 2026): U.S. Geological Survey Open-File Report 2024–1026, 62 p., https://doi.org/10.3133/ofr20241026.
ISSN: 2331-1258 (online)
| Publication type | Report |
|---|---|
| Publication Subtype | USGS Numbered Series |
| Title | ECCOE Landsat quarterly Calibration and Validation report—Quarter 4, 2023 |
| Series title | Open-File Report |
| Series number | 2024-1026 |
| DOI | 10.3133/ofr20241026 |
| Edition | Version 1.0: April 22, 2024; Version 1.1: December 11, 2024; Version 1.2: June 11, 2026 |
| Publication Date | April 22, 2024 |
| Year Published | 2024 |
| Language | English |
| Publisher | U.S. Geological Survey |
| Publisher location | Reston, VA |
| Contributing office(s) | Earth Resources Observation and Science (EROS) Center |
| Description | Report: ix, 62 p.; Dataset |
| Online Only (Y/N) | Y |
| Additional Online Files (Y/N) | Y |