

Quantitative Risk of Earthquake Disruption to Global Copper and Rhenium Supply
Links
- Document: Report (17.1 MB pdf) , HTML , XML
- NGMDB Index Page: National Geologic Map Database Index Page (html)
- Download citation as: RIS | Dublin Core
Abstract
Earthquakes have the potential to substantially affect mining operations, potentially leading to supply chain disruptions and adversely affecting the global economy. This study explores the quantification of earthquake risk to copper and rhenium commodity supply by examining the spatial concentration of high earthquake hazard areas and the commodity-specific mining, smelting, and refining operations across the globe. Because many of the largest facilities are concentrated geographically near the highly seismic regions of South America, East Asia, and the Pacific, there is a potential for cascading effects on the entire supply chain. The analysis indicates that the expected annual disruption of global production is 0.3–1.1 percent for copper mines, 1.8–4.0 percent for smelters, and 1.5–3.3 percent for refineries. Expected annual disruption of global rhenium production capacity is 0.32–1.32 percent. The research highlights that the potential lost revenue from earthquake disruptions is from $315 million to $1.29 billion for copper mining, $1.92 billion to $4.33 billion for copper smelting, $2.06 billion to $4.52 billion for copper refining, and $337,000 to $1.40 million for rhenium production capacity.
Introduction
Infrastructure, energy, transportation, communication, and healthcare are among the many sectors of any modern economy that are dependent on mineral commodities. These mineral commodities include niobium in high-strength, low-alloy steels used for oil and gas pipelines; platinum in automotive catalytic converters for emissions control; cobalt in lithium-ion batteries for consumer electronics and electric vehicles; and rare earth permanent magnets in computer hard disk drives, electric vehicle drivetrains, and offshore wind turbines (Callaghan, 2021; Gambogi, 2021; Schulte, 2021; Shedd, 2021).
Although the demand for mineral commodities will likely continue to grow to meet the needs of an increasingly affluent global population and a low-carbon global economy, concerns are increasing regarding the reliability of their supplies. These concerns often occur because production of mineral commodities is highly concentrated in a few countries. Most of the world’s niobium, platinum, cobalt, and rare earths are mined in Brazil, South Africa, the Democratic Republic of the Congo, and China, respectively. Substantial supply shortages would occur if these countries become unable (for example, because of political instability or labor strikes) or unwilling (for example, because of trade tensions or conflict) to supply these commodities to world markets (Nassar and others, 2020). Additionally, global disruptions, such as those disruptions stemming from the production interruptions due to the Coronavirus Disease 2019 pandemic, illustrate the need for more mineral commodity supply chain modeling (Jowitt, 2020).
In recent years, governments, nongovernmental organizations, academic institutions, and corporations have taken steps to assess the risk associated with mineral commodity supply disruptions (Graedel and Reck, 2016). Most of these analyses account for production concentration at the country-level to estimate the risk associated with human-caused supply disruptions (for example, Nassar and others, 2020). Most analyses do not, however, consider that production is also spatially concentrated. The production of tantalum, for example, is concentrated in the Great Lakes region in Africa, and production occurs on both sides of the political border between the Democratic Republic of the Congo and Rwanda (Soto-Viruet and others, 2013). An assessment of country-level concentration would thus not account for this spatial concentration.
Accounting for country-level spatial concentration is important when considering supply-affecting factors that are not constrained by political boundaries, including natural hazards such as earthquakes, floods, landslides, volcanoes, and wildfires. The effect of natural hazards on mineral supply was identified as one of the most frequent causes of mineral supply disruption—third only to mine accidents and labor strikes (Hatayama and Tahara, 2018). However, the risk of natural hazard effects on mineral supply has not been quantified on a global scale.
One recent study examined the potential disruption caused by earthquakes to copper mining, smelting, and refining supply in South America and offered a method of quantifying supply-disruption risk from natural hazards (Schnebele and others, 2019). Copper is used in many economic sectors including building construction, consumer goods, electrical and electronic products, energy generation and transmission, industrial machinery, and transportation equipment. Porphyry copper deposits—the source of nearly 75 percent of the world’s copper supply—form along convergent plate boundaries and are in areas that are susceptible to earthquake hazards, such as the western and northern regions of South America (John and others, 2010; Sillitoe, 2010).
The recent case study results indicated that 76 of the 101 copper-producing facilities in South America, representing over 80 percent of South American copper mine, smelter, and refinery production, are within an area of high seismic hazard (defined as greater than 85 percent chance of exceeding a Modified Mercalli Intensity VI earthquake within 50 years; Schnebele and others, 2019). The analysis also calculated effects using one of the common risk metrics, namely expected annual disruption (EAD), which represents a long-term average of disruption on a per-year basis, and ranged from 1.5 to 5 percent of mine production, 1 to 3.5 percent of smelter capacity, and 3 to 9 percent of refinery capacity, corresponding to two illustrative vulnerability models.
This analysis built upon previous work by expanding the scope to a global scale, which allows for a more comprehensive understanding of the effects earthquakes could have on global copper supplies. This analysis also includes rhenium, a copper-molybdenum byproduct that has important applications in superalloys, particularly those superalloys used to construct jet engines. This research was conducted as a part of the 2019 Risk Community of Practice Research Award funded through the U.S. Geological Survey (USGS) Natural Hazards Mission Area.
Data and Models
Global Copper Production
To assess the risk earthquakes may pose to the global copper supply, information on copper facilities and their 2018 production data were collected. Construction of a global copper facilities dataset began by gathering lists of copper producers from multiple sources, including the USGS National Minerals Information Center (NMIC; Xun, 2020; Chung, 2021; Flanagan, 2021; Safirova, 2022; Soto-Viruet, 2022a, b; Yager, 2022), the International Copper Study Group (2015), CRU International Ltd. (2018), and S&P Global (2019). Facilities were cross-checked and combined to create an initial list. Names, present and past ownerships, capacities, and approximate locations were used to identify, verify, add, and eliminate entries. Each location was verified and geolocated using Google Earth (Google LLC., 2019) and stored in a geodatabase. Facilities were excluded from the dataset if it was not possible to identify their locations.
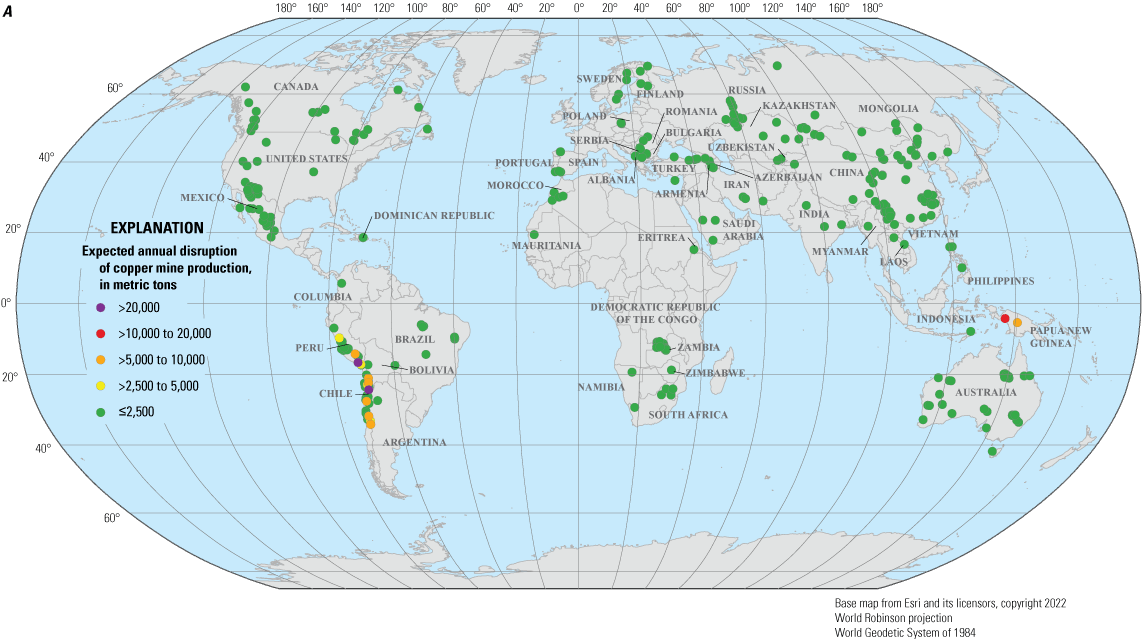
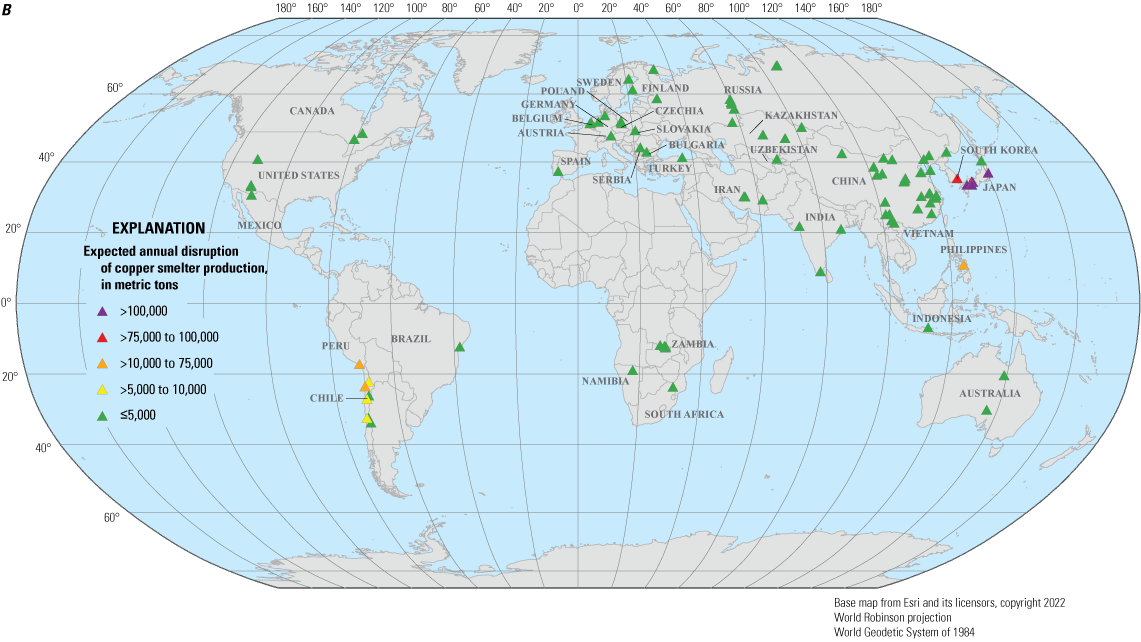
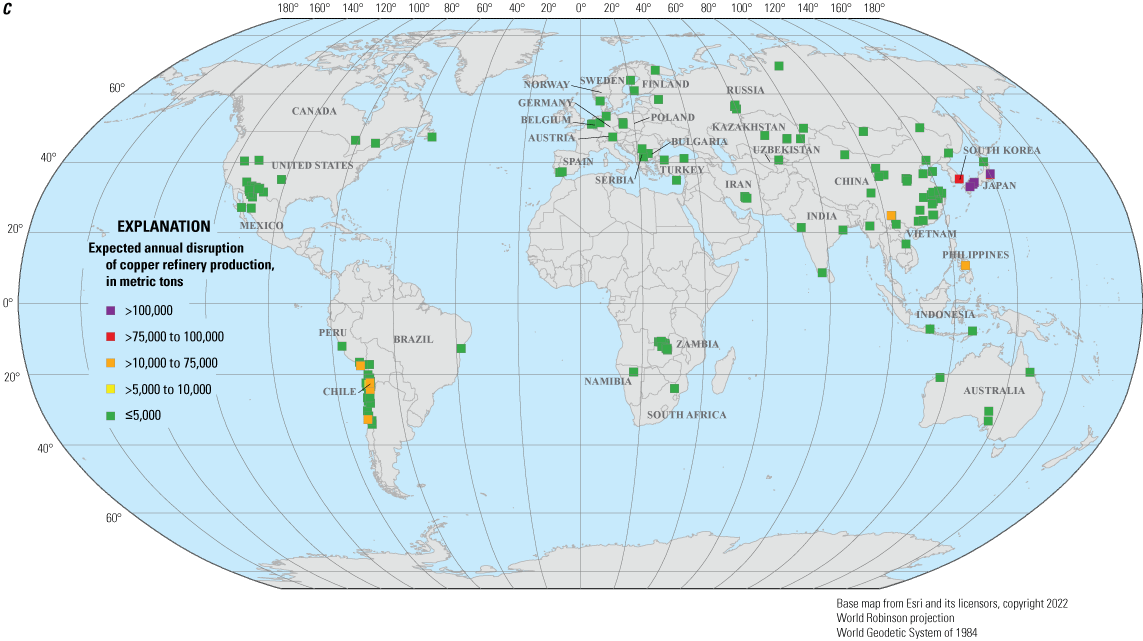
The amount of copper produced in 2018 was collected for each facility by production stage (mine, smelter, or refinery; fig. 1A, B, and C). Production data for each facility were determined hierarchically. Reported company data were considered as the first-tier source. If data were reported in a company report, the production quantity was checked against a facility’s capacity to confirm they were the same order of magnitude, and if so, the data were added to the dataset. If the reported production quantity varied from a facility’s capacity considerably, subsequent sources were used to confirm the production quantity. If none were found, the company-reported production quantity was assumed correct and added to the dataset. Government reporting was considered as the second-tier source; quantities were accepted following the same validation steps used for company data. When company and government data were unavailable, a third-tier reported production quantity that aligned closest to a facility’s capacity was selected. These third-tier sources consisted of news reports and subscription sources. For facilities that had no reported 2018-production data, production was estimated. Estimation methods included using reported production quantities for 2017, using a ratio of a facility’s production capacity to total country production or to reported company production, or calculating production from mined ore production when the copper content was known. If estimating production using one of the described methods was not possible, then facilities were excluded from the dataset.
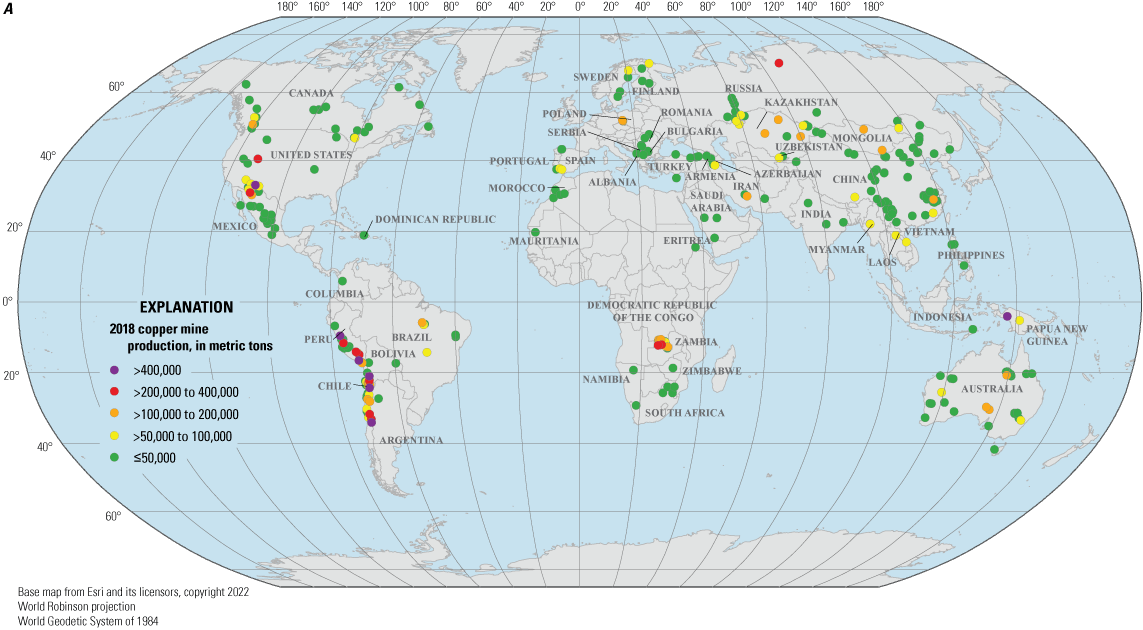
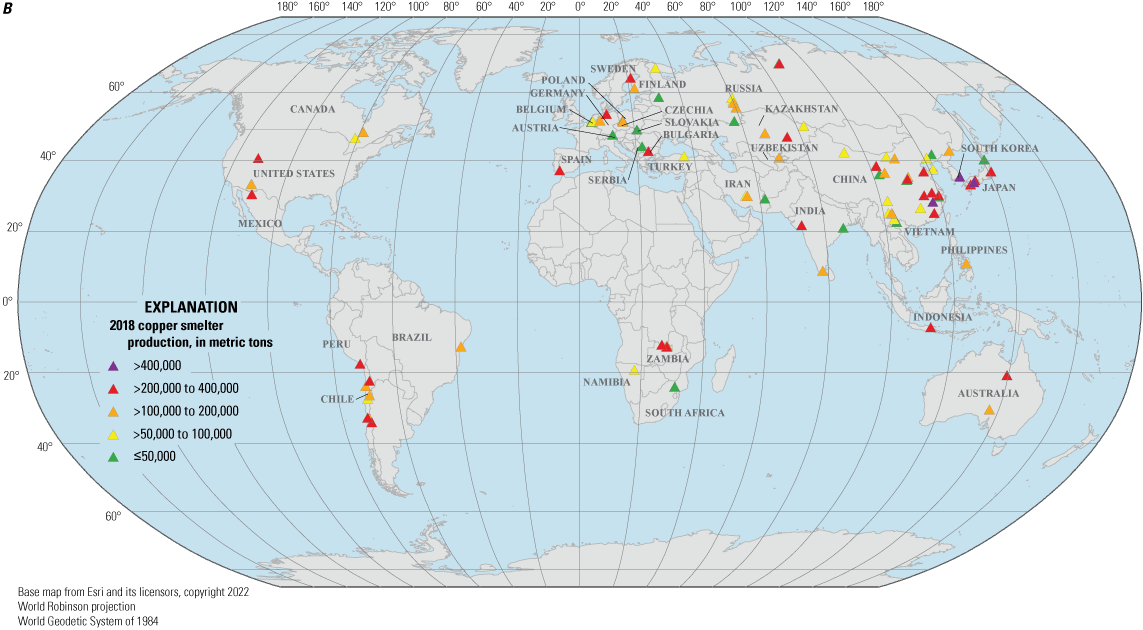
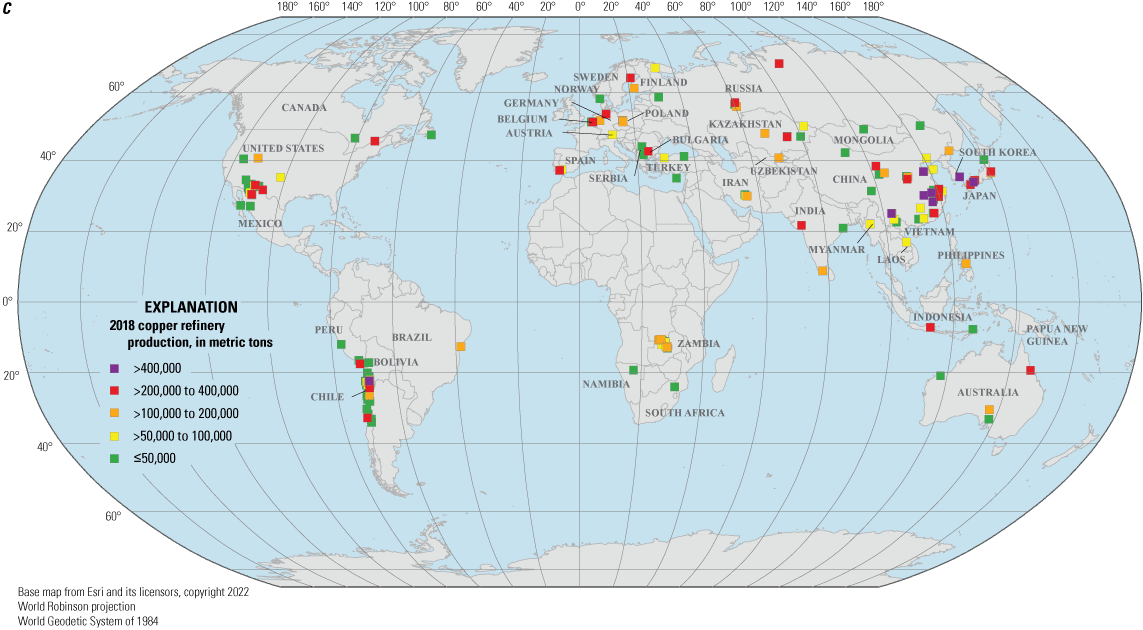
Locations of A, copper mine, B, smelter, and C, refinery production facilities and their 2018 production quantities (in metric tons) used in the analysis. [≤, less than or equal to; >, greater than]
Although the USGS NMIC surveys domestic producers for monthly and annual copper production, data are aggregated or withheld from publication to avoid disclosing proprietary information. For that reason, proprietary data reported to the USGS NMIC were not included in the dataset. Production data for U.S. facilities were collected using the same open and subscription sources and estimation methods that were used for international producers. Overall, a total of 625 copper-producing facilities that had 2018 production data were identified and validated using these methods. The excluded facilities are discussed in the “Geospatial Concentration of Copper Production” section.
Geospatial Concentration of Copper Production
In 2018, world copper mine production estimated by the USGS was about 20.4 million metric tons (Mt); Chile and Peru were the top producers (Flanagan, 2021). Because data collected by facility can be limited by a lack of available production or location data, world mine production captured for this analysis was 18.7 Mt (about 92 percent of world 2018 production reported by the USGS). The USGS reported that 2018 world copper smelter production was 19.5 Mt and world copper refinery production was 24.4 Mt (Flanagan, 2021). Smelter production data for this study totaled 16.2 Mt (about 83 percent of the USGS 2018 total) and refinery production totaled 20.9 Mt (about 86 percent of the USGS 2018 total; table 1).
Table 1.
Copper mine, smelter, and refinery production of leading countries in 2018 reported in thousands of metric tons.Chile (5.6 Mt) and Peru (2.3 Mt) were the world’s leading producers of mined copper in 2018. China led the world in copper smelter and refinery production followed by Chile and Japan. For 2017, the Government of China’s most recently published production data were 1.7 Mt for mine, 6.4 Mt for smelter, and 8.9 Mt for refinery (China Nonferrous Metals Industry Association, 2019). For this study, China’s production data collected by facility totaled 886,000 metric tons for mine, 5.2 Mt for smelter, and 6.7 Mt for refinery; thus, of China’s reported 2017 production, mine was 53 percent of the total, smelter was 81 percent of the total, and refinery was 75 percent of the total. Because of the numerous small unknown facilities, it was difficult to locate and collect production data for many facilities in China. A large portion of the unrepresented facilities were mining operations. The unrepresented facilities are evident in table 1 where, using data collected for this study, China is ranked fifth in global copper mine production but is estimated by the USGS as the world’s third largest producer (Flanagan, 2021). As facilities were excluded from the dataset because of a lack of available production data, location data, or both, the risk estimates generated in this study likely underestimate the total risk.
Global Rhenium Capacity and its Geospatial Concentration
Annual global rhenium production by facility is not publicly available because of the small number of producers (n=12) and the extremely high value of rhenium; the 2018 annual average price of rhenium metal pellets (minimum 99.9 percent rhenium) was $1,470 per kilogram of contained rhenium (Polyak, 2023). Rhenium recovery facilities and their capacities, which include smelters and roasters, were estimated using USGS and industry publications (QY Research Inc., 2019; Roskill Information Services Ltd., 2015, 2019; Xun, 2020); where discrepancies were found, USGS compilations were used that were based on direct communications with relevant stakeholders. These estimated capacities were used as a proxy for rhenium production. The locations were verified and geolocated using Google Earth (Google LLC., 2019) and stored in a geodatabase. Total capacity estimated for the 12 rhenium facilities identified in this study was about 72 metric tons (fig. 2).
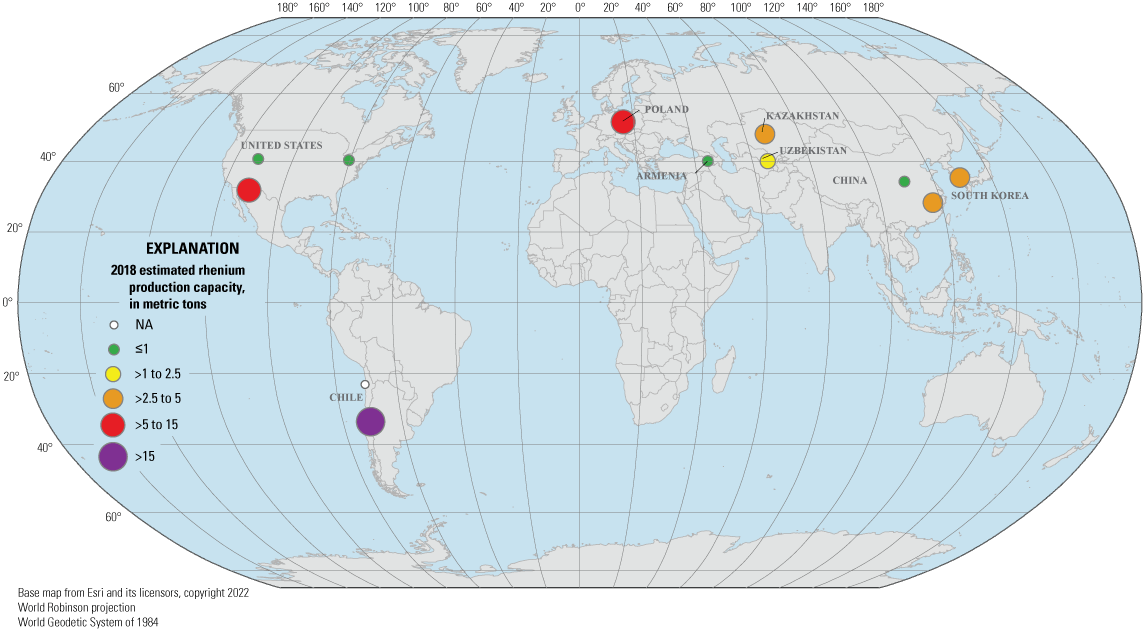
Locations of rhenium production facilities and their 2018 estimated capacities (in metric tons). [NA, not available; ≤, less than or equal to; >, greater than]
Global Earthquake Hazard and its Spatial Concentration
The Global Earthquake Model (GEM) Foundation has recently developed a Global Seismic Hazard Map (fig. 3) from a mosaic of regional (for example, South and Central America, Central Asia, sub-Saharan Africa, and Europe) and national (for example, Canada, the United States, Indonesia, Australia, New Zealand, Philippines, and South Africa) earthquake hazard models (Pagani and others, 2020). Most of the regional models were developed by GEM through collaboration with local earthquake scientists and engineers. Most of the national models were produced by agencies that are officially mandated by their respective governments to develop or update seismic hazard information for their country and were directly incorporated into the global mosaic. A minor fraction of the GEM Global Seismic Hazard Mosaic (Pagani and others, 2018) contains models that are available through the peer-reviewed literature (for example, India from Nath and Thingbaijam, 2012) or are developed internally at the GEM secretariat (for example, Russia and the Pacific Islands). The GEM Global Seismic Hazard Mosaic represents the state of the art based on openly available probabilistic seismic hazard assessment models. The hazard model used in the present study for South America is based on GEM’s global mosaic, whereas the Schnebele and others (2019) study relied on the South America hazard model from Petersen and others (2018), which was the latest publicly available hazard model at the time.
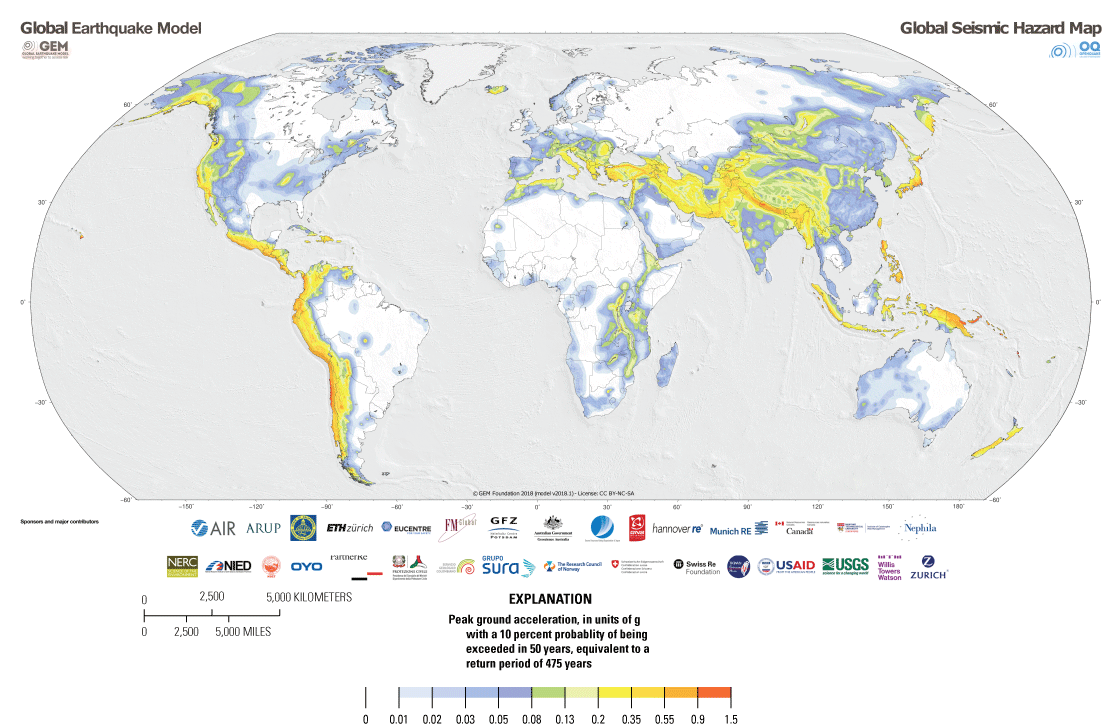
Global seismic hazard map representing peak ground acceleration (in units of gravity [g]) on rock for a 475-year return period (equivalent to a probability of exceedance of 10 percent in 50 years). Modified from Pagani and others (2018).
From the GEM Global Seismic Hazard Mosaic, we use a seismic hazard curve at each copper- or rhenium-producing facility that forecasts annual frequencies of exceeding each in a range of earthquake-induced peak ground accelerations (for example, refer to fig. 1 in Schnebele and others, 2019). From such hazard curves, the peak ground accelerations at an annual exceedance frequency of 1 in 475 years (in other words, a return period of 475 years) is mapped in figure 3. The map and hazard curves used here are for a reference rock condition because such curves are not yet available for other soil conditions from the GEM Global Seismic Hazard Mosaic. The map illustrates that the earthquake hazard is relatively high in Chile, Peru, Japan, and parts of China compared to other locations in this study.
Method
Analysis of Global Supply Disruption Risk
As detailed in Schnebele and others (2019), the risk of earthquake disruption to mineral commodity supplies can be quantified through an application of the total probability theorem that combines the production at different facilities and a corresponding site-specific seismic hazard curve. For each facility, the method calculates an expected amount of mineral production disrupted by earthquakes per year, denoted as “EAD.” This calculation also integrates a model of the expected vulnerability of the facility production to earthquake shaking (in other words, the expected percentage of annual mineral production disrupted as a function of the shaking intensity at the facility). The results use two illustrative vulnerability models developed in Schnebele and others (2019), and each model is applied to all the facilities. The disruption results from the two vulnerability models represent two possible quantifications of the seismic risk to mineral production. The two models are loosely consistent with gathered reports on damage and disruptions to copper facilities caused during nine large South American earthquakes (Schnebele and others, 2019). The method of calculating EAD allows for facility-specific vulnerability models from future research. Regardless, the EAD results can be mapped to illustrate the spatial concentration of risk and summed across facilities (for example, by country).
Results
Expected Annual Disruption of Copper
The analysis indicates that the EAD is about 0.3–1.1 percent of global copper mine production, about 1.8–4.0 percent of smelter production, and about 1.5–3.3 percent of refinery production, depending on the vulnerability model selected (table 2). Aggregated on a country level, the analysis indicates that Chile has the highest seismic risk for mine production (table 2; fig. 4A), which is expected for the largest producer of mined copper (table 1), mainly originating from a few facilities that are in a high seismic hazard region (fig. 3). Even though China led the world in copper smelter and refinery production, Japan is in a high seismic hazard region and has the greatest risk in terms of smelter and refinery production (table 2; fig. 4B, C). The two illustrative vulnerability models provided the same pattern in terms of relative risk among different countries. However, the vulnerability model A risk estimates, given higher susceptibility to production disruption for a given shaking intensity when compared with vulnerability model B, are roughly 2–5 times higher than the estimates obtained from vulnerability model B.
Expected annual disruption (EAD; in metric tons) for leading A, copper mines, B, smelters, and C, refineries for vulnerability model A by individual operation.
Table 2.
Risk analysis of global copper production effects from earthquakes for mines, smelters, and refineries.[Expected annual disruption (EAD) is aggregated on a country-level in metric tons and as percentage of total EAD and world production (included in this analysis). Cu, copper]
At the level of individual facilities, the results indicate that nine mines in Chile, Peru, Indonesia, and Papua New Guinea (fig. 4A) and only three (or four depending on the vulnerability model used) smelters and refineries in Japan (fig. 4B, C) account for about half of the total EADs. For copper mines, the operations that had the highest EADs have large production quantities and are in areas of high seismic hazard (fig. 5). Copper mines that had the greatest EADs are also operations that had predominately porphyry copper deposits. Porphyry copper deposits form along convergent plate boundaries and are in areas that are susceptible to earthquake hazards. Overall, these handful of operations, especially for the Japanese smelters and refineries, are of most concern from the perspective of copper supply disruption from earthquakes.
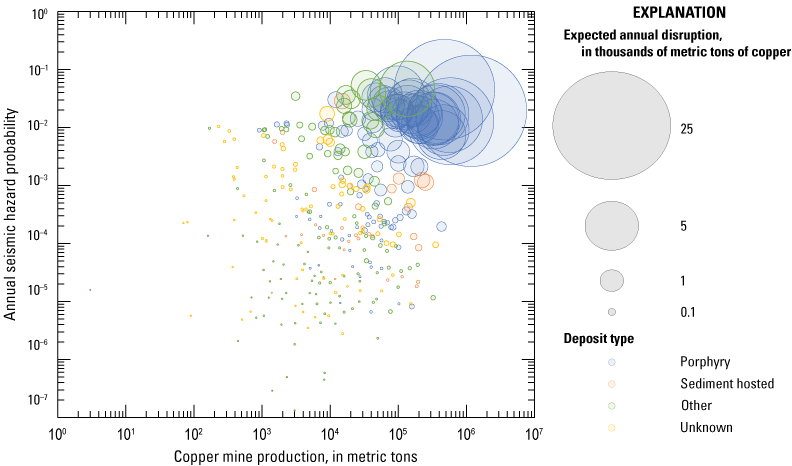
Annual mine production (in metric tons) for 2018, seismic hazard probability (defined as “annual probability of exceeding a Modified Mercalli Intensity of VI level”), predominant deposit type, and resultant expected annual disruption (using vulnerability model A) for copper mining facilities.
Expected Annual Disruption of Rhenium
The analysis indicates that the EAD is 0.32–1.32 percent for rhenium production capacity, depending on the vulnerability model selected (table 3). With the largest rhenium production capacity (fig. 2) and high seismic hazard (fig. 3), Chile faces the highest seismic risk in terms of total production disruption. Despite larger production capacity elsewhere (including Poland and the United States), the rest of the global (total) EAD is mostly in South Korea, where the seismic hazard at the facilities is higher. Also because of the spatial concentrations of seismic hazard, the relatively small production capacity in Armenia has risk comparable to that in the United States.
Table 3.
Risk analysis of rhenium production capacity impacts from earthquakes.[Expected annual disruption (EAD) are aggregated on a county-level in kilograms and as percentage of total EAD and world capacity (included in this analysis)]
Effects of Annual Expected Disruption
Although market prices of copper and rhenium may not necessarily reflect the unit prices that producers would realize from their sales, they can provide a general proxy. At 2018 prices of copper (about $6.5 per kilogram from annual average London Metal Exchange, grade A, cash price; Flanagan, 2021) and rhenium ($1,470 per kilogram of 99.9 percent pure metal pellets; Polyak, 2023), lost revenue from the EAD totals ranges from $315 to $1,290 million for copper mining, $1.92 to $4.33 billion for copper smelting, $2.06 to $4.52 billion for copper refining, and $337,000 to $1.40 million for rhenium. All other things being equal, these effects will be greater for countries that have greater EAD. As illustrated in figure 6A, B, and C, countries that have higher copper production generally have greater EAD. Because of the differences in the earthquake hazard, however, some countries will have notably greater EAD at the same level of copper production. For example, Sweden and Papua New Guinea have roughly the same level of copper mine production. The copper mine EAD (using vulnerability model A) for Papua New Guinea is, however, more than 1,000-fold greater than that of Sweden (fig. 6A). Similar disparities exist among other countries and for the different copper production stages. Additionally, because of differences in each country’s economic profile, copper disruptions to each country’s economy will also differ. For some countries, including Chile, the Democratic Republic of the Congo, Mongolia, and Zambia, copper production provides a substantial contribution to their gross domestic product (GDP; fig. 6A, B, and C); therefore, copper production disruption is an important concern for these countries compared with other countries that have more diverse economies. The ability for facilities that are not affected by an earthquake to increase their production to offset these production losses will decrease these economic effects, at least for the global market.
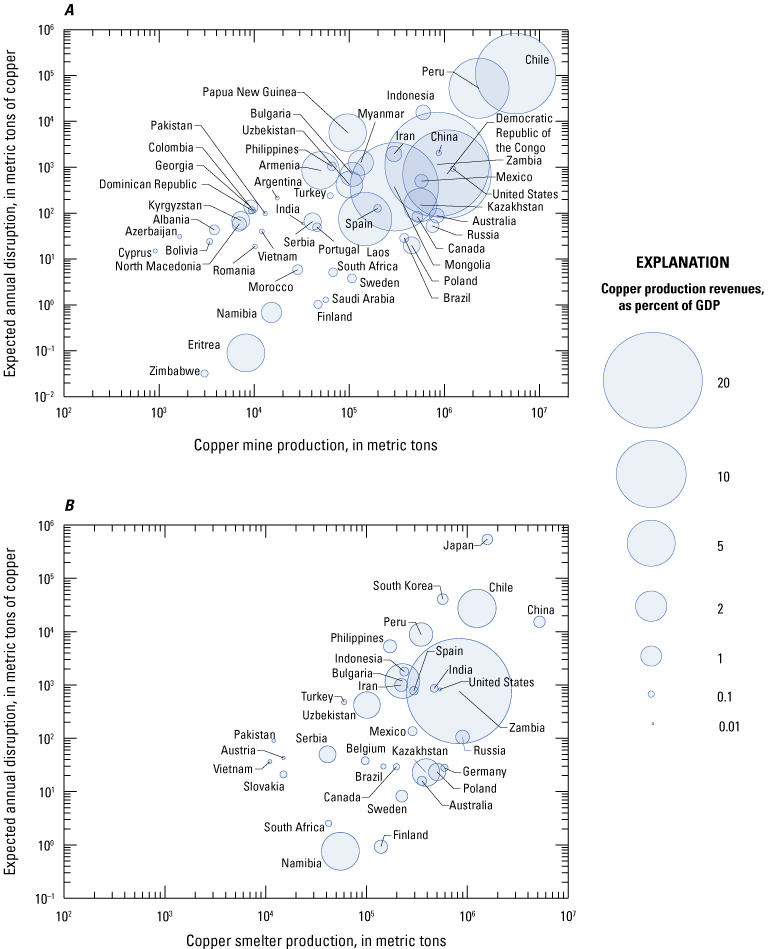
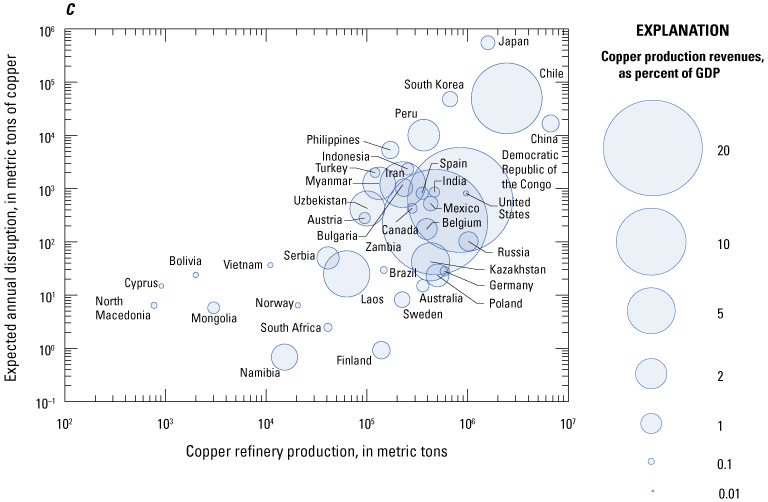
Expected annual disruption (EAD; in metric tons) using vulnerability model A aggregated for each country against that country’s annual copper A, mine, B, smelter, and C, refinery production using logarithmic scales. Point size is proportional to each country’s estimated copper production revenue (approximated as production quantity times copper market price) as a percentage of the country’s gross domestic product (GDP). Countries that have zero EAD or no GDP data are not plotted (GDP data from World Bank Group [2021], Eritrea data from the International Monetary Fund [2021]).
The extent of damages may not necessarily stop at the producer; downstream manufacturers and final consumers may potentially have to pay higher prices for these commodities, reduce their output, or use less-preferred substitutes. The effects may be most acute for countries that are highly import reliant on copper and rhenium from countries that have the greatest EAD. Countries have varying degrees of import reliance. Moreover, they may source their raw materials from different locations and in different forms. As a result, the effects of supply disruptions may vary notably for many importing countries. For example, as a major copper producer, the United States is not highly net-import reliant on copper. Most of the unmanufactured copper that the United States imports is in the form of refined copper from Chile. In contrast, Russia imports most of its unmanufactured copper from Kazakhstan in the form of copper concentrates, which feeds its smelters and refineries. Thus, the potential effects of copper supply disruptions on the manufacturing sectors of the United States and Russia are expected to differ. However, because copper is a globally traded commodity, a supply disruption in one country may affect consumers either directly or indirectly because of higher prices. Additionally, inventories held by producers, consumers, merchants, and exchanges can help offset the effects of the disruptions. For copper, known inventories were greater than 1.1 Mt as of May 2023 (Kotseras, 2023), indicating that they would be more than sufficient in covering the EADs estimated based on the two candidate vulnerabilities (models A and B). If, however, the disruption levels exceeded the available inventories, an economic model would be necessary to determine the full extent of the economic damages that these disruptions would have to the specific industries and national and global economies overall.
Summary, Limitations, and Future Work
By providing the first global assessment of copper and rhenium supply disruption risk because of earthquakes, this study takes a major step towards quantifying the effects of natural hazards on mineral commodity markets. However, this initial assessment represents a long-term average on a per annum basis, and a single large earthquake in any given year could easily exceed these annualized average estimates. Furthermore, there could be additional downstream effects to other sectors of the economy from supply disruptions to one commodity, which are not directly accounted for in our study. The effects could be exacerbated by multiple large and destructive earthquakes occurring close in time, such as the magnitude 8.8 Maule earthquake in Chile on February 27, 2010, and the magnitude 9.1 Tohoku earthquake in Japan on March 11, 2011.
The facilities dataset compiled for this study was limited by lack of publicly available facility-wide production or location information; therefore, some facilities were excluded. Additionally, there are many small unknown operations, particularly those facilities in China, that were not included. Because the dataset does not include those facilities, the risk estimates generated in this study likely represent the lower bound of the total risk. Furthermore, the production quantity assigned to each facility was a 2018 snapshot and does not consider annual variability, the addition of new facilities, or the closure of other facilities in the years following. The type of mine facility (for example, open pit compared to underground) and mineral deposit type also were not considered in the vulnerability models explicitly because of limited information about the effects on these facilities from past earthquakes. Additional research would be beneficial to systematically compile the disruption data from large earthquakes and document the level of effect (direct and indirect) and the level of shaking that caused such effects. Such data may facilitate a more robust set of vulnerability models. Nevertheless, the illustrative vulnerability models used in the present study can help by focusing future work on facilities that have the highest risk.
The results of this study could be incorporated into economic models that may provide insights into how much financial damage these supply disruptions may cause. Such analyses could be useful to national governments, mining companies, development organizations, and insurance companies. The private sector may find these results and similar analyses useful in making certain business or investment decisions. A company already in the copper business may, for example, decide to update their own risk assessment to account for these results. The company may then decide to establish a second processing location to diversify its risk, or it may decide not to extend the life of an operation in a high earthquake-risk zone. An exploration company may also find the results useful in deciding whether to enter the market and where to spend its exploration dollars. For governments, the results of this study could be used to inform a variety of policies and decisions including, for example, permitting. The results could also eventually be incorporated in minerals supply risk assessments that determine which commodities are most critical to the economy or the using company in question. However, before this study can be incorporated into these supply risk assessments, other commodities would need to be evaluated to provide a basis for comparison. Moreover, other natural hazards, such as floods, landslides, tsunamis, volcanic eruptions, and wildfires, may need to be included as well.
Another potential use of this study is in combination with U.S. mineral commodity supply risk assessment results to help identify and prioritize commodities of concern for the U.S. Federal Government. For example, mineral commodities on this list would be the focus of research and development efforts to reduce their use through the development of substitute materials or the diversification of their supply, including increase of their production from secondary (in other words, recycling) sources.
References Cited
Callaghan, R.M., 2021, Niobium (Columbium): U.S. Geological Survey Mineral Commodity Summaries 2021, p. 114–115, accessed March 2021 at https://pubs.usgs.gov/periodicals/mcs2021/mcs2021-niobium.pdf.
Chung, J., 2021, The mineral industry of Japan [advanced release], in Metals and minerals: U.S. Geological Survey Minerals Yearbook 2017–2018, v. III, p. 14.1–14.12, accessed April 2021 at https://www.usgs.gov/media/files/mineral-industry-japan-2017-18-pdf.
CRU International Ltd., 2018, CRU copper market outlook 2018-Q4-Mine, smelter, refinery production: London, United Kingdom, CRU International Ltd., accessed October 2019 at http://www.crugroup.com/.
Flanagan, D.M., 2021, Copper [advanced release], in Metals and minerals: U.S. Geological Survey Minerals Yearbook 2018, v. I, p. 20.1–20.29, accessed September 16, 2021, at https://www.usgs.gov/centers/nmic/copper-statistics-and-information.
Gambogi, J., 2021, Rare earths, in Mineral commodity summaries 2021: U.S. Geological Survey, p. 132–133, accessed March 2021 at https://doi.org/10.3133/mcs2021.
Google LLC., 2019, Google Earth, version 7.3.2: Google LLC. software release, accessed October 2019 at www.google.com/earth/.
Graedel, T.E., and Reck, B.K., 2016, Six years of criticality assessments—What have we learned so far?: Journal of Industrial Ecology, v. 20, no. 4, p. 692–699, accessed November 2018 at https://doi.org/10.1111/jiec.12305.
Hatayama, H., and Tahara, K., 2018, Adopting an objective approach to criticality assessment—Learning from the past: Resources Policy, v. 55, p. 96–102, accessed November 2018 at https://doi.org/10.1016/j.resourpol.2017.11.002.
International Monetary Fund, 2021, World economic outlook database, April 2021: International Monetary Fund website, accessed July 21, 2021, at https://www.imf.org/en/Publications/SPROLLS/world-economic-outlook-databases.
John, D.A., Ayuso, R.A., Barton, M.D., Blakely, R.J., Bodnar, R.J., Dilles, J.H., Gray, F., Graybeal, F.T., Mars, J.C., McPhee, D.K., Seal, R.R., Taylor, R.D., Vikre, P.G., 2010, Porphyry copper deposit model, chap. B of Mineral deposit models for resource assessment: U.S. Geological Survey Scientific Investigations Report 2010–5070–B, 169 p.
Jowitt, S.M., 2020, COVID-19 and the global mining industry: SEG Discovery, no. 122, p. 33–41, accessed September 2021 at https://doi.org/10.5382/SEGnews.2020-122.fea-02.
Nassar, N.T., Brainard, J., Gulley, A., Manley, R., Matos, G., Lederer, G., Bird, L.R., Pineault, D., Alonso, E., Gambogi, J., and Fortier, S.M., 2020, Evaluating the mineral commodity supply risk of the U.S. manufacturing sector: Science Advances, v. 6, no. 8, art. eaay8647, 11 p., accessed September 2021 at https://doi.org/10.1126/sciadv.aay8647.
Nath, S.K., and Thingbaijam, K.K.S., 2012, Probabilistic seismic hazard assessment of India: Seismological Research Letters, v. 83, no. 1, p. 135–149, accessed October 2019 at https://doi.org/10.1785/gssrl.83.1.135.
Pagani, M., Garcia-Pelaez, J., Gee, R., Johnson, K., Poggi, V., Styron, R., Weatherill, G., Simionato, M., Viganò, D., Danciu, L., and Monelli, D., 2018, Global Earthquake Model (GEM) Seismic Hazard Map (ver. 2018.1, December 2018): GEM, accessed October 2019 at https://doi.org/10.13117/GEM-GLOBAL-SEISMIC-HAZARD-MAP-2018.1.
Pagani, M., Garcia-Pelaez, J., Gee, R., Johnson, K., Poggi, V., Silva, V., Simionato, M., Styron, R., Viganò, D., Danciu, L., Monelli, D., and Weatherill, G., 2020, The 2018 version of the Global Earthquake Model—Hazard component: Earthquake Spectra, v. 36, no. 1 suppl., p. 226–251, accessed September 2021 at https://doi.org/10.1177/8755293020931866.
Petersen, M.D., Harmsen, S.C., Jaiswal, K.S., Rukstales, K.S., Luco, N., Haller, K.M., Mueller, C.S., and Shumway, A.M., 2018, Seismic hazard, risk, and design for South America: Bulletin of the Seismological Society of America, v. 108, no. 2, p. 781–800, accessed February 2022 at https://doi.org/10.1785/0120170002.
Polyak, D. E., 2023, Rhenium, in Mineral commodity summaries 2023: U.S. Geological Survey, p. 144–145, accessed February 2024 at https://doi.org/10.3133/mcs2023.
QY Research Inc., 2019, Global rhenium market insights, forecast to 2026: City of Industry, Calif., QY Research Inc., 145 p., accessed March 2019 at https://www.qyresearch.com.
S&P Global, 2019, S&P market intelligence database: Englewood, Colo., S&P Global, accessed October 2019 at https://www.spglobal.com/en/.
Safirova, E., 2022, The mineral industry of Russia [advanced release], in Metals and minerals: U.S. Geological Survey Minerals Yearbook 2017–2018, v. III, p. 39.1–39.19, accessed February 2022 at https://pubs.usgs.gov/myb/vol3/2017-18/myb3-2017-18-russia.pdf.
Schnebele, E., Jaiswal, K., Luco, N., and Nassar, N.T., 2019, Natural hazards and mineral commodity supply—Quantifying risk of earthquake disruption to South American copper supply: Resources Policy, v. 63, art. 101430, 10 p., https://doi.org/10.1016/j.resourpol.2019.101430.
Schulte, R.F., 2021, Platinum-group metals, in Mineral commodity summaries 2021: U.S. Geological Survey, p. 124–125, accessed March 2021 at https://doi.org/10.3133/mcs2021.
Shedd, K.B., 2021, Cobalt, in Mineral commodity summaries 2021: U.S. Geological Survey, p. 50–51, accessed March 2021 at https://doi.org/10.3133/mcs2021.
Sillitoe, R.H., 2010, Porphyry copper systems: Economic Geology, v. 105, p. 3–41, accessed November 2018 at https://doi.org/10.2113/gsecongeo.105.1.3.
Soto-Viruet, Y., Menzie, W.D., Papp, J.F., and Yager, T.R., 2013, An exploration in mineral supply chain mapping using tantalum as an example: U.S. Geological Survey Open-File Report 2013–1239, 51 p., accessed September 2021 at https://pubs.usgs.gov/of/2013/1239.
Soto-Viruet, Y., 2022a, The mineral industry of Chile [advanced release], in Metals and minerals: U.S. Geological Survey Minerals Yearbook 2017–2018, v. III, p. 7.1–7.18, accessed March 2022 at https://pubs.usgs.gov/myb/vol3/2017-18/myb3-2017-18-chile.pdf.
Soto-Viruet, Y., 2022b, The mineral industry of Peru [advanced release], in Metals and minerals: U.S. Geological Survey Minerals Yearbook 2017–2018, v. III, p. 16.1–6.14, accessed February 2022 at https://pubs.usgs.gov/myb/vol3/2017-18/myb3-2017-18-peru.pdf.
World Bank Group, 2021, World Bank open data: World Bank Group website, accessed March 19, 2021, at https://data.worldbank.org/.
Yager, T.R., 2022, The mineral industry of Congo (Kinshasa) [advanced release], in Metals and minerals: U.S. Geological Survey Minerals Yearbook 2017–2018, v. III, p. 12.1–12.14, accessed March 2022 at https://pubs.usgs.gov/myb/vol3/2017-18/myb3-2017-18-congo-kinshasa.pdf.
Xun, S., 2020, The mineral industry of China [advanced release], in Metals and minerals: U.S. Geological Survey Minerals Yearbook 2017–2018, v. III, p. 9.1–9.29, accessed September 2020 at https://d9-wret.s3.us-west-2.amazonaws.com/assets/palladium/production/atoms/files/myb3-2017-18-ch.pdf.
Publishing support provided by the Science Publishing Network,
Denver Publishing Service Center
For more information concerning the research in this report, contact the
Center Director, USGS Geologic Hazards Science Center
Box 25046, Mail Stop 966
Denver, CO 80225
(303) 273-8579
Or visit the Geologic Hazards Science Center website at
https://www.usgs.gov/centers/geologic-hazards-science-center
Disclaimers
Any use of trade, firm, or product names is for descriptive purposes only and does not imply endorsement by the U.S. Government.
Although this information product, for the most part, is in the public domain, it also may contain copyrighted materials as noted in the text. Permission to reproduce copyrighted items must be secured from the copyright owner.
Suggested Citation
Jaiswal, K.S., Luco, N., Schnebele, E.K., Nassar, N.T., and Otarod, D., 2024, Quantitative risk of earthquake disruption to global copper and rhenium supply: U.S. Geological Survey Open-File Report 2024–1028, 19 p., https://doi.org/10.3133/ofr20241028.
ISSN: 2331-1258 (online)
| Publication type | Report |
|---|---|
| Publication Subtype | USGS Numbered Series |
| Title | Quantitative risk of earthquake disruption to global copper and rhenium supply |
| Series title | Open-File Report |
| Series number | 2024-1028 |
| DOI | 10.3133/ofr20241028 |
| Publication Date | July 30, 2024 |
| Year Published | 2024 |
| Language | English |
| Publisher | U.S. Geological Survey |
| Publisher location | Reston, VA |
| Contributing office(s) | National Minerals Information Center, Geologic Hazards Science Center - Seismology / Geomagnetism |
| Description | iv, 19 p. |
| Online Only (Y/N) | Y |