

Investigation of Land Cover Within Wetland Complexes at Dixie Meadows, Churchill County, Nevada, from October 2015 to January 2022
Links
- Document: Report (5.93 MB pdf) , HTML , XML
- Data Release: USGS data release - Land cover classification data for wetland complexes at Dixie Meadows, Nevada from October 2015 to January 2022
- NGMDB Index Page: National Geologic Map Database Index Page (html)
- Download citation as: RIS | Dublin Core
Acknowledgments
This work was supported by the U.S. Fish and Wildlife Service through an interagency agreement (no. 4500165899) with the U.S. Geological Survey (USGS) Southwest Biological Science Center. The authors acknowledge Brian Halstead (USGS), Jonathan Rose (USGS), Patrick Kleeman (USGS), and Jessica Walker (USGS) for helpful discussions and reviews that improved the report.
Abstract
The U.S. Geological Survey investigated land cover at subannual time steps within six wetland areas in Dixie Valley, Churchill County, Nevada, from October 2015 to January 2022. As requested by the U.S. Fish and Wildlife Service, we used aerial photography and satellite remote sensing data to map surface water and other land cover types within the wetland complexes. We identified five land cover classes using the Green Normalized Difference Vegetation Index (gNDVI) and its inverse relationship to the Normalized Difference Water Index (NDWI) within three National Agriculture Imagery Program (NAIP) aerial images (acquired in 2015, 2017, and 2019) and 110 European Space Agency Sentinel-2 satellite images (acquired 2015–2022). The relative wetness of soil conditions within each land cover class is estimated by comparison to previously published observations of relative conductivity measured by 79 field-based loggers within the wetlands from 2019 to 2021. We mapped the areal coverage of the five land cover classes for approximately 385 acres comprising six individual wetland complexes (1,559,000 square meters [m2]) as well as a larger 1,298-acre (5,254,000 m2) area of interest inclusive of the wetland complexes and adjacent landscape. Land cover of open water (Class 5) primarily within ponds at one of the wetland complexes comprised 8,333 m2, on average, of the wetland complexes. Land cover of mixed shallow surface water, saturated soil, and vegetation (Class 4) comprised 111,723 m2 on average of the wetland complexes. Land cover of dense green vegetation canopy cover (Class 3) that often (46 percent of observations) had underlying surface water or saturated soil conditions comprised 592,522 m2 on average of the wetland complexes. The remaining areas of the wetland complexes not mapped as these three land cover types (Classes 2 and 1) had sparse vegetation or bare soil cover and commonly (greater than or equal to [≥] 67 percent of observations) had dry soil conditions. The investigation of land cover detailed in this report could inform future efforts to map land cover more precisely via higher resolution remote sensing or ground-based surveying or could be incorporated with other environmental monitoring data to characterize habitat and hydrology of the wetland complexes at Dixie Meadows.
Introduction
Dixie Meadows, Nevada, is a system of springs and seeps of varying discharge volumes and temperatures, which results in marshes and wet meadows. The volume and temperature of water in the wetlands change seasonally and interannually due to surface water and geothermal groundwater interactions (Garcia and others, 2014; Huntington and others, 2014). The wetlands are habitat for a variety of plant and wildlife species, including Anaxyrus williamsi (Dixie Valley toad), which is endemic to the wetlands (Forrest and others, 2017; Gordon and others, 2017; Halstead and others, 2021; Rose and others, 2023). To better understand the dynamically changing water, vegetation, and soil conditions at Dixie Meadows, the U.S. Fish and Wildlife Service (USFWS) requested that the U.S. Geological Survey (USGS) Southwest Biological Science Center (SBSC) use aerial photography and satellite remote sensing data to map surface water and other land cover types within six wetland complexes. This report presents the results of a preliminary investigation of land cover within these wetland complexes. Land cover is assessed by analyzing U.S. Department of Agriculture’s (USDA) National Agriculture Imagery Program (NAIP; Earth Resources Observation and Science Center, 2018) aerial imagery (acquired in 2015, 2017, and 2019) provided courtesy of the U.S. Geological Survey and Sentinel-2 satellite imagery (acquired 2015–2022) and courtesy of the European Space Agency (ESA) using the Green Normalized Difference Vegetation Index (gNDVI, Gitelson and others, 1996) and its inverse relationship to the Normalized Difference Water Index (NDWI; McFeeters, 1996).
Objectives
In this report, we investigate land cover within wetland areas in Dixie Valley, Nevada, at sub-annual time steps from October 2015 to January 2022. The relative wetness of soil conditions is estimated for each land cover class using ground-based observations of relative conductivity for 2019–2021 previously published by Kleeman and Halstead (2022).
Material and Methods
Analysis was focused on an area inclusive of six wetland complexes within Dixie Meadows in Churchill County, Nevada (Halstead and others, 2019; Rose and others, 2023; fig. 1). The perimeters of wetland complexes 1A, 2, 3, 4, 5, 6 shown in figure 1 were defined by Halstead and others (2019) and Rose and others (2023). Perimeters of complex 1B and the more general area of interest shown in figure 1 were defined in this project (Bransky and others, 2023). We used the area as a spatial extent to review and select publicly available aerial and satellite images acquired between 2015 and 2022 for mapping wetland land cover types of water, vegetation, and soil.
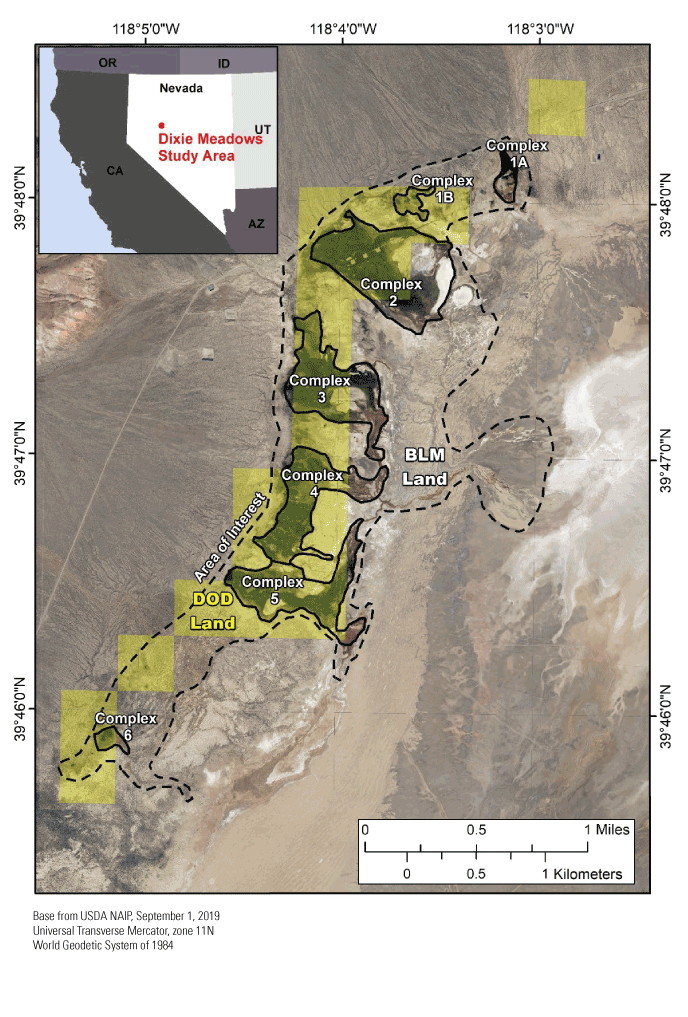
Map of the Dixie Meadows study area within Dixie Valley, Churchill County, Nevada. The perimeters of wetland complexes 1A, 2, 3, 4, 5, 6 were defined by Halstead and others (2019) and Rose and others (2023). Perimeters of complex 1B and the more general area of interest were additionally defined for this project. Background true-color image is aerial photography from September 1, 2019 collected by the U.S. Department of Agriculture’s (USDA) National Agriculture Imagery Program (NAIP), provided courtesy of the U.S. Geological Survey (https://earthexplorer.usgs.gov, accessed September 9, 2022). Land management is denoted with areas shaded yellow for Department of Defense (DOD) land and unshaded areas for Bureau of Land Management (BLM) land.
Remote Sensing Datasets
USDA NAIP acquired 1-meter (m) resolution multispectral imagery over the study area during June 13, 2015, and 60-centimeter (cm) resolution multispectral imagery during October 22, 2017, and September 1, 2019, that was provided courtesy of the USGS (https://earthexplorer.usgs.gov, accessed September 9, 2022) (figs. 1, 2A). The 2019 NAIP multispectral image was acquired using a Leica Geosystem's ADS100/SH100 digital sensor with four image bands: (1) blue (435–495 nanometers [nm]), (2) green (525–585 nm), (3) red (619–651 nm), and (4) near-infrared (808–882 nm) (Earth Resources Observation and Science Center, 2018). Although NAIP imagery provides high spatial resolution for assessing land cover, it was only acquired three times during the 2015–2022 analysis period. Thus, the NAIP imagery was used for developing a training dataset that could be applied to land cover classification within a coarser spatial resolution, but a higher temporal resolution satellite dataset.
The ESA’s Sentinel-2 mission began acquiring satellite imagery in late 2015 and collected at least one 10-m resolution multispectral image per month for the study area, giving it higher temporal, though lower spatial, resolution than NAIP imagery. The Sentinel-2 satellites acquire images in 13 spectral bands that have different spectral ranges than NAIP images, specifically for the blue (464.1–529.1 nm), green (542.5–577.5 nm), red (649.5–679.5 nm), and near-infrared (777.6–892.6 nm) bands. For analysis, Sentinel-2 satellite imagery was processed to atmospherically corrected Bottom-of-Atmosphere (BOA) reflectance, termed a Level 2A scene. For imagery acquired between December 2018 and September 2022, Level 2A scenes were publicly available through Google Earth Engine (GEE), a cloud computing platform for remote sensing analysis on Google servers (Gorelick and others, 2017). There were 274 atmospherically corrected, Level 2A scenes available on GEE between December 13, 2018, and September 13, 2022. For data collected prior to December 2018, Level 2A scenes were not publicly available, so we acquired 26 Top-of-Atmosphere (TOA) reflectance images (termed Level 1C) without high cloud cover courtesy of the USGS repository (https://earthexplorer.usgs.gov; accessed January 10, 2023) and processed them to BOA reflectance using the Sen2Cor algorithm provided by the ESA (https://step.esa.int/main/snap-supported-plugins/).
Not all Sentinel-2 Level 2A scenes were usable for land cover classification owing to cloud cover or other effects on surface reflectance. We filtered the 274 scenes available on GEE by cloud cover to ensure the highest-quality data were used in the time series. First, images with an average cloud probability greater than 50 percent within the study area were removed. Second, images with average cloud probability less than 50 percent were visually inspected and removed if cloud shadows or cover were obvious. After cloudy images were excluded, 84 scenes of the 274 remained. With the 84 filtered Level 2A scenes available on GEE and the additional 26 Level 1C scenes that we corrected to Level 2A with the Sen2Cor algorithm, we analyzed a total of 110 Sentinel-2 Level 2A scenes acquired between October 2015 and January 2022.
Classification of Surface Water and Wetland Cover
Visual inspection of true-color composites of the NAIP aerial images highlighted five contrasting land cover types by landscape position within the wetland complexes (fig. 2).
-
Land cover type 1: Bright tan-colored areas of apparent dry bare soil and sparse upland vegetation occurred in between the wetland complexes and in some locations within the wetland complexes.
-
Land cover type 2: Darker-colored areas were located around the perimeter of the wetland complexes with apparent moist bare soil and sparse or small vegetation.
-
Land cover type 3: Bright green areas of apparent dense vegetation cover were located within the interior of the wetland complexes.
-
Land cover type 4: Dark areas of mixed shallow surface water, saturated soil, and vegetation occurred in the interior of the wetland complexes and along apparent depressions and linear channel features.
-
Land cover type 5: Dark areas of water occurred in ponds of complex 2 in the 2015 NAIP image, but those ponds appeared to be mostly bare, dry soil in the 2017 and 2019 NAIP images.
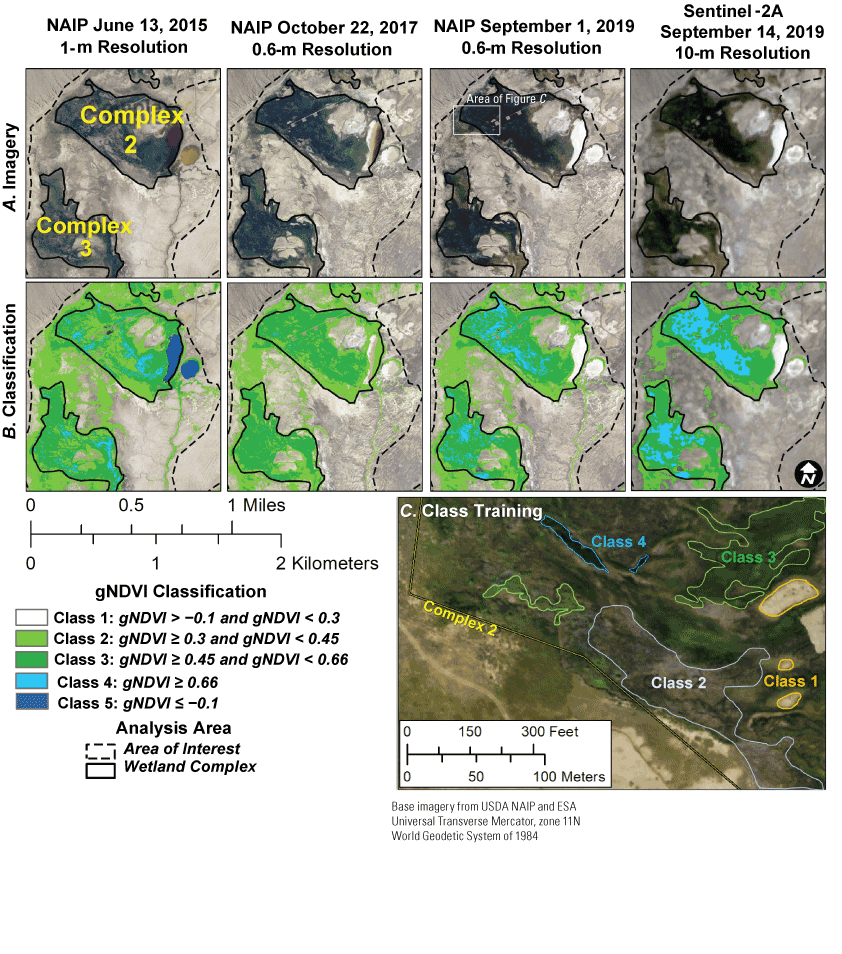
Land cover classification of wetland complexes 2 and 3 in Dixie Meadows, Nevada. A, U.S. Department of Agriculture (USDA) National Agriculture Imagery Program (NAIP) aerial images from 2015, 2017, and 2019 provided courtesy of the U.S. Geological Survey, and European Space Agency (ESA) Sentinel-2 satellite image from 2019 (courtesy of ESA) for an area centered around wetland complexes 2 and 3, in Dixie Meadows, Nevada. B, Five classified land covers for the three NAIP datasets and the 2019 Sentinel-2 datasets. Classes were defined by the Green Normalized Difference Vegetation Index (gNDVI) based on known relationships with open water (Class 5) and a maximum likelihood supervised classification built from interpretation of the other four land cover types: Class 1, Bright areas of apparent dry soil and sparse upland vegetation; Class 2, Darker areas with apparent moist soil and sparse or small vegetation; Class 3, Bright green areas of apparent dense vegetation cover; and Class 4, Dark areas of mixed shallow surface water, saturated soil, and vegetation within the wetland complexes. Panel C shows example polygons of training data for classes 1–4 overlaid on the NAIP 2019 aerial photography.
We delineated land cover types 1–4 in the September 1, 2019, NAIP aerial image using a maximum likelihood supervised classification (Lillesand and others, 2015; ArcGIS v. 10.7, interactive supervised classification tool) based on 55 polygons of image-derived training data representing an average of 20,000 pixels collected for each land cover type. The 2019 NAIP image was used because there was a corresponding Sentinel-2 image acquired close in time on September 14, 2019, and because the ground-based relative conductivity observation campaign by Kleeman and Halstead (2022) began in 2019 (explained in more detail in the next section below “Evaluating the Relative Wetness of land Cover Classes”). Next, within the areas mapped as land cover types 1–4 in the supervised classification, we summarized the September 14, 2019, Sentinel-2 image, focusing specifically on the green and near-infrared spectral bands (fig. 3) which were used to calculate the gNDVI (eq. 1; Gitelson and others, 1996) and the NDWI (eq. 2; McFeeters, 1996) in this report.
The gNDVI was originally proposed by Gitelson and others (1996), who showed that it is sensitive to variations in chlorophyll associated with land cover of green, photosynthetically active plant cover
where Notably for this study, the inverse of gNDVI is NDWI (eq. 2) originally proposed by McFeeters (1996): where positive values of NDWI (that is, negative gNDVI) indicate open water (McFeeters, 1996). NDWI values close to zero and negative (that is, positive gNDVI) indicate non-water such as vegetation or dry soil cover (Gitelson and others, 1996; McFeeters, 1996; Mahdianpari and others, 2018; Cavallo and others, 2021). However, smaller negative NDWI values (that is, larger positive gNDVI), where NIR reflectance is especially high relative to G reflectance, can indicate areas of muddy, turbid, or hydrothermal water (McFeeters, 1996; Rad and others, 2021).Figure 3 shows the distribution of pixel values for the green and NIR bands summarized for land cover types 1–4 for the September 1, 2019, NAIP image and the September 14, 2019, Sentinel-2 image. We calculated the inter-quartile range of gNDVI in the September 14, 2019, Sentinel-2 image for land cover types 1–4 to define a gNDVI threshold-based classification. Although classification breaks are defined by gNDVI values, the interpretation of those values in terms of water presence and quality is also informed by NDWI-based studies.
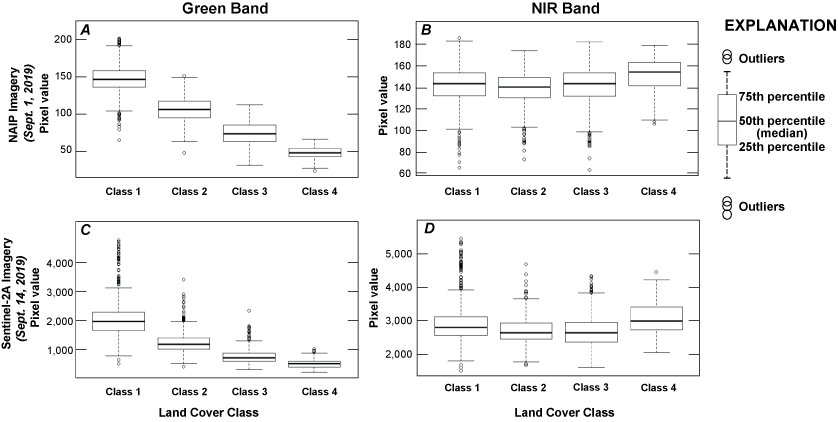
Graphs showing the distribution of green and near-infrared spectral band pixel values for land cover types 1–4 for two aerial images of Dixie Meadows, Nevada, from September 2019. Panels A and B summarize green (A) and near-infrared (B) spectral band pixel values for 3,000 random sampling points within the area of interest for classes 1–4 (illustrated in fig. 2B, C) for the September 1, 2019, U.S. Department of Agriculture (USDA) National Agriculture Imagery Program (NAIP) aerial image. Panels C and D present the green (C) and near-infrared (D) spectral band pixel values for the same points and classes as panels A and B but for the September 14, 2019, European Space Agency (ESA) Sentinel-2 Level 2A scene. Plots show the median (central line), first and third quartile (box), and maximum and minimum values (lines and outlier points). The green and near-infrared bands are used to determine landcover classes in this study by calculating the Green Normalized Difference Vegetation Index, which has an inverse relationship to the Normalized Difference Water Index. September 1, 2019, USDA NAIP aerial image courtesy of U.S. Geological Survey. September 14, 2019, Sentinel-2 Level 2A scene courtesy of ESA. NIR, near-infrared.
Based on the inter-quartile range, and based on observations that water—when present in other image dates—had negative gNDVI values (that is, positive NDWI values; McFeeters, 1996) in the ponds in Complex 2, we defined five ranges of gNDVI to map classes 1–5 in Sentinel-2 images corresponding to land cover types 1–5 listed above, as (fig. 2B):
-
Class 1: gNDVI >-0.1 and gNDVI <0.3
-
Class 2: gNDVI ≥0.3 and gNDVI <0.45
-
Class 3: gNDVI ≥0.45 and gNDVI <0.66
-
Class 4: gNDVI ≥0.66
-
Class 5: gNDVI ≤-0.1
We calculated gNDVI for each of the 110 Sentinel-2 scenes subset to the area of interest within GEE, and then produced a time series of maps from October 2015 to January 2022 based on the five gNDVI-defined classes of land cover within the area of interest and wetland complexes (appendix 1; maps available in the data release by Bransky and others, 2023).
Evaluating the Relative Wetness of Land Cover Classes
We estimated the relative wetness of soil conditions within each gNDVI-defined land cover class for 75 of the 110 Sentinel-2 classification maps in the time-series using ground-based observations of relative conductivity for 2019–2021 previously published by Kleeman and Halstead (2022). Kleeman and Halstead (2022) deployed a network of 79 Stream Temperature, Intermittency, and Conductivity (STIC) loggers that collected temperature and relative conductivity at the ground surface within the wetland complexes at 30-minute intervals. Locations of STIC loggers are shown in the maps available in the data release by Bransky and others (2023) (see also, appendix 1). We used the observations of relative conductivity to determine for each date (day) and STIC location the relative proportion of observations of presence (at least one observation exceeded 0 microSiemens per centimeter [µS/cm] on that date) or absence (all observations were 0 µS/cm on that date) of surface water or saturated soil within areas mapped as classes 1–5 among STIC locations and maps in the time series between April 2019 and September 2021.
Results
Relative Wetness of Land Cover Classes
Figure 4 illustrates the relative wetness of soil conditions within areas mapped as each of the classes. One-hundred percent and 71 percent of the relative conductivity observations within areas mapped as Class 5 and Class 4, respectively, indicated wet conditions with surface water or saturated soil present. Forty-six percent, 33 percent, and 16 percent of the relative conductivity observations within areas mapped as Class 3, 2, and 1, respectively, indicated wet conditions with surface water or saturated soil present. Thus, areas mapped as Class 5 and 4 tended to have wet soil conditions for most of the observed time, whereas areas mapped as Class 3 had wet soil conditions for slightly less than half of the observed time, and areas mapped as Classes 2 and 1 most often had dry soil conditions.
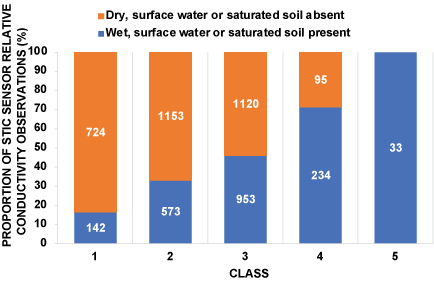
Graph of the summary of the relative proportion of observations of the presence or absence of surface water or saturated soil within areas mapped as classes 1–5 in the map time series between April 2019 and September 2021, Dixie Meadows, Nevada. Observations of the presence or absence of surface water or saturated soil are from daily relative conductivity determined at 79 Stream Temperature, Intermittency, and Conductivity (STIC) loggers that collected temperature and relative conductivity within the wetland complexes at 30-minute intervals from April 2019 through September 2021. STIC data from Kleeman and Halstead, 2022. Locations of STIC loggers are shown in maps available in the data release by Bransky and others (2023) (see also, appendix 1). Numbers reported on each portion of the bars are the respective number of observations.
Land Cover Class Area
Maps of the five gNDVI classes for the 110 Sentinel-2 images acquired between October 5, 2015, and January 21, 2022, a tabular summary of the area mapped for each class, image date in the wetland complexes, and the area of interest are provided in the associated data release (Bransky and others, 2023). Figure 5 summarizes the area mapped for each class among the 110 images within the wetland complexes (fig. 5A) and the entire area of interest (fig. 5B). The average area mapped among image dates for each class within the wetland complexes is:
-
Class 1: 317,768 square meters (m2) (31.78 hectares [ha]; 78.52 acres)
-
Class 2: 528,655 m2 (52.86 ha; 130.63 acres)
-
Class 3: 592,522 m2 (59.25 ha; 146.42 acres)
-
Class 4: 111,723 m2 (11.17 ha; 27.61 acres)
-
Class 5: 8,333 m2 (0.83 ha; 2.06 acres)
Figure 5 shows that the area covered by each class varied over time among the 110 Sentinel-2 image classifications. Within the wetland complexes, the wettest classes—Class 5 and Class 4—ranged in area from 0 to 31,900 m2 (0–3.19 ha; 0–7.88 acres) and 0 to 593,000 m2 (0–59.30 ha; 0-146.53 acres) over time, respectively. Class 3, which had wet soil conditions for slightly less than half of the observed time, ranged in area within the wetland complexes from 17,900 to 1,077,200 m2 (1.79–107.72 ha; 4.42–266.18 acres) over time. The area mapped as the driest classes—Class 2 and Class 1—ranged in area from 176,600 to 1,086,700 m2 (17.66–108.67 ha; 43.64–268.53 acres) and 145,400 to 807,700 m2 (14.54–80.77 ha; 35.93–199.59 acres), respectively, within the wetland complexes over time.
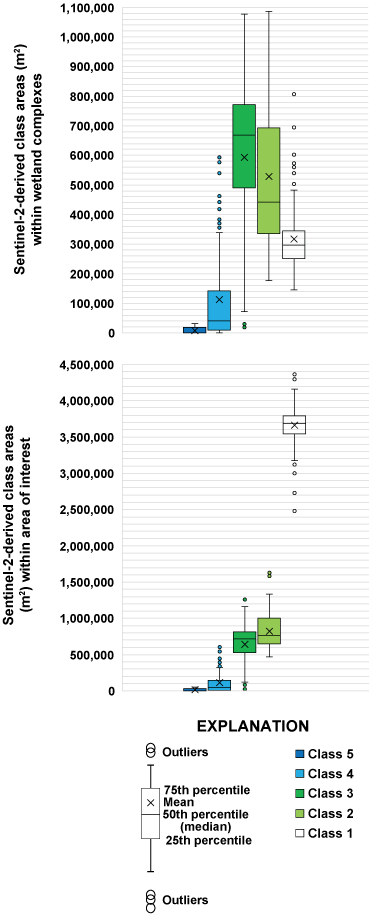
Boxplots summarizing the area mapped for each class in the 110 European Space Agency (ESA) Sentinel-2 images acquired between October 5, 2015, and January 21, 2022, in Dixie Meadows, Nevada (courtesy of ESA). A, Summary of class areas mapped within the wetland complexes. B, Summary of class areas mapped within the entire area of interest. Plots show the mean (x), median (central line), first and third quartile (box), and maximum and minimum values (lines and outlier points). m2, square meters.
Discussion and Conclusion
Using 110 multispectral satellite images in 10-meter (m) resolution, acquired between October 2015 and January 2022, we mapped five land cover classes in approximately 385 acres within six wetland complexes (1,559,000 square meters [m2]) as well as a larger 1,298-acre (5,254,000 m2) area of interest inclusive of the wetland complexes and adjacent landscape in Dixie Meadows, Nevada. The five land cover classes demonstrated differing potential for wet conditions with surface water or saturated soil based on comparisons to daily observations of relative conductivity. Areas of open water (Class 5) primarily within ponds in and adjacent to complex 2 comprised 2.06 acres (8,333 m2) on average of the wetland complexes. Areas of mixed shallow surface water, saturated soil, and vegetation (Class 4) comprised 27.61 acres (111,723 m2) on average of the wetland complexes. Areas of dense green vegetation canopy cover, that often (46 percent of observations) had underlying surface water or saturated soil conditions (Class 3) comprised 146.42 acres (592,522 m2) on average of the wetland complexes. The remaining areas of the wetland complexes, Classes 1 and 2, had vegetation or bare soil cover with mostly dry soil conditions.
This investigation was based on analyses of the 110 Sentinel-2 satellite images (10-m resolution), three 60-centimeter (cm) to 1-m pixel resolution USDA NAIP multispectral aerial images (acquired in 2015, 2017, and 2019), and comparison of the image analysis results with previously published observations by Kleeman and Halstead (2022) of the presence or absence of wet or dry surface water and saturated soil conditions from relative conductivity measured at 79 Stream Temperature, Intermittency, and Conductivity (STIC) loggers from April 2019 to September 2021. We used the Green Normalized Difference Vegetation Index (gNDVI) (Gitelson and others, 1996) and its inverse relationship to the Normalized Difference Water Index (NDWI) (McFeeters, 1996) to define the five land cover classes which were then compared to the relative conductivity observations. We did not visit the study site or acquire ground truth observations. Different results might be determined based on land cover assessments of the wetland complexes conducted over a different time period, using different remotely sensed imagery, using different image processing and analysis methods, using different ground observations of surface water and soil moisture conditions, and (or) if study site visits and ground truth data collection were logistically and financially feasible to implement.
Future investigations of land cover in the wetland complexes at Dixie Valley that employ Sentinel-2 or other satellite image time-series may consider either applying different threshold values of gNDVI than used in this study or using a different index or image classification approach (for example, Gao, 1996; Soulard and others, 2022) to define a set of wetland map classes in relation to training data. In addition to summarizing the areal extent of each map class by image date as we have in this report, future investigations could conduct change detection analysis of the classification maps between two or more image dates. Prior to implementing change detection analysis, imagery or classification maps should be co-registered to limit spatial uncertainty. As an alternative to satellite image analysis, higher spatial and spectral resolution uncrewed aircraft systems (UAS) remote sensing could be employed in future investigations to map the boundaries of land cover types more precisely, and to detect discrete areas (that is, image pixels with a single cover type) of water, soil, and vegetation cover types. Ground-based total station surveys or Real-Time Kinematic Global Position System or Global Navigation Satellite Systems (RTK-GPS/GNSS) surveys could be used in the future to delineate water, vegetation, dry and moist soil more accurately and precisely, as well as to map the topography and bathymetry of the wetland complexes and surrounding areas. Such future work, in conjunction with the investigation of land cover detailed in this report, as well as other environmental monitoring data (for example, Halstead and others, 2019; Halstead and Kleeman, 2020; Kleeman and Halstead, 2022) could help inform important habitat characteristics (for example, Rose and others, 2023) of the wetland complexes at Dixie Meadows.
References Cited
Bransky, N., Caster, J., and Sankey, J.B., 2023, Land cover classification data for wetland complexes at Dixie Meadows, Nevada from October 2015 to January 2022: U.S. Geological Survey data release, https://doi.org/10.5066/P90U1VAM.
Cavallo, C., Papa, M.N., Gargiulo, M., Palau-Salvador, G., Vezza, P., and Ruello, G., 2021, Continuous monitoring of the flooding dynamics in the Albufera Wetland (Spain) by Landsat-8 and Sentinel-2 datasets: Remote Sensing, v. 13, no. 17, article 3525, 28 p., accessed September 28, 2023, at https://doi.org/10.3390/rs13173525.
Earth Resources Observation and Science Center, 2018, USGS EROS Archive—Aerial Photography—National Agriculture Imagery Program (NAIP): U.S. Geological Survey web page, accessed September 28, 2023, at https://doi.org/10.5066/F7QN651G.
Forrest, M.J., Stiller, J., King, T.L., and Rouse, G.W., 2017, Between hot rocks and dry places—The status of the Dixie Valley Toad: Western North American Naturalist, v. 77, no. 2, p. 162–175, accessed September 28, 2023, at https://doi.org/10.3398/064.077.0204.
Gao, B.-C., 1996, NDWI—A normalized difference water index for remote sensing of vegetation liquid water from space: Remote Sensing of Environment, v. 58, no. 3, p. 257–266, accessed September 28, 2023, at https://doi.org/10.1016/S0034-4257(96)00067-3.
Garcia, C.A., Huntington, J.M., Buto, S.G., Moreo, M.T., Smith, J.L., and Andraski, B.J., 2014, Groundwater discharge by evapotranspiration, Dixie Valley, west-central Nevada, March 2009–September 2011 (ver. 1.1, April 2015): U.S. Geological Survey Professional Paper 1805, 90 p., accessed September 28, 2023, at https://doi.org/10.3133/pp1805.
Gitelson, A.A., Kaufman, Y.J., and Merzlyak, M.N., 1996, Use of a green channel in remote sensing of global vegetation from EOS-MODIS: Remote Sensing of Environment, v. 58, no. 3, p. 289–298, accessed September 28, 2023, at https://doi.org/10.1016/S0034-4257(96)00072-7.
Gordon, M.R., Simandle, E.T., and Tracy, C.R., 2017, A diamond in the rough desert shrublands of the Great Basin in the Western United States—A new cryptic toad species (Amphibia—Bufonidae, Bufo (Anaxyrus)) discovered in Northern Nevada: Zootaxa, v. 4290, no. 1, p. 123–139, accessed September 28, 2023, at https://doi.org/10.11646/zootaxa.4290.1.7.
Gorelick, N., Hancher, M., Dixon, M., Ilyushchenko, S., Thau, D., and Moore, R., 2017, Google Earth Engine—Planetary-scale geospatial analysis for everyone: Remote Sensing of Environment, v. 202, p. 18–27, accessed September 28, 2023, at https://doi.org/10.1016/j.rse.2017.06.031.
Halstead, B.J., and Kleeman, P.M., 2020, Site and survey data for Dixie Valley toads in Churchill County, Nevada, 2019: U.S. Geological Survey data release, accessed September 28, 2023, at https://doi.org/10.5066/P9BT38WU.
Halstead, B.J., Kleeman, P.M., Duarte, A., Rose, J.P., Urquhart, K., Mellison, C., Guadalupe, K., Cota, M., Van Horne, R., Killion, A., and Ruehling, K., 2019, Monitoring protocol development and assessment for narrowly endemic toads in Nevada, 2018: U.S. Geological Survey Open-File Report 2019–1067, 28 p., accessed September 28, 2023, at https://doi.org/10.3133/ofr20191067.
Halstead, B.J., Kleeman, P.M., Rose, J.P., and Fouts, K.J., 2021, Water temperature and availability shape the spatial ecology of a hot springs endemic toad (Anaxyrus williamsi): Herpetologica, v. 77, no. 1., p. 24–36, accessed September 28, 2023 at https://doi.org/10.1655/HERPETOLOGICA-D-20-00047.
Huntington, J.M., Garcia, C.A., and Rosen, M.R., 2014, Hydrogeologic framework and occurrence, movement, and chemical characterization of groundwater in Dixie Valley, west-central Nevada: U.S. Geological Survey Scientific Investigations Report 2014–5152, 60 p., accessed September 28, 2023, at https://doi.org/10.3133/sir20145152.
Kleeman, P.M, and Halstead, B.J., 2022, Temperature and relative conductivity at sampling locations in the Dixie Valley, Churchill County, Nevada, 2019–2021: U.S. Geological Survey data release, accessed September 28, 2023, at https://doi.org/10.5066/P95BHQXT.
Mahdianpari, M., Salehi, B., Mohammadimanesh, F., Homayouni, S. and Gill, E., 2018, The first wetland inventory map of Newfoundland at a spatial resolution of 10 m using Sentinel-1 and Sentinel-2 data on the Google Earth Engine cloud computing platform: Remote Sensing, v. 11, no. 1, 27 p., accessed September 28, 2023, at https://doi.org/10.3390/rs11010043.
McFeeters, S.K., 1996, The use of the Normalized Difference Water Index (NDWI) in the delineation of open water features: International Journal of Remote Sensing, v. 17, no. 7, p. 1425–1432, accessed September 28, 2023, at https://doi.org/10.1080/01431169608948714.
Rad, A.M., Kreitler, J., and Sadegh, M., 2021, Augmented Normalized Difference Water Index for improved surface water monitoring: Environmental Modelling & Software, v. 140, article 105030, accessed September 28, 2023, at https://doi.org/10.1016/j.envsoft.2021.105030.
Rose, J.P., KleemanP.M., and HalsteadB.J., 2023, Hot, wet and rare—Modelling the occupancy dynamics of the narrowly distributed Dixie Valley toad: Wildlife Research, v. 50. no. 7, p. 552–567, accessed September 28, 2023, at https://doi.org/10.1071/WR22029.
Soulard, C.E., Waller, E.K., Walker, J.J., Petrakis, R.E., and Smith, B.W., 2022, DSWEmod—The production of high‐frequency surface water map composites from daily MODIS images: Journal of the American Water Resources Association, v. 58, no. 2, p. 248–268, accessed September 28, 2023, at https://doi.org/10.1111/1752-1688.12996.
Appendix 1. Sentinel-2 Image Classification Maps for Dixie Meadows, Churchill County, Nevada
-
Class 1. Bright areas of apparent dry soil and sparse upland vegetation,
-
Class 2. Darker areas with apparent moist soil and sparse or short vegetation,
-
Class 3. Bright green areas of apparent dense vegetation cover,
-
Class 4. Dark areas of mixed shallow surface water, saturated soil, or vegetation, and
-
Class 5. Open water.
References Cited
Bransky, N., Caster, J., and Sankey, J.B., 2023, Land cover classification data for wetland complexes at Dixie Meadows, Nevada from October 2015 to January 2022: U.S. Geological Survey data release, https://doi.org/10.5066/P90U1VAM.
Gitelson, A.A., Kaufman, Y.J., and Merzlyak, M.N., 1996, Use of a green channel in remote sensing of global vegetation from EOS-MODIS: Remote Sensing of Environment, v. 58, no. 3, p. 289–298, accessed September 28, 2023, at https://doi.org/10.1016/S0034-4257(96)00072-7.
Kleeman, P.M, and Halstead, B.J., 2022, Temperature and relative conductivity at sampling locations in the Dixie Valley, Churchill County, Nevada, 2019–2021: U.S. Geological Survey data release, accessed September 28, 2023, at https://doi.org/10.5066/P95BHQXT.
Conversion Factors
Supplemental Information
Specific conductance is given in microsiemens per centimeter at 25 degrees Celsius (µS/cm at 25 °C).
Note to USGS users: Use of hectare (ha) as an alternative name for square hectometer (hm2) is restricted to the measurement of small land or water areas. 1 hectare is 10,000 square meters (m2).
Abbreviations
BOA
Bottom of Atmosphere
DOD
U.S. Department of Defense
ESA
European Space Agency
GEE
Google Earth Engine
gNDVI
Green Normalized Difference Vegetation Index
GNSS
Global Navigation Satellite System
GPS
Global Positioning System
NAIP
National Agriculture Imagery Program
NDWI
Normalized Difference Water Index
NIR
near infrared
nm
nanometer
RTK
Real-Time Kinematic
SBSC
Southwest Biological Science Center (USGS)
STIC
Stream Temperature, Intermittency, and Conductivity
TOA
Top of Atmosphere
UAS
uncrewed aircraft systems
USDA
U.S. Department of Agriculture
USFWS
U.S. Fish and Wildlife Service
USGS
U.S. Geological Survey
UTM
Universal Transverse Mercator
Moffett Field Publishing Service Center, California
Manuscript approved April 23, 2024
Layout by Kimber Petersen
Disclaimers
Any use of trade, firm, or product names is for descriptive purposes only and does not imply endorsement by the U.S. Government.
Although this information product, for the most part, is in the public domain, it also may contain copyrighted materials as noted in the text. Permission to reproduce copyrighted items must be secured from the copyright owner.
Suggested Citation
Sankey, J.B., Bransky, N.D., and Caster, J.J., 2024, Investigation of land cover within wetland complexes at Dixie Meadows, Churchill County, Nevada, from October 2015 to January 2022: U.S. Geological Survey Open-File Report 2024–1029, 10 p., https://doi.org/10.3133/ofr20241029.
ISSN: 2331-1258 (online)
Study Area
| Publication type | Report |
|---|---|
| Publication Subtype | USGS Numbered Series |
| Title | Investigation of land cover within wetland complexes at Dixie Meadows, Churchill County, Nevada, from October 2015 to January 2022 |
| Series title | Open-File Report |
| Series number | 2024-1029 |
| DOI | 10.3133/ofr20241029 |
| Publication Date | December 27, 2024 |
| Year Published | 2024 |
| Language | English |
| Publisher | U.S. Geological Survey |
| Publisher location | Reston, VA |
| Contributing office(s) | Southwest Biological Science Center |
| Description | Report: vi, 10 p.; Data Release |
| Country | United States |
| State | Nevada |
| County | Churchill County |
| Other Geospatial | Dixie Meadows |
| Online Only (Y/N) | Y |
| Additional Online Files (Y/N) | N |