

Environmental Monitoring of Groundwater, Surface Water, and Soil at the Ammonium Perchlorate Rocket Motor Destruction Facility at the Letterkenny Army Depot, Chambersburg, Pennsylvania, 2021
Links
- Document: Report (2.38 MB pdf) , HTML , XML
- Data Release: USGS data release - Groundwater, surface water, and soil data collected near and at the Ammonium Perchlorate Rocket Motor Destruction (ARMD) facility at the Letterkenny Army Depot, Chambersburg, Pennsylvania
- NGMDB Index Page: National Geologic Map Database Index Page (html)
- Download citation as: RIS | Dublin Core
Abstract
Letterkenny Army Depot in Chambersburg, Pennsylvania, built an Ammonium Perchlorate Rocket Motor Destruction (ARMD) Facility in 2016 to centralize rocket motor destruction and contain all waste during the destruction process. The U.S. Geological Survey has collected environmental samples from groundwater, surface water, and soils at ARMD since 2016.
During 2021, samples were collected from four groundwater wells in September, one surface-water site in October, and five soil sites in November near the facility. Samples were analyzed for nutrients, trace metals, major ions, total volatile organic compounds, and perchlorate. Perchlorate was not detected in any 2021 samples.
Groundwater results showed no constituents exceeded any U.S. Environmental Protection Agency (EPA) maximum contaminant level (MCL). Dissolved arsenic (As) was detected in one well above the reporting detection level (RDL) of 3 micrograms per liter (μg/L) at 5.4 μg/L but below its MCL of 10 μg/L. Dissolved iron (Fe) was the only inorganic constituent measured above an EPA secondary maximum contaminant level (SMCL). All groundwater samples collected in 2021 exceeded the Fe SMCL of 300 μg/L, with concentrations ranging from 390 μg/L to 3,500 μg/L.
Surface-water data collected during 2021 showed no measured constituents in the surface-water sample that exceeded any EPA MCL or SMCL.
Soil samples collected from 2016 through 2021 showed all concentrations of As exceeded the EPA soil screening levels of 3 milligrams per kilogram (mg/kg) but did not exceed the Pennsylvania medium-specific concentrations for As of 61 mg/kg. Arsenic concentrations in 2021 ranged from 9.1 mg/kg to 12.9 mg/kg.
The 2021 results for the ARMD Facility indicate no increases in concentrations of reported compounds compared to data from 2016 to 2020. The contained burn treatment facility for demilitarization of rocket motors during 2021 appears to have operated without elevating concentrations of target compounds compared to previous years.
Introduction
Letterkenny Army Depot (LEAD), located near Chambersburg, Pennsylvania, is a Federal Government facility that provides supply and maintenance support to the U.S. Armed Forces. Construction of the Ammonium Perchlorate Rocket Motor Destruction (ARMD) Facility at LEAD began in 2013 and was finished and ready for operation in late 2016. The two buildings that are considered the ARMD Facility are enclosed within a fenced area of approximately four acres. The ARMD Facility uses confined burning with emissions control to treat solid propellant rocket motors that were previously treated at uncontained outdoor grounds at LEAD. The process at the ARMD Facility includes static firing of full motors and containing and capturing the exhaust for treatment in a pollution abatement system. A confined burn system utilizes an ignition source to initiate combustion (rather than an auxiliary burner). The thermal treatment chamber is steel lined and is encased with concrete that acts as a secondary containment to prevent any leakage from the steel lined chamber (Redhorse Corporation, 2016). The byproduct of the confined burn is a non-hazardous solid waste, with no planned releases to surface water, groundwater, soils, stormwater runoff, or runoff sediment. However, 40 Code of Federal Regulations (CFR) Part 264 (Standards for Owners and Operators of Hazardous Waste Treatment, Storage, And Disposal Facilities), Subpart F (Releases from Solid Waste Management Units) requires monitoring and response programs (40 CFR § 264 subpart F; Redhorse Corporation, 2016). The monitoring program is in place to detect any increased concentrations of target compounds from data collected in 2016 and the years since. Given that the facility is designed for zero emissions, the monitoring is in place to verify that no emissions to nearby waters or soils are occurring.
To meet the CFR requirements for monitoring, an environmental sampling plan was developed by Redhorse Corporation (2016) in coordination with LEAD and the Pennsylvania Department of Environmental Protection (PADEP). The U.S. Geological Survey (USGS), in cooperation with LEAD and in support of the environmental sampling plan, conducted a study of constituents in groundwater, surface water, and soil between September and December 2016 to establish baseline concentrations of indicator compounds that could result from unplanned releases from the facility before operations began in January 2017 (Galeone, 2019a, 2019b). The beginning of facility operation in January 2017 terminated the baseline characterization period. Beginning in 2017, surface water and soils were sampled annually. The groundwater wells were sampled every three months beginning in March 2017 through September 2018, and then annually beginning in 2019.
Purpose and Scope
The purpose of this report is to present and summarize the data collected in 2021 in the vicinity of the ARMD Facility (fig. 1) and to characterize groundwater, surface water and soils for comparison to corresponding data collected from 2016 through 2020. Changes in indicator compound concentrations respective to background values are noted and 2021 data are compared to relevant regulatory and public health-based standards. Quality-assurance and quality-control (QA/QC) sample results for 2021 are also presented to validate results. The analytical results and field data for water and soil samples collected in 2021 are available online in a data release (Galeone and Zarr, 2023; https://doi.org/10.5066/P92YIATZ).
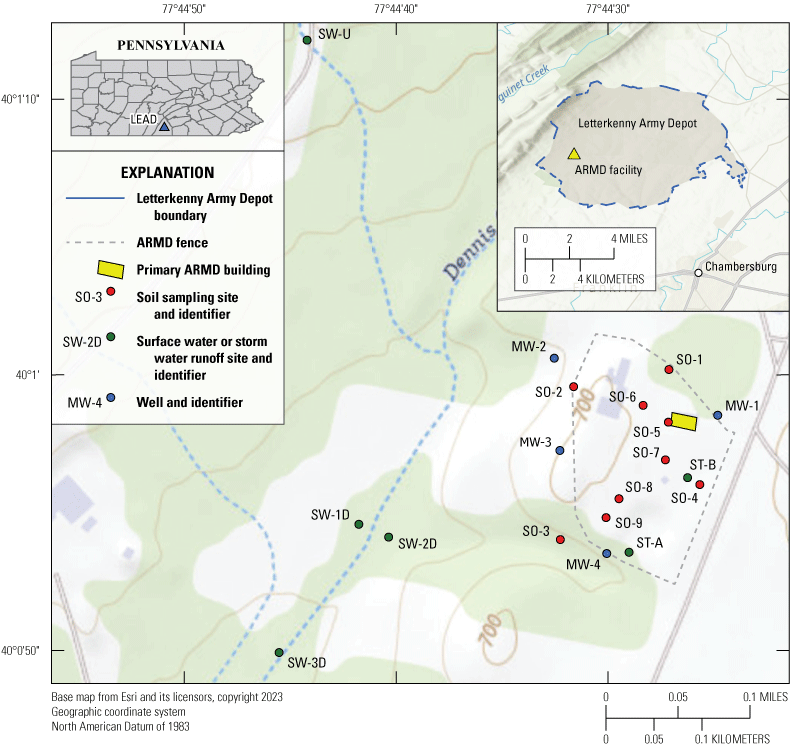
Maps of Pennsylvania, Letterkenny Army Depot boundary, and the historical location of surface-water, storm-runoff, and soil sampling sites and groundwater monitoring wells at the Ammonium Perchlorate Rocket Motor Destruction (ARMD) Facility, Letterkenny Army Depot, Chambersburg, Pennsylvania. Modified from Galeone (2019a, fig. 3).
Study Area
The ARMD Facility is in a remote area of LEAD that is used for a variety of purposes including missile maintenance, ammunition storage, and the Open Burning and Open Detonation grounds The ARMD site vicinity consists of young growth forest, agricultural land, open areas, and small wetland patches. Land to the west (approximately 4,000 feet [ft] from ARMD) is primarily forested and slopes upward to Broad Mountain (Redhorse Corporation, 2016). Elevations at LEAD range from approximately 600 ft to 800 ft above the North American Vertical Datum of 1988 (NAVD 88).
The LEAD is in the Cumberland Valley part of the Great Valley in the easternmost section of the Valley and Ridge Physiographic Province of the Appalachian Mountains (Sevon, 2000), approximately 3.5 miles (mi) southwest of Upper Strasburg, Pennsylvania. Surface-water drainage from the ARMD Facility and surrounding area eventually drains to Dennis Creek to the southwest of the facility, which is part of the Potomac River basin. The Ordovician bedrock underlying the ARMD Facility and surrounding landscape varies from west to east. The facility itself is underlain by shales of the Martinsburg Formation. Adjacent land to the west (less than 0.25 mi) is underlain by argillaceous limestone of the Chambersburg Formation, and less than 0.5 mi to the west is land underlain by the micritic and fossiliferous limestone of the St. Paul Group (fig. 2). According to LEAD, the nearest downgradient groundwater consumers are between 1.5 and 2 mi southwest of the ARMD (Redhorse Corporation, 2016).
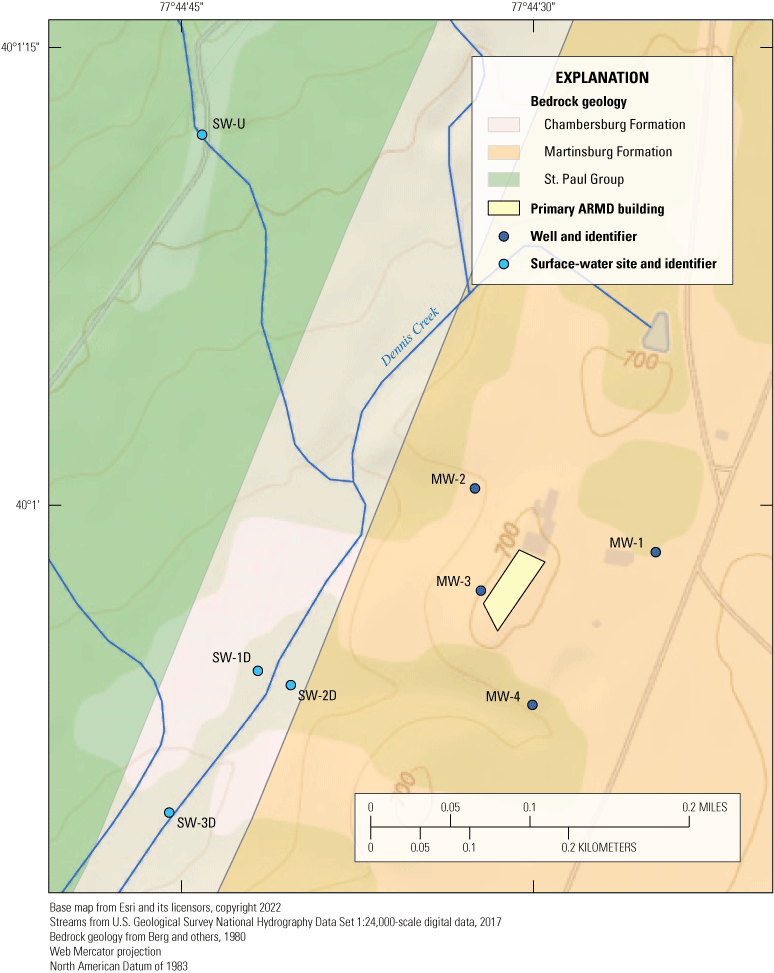
Map of underlying geology and locations of well and surface-water sampling sites at the Ammonium Perchlorate Rocket Motor Destruction (ARMD) Facility at the Letterkenny Army Depot, Chambersburg, Pennsylvania. Modified from Galeone (2019a; fig. 2).
The landscape is a mix of open fields and immature forest. Precipitation in the area averages about 42 inches per year and the mean annual temperature is about 11 degrees Celsius (oC; Pennsylvania State Climatologist, 2018). Native soils in the vicinity of the ARMD Facility are channery silt loams or silt loams, typically well drained. The soils are derived from weathered shale and siltstone (U.S. Department of Agriculture, 2018). Some of the soil around the facility has been modified with fill materials used for roads and construction purposes. See Galeone (2019a) for additional information regarding the soil types around the ARMD Facility.
Study Design and Methods
The monitoring program approach for the ARMD Facility was designed to establish baseline concentrations of indicator compounds that could result from unplanned releases of either exhaust or leakage from the steel lined treatment chamber (Redhorse Corporation, 2016). An increase in indicator compound concentrations or other change from baseline concentrations or a difference from downgradient versus upgradient concentrations in groundwater, surface water, soil, or stormwater runoff could indicate an unplanned release has occurred at the ARMD Facility. The baseline characterization period was from September to December 2016. Monthly samples were collected from groundwater monitoring wells, streams, and soils during this baseline period. Beginning in 2017 when the ARMD Facility became operational, surface water and soils were sampled annually. The groundwater wells were sampled every three months beginning in March 2017 through September 2018, and then annually beginning in 2019.
Field parameters for water samples were measured using a multiparameter sonde, by direct insertion into surface waters at time of sampling, or via a flow-through cell for groundwater (U.S. Geological Survey, variously dated). The sonde was used to measure water temperature (WT), pH, specific conductance (SC), dissolved oxygen (DO), and oxidation reduction potential (ORP), measured in millivolts. A portable turbidimeter was used to measure turbidity. The sonde was calibrated each morning prior to sample collection. Calibration of the turbidimeter is checked semiannually, per manufacturer directions (Hach Company/Hach Lange GmbH, 2021).
Constituents for environmental monitoring were selected at the request of PADEP as discussed in Galeone (2019a). Samples were collected from water and soils according to standard USGS field methods (U.S. Geological Survey, variously dated), unless otherwise noted, and were analyzed for volatile organic compounds, perchlorate, major ions, nutrients, and trace metals (see table 1 for a complete listing). All constituents in water samples were analyzed in total form (dissolved plus particulate) except for trace metals, which were filtered through a 0.45-micron capsule filter prior to analysis.
Table 1.
Constituents, units, reporting detection levels, and methods of analysis for water and soil samples collected at the Ammonium Perchlorate Rocket Motor Destruction Facility at the Letterkenny Army Depot, Chambersburg, Pennsylvania, 2021.[Modified from Galeone (2019a, table 1). All water parameters are for total analysis unless otherwise noted. RDL, reporting detection level; μg/L, micrograms per liter; μg/kg, micrograms per kilogram; mg/L, milligrams per liter; mg/kg, milligrams per kilogram; —, not applicable; diss, dissolved; N, nitrogen; %, percent]
The sample sites (fig. 1) for this project were determined in 2016 by PADEP in collaboration with Letterkenny staff and private consultants. Surface-water sampling sites and groundwater-monitoring wells were located upgradient and downgradient from the ARMD Facility. Two storm-runoff sampling sites and nine soil-sampling sites were in the vicinity of the ARMD Facility and associated parking areas.
Four groundwater monitoring wells were completed in the study area, one upgradient (MW-1) and three downgradient (MW-2, MW-3, and MW-4) from the facility (figs. 2). The 4 monitoring wells were completed and screened into the Martinsburg Formation and range in depth from 22 ft to 81 ft (table 2). The 4 wells have 6-inch casings at depths of 3–18 ft below land surface. The 6-inch steel casing protects the inner 2-inch polyvinyl chloride casing that extends to the depth of the slotted screened interval (table 2). The Martinsburg Formation, which underlies the entire well field, is predominantly black carbonaceous shale with a thin basal unit of platy limestone (Becher and Taylor, 1982). The lithology described in driller’s logs by Steven Read (Read and Associates, written commun., 2016) is representative of wells completed in the Martinsburg Formation (table 3). Well characteristics are described more thoroughly in Galeone (2019a).
Table 2.
Description of wells drilled at the Ammonium Perchlorate Rocket Motor Destruction Facility at the Letterkenny Army Depot, Chambersburg, Pennsylvania, May 16–17, 2016.[Data are from U.S. Geological Survey (undated). Modified from Galeone (2019a, table 2). Latitude and longitude given in decimal degrees. USGS, U.S. Geological Survey; ft, feet; NAVD 88, North American Vertical Datum of 1988; als, above land surface; bls, below land surface; gal/min, gallons per minute]
Table 3.
Lithology at four wells at the Ammonium Perchlorate Rocket Motor Destruction Facility at the Letterkenny Army Deport, Chambersburg, Pennsylvania.[Modified from Steven Read, Read and Associates, written commun. (2016). Depth is feet below land surface. ft, feet; →, to bottom of the; —, no data]
Dedicated bladder pumps (and Teflon-lined tubing) were installed in each well in August 2016 and wells have been purged for sampling events since 2016 at pumping rates less than 1 gallon per minute (gal/min). Static water levels were recorded prior to purging. Pumping rates during the September 14, 2021, sampling ranged from 0.33 to 0.54 gal/min (Galeone and Zarr, 2023). Water-quality parameters (WT, pH, SC, DO, ORP, and turbidity) were monitored at 5-minute intervals during pumping. Wells were purged for a 30-minute period and field parameters had reached stabilization by the end of the 30-minute period. The number of well volumes purged in 2021 prior to sampling for analytical constituents ranged from 1.1 (MW-3) to 5.1 (MW-2). All groundwater samples were placed on ice immediately after sample collection and delivered to the ALS Environmental laboratory (under contract to the USGS) in Middletown, Pennsylvania, the day of sample collection.
The four surface-water sampling sites are located around the ARMD Facility; one is upgradient (SW-U) and three downgradient (SW-1D, SW-2D, and SW-3D) from the facility (fig. 2). SW-1D and SW-3D are both on the same stream channel (Dennis Creek) as SW-U. SW-1D is 0.4 mi downstream from SW-U in stream length, and SW-3D is 0.01 mi downstream from SW-1D. SW-2D is on a tributary of Dennis Creek draining the area surrounding the ARMD and is approximately 125 ft from SW-1D. Only SW-U is perennial and was the only surface-water location where flowing water was present on October 6, 2021. The drainage area for SW-U is 0.43 square miles (mi2) of forested land (fig. 3). In addition to the field parameters, the streamflow was measured with an acoustic doppler velocity flow meter at the time of sample collection following standard USGS field methods (Turnipseed and Sauer, 2010).
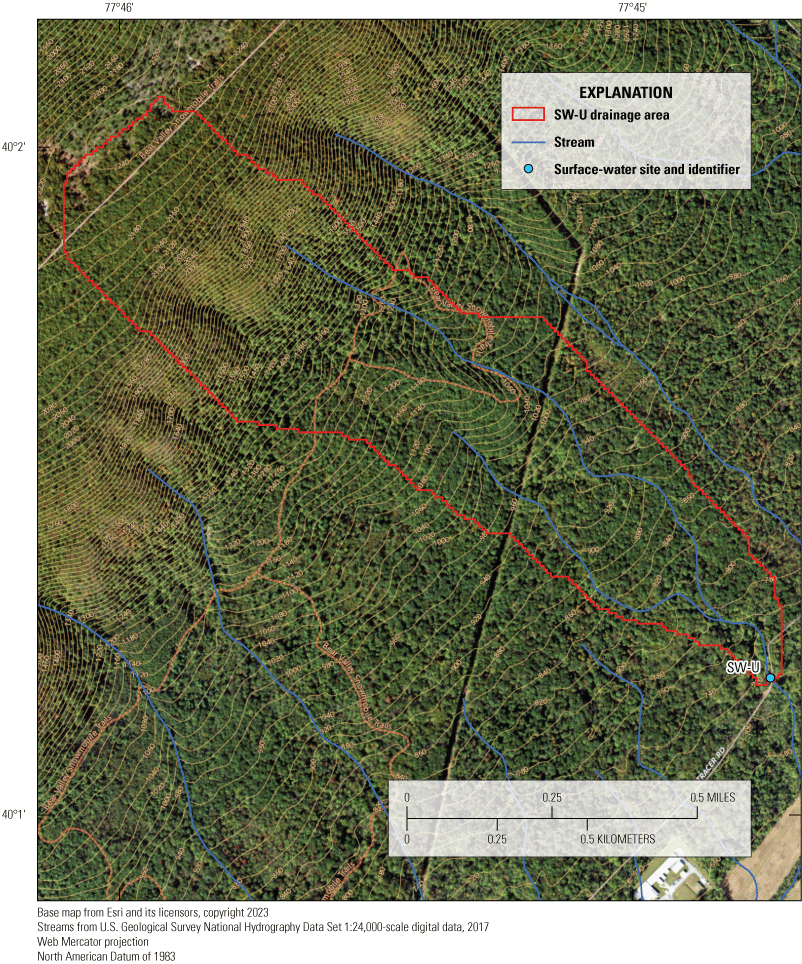
Map of drainage area for surface-water site SW-U at the Ammonium Perchlorate Rocket Motor Destruction Facility at the Letterkenny Army Depot, Chambersburg, Pennsylvania. Modified from Galeone (2019a, fig. 14).
The width of SW-U at the time of sample collection was approximately 3 ft. Sample bottles for total analyses (anions, phosphorus, volatile organic compounds (VOCs), and perchlorate) were dipped directly into the stream. Bottles for metal analyses were filtered. The water for metal bottles was collected using a one-liter plastic bottle, with approximately three liters collected and placed in an eight-liter churn. The water was filtered from the churn into the dissolved sample bottles using polypropylene tubing and a capsule filter. All surface-water samples (a replicate sample was collected on October 6, 2021, at SW-U) were placed on ice immediately after sample collection and delivered to the ALS Environmental laboratory the day of sample collection.
Two storm-runoff sites were identified at the ARMD Facility. The two storm-runoff sites (ST-A and ST-B) drain parking areas and buildings (less than 1 acre in total surface area for either sampling site) associated with the facility (fig. 1). No runoff or sediment was evident in the culverts or the retention basin when sampling took place on October 6, 2021. Additionally, during USGS sampling events prior to 2021, including four samples from September 2016 through December 2016, and one sample per year from 2017 through 2020, there also was no evidence of sediment transport from the areas around the ARMD Facility to the culverts, and subsequently the retention basin.
Nine soil sampling sites (SO-1 to SO-9) were selected and sampled in and around the ARMD Facility in 2016 (table 4; fig. 1), but only five sites (SO-1, SO-2, SO-7, SO-8, and SO-9) were required to be sampled after 2016 based on workplan specifications (Redhorse Corporation, 2016). Soil sampling sites SO-1, SO-2, SO-7, and SO-8 are located along a fence line or in an open-field setting. Initially, soil-sampling site SO-9 was sited in a parking area where samples could not be collected and was moved to the nearest area where a representative soil sample could be collected. This new location was previously modified with shale material that had been deposited to support vehicle loads.
Table 4.
Descriptions of nine historic soil sampling sites at the Ammonium Perchlorate Rocket Motor Destruction Facility at the Letterkenny Army Depot, Chambersburg, Pennsylvania.[Modified from Galeone (2019a, table 4). Data are from U.S. Geological Survey (undated). Latitude and longitude given in decimal degrees. USGS, U.S. Geological Survey]
Soil samples were collected to a depth of approximately 6 inches on November 10, 2021. A stainless-steel trowel was used to remove the top organic layer containing roots and vegetation as specified in the workplan (Redhorse Corporation, 2016). After removing the top organic layer, subsamples were collected with the trowel for all constituents except VOCs. The areas sampled ranged from 5 to 9 square feet per site, with 12 to 20 subsamples collected per site. Subsamples were placed on a plastic sheet, mixed, and then transferred to three 8-ounce glass sample jars using the trowel. Rocks of gravel size or larger were removed from the subsamples. Soil samples for VOC analyses were collected with an En Core sampler instead of a trowel. En Core samplers (25-gram capacity) are constructed from an inert composite polymer and are sealed after extraction from soil profile, immediately becoming an air-tight transportation vessel (EQUIPCO, 2016). Three En Core samples were collected at each sample location for each sampling event. Once the organic soil layer (grass and roots) was removed, the En Core sampler was used to collect cores from a depth that did not exceed 6 inches below the original elevation of the ground. The sampler was inserted vertically into the ground, perpendicular to the horizontal soil surface. The depths varied by 1-3 inches at each site based on soil conditions and the amount of shale that was present. The En Core samples cannot be collected in gravelly soil or soil with shale fragments. All soil samples were placed on ice immediately after sample collection and delivered to the ALS Environmental laboratory in Middletown, Pennsylvania, the day of sample collection.
Quality Assurance and Quality Control
QA/QC samples were collected for each sampling event and sample media. USGS personnel submitted replicate and blank samples for groundwater and replicates for surface-water and soil samples for analysis. The ALS Environmental laboratory also analyzed matrix-spike (MS) and matrix-spike duplicate (MSD) samples for all sampling events and sample media. Two types of blank samples were analyzed at the ALS Environmental laboratory: equipment blanks submitted by the USGS and internal laboratory blanks. An equipment blank was used to determine potential contamination from equipment and supplies used to collect samples in the field (Francy and others, 1998). Internal laboratory blanks were used to quantify any laboratory bias from contamination. Replicate samples were used to determine the precision and variability of sample collection and processing (Francy and others, 1998). MS and MSD samples are environmental samples spiked in the laboratory to verify recovery efficiency and to evaluate potential sample matrix interferences. The MS/MSD samples that fall outside the acceptable range for a constituent could indicate a negative (recovering less than the acceptable range) or positive (recovery greater than the acceptable range) bias. Laboratory control samples (LCSs) are similar to matrix-spike samples in that they are used to determine percent recoveries, but the spike is applied to a media with zero concentration for that particular constituent.
Groundwater
One equipment blank (derived from field equipment and supplies) and multiple internal laboratory blanks were analyzed for groundwater samples submitted on September 14, 2021. A suite of 52 VOCs was analyzed in each water sample. Two VOCs, acetone and bromomethane, were detected below the reporting detection levels (RDLs) in the equipment blank, at concentrations of 3.5 and 0.99 micrograms per liter (μg/L), respectively. The RDLs for acetone and bromomethane were 10 and 1.0 μg/L, respectively, so both constituents were flagged as estimated values. Three dissolved metals (chromium [Cr], iron [Fe], and molybdenum [Mo]) were also detected below the RDLs (RDLS were 2.2, 56, and 2.2 μg/L, respectively) in the equipment blank, with estimated values of 0.89, 20, and 1.2 μg/L, respectively (Galeone and Zarr, 2023).
Internal laboratory blanks (method blanks [MBs]) for groundwater samples submitted in 2021 were analyzed by the ALS Environmental laboratory for all analytical constituents. Only two constituents were detected in any MBs: total forms of bromomethane and phosphorus (P). Bromomethane was detected at 0.90 μg/L, below the RDL of 1.0 μg/L. Total P was detected in two MBs at concentrations (0.023 mg/L and 0.078 mg/L) below the RDL of 0.10 mg/L. Twelve other MBs for P showed no detections.
One replicate well sample (from well MW-3) was submitted for analyses on September 14, 2021. Only one constituent had a relative percent difference (RPD) greater than 10 percent. The RPD for total P was 80 percent (Galeone and Zarr, 2023). The ALS Environmental laboratory in Middletown, Pennsylvania, also conducted internal replicate analyses, and, similar to the field replicate, the RPD for total P (13 percent) exceeded 10 percent (ALS Environmental, contracted to the U.S. Geological Survey, unpub. data, 2021). These results indicate that individual analyses of indicator compounds in groundwater samples, except for total P, can be conducted with precision, reliably reflecting in situ environmental conditions.
The MS/MSD samples and LCSs were analyzed by the ALS Environmental laboratory for the September 14, 2021, groundwater samples. The only inorganic constituent to fall outside the acceptable range for groundwater MS/MSD samples or LCSs was total P; all other exceedances occurred for VOCs. The acceptable MS recovery range for P was 90– 110 percent, and the MS recovery was 123 percent (ALS Environmental, contracted to the U.S. Geological Survey, unpub. data, 2021).
Four VOCs showed results outside the acceptable range for both MS/MSD samples and LCSs: chloroethane, 1,1,2-Trichloro-1,2,2-trifluoroethane (freon-113), 1,2,3-Trichlorobenzene, and 1,2,4-Trichlorobenzene. Chloroethane, 1,2,3-Trichlorobenzene, and 1,2,4-Trichlorobenzene all showed MS/MSD and LCS results with recoveries below the acceptable range. The MS/MSD results for chloroethane, 1,2,3-Trichlorobenzene, and 1,2,4-Trichlorobenzene showed recoveries of 37.2/40.3 percent, 22.8/19.8 percent, and 36.9/27.9 percent, respectively, outside of their ranges of acceptable values: 51– 142 percent, 61– 126 percent, and 67– 123 percent. The MS/MSD results for 1,1,2-Trichloro-1,2,2-trifluoroethane showed percent recoveries of 148/136 percent, with an acceptable range of 50– 130 percent. The LCS results followed a similar pattern to measured MS/MSDs for these four VOCs. The LCS results for chloroethane, 1,2,3-Trichlorobenzene, and 1,2,4-Trichlorobenzene showed percent recoveries of 37.5 percent, 53.9 percent, and 51.2 percent, respectively. The LCS results for 1,1,2-Trichloro-1,2,2-trifluoroethane showed a percent recovery of 135 percent. Acceptance criteria for LCSs are equivalent to MS/MSD criteria mentioned above (ALS Environmental, contracted to the U.S. Geological Survey, unpub. data, 2021).
Two other VOCs showed slightly higher percent recoveries than acceptable for MS/MSD results. The MS/MSD results for 1,1-Dichloroethene and trichlorofluoromethane showed recoveries of 133/126 percent and 126/125 percent, respectively, with acceptable ranges of 63– 128 percent and 38– 123 percent, respectively. The MSD result for 1,1-Dichloroethene was within the acceptable range, but not the MS result (ALS Environmental, contracted to the U.S. Geological Survey, unpub. data, 2021). Results for MS/MSD samples and (or) LCSs lower than criteria indicate that recoveries are biased low and that analytical results might underestimate the concentrations of those constituents; whereas results higher than criteria would indicate analytical results might overestimate the concentrations of those constituents. The routine samples for 1,1-Dichloroethene and trichlorofluoromethane all showed non detects (less than 1 μg/L; Galeone and Zarr, 2023). The U.S. Environmental Protection Agency (EPA) maximum contaminant level (MCL) for 1,1-Dichloroethene is 7 μg/L and there is no EPA MCL for trichlorofluoromethane (U.S. Environmental Protection Agency, 2018).
Surface Water
Multiple internal laboratory MBs were analyzed by the ALS Environmental laboratory for the surface-water sample submitted on October 6, 2021. Five constituents were detected, all at concentrations less than the RDLs for MBs. Three VOCs (all with an RDL equal to 1.0 μg/L), bromomethane, carbon disulfide, and chloromethane, were detected at concentrations of 0.62 μg/L, 0.40 μg/L, and 0.31 μg/L, respectively. The other two constituents that were detected in MBs were total P and total sulfate (SO4). Thirteen MBs were analyzed for total P, with twelve of these non-detects and one showed a detection for P (0.021 mg/L) below the RDL of 0.10 mg/L. Total SO4 (RDL equal to 1.0 mg/L) was detected in two MBs at concentrations of 0.22 mg/L and 0.23 mg/L. Five other MBs for total SO4 showed no detections (ALS Environmental, contracted to the U.S. Geological Survey, unpub. data, 2021).
One replicate sample was collected on October 6, 2021. Three constituents showed RPDs greater than 10 percent between the routine and replicate samples: total SO4, total nitrate plus nitrite (NO3-NO2), and dissolved sulfur (S). Total NO3-NO2 showed an RPD of 149 percent, exceeding the 10 percent criteria. Total SO4 and dissolved S showed RPDs of 37 percent and 28 percent, respectively (Galeone and Zarr, 2023). The ALS Environmental laboratory in Middletown Pennsylvania, also conducted internal replicate analyses, with three constituents exceeding the laboratory’s criteria for replicate samples. The only internal replicate for dissolved S showed an RPD of 24.8 percent, exceeding the ALS Environmental laboratory’s criteria of 20 percent. For two internal replicates for total P, one did exceed the internal laboratory’s criteria of 10 percent, with a RPD of 12.6 percent. Three internal replicates for acidity showed RPD results of 20.7 percent, 40 percent, and 31.6 percent, all exceeding the internal laboratory criteria of 20 percent (ALS Environmental, contracted to the U.S. Geological Survey, unpub. data, 2021). These results indicate that individual measurement of indicator compounds in surface-water samples, except for the constituents listed above in this paragraph, can be conducted with precision, reliably capturing ambient environmental conditions.
The MS/MSD samples and LCSs were analyzed by the ALS Environmental laboratory for the surface-water sample collected October 6, 2021. Six constituents showed results that exceeded either MS/MSD or LCS criteria. Acetone was the only constituent that exceeded MS/MSD and LCS criteria. The acceptable range of MS/MSD samples and LCSs for acetone was 40–151 percent. The MS/MSD results for acetone were 157/160 percent, and the LCS result was 152 percent, indicating that recovery for acetone was biased high for surface-water samples. The MS/MSD results for 1,1-Dichloroethene of 129/116 percent showed that only the MS sample recovery exceeded the acceptable criteria range (63–128 percent). The other three constituents that were outside of MS/MSD acceptable ranges were chloride (Cl), fluoride (F), and SO4. Only MS samples were analyzed for F. The MS results for F were highly variable, with recoveries well outside the acceptable range of 80–120 percent. The two MS samples for F showed recoveries of 192 percent and −4 percent. For Cl and SO4, MS samples were run with and without replicates. The MS/MSD results for Cl and SO4 showed recoveries below the acceptable criteria. Two MS/MSD samples were run for Cl, with only one sample falling below the acceptable range of 80–120 percent for Cl (SO4 has same range). The Cl MS/MSD results for the one sample outside the acceptable range were 101/74.7 percent, indicating the replicate for this sample was below the acceptable criteria. For strictly MS analyses, recoveries for Cl were above the acceptable range, with two MS recoveries of 164 percent and 247 percent. The MS/MSD results for Cl indicate that the precision of measurement was poor and MSs for Cl were either inside or outside of the acceptable range of recoveries. Only one MS/MSD sample was run for SO4, and the MS/MSD recoveries were 96.9/74.6 percent, again indicating only the replicate for this sample was below the acceptable criteria. For strictly MS analyses, recoveries for SO4 were above the acceptable range, with two MS recoveries of 202 percent and 836 percent. All LCSs analyses for Cl, F, and SO4 were within the acceptable range (ALS Environmental, contracted to the U.S. Geological Survey, unpub. data, 2021). Even though LCS results for Cl, F, and SO4 were acceptable, matrix effects in the environmental samples complicated interpretation of monitoring results for Cl, F, and SO4.
Soil
Internal laboratory MBs were analyzed by the ALS Environmental laboratory for the soil samples submitted on November 10, 2021. Only three constituents were detected in MBs, all below the RDLs. Two sets of MBs were run for VOCs in soil. Methylene chloride was detected in one set at 1.2 micrograms per kilogram (μg/kg), below the RDL of 2.0 μg/kg. P and Cl were detected at concentrations of 7.5 milligrams per kilogram (mg/kg) and 5.6 mg/kg, respectively, below their respective RDLs of 9.4 mg/kg and 10 mg/kg. P was detected in one of two MBs, whereas only one MB was analyzed for Cl (ALS Environmental, contracted to the U.S. Geological Survey, unpub. data, 2021).
One replicate soil sample was submitted with the November 10, 2021, soil samples. No VOCs were detected in either the routine or replicate samples. Results for NO3-NO2 and 5 metals exceeded the 10 percent RPD criteria for replicate samples. The RPD for NO3-NO2 was 39 percent and the five metals that had a higher RPD than 10 percent were aluminum (Al; 12 percent), barium (Ba; 14 percent), copper (Cu; 16 percent), mercury (Hg; 23 percent), and potassium (K; 16 percent) (Galeone and Zarr, 2023). These results indicate that individual measurements of indicator compounds in soil samples, except for the constituents listed above in this paragraph, can be conducted with precision, reliably representing environmental conditions.
The MS samples and LCSs (and LCS duplicates [LCSDs]) were analyzed for the soil samples collected November 10, 2021. The MS results showed most VOCs did not fall within the acceptable range. Forty VOCs were analyzed, with results for 34 VOCs below the acceptable range and only 6 VOCs within the acceptable range. The only VOC that showed an MS recovery over 100 percent was acetone at 121 percent. The range of MS percent recoveries for VOCs below 100 percent recovery was 25.0 percent for bromomethane to 67.6 percent for 1,1-Dichloroethene (table 5). The MS recoveries indicated that VOC concentrations (except for acetone) could be underestimated in the routine soil samples. For example, a 25 percent MS recovery for bromomethane could underestimate the actual concentration in a routine sample by as much as 75 percent.
Table 5.
Matrix-spike results from the ALS Environmental laboratory in Middletown, Pennsylvania, for volatile organic compounds analyzed for the soil samples collected November 10, 2021, at the Ammonium Perchlorate Rocket Motor Destruction Facility at the Letterkenny Army Depot, Chambersburg, Pennsylvania.[The original result for all analytes was 0 micrograms per kilogram (μg/kg). QC, quality control]
The LCS/LCSD results for VOCs showed that all VOCs except 1,1,2-Trichloro-1,2,2-trifluoroethane (freon-113) had recoveries that met criteria. Two LCS/LCSDs for 1,1,2-Trichloro-1,2,2-trifluoroethane had recoveries of 119/122 percent and 112/111 percent, above the acceptable range of 40–109 percent. These results for 1,1,2-Trichloro-1,2,2-trifluoroethane showed that the recovery from routine samples might be overestimated in the routine soil samples, contrary to the MS results for 1,1,2-Trichloro-1,2,2-trifluoroethane. One LCS (and no MS sample) was analyzed for Cl, F, and SO4, with percent recoveries of 83.2 percent, 49 percent, and 80.9 percent, respectively, which were below the acceptable range (90–110 percent) for all three constituents. MS and LCS samples were analyzed for P. The MS recovery for P met criteria, but the LCS recovery (74.9 percent) was below acceptable criteria (90–110 percent; ALS Environmental, contracted to the U.S. Geological Survey, unpub. data, 2021).
2021 Characterization Data
The following sections characterize data for groundwater, surface water, and soil samples that were collected in 2021 at the ARMD Facility and compare data to previous results for 2016–20. The baseline period for data collected at and near the ARMD Facility was 2016. After the baseline period, data were collected from 2017 through 2021. QA/QC results were incorporated into the discussion for pertinent constituents.
Groundwater
Groundwater samples from the four monitoring wells around the ARMD Facility were collected September 14, 2021. Static water levels prior to pumping the wells ranged from 2.10 ft below land surface at well MW-2 to 24.25 ft below land surface at well MW-3 (Galeone and Zarr, 2023). The range in groundwater elevations above NAVD 88 for 2021 was 676.78 ft at well MW-2 to 687.54 ft at well MW-1 (table 6). The mean groundwater elevations for 2016– 2020 data ranged from 675.27 ft for MW-2 to 686.32 ft for MW-1. The standard deviation for groundwater elevations for 2016–2020 data ranged from 1.28 ft for MW-4 to 3.11 ft for MW-3. The measured groundwater elevations for 2021 were above the 2016– 2020 mean of measured values for each well by 0.8 ft to 1.6 ft, but the measured 2021 elevations did fall within the range of natural variability based on the 2016–2020 standard deviations.
Table 6.
Minimum, maximum, and mean values of water temperature, dissolved oxygen, pH, specific conductance, static water-level elevation, turbidity, dissolved barium, dissolved potassium, dissolved silica, total chloride, total fluoride, and total sulfate measured in well samples collected at the Ammonium Perchlorate Rocket Motor Destruction Facility at the Letterkenny Army Depot, Chambersburg, Pennsylvania, between 2016 and 2021.[Data for 2016–20 are from U.S. Geological Survey (undated). Data for 2021 are from Galeone and Zarr (2023). Min, minimum; Max, maximum; °C, degrees Celsius; —, not applicable; mg/L, milligrams per liter; μS/cm, microsiemens per centimeter at 25 degrees Celsius; NAVD 88, North American Vertical Datum of 1988; NTUs, nephelometric turbidity units; μg/L, micrograms per liter; E, estimated value below the reporting detection level]
Water-quality parameters measured in the groundwater in 2021 differed somewhat to those measured in previous years. DO concentrations for all the 2021 groundwater samples were below 0.1 mg/L, which is below any concentration recorded in previous years in any well. The range of DO values from 2016 to 2020 for all wells was 0.12 mg/L to 2.57 mg/L (table 6). Turbidity values for 2021 ranged from 3.6 nephelometric turbidity units (NTUs) for well MW-3 to 99 NTUs for well MW-1 (table 6), with the turbidity values in 2021 generally higher than for previous samples. The mean turbidity values for 2016–20 data ranged from 0.88 NTUs for MW-3 to 12.6 NTUs for MW-4. Similar to previous years, field data for 2021 showed that well MW-3 had the highest SC measured at 635 microsiemens per centimeter (μS/cm) followed by MW-2 (480 μS/cm), with lowest measured SC at well MW-1 (182 μS/cm). All the wells were completed in the Martinsburg Formation (shale rock type); however, the western edge of the well field where MW-2 and MW-3 are sited is near the contact between the Martinsburg Formation and the Chambersburg Formation, which is composed of argillaceous limestone (Berg and others, 1980) (fig. 2). Their proximity to the limestone formation could contribute dissolved ions to the water that flows through them (Freeze and Cherry, 1979). Though, in general, water in deeper wells has more time to interact with rock (older groundwater) and dissolve more ions (Freeze and Cherry, 1979). MW-3 is 59 ft deeper than MW-2 (table 2), and it is likely that groundwater in MW-3 primarily taps the Chambersburg Formation than groundwater in the shallower MW-2. The lithology described in table 3 shows that well MW-3 has limestone characteristics at 0.5–27 ft and 32–81 ft below land surface (well depth is 81 ft), whereas well MW-2 only shows limestone characteristics at 20–22 ft (well depth is 22 ft). Similar to previous years, field data for 2021 showed that the WT was highest at well MW-2 (14.0 oC), the shallowest well in the well network, and lowest at well MW-3 (12.2 oC), the deepest well in the well network (see table 2 for well depths). The pH values in 2021 ranged from 6.19 at well MW-1 to 7.10 at MW-4.
Inorganic analytical results for 2021 groundwater samples showed no inorganic constituents that exceeded any EPA MCLs (U.S. Environmental Protection Agency, 2018). Dissolved arsenic (As) was only detected in samples from two wells, MW-1 and MW-2, at concentrations of 1.4 μg/L (estimated value below the RDL) and 5.4 μg/L, respectively. In previous years, As has been detected at elevated concentrations in well MW-2 in comparison to the other monitoring wells with concentrations ranging from 3.1 to 6.5 μg/L (table 7). For reference, the MCL for As is 10 μg/L (U.S. Environmental Protection Agency, 2018). Total NO3-NO2 (RDL 0.2 mg/L) was not detected in any groundwater sample (Galeone and Zarr, 2023). Similar to previous years, total Cl and total SO4 concentrations for MW-3 (22.4 mg/L and 76.0 mg/L, respectively) were higher than for the other wells for 2021 groundwater samples. The second highest concentrations of total Cl and SO4 for 2021 samples were 4.2 mg/L and 43.6 mg/L, respectively, for well MW-2 (table 6). The higher concentrations of total Cl and total SO4 for MW-3 coincide with the higher SC for this well. This is indicative that higher dissolved ion concentrations typically are expected in deeper wells compared to more shallow wells completed in the same recharge area (Freeze and Cherry, 1979, p. 241).
Table 7.
Minimum and maximum values, the number of non-detect values, and the reporting detection levels for dissolved arsenic, dissolved bismuth, dissolved chromium, dissolved iron, dissolved molybdenum, and total phosphorus in well samples collected at the Ammonium Perchlorate Rocket Motor Destruction Facility at the Letterkenny Army Depot, Chambersburg, Pennsylvania, between 2016 and 2021.[Data for 2016–20 are from U.S. Geological Survey (undated). Data for 2021 are from Galeone and Zarr (2023). Min, minimum; Max, maximum; #ND, number of non-detects (values reported as less than the reporting detection level); RDL, reporting detection level; μg/L, micrograms per liter; —, not applicable; mg/L, milligrams per liter; E, estimated value below the reporting detection level; <, less than]
Samples were collected quarterly from March 2017 through September 2018, then annually in September of 2019 and 2020 (9 per constituent)
Dissolved Fe was the only inorganic constituent measured at greater than a secondary maximum contaminant level (SMCL). All groundwater samples collected in 2021 exceeded the Fe SMCL of 300 μg/L (U.S. Environmental Protection Agency, 2018) with concentrations ranging from 390 μg/L (well MW-3) to 3,500 μg/L (well MW-1; table 7). All previous samples collected for wells MW-1, MW-2, and MW-4 also exceeded the SMCL for Fe; however, the 2021 result for well MW-3 was the first instance of an Fe SMCL exceedance for this well. The DO concentration for MW-3 for the 2021 sample was 0.08 mg/L, the lowest DO concentration for any sample collected at MW-3 (table 6). Lower DO concentrations inhibit precipitation of iron from the dissolved phase (Hem, 1985). Exceedance of the SMCL for Fe can cause discoloration of materials along with taste and odor issues. No health effects are associated with an Fe SMCL exceedance (U.S. Environmental Protection Agency, 2024). Similar to all previous samples collected for the groundwater wells, in 2021 there were no detections of dissolved Al, dissolved cadmium (Cd), dissolved Cu, dissolved lead (Pb), dissolved Hg, dissolved silver (Ag), dissolved selenium (Se), dissolved tin (Sn), dissolved zirconium (Zr), or total perchlorate (see table 1 for RDLs; Galeone and Zarr, 2023).
Only two VOCs were detected in groundwater samples collected on September 14, 2021. In well MW-1, acetone was detected at 3.5 μg/L, a concentration below the RDL of 10 μg/L. Bromomethane was detected in each well at concentrations below the RDL of 1 μg/L, ranging from 0.53 μg/L at well MW-1 to 0.87 μg/L at well MW-3. Acetone was also detected in the equipment blank submitted with the groundwater samples at a concentration of 3.5 μg/L. Bromomethane was detected in the equipment blank at 0.90 μg/L (Galeone and Zarr, 2023), and in the internal laboratory blank at 0.99 μg/L (ALS Environmental, contracted to the U.S. Geological Survey, unpub. data, 2021). Both constituents were detected in field and laboratory QA/QC procedures, and the results for bromomethane and acetone are not likely representative of groundwater conditions for this sampling event.
Surface Water
Only the surface-water site (SW-U) upgradient of the ARMD Facility was sampled in 2021 because the other three surface-water sites were dry at the time of sample collection. Streamflow measured on October 6, 2021, at site SW-U was 0.177 cubic feet per second (ft3/s) and the SC was 235 μS/cm. The highest SC measured at SW-U was in 2016 at 315 μS/cm at a streamflow of 0.03 ft3/s. The lowest SC measured at SW-U was 100 μS/cm at a streamflow of 2.78 ft3/s (table 8). SC decreased with increasing discharge, indicating that the baseflow component derived from the underlying limestone was being diluted by surface water runoff. The pH measured on October 6, 2021, was 7.37, which is consistent with data from 2016–2020; and this slightly alkaline pH is also reflective of the underlying limestone formation. The turbidity measured at 9 NTUs on October 6, 2021, was consistent with other baseflow samples collected at site SW-U.
Table 8.
Minimum and maximum values, the number of non-detect values, and the range of reporting detection levels for selected constituents in surface-water samples collected at site SW-U near the Ammonium Perchlorate Rocket Motor Destruction Facility at the Letterkenny Army Depot, Chambersburg, Pennsylvania, between 2016 and 2021.[Data for 2016–20 are from U.S. Geological Survey (undated). Data for 2021 are from Galeone and Zarr (2023). Min, minimum; Max, maximum; #ND, number of non-detects (values reported as less than the reporting detection level); RDL, reporting detection level; ft3/s, cubic feet per second; —, not applicable; mg/L, milligrams per liter; μS/cm, microsiemens per centimeter; °C, degrees Celsius; NTU, nephelometric turbidity units; μg/L, micrograms per liter; <, less than; E, estimated value below reporting detection level; NO3-NO2, nitrate plus nitrite; N, nitrogen]
Similar to previous years, there were no EPA MCL or SMCL exceedances for any constituent at SW-U for the samples collected on October 6, 2021. The MCL for nitrate (NO3)-nitrogen (N) is 10 mg/L (U.S. Environmental Protection Agency, 2018), while the measured concentration of total NO3-NO2 for site SW-U was 2.2 mg/L of N. This concentration was higher than previously measured concentrations of total NO3-NO2 at site SW-U, which ranged from an estimated value of 0.14 mg/L of N to 0.52 mg/L of N (table 8). The dissolved Fe concentration was estimated at 19 μg/L (table 8), well below the SMCL for Fe of 300 μg/L (U.S. Environmental Protection Agency, 2018). Total Cl and total SO4 concentrations were 2.9 mg/L and 10.2 mg/L, respectively, which were similar in magnitude to previous measurements at the site (table 8). There were no detections of any dissolved forms of Al, As, bismuth (Bi), Cd, Cu, Pb, Hg, Ag, Se, Sn, or Zr (see table 1 for RDLs; Galeone and Zarr, 2023). These results were consistent with previous analyses of samples collected at site SW-U. There was no detection of total perchlorate, which had an RDL of 0.2 μg/L. Total perchlorate was detected at SW-U in previous years at estimated values below the RDL ranging from 0.06 μg/L to 0.09 μg/L (table 8).
The only two VOCs detected for the sample collected at site SW-U on October 6, 2021, were bromomethane and carbon disulfide, both below the RDLs of 1 μg/L. Estimated concentrations of bromomethane and carbon disulfide were 0.45 μg/L and 0.32 μg/L, respectively (Galeone and Zarr, 2023). Both bromomethane and carbon disulfide were detected below the RDLs in MBs analyzed by ALS Environmental laboratory for the surface-water samples submitted on October 6, 2021. Estimated concentrations of bromomethane and carbon disulfide in the MBs were 0.62 μg/L and 0.40 μg/L, respectively.
Soil
Soil samples from five soil-sampling sites (SO-1, SO-2, SO-7, SO-8, and SO-9) were collected on November 10, 2021 (table 4 and fig. 1). Both A and E horizons are mineral dominant zones where all parent rock material has been obliterated (fig. 4; Soil Science Division Staff, 2017). In a typical soil profile, the A horizons are below the organic layer (O horizon) of roots and organic debris and contain only some organic matter followed by the E horizon which contains only limited organic matter. Three sites (SO-1, SO-7, and SO-8) had typical A grading into E horizons. The other soil sites (SO-2 and SO-9) sampled did not show typical gradation of the A to E horizons and appear to have been altered by activities at LEAD. SO-2 had fill material near the surface, but it did not have significant shale fragments. Site SO-9 had shale fill at the surface down to a depth of 6 inches. The shale was interspersed with finer particles of sand and silt.
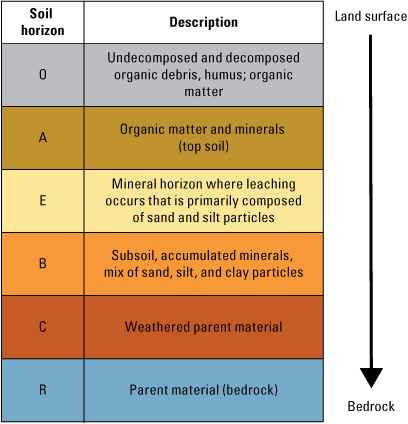
Schematic of typical soil profile.
The inorganic constituents with the highest concentrations in soil samples near the ARMD Facility were Fe and Al. For samples collected in 2021, Fe concentrations ranged from 39,200 mg/kg for site SO-2 to 47,400 mg/kg for site SO-8, and Al concentrations ranged from 19,500 mg/kg for sites SO-2 and SO-8 to 24,600 mg/kg for SO-7. The 2021 Fe concentrations for SO-1 (41,900 mg/kg) and SO-8 were higher than any concentrations measured from 2016 to 2020 for those two sites (table 9). Other elements detected at relatively high concentrations in soils were K and silica (Si). For 2021, K concentrations ranged from 1,810 mg/kg for site SO-8 to 2,590 mg/kg for site SO-9, while Si concentrations ranged from 880 mg/kg for site SO-8 to 2,950 mg/kg for site SO-2. K concentrations for 2021 were between the 50th and 90th percentile of the concentrations measured from 2016 to 2020, but Si concentrations in 2021 for sites SO-2 and SO-7 were over 1,000 mg/kg higher in 2021 than any previous samples collected (table 9). The results for Al, Fe, K, and Si were consistent with data for silt loams reported by Brady (1974) for other areas in the United States. Brady (1974) showed that four of the five most abundant elements in the silt loams he presented were Si, Al, Fe, and K.
Table 9.
Minimum and maximum values for aluminum, barium, iron, potassium, silica, sulfur, and phosphorus for soil samples collected at the Ammonium Perchlorate Rocket Motor Destruction Facility at the Letterkenny Army Depot, Pennsylvania, between 2016 and 2021.[Data for 2016–20 are from U.S. Geological Survey (undated). Data for 2021 are from Galeone and Zarr (2023). Min, minimum; Max, maximum; mg/kg, milligrams per kilogram; —, not applicable]
Several trace metals were detected in soil samples collected in 2021 near the ARMD Facility. Cu, Pb, and Cr were detected at all soil sample sites and at relatively similar concentrations. Cu concentrations ranged from 38.0 mg/kg for site SO-1 to 42.7 mg/kg at site SO-8. Cu concentrations at sites SO-1, SO-7, and SO-8 were slightly higher than detected concentrations in previous years; site SO-2 and SO-9 showed consistent results with samples collected in previous years. Pb concentrations ranged from 28.9 mg/kg at site SO-9 to 36.8 mg/kg at site SO-1, and the Pb concentration at site SO-1 was 12.5 mg/kg higher than any previous sample result for site SO-1. Pb concentrations at sites SO-7 and SO-8 were slightly higher than sample results for previous years at these sites; sites SO-2 and SO-9 showed consistent Pb concentrations to previous samples collected. Cr concentrations ranged from 23.4 mg/kg at site SO-8 to 29.1 mg/kg at site SO-7, and all Cr concentrations were consistent with previous sample results at all the sites (table 10).
Table 10.
Minimum and maximum values, the number of non-detect values, and the range of reporting detection levels for arsenic, bismuth, cadmium, chromium, copper, lead, mercury, molybdenum, selenium, zirconium, fluoride, nitrate plus nitrite, and perchlorate for soil samples collected at the Ammonium Perchlorate Rocket Motor Destruction Facility at the Letterkenny Army Depot, Pennsylvania, between 2016 and 2021.[Data for 2016–20 are from U.S. Geological Survey (undated). Data for 2021 are from Galeone and Zarr (2023). Min, minimum; Max, maximum; #ND, number of non-detects (values reported as less than the reporting detection level); RDL, reporting detection level; mg/kg, milligrams per kilogram; —, not applicable; μg/kg, micrograms per kilogram; E, estimated value below reporting detection level; <, less than]
Other trace metals results for 2021 with detections above the RDLs for most, if not all soil sites, were As, Hg, and Mo. Arsenic concentrations, all above the RDLs in 2021, ranged from 9.1 mg/kg at site SO-9 to 12.9 mg/kg at site SO-1. Hg concentrations ranged from 0.047 mg/kg at site SO-9 (the only result below the RDL) to 0.083 mg/kg at site SO-1. Mo concentrations in 2021 were all above the RDLs, ranging from 1.5 mg/kg at sites SO-1 and SO-7 to 4.3 mg/kg at site SO-2 (table 10).
Trace metals that were detected at estimated concentrations below RDLs at all soil sites for 2021 samples were Bi, Cd, and Se. Bi concentrations in 2021 were lower at all sites than any previous samples collected, ranging from 2.3 mg/kg at sites SO-2 and SO-9 to 3.2 mg/kg at site SO-8. Cd concentrations ranged from 0.20 mg/kg at site SO-1 to 0.30 mg/kg at site SO-2. Se concentrations ranged from 1.6 mg/kg at sites SO-7 and SO-8 to 2.1 mg/kg at site SO-9 (table 10). There were no detections of Ag or Sn at any soil sites in 2021 (Galeone and Zarr, 2023). There were no detections of Ag at the five soil sites from 2016 to 2020. The RDL range for Sn in 2021 was 2.9–3.3 mg/kg (table 1). At the five soil sites, only site SO-1 had a Sn concentration above the RDL between 2016 and 2020, with a 3.8 mg/kg concentration in 2019. Twelve samples for Sn from 2016 to 2020 at the five sites were detected below the RDLs (RDLs ranged from 2.2 to 3.3mg/kg) at concentrations from 0.79 to 2.0 mg/kg.
Analytical results for soils were compared to acceptable limits established by the Commonwealth of Pennsylvania (2023) and the U.S. Environmental Protection Agency (2023a) (table 11). The Commonwealth of Pennsylvania has established medium-specific concentrations (MSCs) that vary depending on the method used in calculating the MSC for soil. The Commonwealth of Pennsylvania calculates MSCs based on health concerns caused by direct contact with the soil. The EPA derives acceptable concentrations of constituents in soil (referred to as soil screening levels [SSLs]) based on standardized equations combining exposure information assumptions with EPA toxicity data. The EPA calculates SSLs for residential and industrial sites (U.S. Environmental Protection Agency, 2023b). The soils at the ARMD site were considered “industrial” for comparative purposes.
Table 11.
Acceptable limits for constituents analyzed in soil samples collected at the Ammonium Perchlorate Rocket Motor Destruction Facility at the Letterkenny Army Depot, Chambersburg, Pennsylvania.[PA MSC, Pennsylvania medium-specific concentrations for soil; EPA SSL, U.S. Environmental Protection Agency soil screening level for industrial soils; mg/kg, milligrams per kilogram; —, not applicable]
Soil test results from 2016 through 2021 showed that only one constituent, As, exceeded acceptable limits for either MSCs or SSLs. All As concentrations in soil samples collected from 2016 through 2021 exceeded the EPA SSL for As of 3 mg/kg (table 10; table 11). However, none of the As concentrations in soil exceeded the Pennsylvania MSC. According to the Commonwealth of Pennsylvania (2023), the surface soil (0– 2 ft) nonresidential MSC for As is 61 mg/kg. The Pennsylvania MSC for As is based on direct human contact, whereas the EPA SSL is based on assumptions made for exposure and toxicity. U.S. Environmental Protection Agency (2023b; sec. 3.2) notes that some SSL values may be less than background concentrations because the SSLs are purely risk based, and that “arsenic, aluminum, iron and manganese are common elements in soils that have background levels that may exceed risk-based SSLs. This does not mean that these metals cannot be site-related, or that these metals should automatically be attributed to background.”
Other inorganic constituents that were detected in 2021 with estimated concentrations below RDLs were F and NO3-NO2. F concentrations ranged from 1.2 mg/kg at site SO-9 to 2.0 mg/kg at site SO-7. NO3-NO2 concentrations ranged from 2.2 mg/kg of N at site SO-8 to 6.5 mg/kg of N at site SO-7. Perchlorate was not detected at any soil site in 2021 with RDLs ranging from 2.0 to 2.4 μg/kg (table 10).
Of the 52 VOCs analyzed in soil samples collected in 2021, there was only one detected. The VOC isomer m-xylene plus p-xylene was detected at site SO-1 at an estimated concentration of 1.1 μg/kg, below the RDL of 4.6 μg/kg (Galeone and Zarr, 2023).
Study Limitations
Data collected in the vicinity of the ARMD site to characterize groundwater, surface water, and soil since 2016 do present some limitations when identifying any impacts of facility operation on environmental conditions. Initially, the baseline period defined as September to December 2016 did not permit any seasonal characterization. The current sampling frequency on an annual basis limits the number of samples collected for all media, and this frequency could inhibit the identification of seasonal constituent variability. Surface-water data are limited in scope because downgradient surface-water sites were sampled only once since 2016. Culverts and sediment retention areas at the facility do not show evidence of immediate surface runoff and sediment transport since 2016.
Summary and Conclusions
Letterkenny Army Depot (LEAD), located near Chambersburg, Pennsylvania, is a Federal Government facility that provides supply and maintenance support to the U.S. Armed Forces. The Ammonium Perchlorate Rocket Motor Destruction (ARMD) Facility, built in 2016, uses confined burning with emissions control to treat solid propellant rocket motors. The ARMD Facility functions include static firing of full motors and containment and capture of the exhaust for treatment in a pollution abatement system. The system was designed to eliminate waste streams to the external environment (Redhorse Corporation, 2016). The Code of Federal Regulations requires any hazardous waste disposal facility establish an environmental monitoring program. Redhorse Corporation (2016), in coordination with the Pennsylvania Department of Environmental Protection (PADEP) and LEAD, drafted an environmental monitoring plan to implement at the ARMD site. A requirement of the environmental monitoring plan was to establish baseline conditions prior to the beginning of facility operation in January 2017, and to conduct annual sampling at and around the facility after the facility opened. The U.S. Geological Survey, in cooperation with LEAD, has collected environmental samples from groundwater, surface water, and soils in accordance with the monitoring plan since 2016.
The sampling sites of the original monitoring plan included 4 groundwater wells, 4 surface-water sites, 9 soil sites, and 2 sediment sampling sites, which were in and immediately downgradient of culverts that receive overland runoff from the facility and surrounding area. The 4 monitoring wells, with depths ranging from 41 to 81 feet (ft), were upgradient (1 well) and downgradient (3 wells) from the facility. The 4 stream sites were upgradient (1 site) and downgradient (3 sites) from the facility. The nine soil sites were within a few hundred yards of the facility buildings. The culverts designated for sediment sampling are at the front of the facility grounds, draining parking areas, access roads, and fields adjacent to the facility buildings. When samples were collected in 2021, there was no water in the downgradient stream locations, so surface-water samples were collected only at the upgradient site. This surface water sample was only representative of the forested environment upgradient from the ARMD Facility. There was also no sediment in the culverts draining the facility grounds, so no sediment was collected during 2021. Water and soil samples were analyzed for nutrients, trace metals, major ions, volatile organic compounds (VOCs), and perchlorate.
Quality assurance and quality control (QA/QC) samples collected during the baseline period associated with water samples indicated some sampling and analytical bias based on the results from blank water samples for VOCs. Two VOCs, acetone and bromomethane, were detected below the reporting detection levels (RDLs) in the equipment blank submitted with groundwater samples. Bromomethane was also detected in an internal method blank (MB) associated with the groundwater samples. Bromomethane, carbon disulfide, and chloromethane were detected below the RDLs in MBs analyzed in association with surface-water samples (ALS Environmental, contracted to the U.S. Geological Survey, unpub. data, 2021). The only VOCs detected in the routine samples (all below the RDLs) collected from both groundwater (acetone and bromomethane) and surface water (bromomethane and carbon disulfide) were also detected in blank water associated with those samples. Percent recoveries of some VOCs (chloroethane, 1,2,3-Trichlorobenzene, and 1,2,4-Trichlorobenzene) for matrix spike (MS) and laboratory control samples (LCS) associated with routine groundwater samples were below the acceptable range (ALS Environmental, contracted to the U.S. Geological Survey, unpub. data, 2021), indicating that results for routine groundwater samples may have underestimated actual concentrations. MS and LCS results associated with surface-water samples for chloride (Cl), fluoride (F), and sulfate (SO4) were highly variable and many results did not meet laboratory criteria (ALS Environmental, contracted to the U.S. Geological Survey, unpub. data, 2021); therefore, results for these constituents are qualified based on QA/QC results. Soil QA/QC results indicated that recovery of 34 of the 40 VOC results for MS samples were below the acceptable range; however, LCS results showed recovery of all soil VOCs was in the acceptable range except for 1,1,2-Trichloro-1,2,2-trifluoroethane. Replicates submitted with water and soil samples showed acceptable precision except for a few constituents.
Groundwater quality results from the four wells sampled near the ARMD Facility in 2021 do not exceed U.S. Environmental Protection Agency (EPA) maximum contaminant levels (MCLs). Dissolved arsenic (As) was detected only in samples from two wells, MW-1 and MW-2, at concentrations of 1.4 micrograms per liter (μg/L; estimated value below the RDL) and 5.4 μg/L, respectively. Well MW-2 had the highest arsenic concentrations for each sampling event from previous years, but all results were below the MCL for As of 10 μg/L (U.S. Environmental Protection Agency, 2018). Dissolved iron (Fe) was the only inorganic constituent measured at greater than a secondary maximum contaminant level (SMCL). All groundwater samples collected in 2021 exceeded the iron SMCL of 300 μg/L with concentrations ranging from 390 μg/L (well MW-3) to 3,500 μg/L (well MW-1). All previous samples collected for wells MW-1, MW-2, and MW-4 also exceeded the SMCL for iron; however, the 2021 result for well MW-3 was the first instance of the iron SMCL exceedance for this well. Perchlorate was not detected in any groundwater samples collected during 2021.
Surface-water data collected in 2021 were strictly representative of the stream reach upgradient (SW-U) from the ARMD Facility. There was no streamflow evident at the time of sample collection on October 6, 2021, at the three downgradient surface-water sites. No EPA established MCLs or SMCLs were exceeded for any constituents in samples collected from site SW-U in 2021. Additionally, there was no detection of total perchlorate (the RDL is 0.2 μg/L) at site SW-U in 2021. Total perchlorate was detected at site SW-U in previous years at estimated values ranging from 0.06 μg/L to 0.09 μg/L.
Soil samples collected near the ARMD Facility on November 10, 2021, showed only one constituent, As, that exceeded EPA soil screening levels (SSLs). No soil medium-specific concentrations (MSCs) established by the Commonwealth of Pennsylvania were exceeded. Arsenic concentrations in soil in 2021, all above the RDLs, ranged from 9.1 mg/kg to 12.9 mg/kg, indicating all samples exceeded the EPA SSL for As of 3 mg/kg; however, EPA acknowledges that “arsenic, aluminum, iron and manganese are common elements in soils that have background levels that may exceed risk-based SLs” (U.S. Environmental Protection Agency, 2023b, sec. 3.2).
The inorganic constituents most commonly detected in soil samples were iron (Fe) and aluminum (Al), with Fe and Al concentrations ranging from 39,200 mg/kg to 47,400 mg/kg and 19,500 mg/kg to 24,600 mg/kg, respectively. Perchlorate was not detected at any soil site in 2021. The only VOC detected was m-xylene plus p-xylene at site SO-1 at a concentration of 1.1 micrograms per kilogram (μg/kg), which was below the RDL of 4.6 μg/kg.
The groundwater, surface water, and soil results for 2021 were generally consistent with samples collected prior to (2016) and concurrent (2017–2021) with the ARMD Facility’s operation. The ARMD Facility is a contained burn treatment facility for demilitarization of rocket motors, the byproduct of which is a non-hazardous solid waste, with no planned releases to surface water, groundwater, soils, stormwater runoff, or runoff sediment.
Acknowledgments
The authors thank Nickolas Grim, U.S. Geological Survey, for assisting with figure development for this report.
References Cited
ArcGIS, 2024, USGSTopo (MapServer): U.S. Geological Survey, accessed April 8, 2024, at https://basemap.nationalmap.gov/arcgis/rest/services/USGSImageryTopo/MapServer.
Berg, T.M., Edmunds, W.E., Geyer, A.R., Glover, A.D., Hoskins, D.M., MacLachlan, D.B., Root, S.I., Sevon, W.D., and Socolow, A.A., comps., 1980, Geologic map of Pennsylvania (2d ed.): Pennsylvania Geological Survey, 4th ser., Map 1, scale 1:250,000, 3 sheets https://www.gis.dcnr.state.pa.us/pageode/.
Commonwealth of Pennsylvania, 2023, Administration of land recycling program, chap. 250 of Environmental protection: The Pennsylvania Code, title 25, accessed August 31, 2023, at https://www.pacodeandbulletin.gov/Display/pacode?file=/secure/pacode/data/025/chapter250/chap250toc.html&d=reduce.
EQUIPCO, 2016, Introduction to En Core Soil Samplers: EQUIPCO Sales & Service Corporation, accessed June 6, 2016, at https://www.equipcoservices.com/support/tutorials/introduction-to-encore-soil-samplers/.
Francy, D.S., Jones, A.L., Myers, D.N., Rowe, G.L., Eberle, M., and Sarver, K.M., 1998, Quality-assurance/quality-control manual for collection and analysis of water-quality data in the Ohio District: U.S. Geological Survey, U.S. Geological Survey Water-Resources Investigations Report 98-4057, 71 p. [Also available at https://doi.org/10.3133/wri984057.]
Franson, M.A.H, ed., 1992a, Acidity—Titration method, in Standard methods for the examination of water and wastewater (18th ed.): American Public Health Association, prepared by American Public Health Association, American Water Works Association, and Water Environment Federation, Washington, D.C., p. 2-23–2-25.
Galeone, D.G., 2019a, Baseline environmental monitoring of groundwater, surface water, and soil at the Ammonium Perchlorate Rocket Motor Destruction Facility at the Letterkenny Army Depot, Chambersburg, Pennsylvania, 2016: U.S. Geological Survey Open-File Report 2019–1094, 32 p., accessed February 3, 2021 at https://doi.org/10.3133/ofr20191094.
Galeone, D.G., 2019b, Quality Control and Soil Quality Data in support of Baseline Environmental Monitoring at the Ammonium Perchlorate Rocket Motor Destruction (ARMD) Facility at the Letterkenny Army Depot, Chambersburg, Pennsylvania, 2016: U.S. Geological Survey data release, accessed August 20, 2019 at https://doi.org/10.5066/P973YRPL.
Galeone, D.G., and Zarr, L.F., 2023, Groundwater, surface water, and soil data collected near and at the Ammonium Perchlorate Rocket Motor Destruction (ARMD) facility at the Letterkenny Army Depot, Chambersburg, Pennsylvania: U.S. Geological Survey data release, https://doi.org/10.5066/P92YIATZ.
Hach Company/Hach Lange GmbH, 2021, 2100Q and 2100Qis User Manual, 08/2021, Edition 6, Loveland, CO, 30 p. accessed March 20, 2024 at https://cdn.brandfolder.io/7FYZVWYB/as/q347xzpg7kj3sh6bjmw4jcm/2100Q_and_2100Qis_User_Manual_DOC0225380041.pdf.
Hem, J.D., 1985, Study and interpretation of the chemical characteristics of natural waters, U.S. Geological Survey Water-Supply Paper 2254, 3rd ed., 263 p. [Also available at https://doi.org/10.3133/wsp2254.]
O’Dell, J.W., ed., 1993, Method 365.1: Determination of phosphorus by semi-automated colorimetry, Revision 2.0: Cincinnati, Ohio, Environmental Monitoring Systems Laboratory, Office of Research and Development, U.S. Environmental Protection Agency, accessed December 13, 2017, at https://www.epa.gov/sites/production/files/2015-08/documents/method_365-1_1993.pdf.
Pennsylvania State Climatologist, 2018, Divisional climate data: Penn State website, accessed July 10, 2018, at http://www.climate.psu.edu/data/state/regional.php#division. [Moved to https://climate.met.psu.edu/data/state/regional.php.]
Pfaff, J.D., 1993, Method 300.0—Determination of inorganic ions by ion chromatography, (revision 2.1, August 1993): Cincinnati, Ohio, Environmental Monitoring Systems Laboratory, Office of Research and Development, U.S. Environmental Protection Agency, accessed December 13, 2017, at https://www.epa.gov/sites/production/files/2015-08/documents/method_300-0_rev_2-1_1993.pdf.
Sevon, W.D., comp., 2000, Physiographic provinces of Pennsylvania (4th ed., 2023): Pennsylvania Geological Survey Map 13, 4th ser., 1 map sheet, scale 1:2,000,000, accessed May 1, 2024, at elibrary.dcnr.pa.gov/GetDocument?docId=1752507&DocName=Map13_PhysProvs_Pa.pdf.
Soil Science Division Staff, 2017, Soil Survey Manual (amended February 2018): U.S. Department of Agriculture Handbook No. 18, 603 p. [Also available at https://www.nrcs.usda.gov/sites/default/files/2022-09/The-Soil-Survey-Manual.pdf.]
Turnipseed, D.P., and Sauer, V.B., 2010, Discharge measurements at gaging stations: U.S. Geological Survey Techniques and Methods book 3, chap. A8, 87 p., available at https://pubs.usgs.gov/tm/tm3-a8/.
U.S. Department of Agriculture, 2018, Web Soil Survey: U.S. Department of Agriculture map viewer, accessed July 11, 2018, at https://websoilsurvey.nrcs.usda.gov/app/WebSoilSurvey.aspx.
U.S. Environmental Protection Agency, 1994, Method 7470A—Mercury in liquid wastes (manual cold-vapor technique) (revision 1, September 1994), in Test Methods for Evaluating Solid Waste—Physical/Chemical Methods Compendium: U.S. Environmental Protection Agency SW-846, p.7470A-1–7470A-6, accessed December 12, 2017, at https://www.epa.gov/homeland-security-research/epa-method-7470a-sw-846-mercury-liquid-wastes-manual-cold-vapor-technique.
U.S. Environmental Protection Agency, 1996a, Method 8260B—Volatile organic compounds by gas chromatography/mass spectrometry (GC/MS) (revision 2, December 1996), in Test Methods for Evaluating Solid Waste—Physical/Chemical Methods Compendium: U.S. Environmental Protection Agency SW-846, p. 8260B-1–8260B-86, accessed December 12, 2017, at https://archive.epa.gov/epa/hw-sw846/sw-846-test-method-8260b-volatile-organic-compounds-gas-chromatographymass-spectrometry.html.
U.S. Environmental Protection Agency, 1996b, Method 6010B—Inductively coupled plasma-atomic emission spectrometry (revision 2, December 1996), in Test Methods for Evaluating Solid Waste—Physical/Chemical Methods Compendium: U.S. Environmental Protection Agency SW-846, p. 6010B-1–6010B-25, accessed December 4, 2023 at https://www.epa.gov/sites/default/files/documents/6010b.pdf.
U.S. Environmental Protection Agency, 1998a, Method 6020A—Inductively coupled plasma-mass spectrometry (revision 1, January 1998), in Test Methods for Evaluating Solid Waste—Physical/Chemical Methods Compendium: U.S. Environmental Protection Agency SW-846, p. 6020A-1–6020A-23, accessed December 12, 2017, at https://archive.epa.gov/epawaste/hazard/testmethods/web/pdf/method%206020a%2c%20revision%201%20-%202007.pdf. [Now available at https://19january2017snapshot.epa.gov/sites/production/files/2015-07/documents/epa-6020a.pdf.].
U.S. Environmental Protection Agency, 1998b, Method 7471B—Mercury in solid or semisolid waste (manual cold-vapor technique) (revision 2, January 1998), in Test Methods for Evaluating Solid Waste—Physical/Chemical Methods Compendium: U.S. Environmental Protection Agency SW-846, p. 7471B-1–7471-8, accessed December 13, 2017, at https://www.epa.gov/homeland-security-research/epa-method-7471b-sw-846-mercury-solid-or-semisolid-wastes-manual-cold. [Now available at https://19january2017snapshot.epa.gov/sites/production/files/2015-07/documents/epa-7471b.pdf.]
U.S. Environmental Protection Agency, 2007a, Validated Test Method 6850—Perchlorate in water, soils and solid wastes using High Performance Liquid Chromatography/Electrospray Ionization/Mass Spectrometry (HPLC/ESI/MS or HPLC/ESI/MS/MS): U.S. Environmental Protection Agency, accessed December 12, 2017, at https://www.epa.gov/hw-sw846/validated-test-method-6850-perchlorate-water-soils-and-solid-wastes-using-high-performance.
U.S. Environmental Protection Agency, 2007b, Method 6010C—Inductively coupled plasma-atomic emission spectrometry (revision 3, February 2007), in Test Methods for Evaluating Solid Waste—Physical/Chemical Methods Compendium: U.S. Environmental Protection Agency SW-846, p. 6010C-1–6010C-34, accessed December 12, 2017, at https://archive.epa.gov/epawaste/hazard/testmethods/web/pdf/method%206010c%2c%20revision%203%20-%202007.pdf.
U.S. Environmental Protection Agency, 2018, 2018 Edition of the Drinking Water Standards and Health Advisories: U.S. Environmental Protection Agency Office of Water, EPA 822-F-18-001, 12 p., accessed October 26, 2023 at https://www.epa.gov/system/files/documents/2022-01/dwtable2018.pdf
U.S. Environmental Protection Agency, 2023a, Regional Screening Level (RSL) Composite Worker Soil Table (TR=1E-06, HQ=1) May 2023: U.S. Environmental Protection Agency, accessed September 1, 2023, at https://semspub.epa.gov/work/HQ/404065.pdf.
U.S. Environmental Protection Agency, 2023b, Regional Screening Level (RSLs) user’s guide - May 2023: U.S. Environmental Protection Agency, accessed September 1, 2023, at https://www.epa.gov/risk/regional-screening-levels-rsls-users-guide.
U.S. Environmental Protection Agency, 2024, Secondary Drinking Water Standards: Guidance for Nuisance Chemicals, accessed March 21, 2024, at https://www.epa.gov/sdwa/secondary-drinking-water-standards-guidance-nuisance-chemicals.
U.S. Geological Survey, 2017, USGS National Hydrography Dataset (NHD) Best Resolution for Hydrologic Unit (HU) 0207 (published 20170702), accessed April 8, 2024 at https://www.usgs.gov/national-hydrography/access-national-hydrography-products.
U.S. Geological Survey, [undated], USGS water data for the Nation: U.S. Geological Survey National Water Information System database, accessed November 30, 2022, at https://doi.org/10.5066/F7P55KJN.
U.S. Geological Survey, [variously dated], National field manual for the collection of water-quality data, section A of Handbooks for water-resources investigations: U.S. Geological Survey Techniques of Water-Resources Investigations, book 9, chap. A1–A9, accessed August 1, 2016 at https://pubs.water.usgs.gov/twri9A/.
Conversion Factors
U.S. customary units to International System of Units
Temperature in degrees Celsius (°C) may be converted to degrees Fahrenheit (°F) as follows:
°F = (1.8 × °C) + 32.
Datum
Vertical coordinate information is referenced to the North American Vertical Datum of 1988 (NAVD 88).
Elevation, as used in this report, refers to distance above the vertical datum.
Supplemental Information
Specific conductance is given in microsiemens per centimeter at 25 degrees Celsius (µS/cm at 25 °C).
Concentrations of chemical constituents in water are given in either milligrams per liter (mg/L) or micrograms per liter (µg/L). Concentrations of chemical constituents in soil are given in either milligrams per kilogram (mg/kg) or micrograms per kilogram (μg/kg).
Definitions
Abbreviations
ARMD
Ammonium Perchlorate Rocket Motor Destruction
CFR
Code of Federal Regulations
DO
dissolved oxygen
EPA
U.S. Environmental Protection Agency
LCS
laboratory control sample
LCSD
laboratory control sample duplicate
LEAD
Letterkenny Army Depot
MB
method blank
MCL
maximum contaminant level
MSC
medium-specific concentrations
MS
matrix-spike
MSD
matrix-spike duplicate
NTU
nephelometric turbidity unit
ORP
oxidation reduction potential
PADEP
Pennsylvania Department of Environmental Protection
QA/QC
quality assurance and quality control
RDL
reporting detection level
RPD
relative percent difference
SC
specific conductance
SMCL
secondary maximum contaminant level
SSL
soil screening level
USGS
U.S. Geological Survey
VOC
volatile organic compound
WT
Water temperature
For more information, contact,
Director, Pennsylvania Water Science Center
215 Limekiln Road
New Cumberland, PA 17070
Or go to our website at https://www.usgs.gov/centers/pennsylvania-water-science-center.
Publishing support provided by the Baltimore Publishing Service Center
Disclaimers
Any use of trade, firm, or product names is for descriptive purposes only and does not imply endorsement by the U.S. Government.
Although this information product, for the most part, is in the public domain, it also may contain copyrighted materials as noted in the text. Permission to reproduce copyrighted items must be secured from the copyright owner.
Suggested Citation
Galeone, D.G., and Donmoyer, S.J., 2024, Environmental monitoring of groundwater, surface water, and soil at the Ammonium Perchlorate Rocket Motor Destruction Facility at the Letterkenny Army Depot, Chambersburg, Pennsylvania, 2021: U.S. Geological Survey Open-File Report 2024–1031, 31 p., https://doi.org/10.3133/ofr20241031
ISSN: 2331-1258 (online)
Study Area
| Publication type | Report |
|---|---|
| Publication Subtype | USGS Numbered Series |
| Title | Environmental monitoring of groundwater, surface water, and soil at the Ammonium Perchlorate Rocket Motor Destruction Facility at the Letterkenny Army Depot, Chambersburg, Pennsylvania, 2021 |
| Series title | Open-File Report |
| Series number | 2024-1031 |
| DOI | 10.3133/ofr20241031 |
| Publication Date | June 11, 2024 |
| Year Published | 2024 |
| Language | English |
| Publisher | U.S. Geological Survey |
| Publisher location | Reston, VA |
| Contributing office(s) | Pennsylvania Water Science Center |
| Description | Report: vii, 31 p.; Data Release |
| Country | United States |
| State | Pennsylvania |
| Other Geospatial | Letterkenny Army Depot |
| Online Only (Y/N) | Y |
| Additional Online Files (Y/N) | N |